Article

An Exploratory Study on the Growth Dynamics of Alkalihalophilus marmarensis Using a Model-Based Approach

1
Department of Bioengineering, Faculty of Engineering, Adana Alparslan Türkeş Science and Technology University, Adana 01250, Türkiye
2
Department of Bioengineering, Faculty of Engineering, Marmara University, İstanbul 34722, Türkiye
3
Acies Bio d.o.o., Tehnološki Park 21, 1000 Ljubljana, Slovenia
*
Authors to whom correspondence should be addressed.
Appl. Microbiol. 2025, 5(3), 69; https://doi.org/10.3390/applmicrobiol5030069
Submission received: 16 June 2025 / Revised: 11 July 2025 / Accepted: 14 July 2025 / Published: 17 July 2025

Abstract

Alkalihalophilus marmarensis is an obligate alkaliphile with exceptional tolerance to high-pH environments, making it a promising candidate for industrial bioprocesses that require contamination-resistant and extremophilic production platforms. However, its practical deployment is hindered by limited biomass formation under extreme conditions, which constrains overall productivity. This study presents a model-driven investigation of how pH (8.8 and 10.5), culture duration (24 and 48 h), and nitrogen source composition (peptone and meat extract) affect cell dry mass, lactate, and protease synthesis. Using the response surface methodology and multi-objective optimization, we established predictive models (R2 up to 0.92) and uncovered key trade-offs in biomass and metabolite yields. Our findings reveal that peptone concentration critically shapes the metabolic output, with low levels inhibiting growth and high levels suppressing protease activity. Maximum cell dry mass (4.5 g/L), lactate (19.3 g/L), and protease activity (43.5 U/mL) were achieved under distinct conditions, highlighting the potential for targeted process tuning. While the model validation confirmed predictions for lactate, deviations in cell dry mass and protease outputs underscore the complexity of growth–product interdependencies under nutrient-limited regimes. This work delivers a foundational framework for developing fermentations with A. marmarensis and advancing its application in sustainable, high-pH industrial bioprocesses. The insights gained here can be further leveraged through synthetic biology and bioprocess engineering to fully exploit the metabolic potential of obligate alkaliphiles like A. marmarensis.

1. Introduction

Extremophiles are organisms that thrive under harsh conditions such as extreme temperatures, pH levels, pressure, or salinity. Studying these organisms provides valuable insights into the basic requirements for life and how it can adapt to hostile environments [1,2]. Among them, alkaliphiles thrive in environments with pH levels above 8.5, using specialized adaptations to survive where most organisms cannot. These environments include soda lakes, alkaline soils, and certain deep-sea habitats [3].
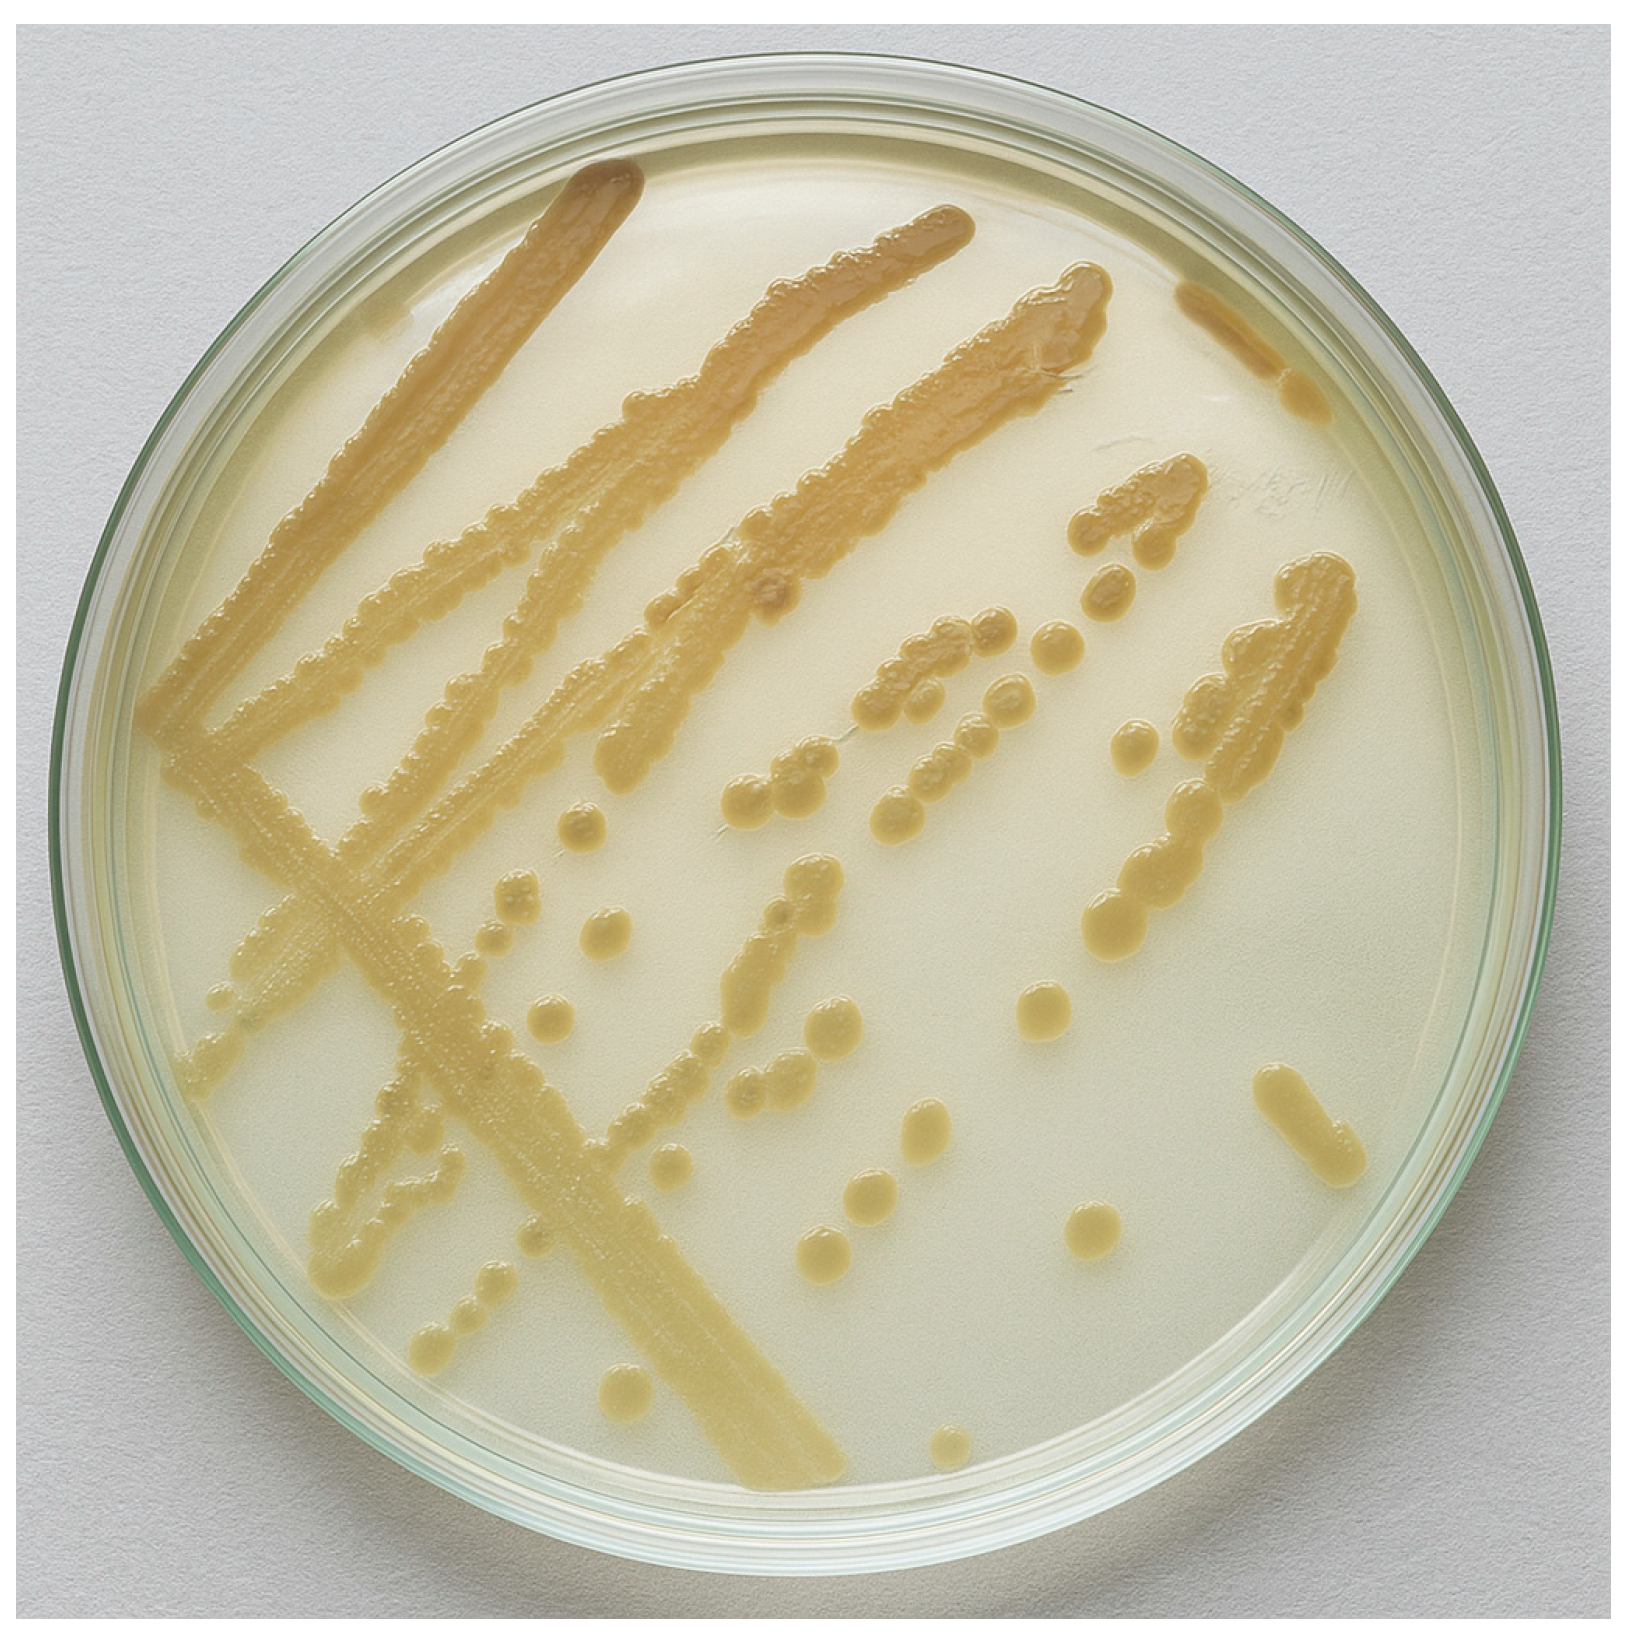
Alkalihalophilus marmarensis is an obligate alkaliphilic bacterium, originally isolated from mushroom compost collected in the Marmara region of Türkiye [4]. This motile, straight-rod-shaped bacterium (0.8 − 1.1 × 2.0 − 2.5 µm) forms yellow-colored, circular, whole and convex colonies (Figure A1) [4]. Known for its remarkable adaptation to extreme alkaline environments (pH 8.0–12.5), it surpasses the tolerance range of many typical alkaliphiles. A key component of its adaptation mechanism is a potassium uptake system, particularly the KtrB K+ transporter, which consists of 433 amino acids—significantly larger than its homolog in Alkalihalophilus pseudofirmus (formerly Bacillus pseudofirmus) [5]. Although initially classified under the Bacillus genus, phylogenetic analyses revealed its distinct lineage, leading to the establishment of a new genus, Alkalihalophilus [6]. Consequently, Bacillus marmarensis is now recognized as Alkalihalophilus marmarensis.
The ability of A. marmarensis to thrive under extreme alkaline conditions enhances its resistance to contamination, making it a promising candidate for bioprocessing and biorefining applications. This resilience allows cultivation in non-sterile environments such as seawater or wastewater, significantly reducing production costs and sterility requirements in industrial settings. Its industrial potential is supported by the production of valuable enzymes such as hydrolases and proteases, as well as its metabolic capacity for n–butanol synthesis [7]. Notably, its alkaline protease exhibits high thermal stability, making it suitable for detergent formulations [8], and has also been applied in the valorization of shrimp waste and simultaneous enzyme production [9]. Additionally, recent studies have demonstrated the ability of engineered A. marmarensis strains to produce bioethanol in high-pH media using various carbon sources, including glucose and xylose, even in algal-contaminated wastewater [7]. Its capacity to grow and produce metabolites in such extreme environments positions it as an attractive host for contamination-resistant, low-cost biorefineries [10].
In terms of metabolic output, A. marmarensis produces lactate as a major fermentative product. Wernick et al. [5] reported that increasing sugar concentrations, adjusting pH, and eliminating peptone from the medium significantly enhanced lactate yields without negatively affecting biomass accumulation. Our studies on carbon and nitrogen source effects further support this, showing that A. marmarensis exhibits a low cell dry mass (CDM), with nitrogen sources such as peptone and meat extract exerting a greater influence than carbon source type or concentration [11]. These results suggest that carbon can be effectively redirected toward the synthesis of high-value metabolites like lactate, rather than biomass accumulation [5].
Alkaliphilic microorganisms have been investigated for their potential applications in biotechnology [10,12,13,14,15]. The recent literature also highlights the emerging potential of Alkalihalophilus species in the production of biodegradable bioplastics such as polyhydroxybutyrate (PHB), which can also be synthesized by A. marmarensis under alkaline conditions [9]. Several studies have explored the optimization of yields for such compounds through metabolic and process engineering [7,9,16,17,18,19]. However, to our knowledge, no prior work has directly investigated the relationship between biomass production and key fermentation products such as protease and lactate in obligate alkaliphiles like A. marmarensis. Understanding this interplay is essential for maximizing product yields while minimizing resource input.
This dynamic balance is particularly important in guiding how metabolic fluxes can be directed toward either growth or product formation, depending on industrial needs. Such insight supports the development of precision fermentation strategies and enables the deployment of A. marmarensis as a robust microbial chassis for enzyme production, bioplastic synthesis, or biofuel generation under harsh process conditions. Its natural extremotolerance, low nutrient requirements, and amenability to genetic engineering collectively make A. marmarensis a promising platform for sustainable and economically viable biomanufacturing at industrial scale.
The response surface methodology (RSM), originally introduced by Box and Wilson [20], is a well-established statistical technique for modeling and optimizing complex processes involving multiple variables. It enables efficient exploration of experimental space with a minimal number of trials, making it particularly valuable in bioprocess development. The RSM has been extensively applied in microbial fermentation, enzyme production, and metabolic optimization, where precise control of culture conditions is critical for performance [21,22]. In parallel, multi-objective optimization approaches, such as those based on Pareto fronts, are increasingly used to evaluate trade-offs between competing goals—such as maximizing biomass while optimizing product yield [23]. Together, the RSM and multi-objective optimization provide a robust framework for improving system performance, understanding process behavior, and identifying cost-effective operating conditions [23,24,25,26,27,28].
This study investigates the trade-off between biomass formation and the production of value-added metabolites, specifically lactate and protease, in A. marmarensis, an obligate alkaliphile with significant industrial potential. Despite its resilience under extreme pH conditions, the organism exhibits limited biomass accumulation, which hinders its practical application in high-pH biotechnological processes. The goal of this study was to elucidate the relationship between growth and metabolite production in A. marmarensis under varying environmental conditions. To achieve this goal, we pursued the following objectives: (1) to evaluate the effects of nitrogen source composition (peptone and meat extract), culture pH, and incubation time on biomass, lactate, and protease production, (2) to model the system using the response surface methodology and main effects plots, and (3) to apply multi-objective optimization to identify conditions that selectively enhance either biomass accumulation or metabolite synthesis.

2. Materials and Methods

The process workflow followed in this work is illustrated in Figure 1. Here, cultivation initiated the process, which then involved centrifugation to separate biomass from the culture medium. Subsequently, cell dry mass (CDM) was measured to assess biomass accumulation, protease activity was quantified spectrophotometrically to evaluate enzyme production, and lactate concentration was determined via HPLC to monitor fermentative metabolite synthesis. These given sets of experimental data were input into a modeling stage where models were developed to establish the relationships between cultivation conditions and biological responses. The model was then tested to assess its validity, reliability, and predictability. Following model generation, a set of optimized solutions was selected and validated experimentally. This approach enabled the model to accurately represent the biological system while providing guidance for subsequent experimental design and process optimization.

2.1. Bacterial Growth Conditions and Media Preparations

The A. marmarensis DSM 21297 strain used in this study is stored and maintained in the laboratories of the Department of Bioengineering at Marmara University, Türkiye. The preculture was prepared as described by Atakav et al. [9]. For the assessment of the effect of meat extract and peptone concentrations, each medium containing 10 g/L glucose, 10 g/L NaCl, 0.4 g/L MgSO4·7H2O, and 0.42 g/L KH2PO4 was supplemented with varying meat extract and peptone concentrations. After sterilization at 121 °C for 15 min, all media were inoculated with 1% of the preculture to an OD600nm of 0.7, and incubated in an orbital shaker at 180 rpm and 37 °C.
Samples were collected at 24 and 48 h of incubation under two pH conditions: 8.8 and 10.5. Bacterial growth was monitored by measuring OD600nm, and cell dry mass (CDM) was calculated as described by Özgören [16]. From each culture, 20 mL was centrifuged at 8000× g for 10 min, and the supernatant was collected for analysis. All experiments were performed in triplicate.

2.2. Protease Activity Assay

For alkaline protease activity determination, 0.5 mL of the enzyme-containing supernatant was mixed with 2 mL of 0.6% weight per volume (w/v) casein solution prepared in 50 mM NaOH–glycine buffer (pH 10.5) [29]. The mixture was incubated at 30 °C for 20 min, then 2.5 mL of trichloroacetic acid (TCA) solution was added to stop the reaction. A blank was prepared with TCA followed by enzyme solution addition. After centrifugation at 13,000 rpm for 15 min, the absorbance at 280 nm was measured against the blank. Alkaline protease activity was calculated using the formula given below (1) by using tyrosine as the standard. Here, a unit of alkaline protease activity (U) is defined as the amount of enzyme required to produce 1 µg of tyrosine per minute at pH 10.5 and 30 °C. An activity assay was performed with duplicate measurement for each sample.
A c t i v i t y ( U m L ) = O D 280 S l o p e   o f   c a l i b r a t i o n   c u r v e × D i l u t i o n   F a c t o r V o l u m e   o f   E n z y m e   S o l u t i o n   ( m L ) × R e a c t i o n   T i m e   ( m i n )

2.3. Lactate Detection and Quantification via HPLC

Lactate concentration was determined using HPLC following the method described by Kishore et al. [30] with slight modifications. An Agilent 1100 system equipped with a C18 (250 × 4.6 mm i.d., 5 μm) Zorbax column and a UV detector set at 210 nm was used. The mobile phase was phosphate buffer (10 mM, pH 3.0). The column temperature was set at 35 °C, with a flow rate of 1 mL/min and an injection volume of 50 μL. Prior to analysis, samples were filtered through 0.22 μm sterile filters. Concentrations were determined using a calibration curve generated from known standards.

2.4. Statistical Modeling and Optimization Framework

A model-based experimental framework based on the response surface methodology (RSM) was implemented to characterize the effects of nitrogen source composition on cell dry mass, lactate, and protease production. Experimental conditions were selected using a statistically structured design of experiments (DoE). Collected response data were fitted using low-order polynomial models. Subsequently, a multi-objective optimization strategy was applied to identify trade-offs and optimal operating conditions by evaluating the Pareto front across multiple response variables.

2.4.1. Design of Experiments

For the statistical design of experiments, two independent variables were the initial concentrations of meat extract and peptone in the growth medium. The response variables of interests were CDM, protease activity, and lactate concentration. A central composite design for two independent variables was generated using Matlab’s ccdesign function (MATLAB & Simulink R2022b). Slight manual adjustments were made to the points to allow for experimental practicality. Only one center point was taken. The resulting experimental design comprised 12 data points. Maximum limit values were selected as 3% (w/v) for meat extract and 5% (w/v) for peptone, while the minimum limit value for both of the parameters was chosen to be 0.1% (w/v).

2.4.2. Modeling

In the response surface methodology, the data collected from a statistically designed set of experiments are usually modeled using low-order polynomials. In this study, we used three commonly applied low-order polynomial models to analyze the data. Each response variable was modeled using linear, quadratic, and pure quadratic models as a function of the two independent variables, for all combinations of pH values (8.8 and 10.5) and time points (24 and 48 h) considered. A total of 36 models were generated. The generic linear (2), quadratic (3), and pure quadratic (4) equations for these models are given below. The regression tasks were performed by Matlab’s fitlm function [31] in the Statistics and Machine Learning toolbox. R2 values for the models were used to compare their performance and select the most appropriate ones for each response variable under the relevant conditions.
y = X1 + X2 + c
y = X1 + X2 + X1X2 + (X1)2 + (X2)2 + c
y = X1 + X2 + (X1)2+(X2)2 + c
Additionally, main effects plots were generated for each dataset using Matlab’s maineffectsplot function, which is also part of the Statistics and Machine Learning toolbox. These plots visualize the relationship between independent and response variables and help identify which independent variable has the most substantial effect on the response. Each independent variable was plotted along the x-axis, and the average response from all experiments for each value of the independent variable was plotted along the y-axis as the “Mean”.

2.4.3. Investigation of Growth and Product Yields Through Optimization

The models with the highest R2 values were selected for the determination of the conditions that yield the best outcomes for each response variable. First, each response variable was optimized individually using Matlab’s constrained non-linear multivariate optimization function fmincon from the Optimization Toolbox. The constraints used were the minimum and maximum values of the independent variables, as reported in Section 2.4.1. Subsequently, multi-objective Pareto optimization was performed using MATLAB’s Global Optimization Toolbox with the Gamultiobj function, which is a genetic algorithm-based multi-objective optimizer [32]. In Pareto optimization, a Pareto front is generated to show the trade-off between potentially conflicting objectives. First, double combinations of the three responses (CDM–lactate concentration, CDM–protease activity, and lactate concentration–protease activity) were optimized to assess possible trade-offs between each set of objectives. Then, a three-objective Pareto optimization was performed to optimize all responses simultaneously.

2.4.4. Validation of Model Outputs

The accuracy of the model predictions was tested by conducting a series of validation experiments. First, validations for the optimal concentrations predicted by the simulation models for CDM, lactate concentration, and protease activity were carried out individually. Then, one solution from the Pareto front of the double response combinations was tested. Lastly, two solutions were chosen from the three-objective Pareto optimization solutions.

2.4.5. Statistical Analyses

Statistical analysis was performed using IBM® SPSS® Statistics (version 31.0.0.0). Results were analyzed using analysis of variance (ANOVA) to evaluate how the independent variables—media components (meat extract and peptone), incubation time, and pH—in combination affect the dependent variables: cell dry mass, lactate concentration, and protease activity. A one-sample t-test was used to compare the means between the prediction and validation datasets to determine whether a statistically significant difference existed in the response variables (biomass, protease activity, and lactate concentration). A 95% confidence level was applied for all tests.

3. Results and Discussion

We observed that supplementation with meat extract and peptone resulted in a higher cell dry mass (CDM) compared to single nitrogen sources. To this end, we investigated the effect of different concentrations of meat extract and peptone in the presence of glucose to determine the conditions achieving maximum CDM, which is essential for optimizing fermentation performance. We also investigated the effect of meat extract and peptone on lactate synthesis to better understand its relationship with biomass formation. Lactate is a key metabolic end-product of fermentative pathways and serves as an important indicator of carbon flux distribution under stress or anaerobic conditions. Beyond its physiological relevance, lactate has significant industrial applications. It is widely used as a precursor for biodegradable plastics [33].
In addition, protease synthesis was examined alongside lactate and CDM, given the critical role of proteases in microbial physiology. Moreover, microbial alkaline proteases such as those from Bacillus species have widespread industrial applications due to their stability and activity under high-pH conditions. They dominate the global enzyme market (~60%) and are extensively used in detergents, leather processing, food production, and pharmaceutical industries [34,35].
Although the alkaline protease produced by A. marmarensis has been well characterized [8], its relationship with CDM and lactate production has not previously been explored. The present study therefore aimed to link nitrogen availability to biomass formation and metabolite/enzyme synthesis, providing insights into how nutrient conditions shape metabolic outputs in extremophilic organisms.

3.1. Effect of Nitrogen Source on Growth

The nitrogen source has a critical role in the synthesis of biomass, proteins, nucleotides, and secondary metabolites necessary for microbial growth and metabolism [36]. Our previous studies have shown that the biomass of A. marmarensis is significantly influenced by the nitrogen source in the media, in comparison to carbon sources [11,16]. Since the amount of biomass obtained in the presence of meat extract and peptone was higher compared to that obtained with sole nitrogen sources such as yeast extract and beef extract, here we evaluated the simultaneous effect of meat extract and peptone at pH levels of 8.8 and 10.5 over 24 and 48 h of incubation.
As shown in Table 1, the highest CDM of 4.5 g/L was obtained at 48 h at 1.2% meat extract and 3.80% peptone, whereas the highest CDM of 4.1 g/L was found for pH 10.5 at 48 h in several conditions. Decreasing the peptone concentration to 0.1% resulted in a significant decrease in CDM. While both peptone and meat extract serve as nitrogen sources for the cell, meat extract did not exhibit similar behavior. At the lowest (0.1%) and the highest (3.0%) meat extract concentration, when peptone concentration was kept constant at 2.55%, the CDMs were close to each other for all conditions. Thus, it is prominent from these results that the concentration of peptone affects the cell growth more than the meat extract.
Data were analyzed using two-way analysis of variance (ANOVA) at a 95% confidence level to assess the individual and interactive effects of media composition (meat extract and peptone), incubation time, and pH on the dependent variables: cell dry mass, lactate concentration, and protease activity. Detailed statistical outcomes are provided in Table A1. The analysis confirmed that CDM was significantly affected by media composition (F = 26.39, p < 0.05), incubation time (F = 14.78, p < 0.05), and pH (F = 10.62, p < 0.05) (Table A1). Among these, media composition had the greatest influence on biomass accumulation, underscoring the dominant role of peptone concentration in supporting cell growth.
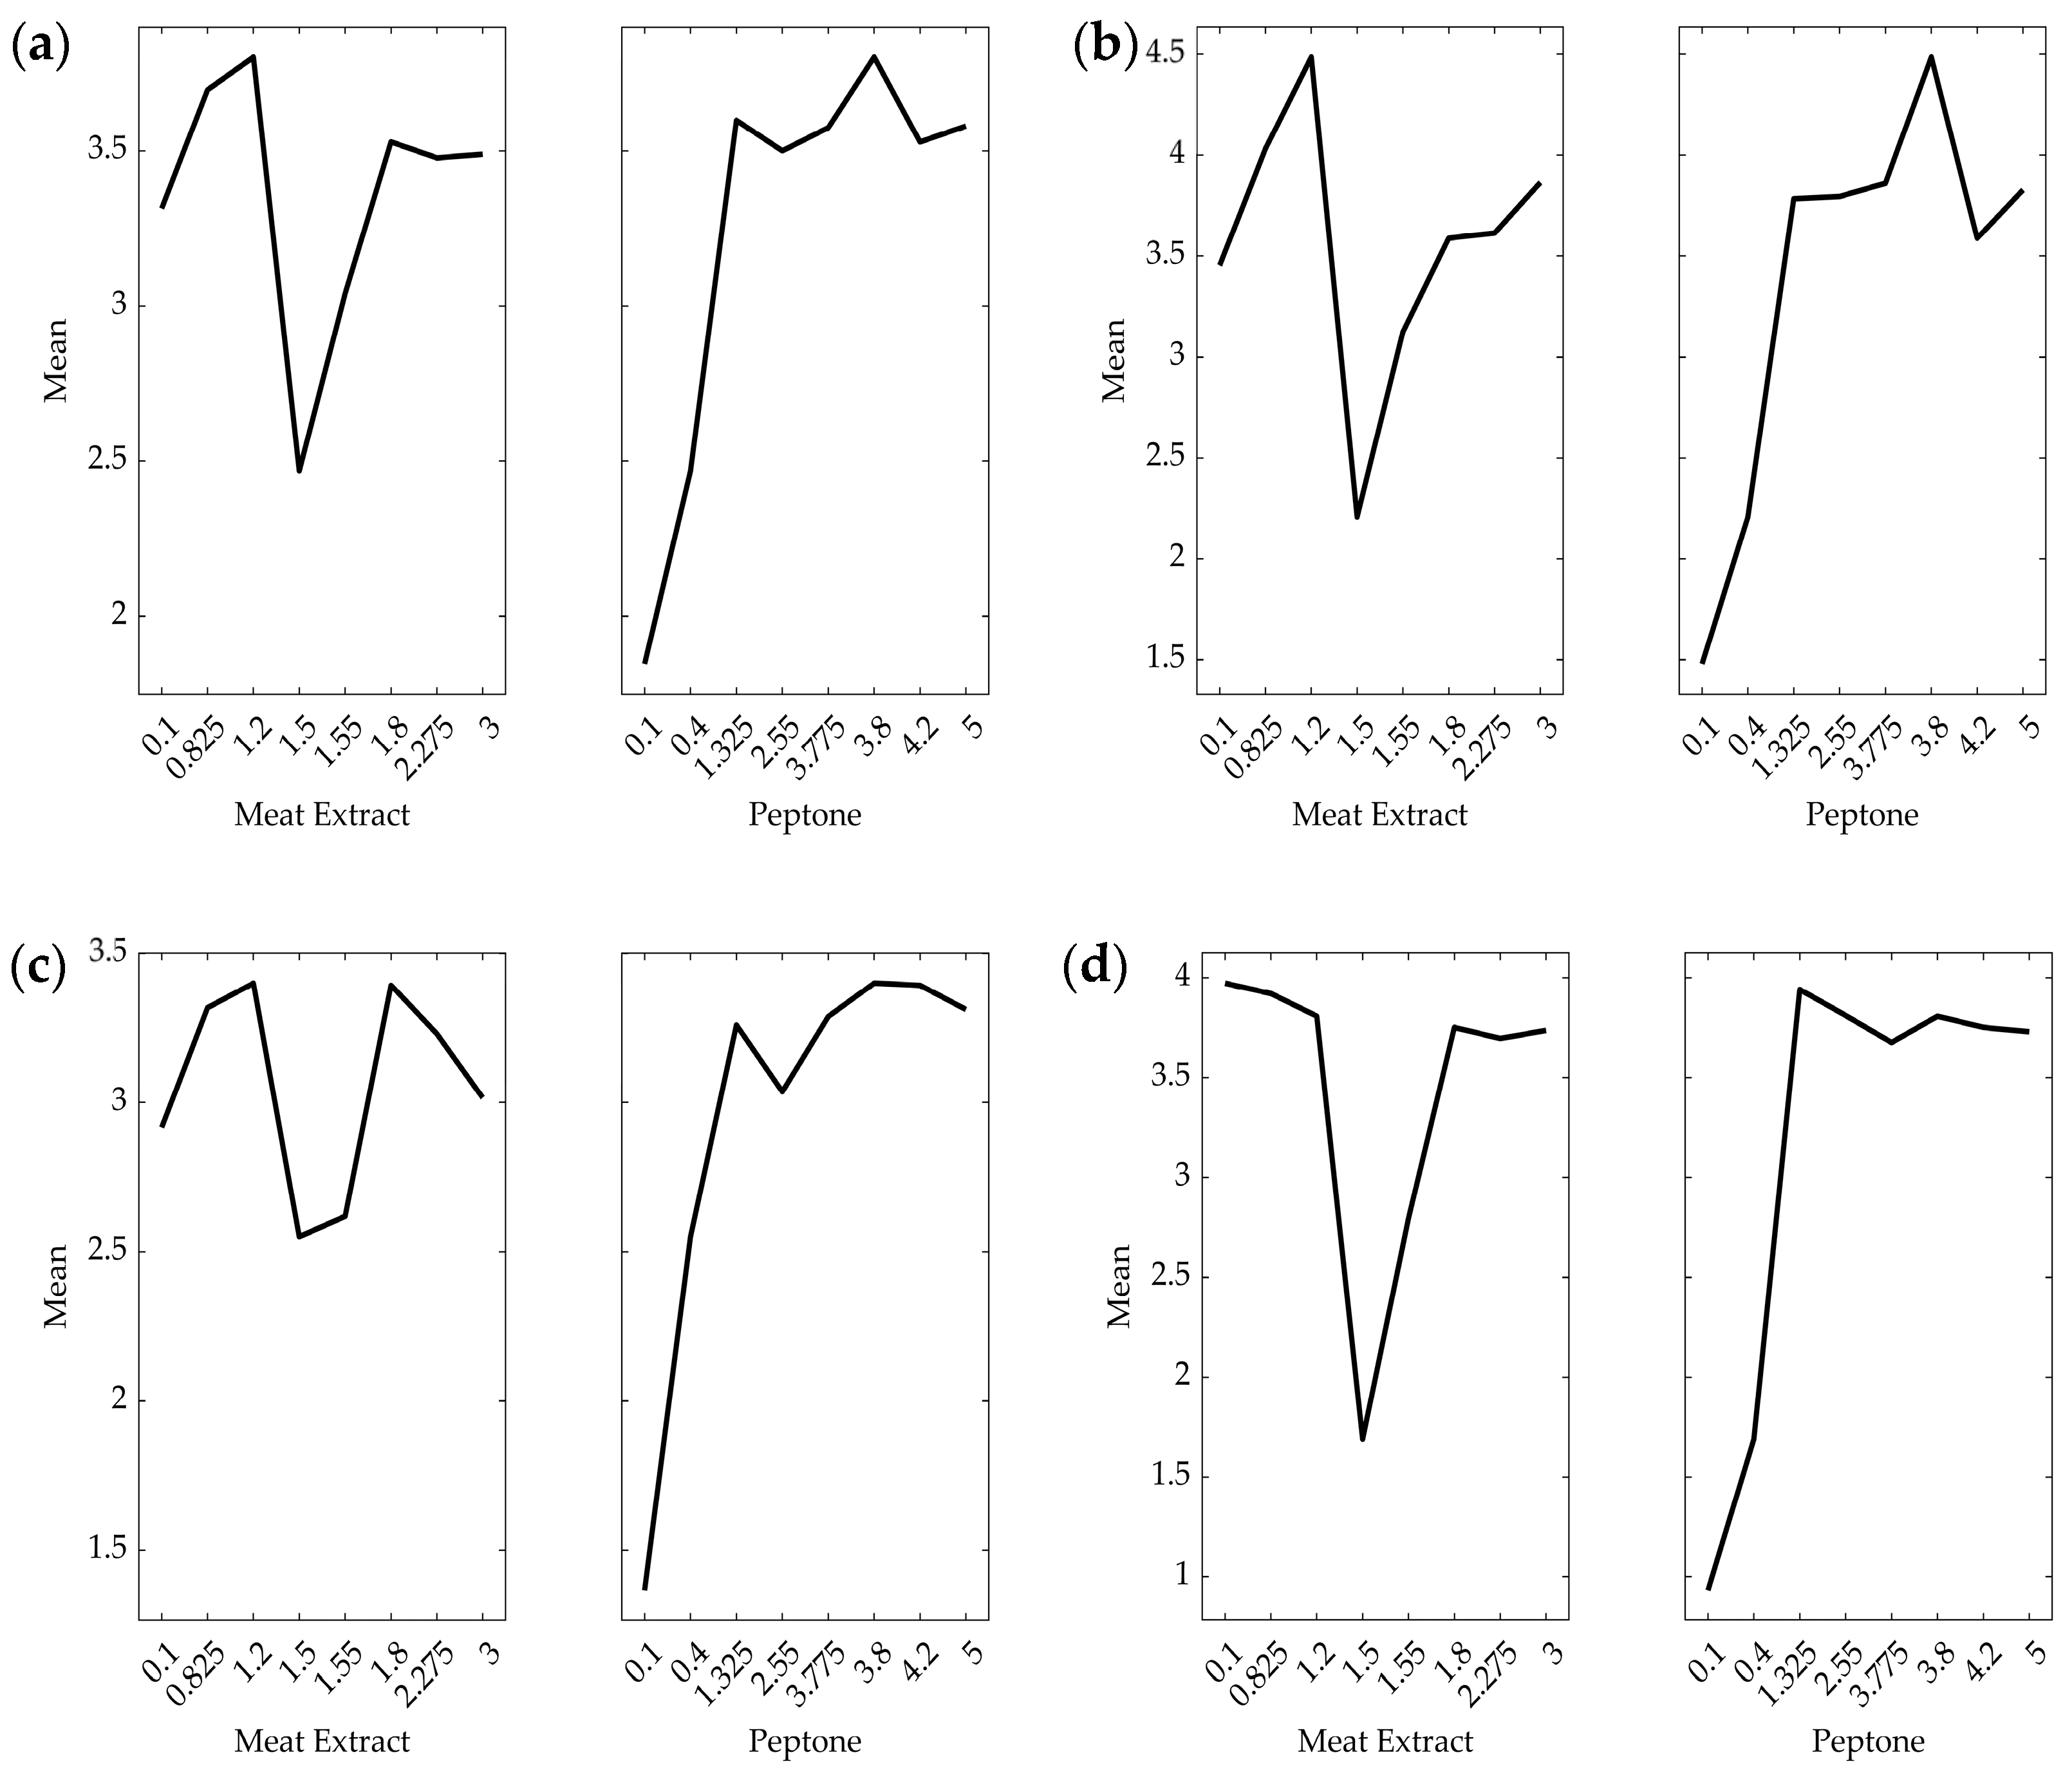
To have a better understanding of the simultaneous effects of meat extract and peptone on cell growth, main effect plots (Figure 2) were constructed between the mean CDM and the concentrations of these two components. Figure 2 indicates that cell growth exhibited a similar trend at 24 and 48 h at pH 8.8. Higher mean values were observed at 48 h for both pH conditions, with pH 8.8 consistently yielding greater growth compared to pH 10.5.
For both meat extract and peptone, there was a sharp decrease in the mean value for the condition with 1.55% meat extract and 0.1% peptone due to the low concentration of peptone in the environment. As seen in Figure 2, increasing the meat extract concentration resulted in an overall decrease in mean values. Meanwhile, the main effects plots for peptone showed that increasing the peptone concentration up to 3.80% at pH 8.8 (24 and 48 h) and pH 10.5 (24 h) and 1.325% at pH 10.5 (48 h) increased the mean values. Interestingly, more fluctuations were observed in the mean values at pH 8.8 compared to pH 10.5. The growth of A. marmarensis appears to be more sensitive to changes in nitrogen source composition at lower pH levels. In contrast, the reduced fluctuations in growth observed at higher pH levels might stem from the cell prioritizing environmental modification over growth. For alkaliphiles, extreme pH conditions can also lead to reduced cellular biomass. This is likely because cells require external protons for ATP synthesis, and the significantly low proton concentration in alkaline environments, compared to the nearly neutral cytoplasmic pH, makes these processes energetically unfavorable [5]. Consistent with previous studies [16], A. marmarensis has been observed to lower the pH of its environment under high-pH conditions.
The primary goal of this study was to investigate how nitrogen source composition, pH, and incubation time influence the relationship between biomass growth and the production of lactate and protease in A. marmarensis. Our findings suggest a complex interplay between these factors, where conditions that favor a high CDM often do not support maximum production of the desired fermentation products [37,38].

3.2. Effect of Nitrogen Source on Lactate Production

Investigation of the fermentative capacity of A. marmarensis revealed that the bacterium can synthesize lactate, along with other organic acids such as succinic acid and acetic acid, under extreme pH conditions [5]. The study revealed that increasing the strength of the buffer, elevating sugar concentrations, adjusting the pH, and eliminating peptone from the production media resulted in even higher yields of fermentative products [5]. Although peptone negatively affected the lactate synthesis [5], it increased the amount of biomass. These results prompted us to investigate the simultaneous effect of different concentrations of peptone and meat extract on lactate synthesis.
As seen in Table 2, the composition of the nitrogen sources affected the lactate synthesis, and its effect varied depending on the incubation duration and pH. The lowest lactate concentration of 3.5 ± 0.6 g/L was obtained at 1.55% meat extract and 0.1% peptone concentrations at 24 h and pH 10.5. The maximum lactate concentration of 19.3 ± 0.3 g/L was obtained at 2.275% meat extract and 1.325% peptone concentrations at 48 h and pH 10.5.
Two-way ANOVA showed that lactate production was significantly affected by media composition (F = 45.45, p < 0.05), incubation time (F = 28.17, p < 0.05), and pH (F = 66.26, p < 0.05) (Table A1). Media composition had the strongest influence, indicating that peptone and meat extract levels play a key role in directing carbon flux toward fermentative metabolism under alkaline conditions. The substantial effect of pH also suggests that metabolic regulation in A. marmarensis is highly sensitive to environmental pH during lactate synthesis. However, to better understand the overall trends and cellular response to individual variables, main effects plots were constructed, as shown in Figure 3.
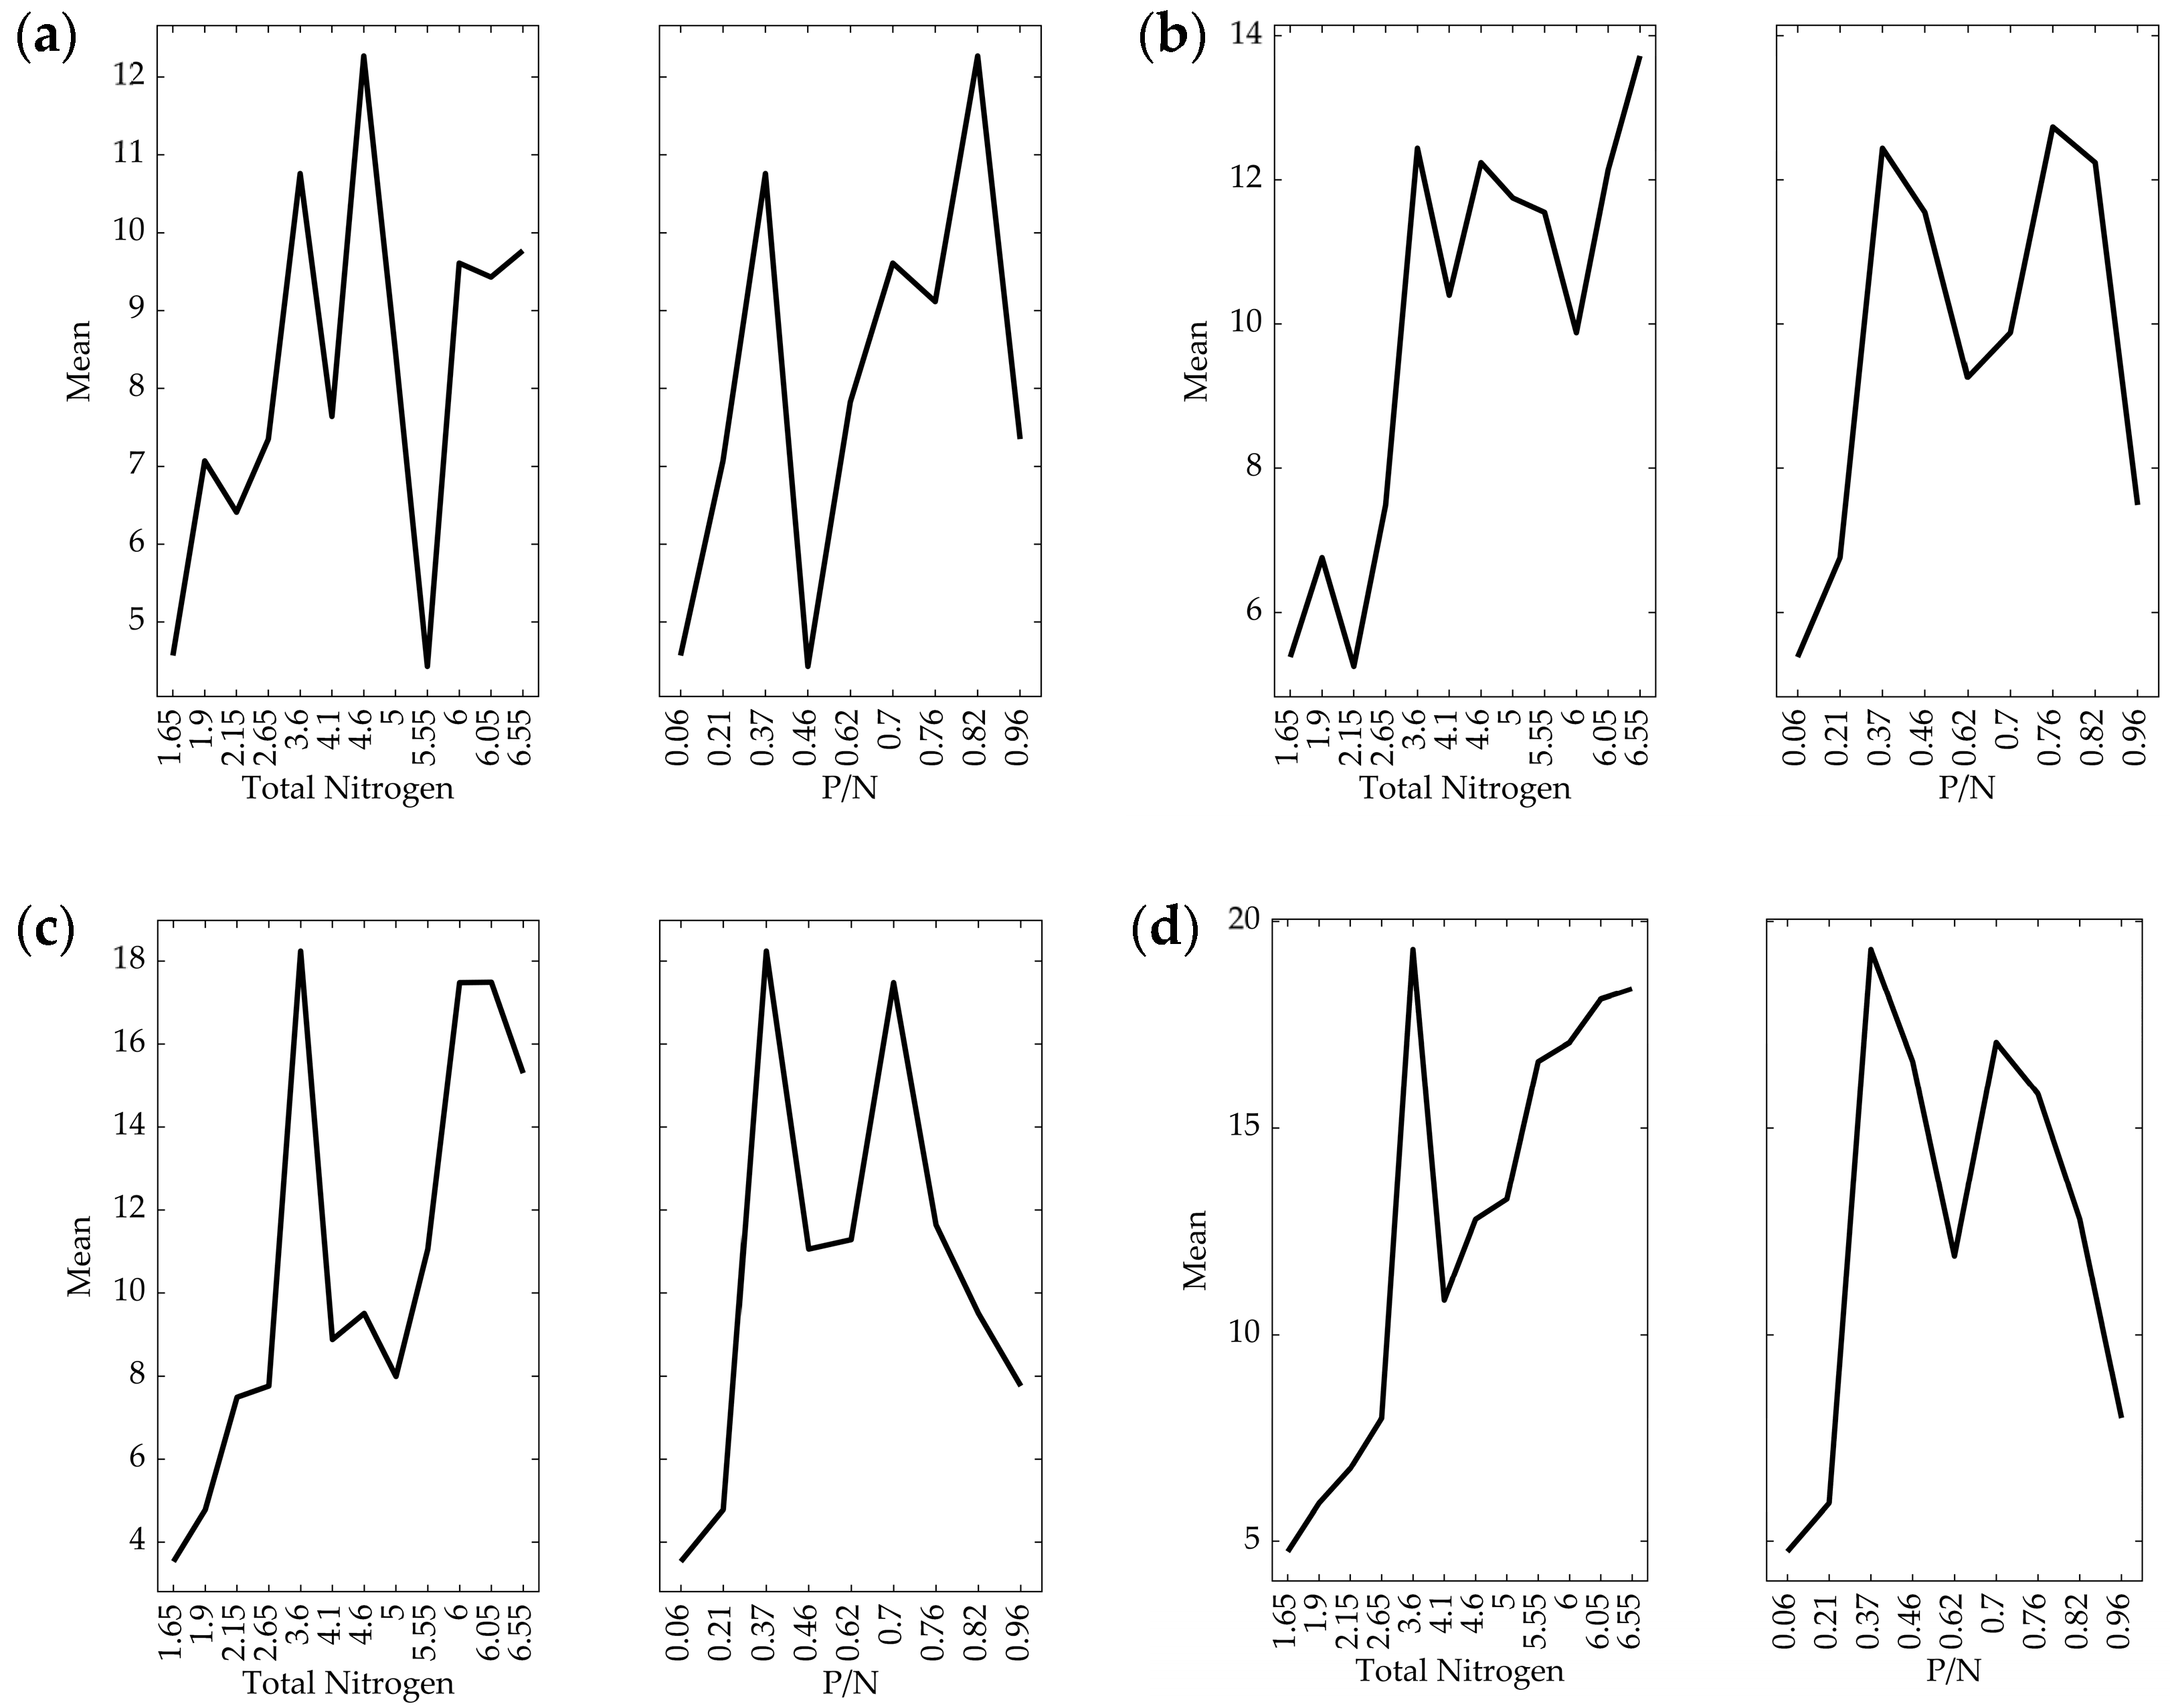
Due to variability in lactate concentrations across conditions, it was difficult to directly assess the influence of nitrogen sources on lactate production. To clarify these effects, we analyzed main effect plots based on total nitrogen (N) content and the peptone-to-total nitrogen (P/N) ratio (Figure 4). At pH 10.5 and longer incubation times, lactate production appeared more stable. Moreover, a higher total nitrogen content generally promoted lactate synthesis, while a higher P/N ratio tended to suppress it. This suggests that excess peptone relative to meat extract can suppress lactate production, and that peptone has a stronger influence than meat extract. Moderate lactate levels were still observed at low meat extract concentrations, while 3% meat extract led to a significant reduction.
In addition to examining the impact of nitrogen sources on CDM and lactate synthesis, we also investigated their effect on protease synthesis. Proteases are crucial for the utilization of nitrogen sources by bacteria, as they break down proteins into their constituent amino acids. The availability of amino acids is vital for bacterial growth and survival, as they serve as the building blocks for protein synthesis and various other essential cellular processes [39].
Peptone was identified as the dominant nitrogen source influencing both growth and metabolite synthesis. Its effect on CDM was pronounced, with increasing concentrations leading to higher biomass accumulation. Liu et al. [40] found that, among various nitrogen sources, peptone had the strongest positive effect on the growth of a halophilic Bacillus amyloliquefaciens, supporting the role of complex nitrogen in promoting biomass accumulation.
However, this increase in CDM was accompanied by a marked decrease in protease activity and lactate levels, particularly at higher peptone concentrations. This inverse relationship may be attributed to nitrogen catabolite repression, a regulatory mechanism in which readily assimilable nitrogen sources suppress secondary metabolite biosynthesis [41]. In A. marmarensis, this could reflect a shift in metabolic prioritization: under nutrient-rich conditions, resources are diverted toward biomass generation rather than enzyme or metabolite production.
Meat extract, while contributing less significantly to CDM, appeared to modulate metabolite output in specific conditions. Notably, 3% meat extract strongly inhibited lactate production, possibly due to the accumulation of inhibitory byproducts or an imbalance in the carbon-to-nitrogen ratio. Similar findings have been reported in another lactic acid-producing Lactobacillus system, where deviations from the optimal C/N ratio negatively impacted lactate biosynthesis due to disrupted redox balance and metabolic flux distribution [42]. These results further support the idea that nitrogen source composition—not just total nitrogen content—critically shapes the metabolic behavior of A. marmarensis.
The effect of pH was also substantial. At pH 10.5, lactate production showed reduced variability over time, suggesting that cells may reach a more stable metabolic state under moderately alkaline conditions. This is consistent with the known pH homeostasis and adaptive regulation mechanisms in alkaliphilic bacteria, which often maintain internal stability and enzymatic efficiency at high external pH [43,44]. Such stabilization, likely due to the activation of ion antiporters and optimized enzyme function, supports more consistent fermentative metabolism once initial stress responses subside.
Similar stabilization of metabolic output at high pH has been observed in other alkaliphilic systems, such as Bacillus halodurans and Bacillus pseudofirmus, both of which maintain efficient metabolite production under strongly alkaline conditions [45,46]. This metabolic steadiness at an alkaline pH could therefore be advantageous for process control in bioreactors operating under similar conditions, particularly at the industrial scale where high-pH environments can reduce contamination risks, improve enzyme stability, and enhance product recovery [47].

3.3. Effect of Nitrogen Source on Protease Activity

Extracellular protease production in microorganisms is significantly influenced by various media components, particularly carbon and nitrogen sources, as well as metal ions. Additionally, several physical factors, including pH, temperature, inoculum density, dissolved oxygen, and incubation time, play a crucial role [48]. Here, the effect of nitrogen sources on protease activity mentioned above was evaluated in the same conditions. The results of the protease activity assay, presented in Table 3, show that the type and concentration of the nitrogen source significantly influenced protease activity. The highest protease activity of 43.6 ± 1.6 U/mL was obtained at pH 10.5 at 48 h when 1.5% meat extract was used along with 0.4% peptone.
Protease activity was significantly influenced by media composition (F = 224.57, p < 0.05) and incubation time (F = 106.36, p < 0.05), whereas pH had no significant effect (F = 1.96, p > 0.05) (Table A1). The strong effect of media composition, particularly peptone concentration, indicates that nitrogen catabolite repression likely plays a role in regulating enzyme production. The significant time-dependent increase suggests that protease expression is favored during later stages of growth.
In order to investigate the mean effects of each component on protease activity, mean effect plots were constructed as shown in Figure 5 for each condition. The highest mean values for the meat extract were obtained at 1.5%, and further increases negatively affected protease activity under all conditions. A loss of activity was observed at 1.2% meat extract. This change in behavior can be attributed to the high peptone concentration in the environment (3.8%). Interestingly, an abundance of peptone inhibited activity, as the highest protease activity was achieved at 0.4% peptone. However, as the peptone concentration increased, the activity gradually declined or was completely lost. The detrimental impact of a high yeast extract concentration has been attributed to growth-independent repression of protease production [49]. Other studies have also indicated that organic nitrogen sources, as well as excessive amino acids and ammonium ions, can play repressive roles in alkaline protease production [50,51].
Figure 5 illustrates that increasing the pH had no significant effect on protease production, as the production profiles at both pH levels are almost identical. However, the maximum mean values were slightly higher at pH 10.5. The optimum pH range of protease production among alkaliphilic and haloalkaliphilic organisms often falls between 9 and 10 [52,53,54].
The increase in enzyme activity with longer incubation times is also evident in the main effect plots for both pH 8.8 and 10.5. This rise in activity is likely due to the first 24 h being primarily dedicated to carbon source consumption for energy production and cell growth. With extended incubation, the generated energy is redirected toward substrate breakdown, contributing to increased enzyme activity rather than further cell growth. Since Alkalihalophilus is a newly identified genus with only three known members, we compared our results with those obtained for microorganisms closely related to A. marmarensis, as reported in previous studies [4,6,55]. The observed results aligned with data reported for protease produced by Shouchella clausii (formerly Bacillus clausii) [49], which reported higher enzyme activity with extended incubation periods. Prolonged incubation resulted in higher enzyme activity, especially when the peptone concentration was higher than the meat extract concentration when each condition was investigated individually. Similar results reported by Abdel-Fattah et al. [52] indicated higher enzyme activity by A. pseudofirmus, the closest relative of A. marmarensis, with prolonged incubation time and increased peptone concentrations at pH 9. Contrary to our results, the highest activity in previous studies was obtained at 2% peptone, whereas, in this study, it was observed at 0.4%. This difference might be attributed to the concentration of total nitrogen source in the media, as the highest activity was obtained at 1.90% total nitrogen source (1.5% meat extract; 0.4% peptone) which is close to the previous report.
The incubation period significantly affects enzyme production, and duration can vary widely from 24 h to a week, depending on the type of microorganism and culture conditions. Halalkalibacterium halodurans (formerly Bacillus halodurans) showed maximum alkaline protease production within 48 h of incubation, while the activity dropped significantly after 72 h [45]. Similarly, maximum protease activity for S. clausii was observed at 48 h when the culture media were altered. In another study, A. pseudofirmus MN6 exhibited maximum activity at 60 h [52]. Different microorganisms have distinct metabolic rates and environmental requirements, which influence the optimal incubation time needed to achieve maximum enzyme production. Adjusting the incubation period to meet the specific needs of the microorganism and the cultivation conditions is crucial for optimizing enzyme yields [56].
In summary, lower peptone concentrations led to enhanced production of protease and lactate, despite reduced CDM. This suggests that, under nutrient-limited conditions, A. marmarensis reallocates carbon flux toward secondary metabolic pathways, such as proteolysis and fermentation. The implications of this trade-off are significant: in industrial settings where product yield is prioritized over biomass, carefully limiting peptone input may enhance process efficiency.

3.4. Modeling of Growth and Metabolite Production

The previous sections demonstrated how variations in nitrogen content, culture duration, and medium pH influenced the CDM, protease activity, and lactate synthesis. In this section, the most appropriate model for simulating the relationship between CDM, protease activity, and lactate synthesis was identified. All the data obtained were used to construct models for CDM, lactate, and protease production with A. marmarensis. A variety of modeling functions was employed and the corresponding coefficient of determination (R2) values for CDM, lactate concentration, and protease activity are presented as Table A2 in the Appendix A.
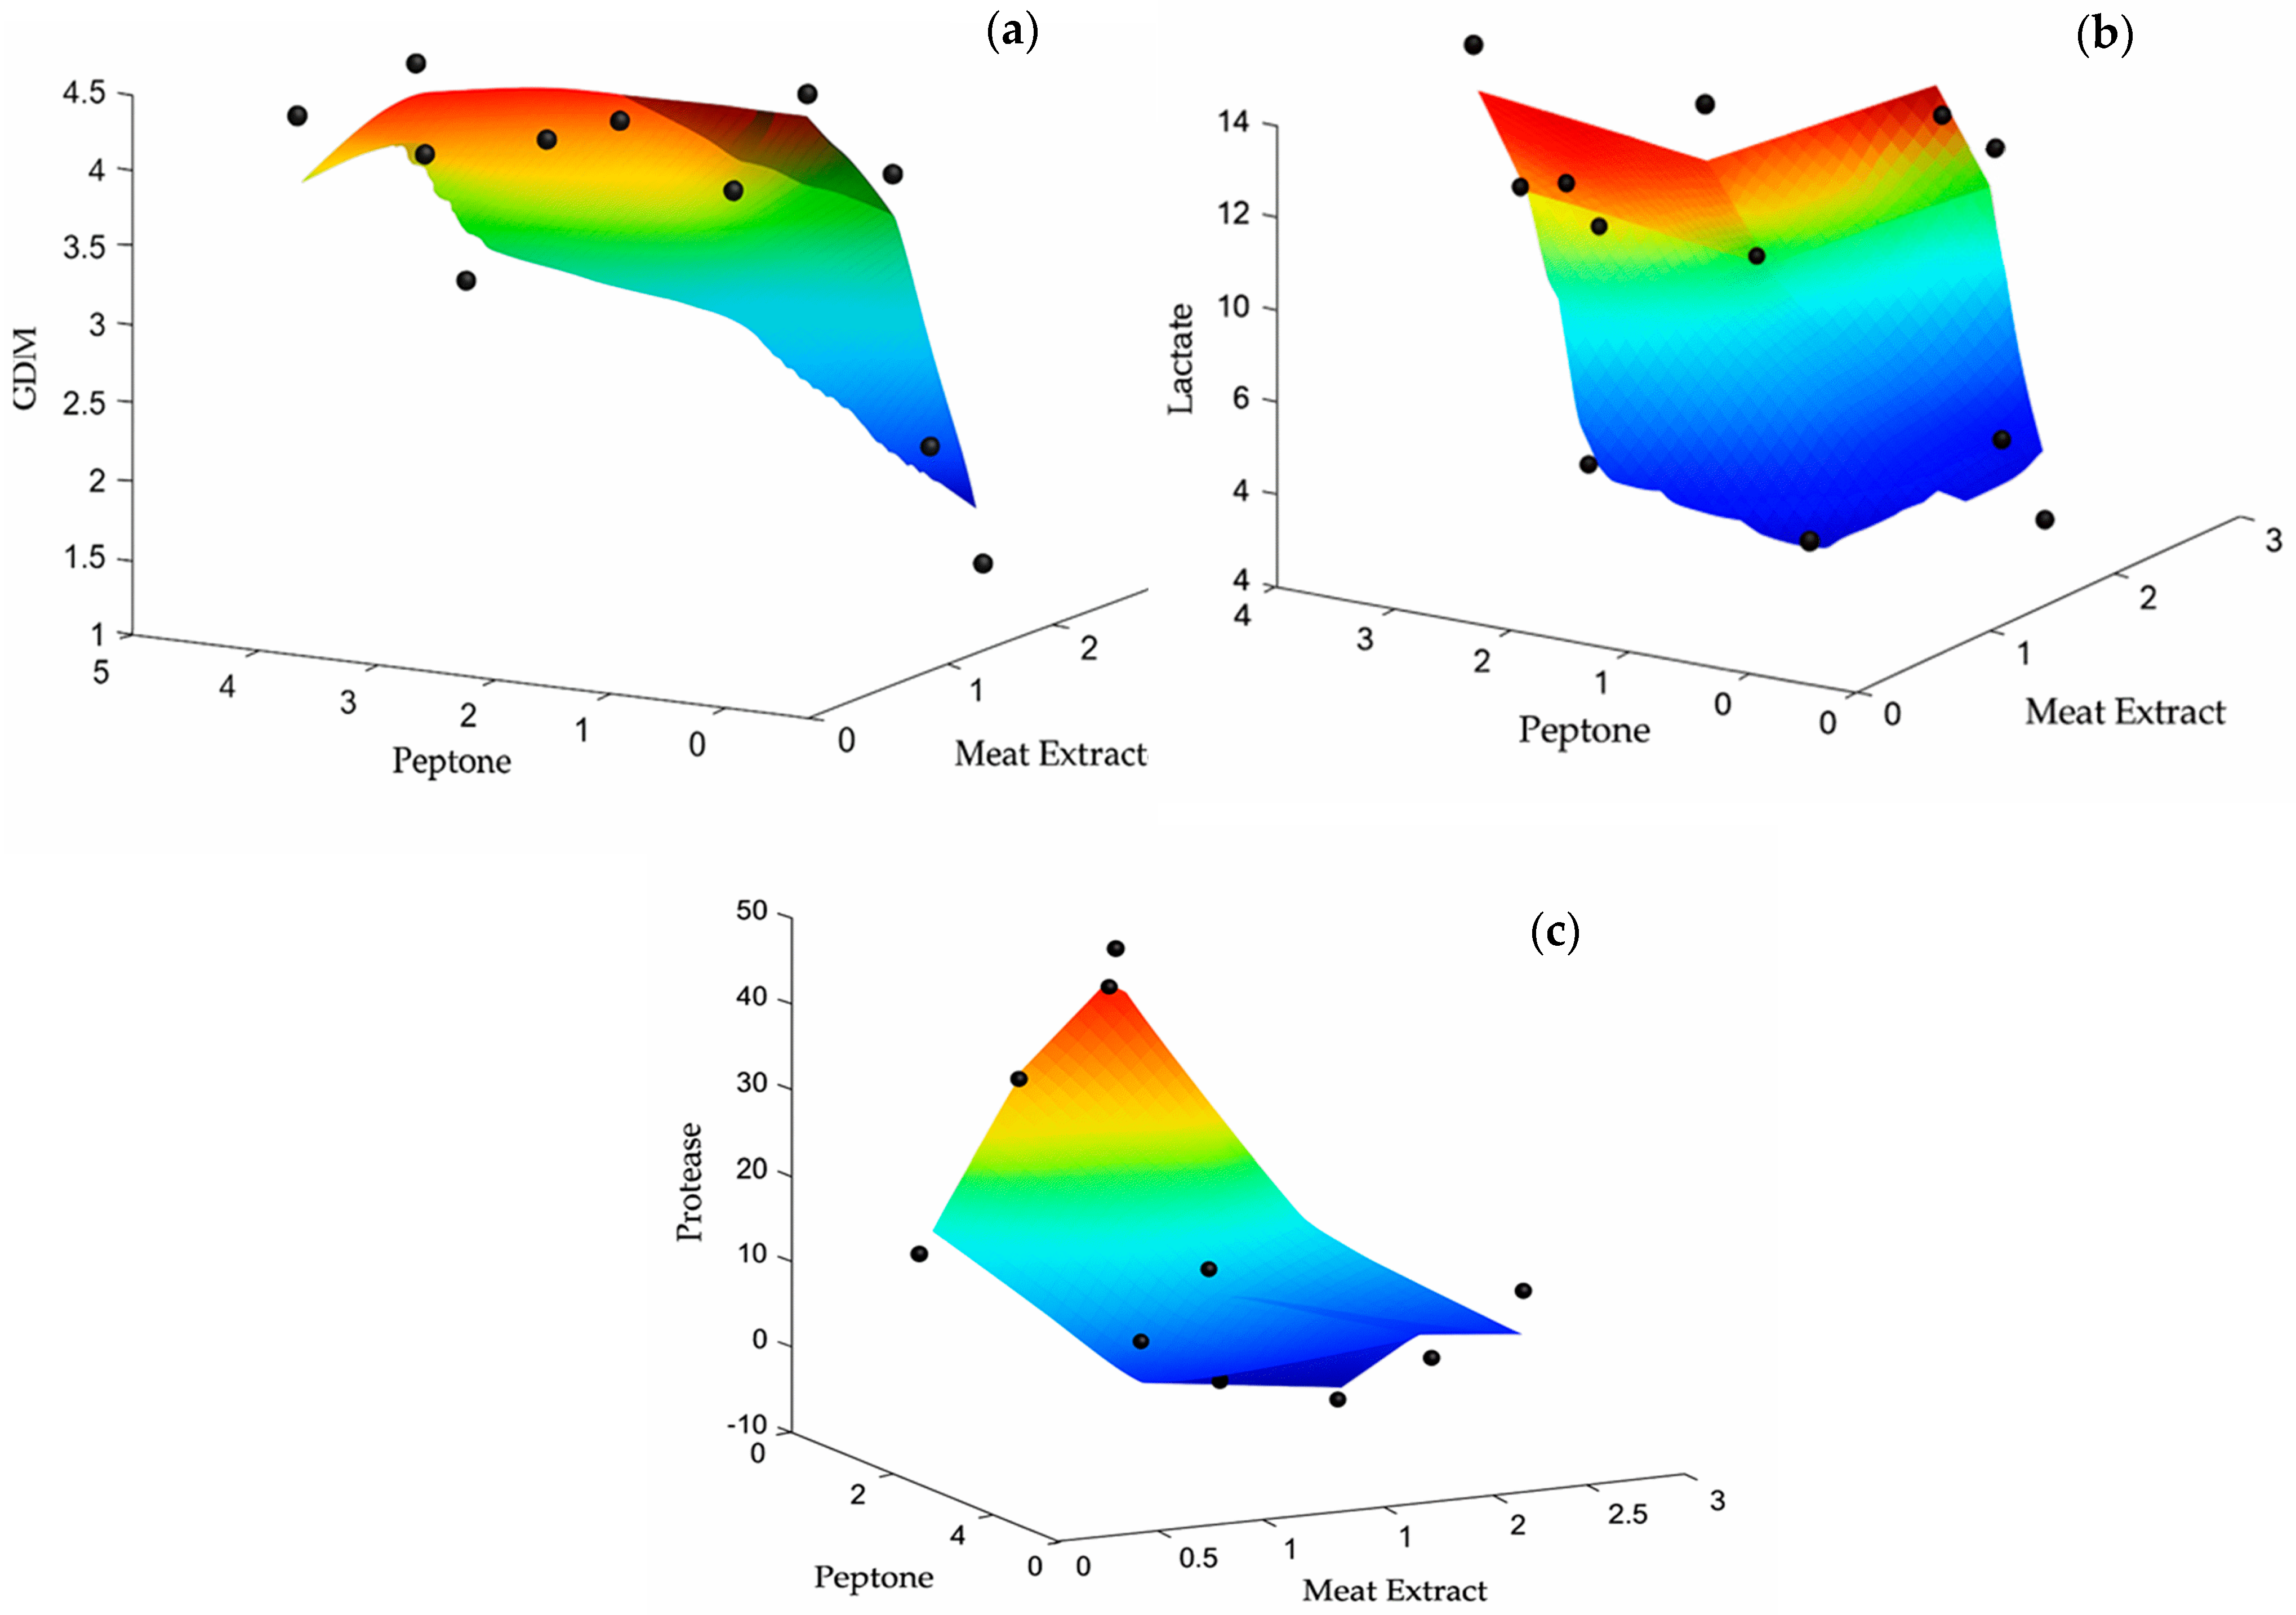
The larger the R2 is, the more variability is explained by the model of interest. The R2 for the linear model was found to be low for CDM, lactate concentration, and protease activity for all conditions studied compared to the R2 obtained for the quadratic and paraquadratic models. For the quadratic model, the highest R2 values were obtained at 48 h: 0.83 for CDM at pH 8.8, 0.92 for lactate concentration at pH 8.8, and 0.91 for protease activity at pH 10.5. The data under these conditions were used to construct the three-dimensional figures of the RSM generated by the model (Figure 6).
The generated models were used to determine the conditions that would yield the highest CDM, lactate production, and protease activity. The results are presented in Table 4. According to the response surface analysis of the quadratic model, a lower amount of meat extract can be used to achieve a higher CDM, as increasing the meat extract concentration did not enhance CDM production. For optimum lactate production, the amount of meat extract (3.0%) determined by the response surface analysis was higher than the required peptone concentration (1.61%). These results indicate that elevated peptone concentrations are unnecessary for achieving optimal lactate production.
The data obtained from the model for optimum protease activity suggest using the lowest amounts of meat extract and peptone. Modeling simulations are advantageous as they provide insights into different scenarios and system predictions. The outputs from the design of experiments help to reduce production costs and labor time. Our modeling results suggest using low concentrations of meat extract for the optimum DCM amount and protease activity, while lower concentrations of peptone favor lactate production and protease activity. These output data are valuable for reducing production costs.
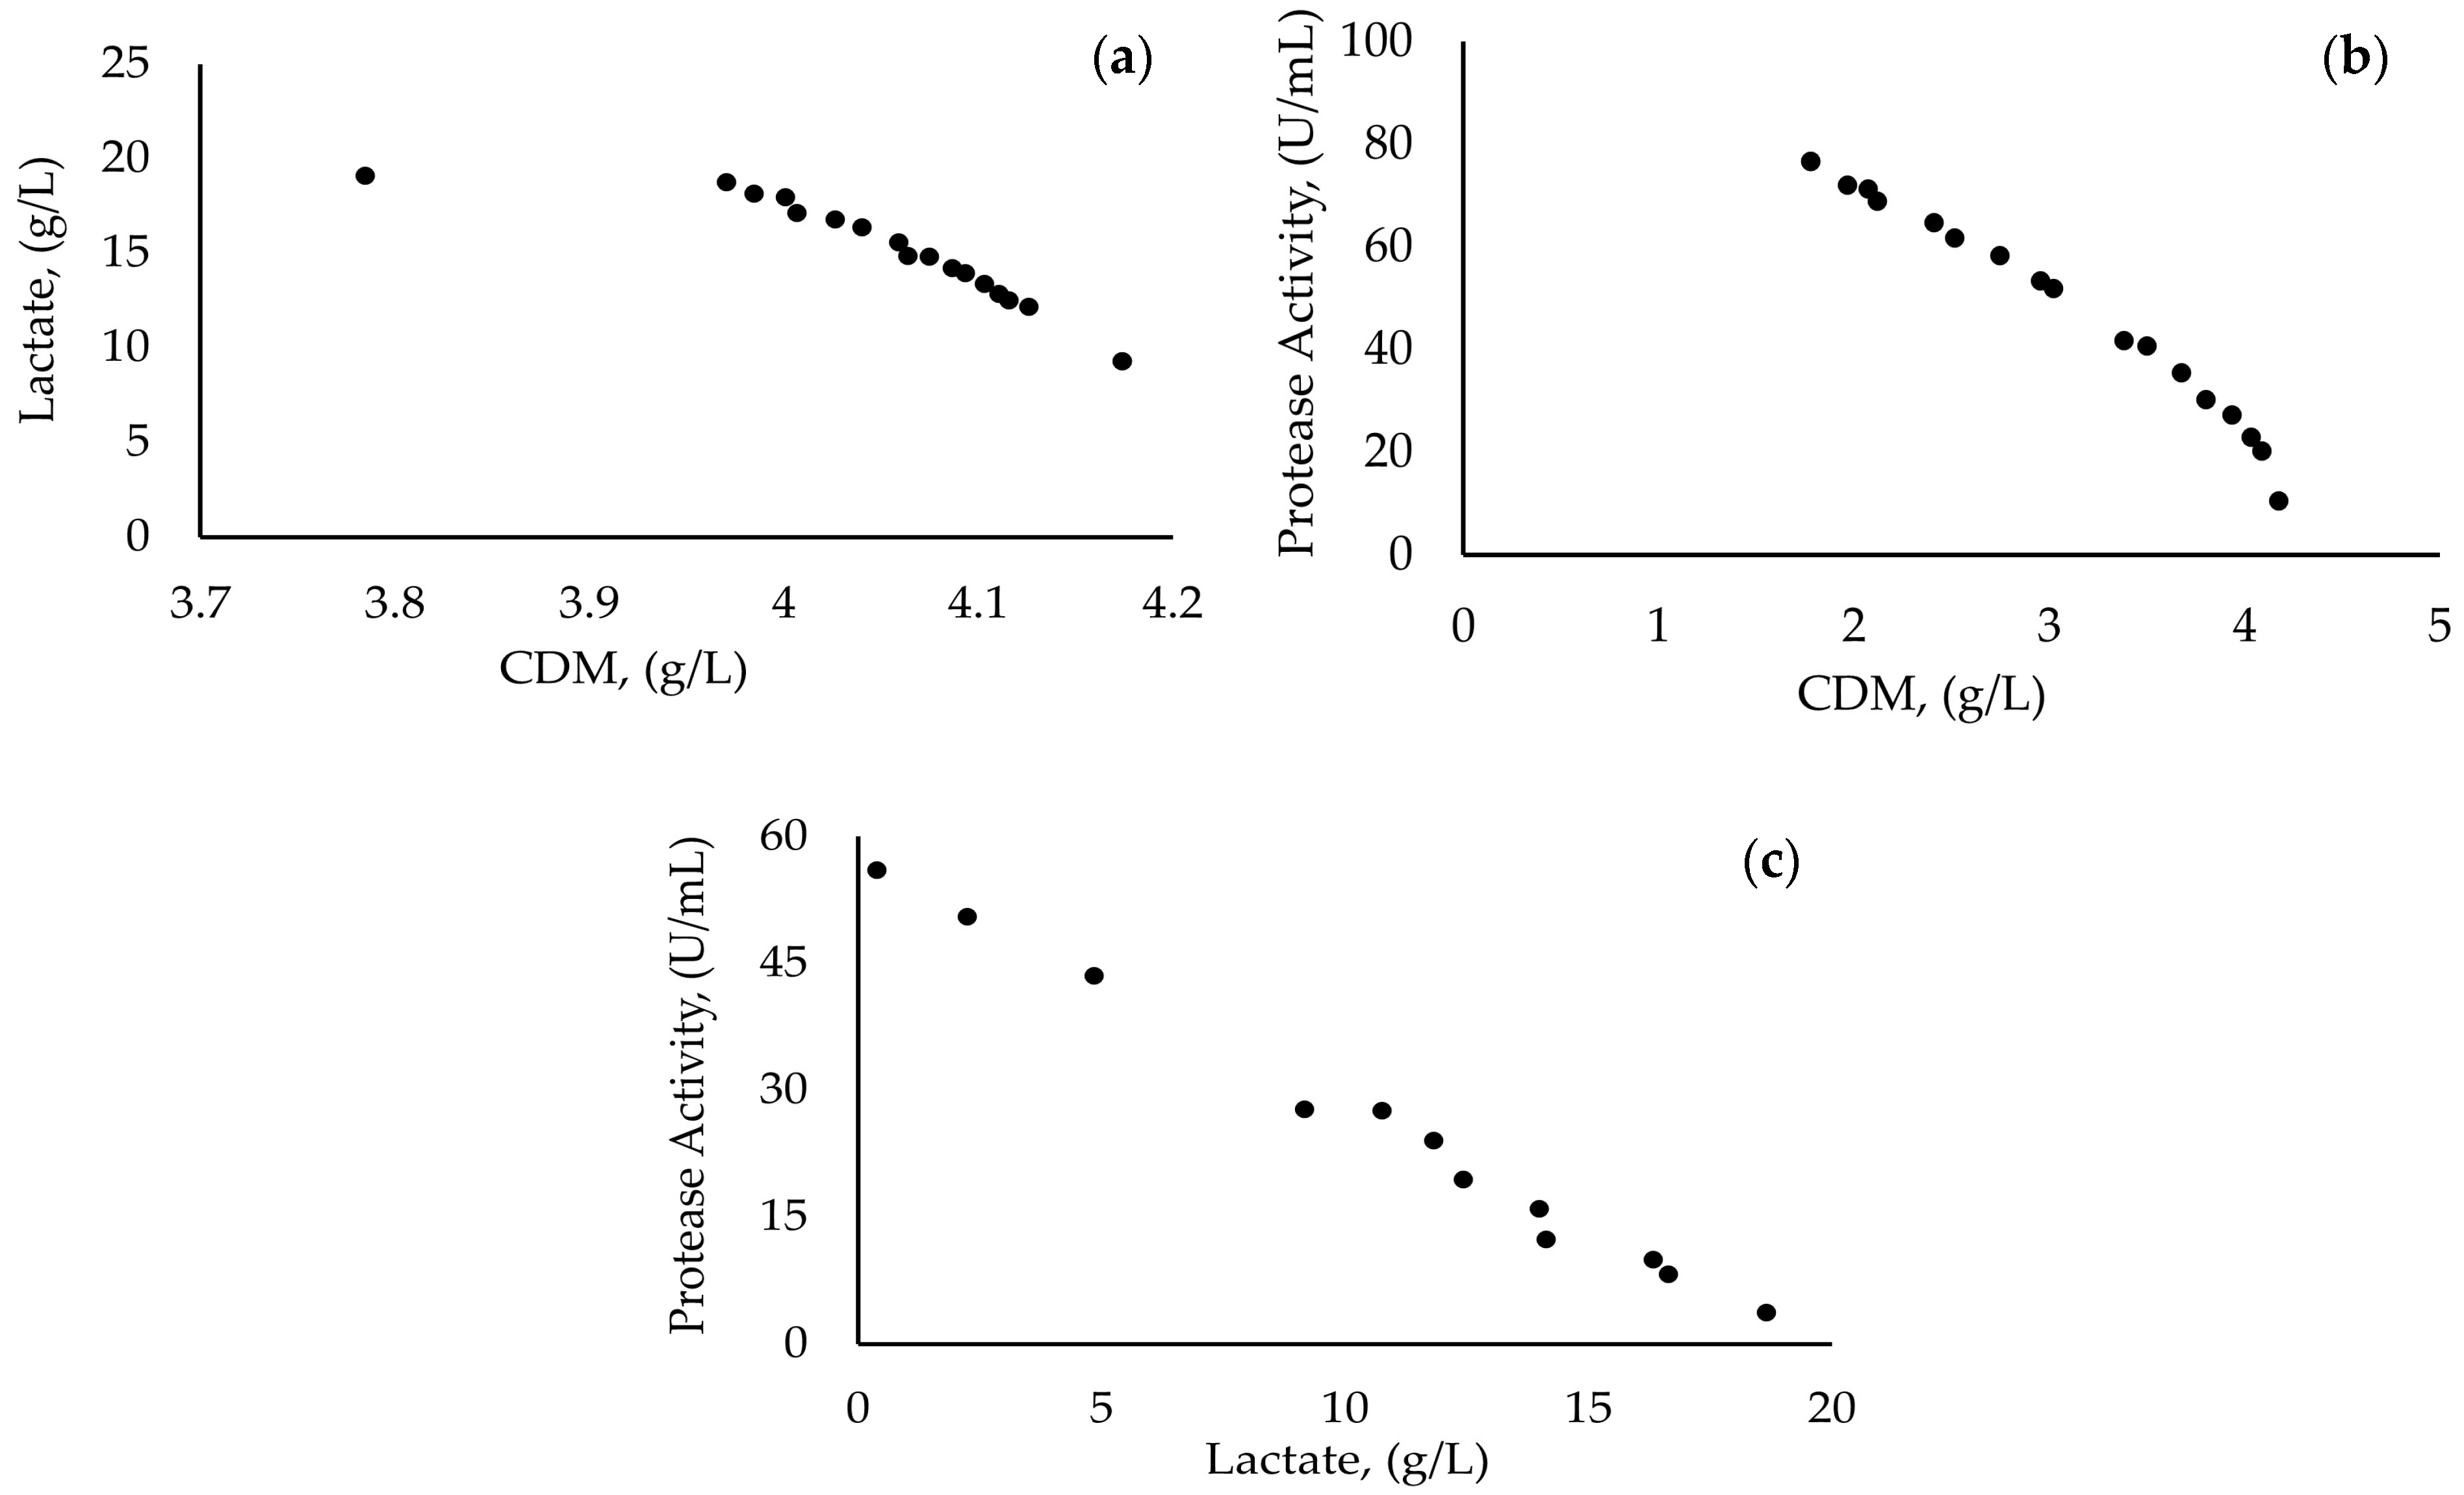
Since the optimum conditions for each variable yielded different outcomes, multi-objective optimization, where the optimization of two metrics or more is carried out simultaneously, was employed for variables DCM–lactate production, DCM–protease activity, and lactate production–protease activity to achieve simultaneous optimization. The Pareto fronts that showed the trade-off between the two-process metrics were employed in the optimization of the two objectives and are given in Figure 7.
The Pareto fronts presented a reverse relationship for CDM and the fermentative products in question. As depicted in Figure 7, the optimal concentration range for CDM was found to be between 3.78 g/L and 4.17 g/L, corresponding to the lactate concentration ranging from 9.29 g/L to 19.08 g/L. On the other hand, the optimal CDM range of 1.7 g/L to 4.17 g/L corresponded to a protease activity range of 10.5 U/mL to 76.7 U/mL. Similarly, for lactate production, the optimal concentration range of 0.38 g/L to 18.65 g/L aligned with a protease activity range of 3.74 U/mL to 56.03 U/mL.
According to the trade-offs observed, it is evident that producing these two metabolites simultaneously within the conditions investigated is not possible. These results suggests that a high CDM cannot be achieved while fermentative products are being produced. Therefore, at the last step of the optimization studies, a multi-objective optimization approach was employed to investigate three dependent variables simultaneously.
The multi-objective optimization approach yields different solutions that include all the variables, and all these solutions are equally optimal when no more improvement in any of the objectives is possible without compromising the other two objectives. Without an additional criterion for prioritizing the three objectives, solutions of the three-dimensional Pareto front need to be treated equally. Ten selected solutions from this work are tabulated and given as Table A3. The results of the multi-objective optimization approach show that, while the optimal concentrations of meat extract and peptone could be determined using experimental and modeling data for a single dependent variable, it is not possible to simultaneously achieve high levels of CDM, lactate, and protease production.
The models developed using the response surface methodology (RSM) further support these observations. High R2 values for lactate (>0.9) indicate that production can be reliably predicted from nitrogen and pH parameters. However, model accuracy was lower for CDM and protease activity under nutrient-limiting conditions, pointing to possible unaccounted for biological complexity, such as quorum sensing or stress-induced regulation, which future models could incorporate.

3.5. Experimental Validation of the Models

It is essential to evaluate and validate the fitted model to confirm that it accurately represents the actual system. To validate the models, new sets of experiments were designed using the optimal conditions suggested by the models, random solutions from the Pareto front of double response combinations, and three-objective Pareto optimization solutions. The predicted values and validation experiment data are provided in Table 5.
The condition for best CDM production was found as 0.1% meat extract and 3.03% peptone (Table 4). The validation experiments for this condition resulted in 3.7 ± 0.4 g/L cells. However, higher cell concentrations were obtained in previous experiments under the condition with 1.20% meat extract and 3.8% peptone at pH 8.8 at 48 h (Table 1). Therefore, even though there were no statistically significant differences between prediction and validation data (p < 0.05) for CDM, meaning the model successfully predicted the CDM, it was not as successful in determining the optimal conditions.
The model accurately predicted the condition for the optimum lactate concentrations and there were no statistically significant differences between the prediction and validation data (p < 0.05) across the various meat extract and peptone levels, except at 3% peptone. This might suggest that the model needs refinement to predict more accurately at the higher concentrations of peptone. On the other hand, the model also showed that lower peptone concentrations are needed to obtain higher lactate concentrations.
However, for protease activity, the predicted optimum (16.2 ± 1.0 U/mL) was less than half of the experimentally observed value (43.5 ± 1.6 U/mL) under the same condition as the optimum (0.1% meat extract, 0.1% peptone, Table 4). The model predictions were reliable as there were no statistically significant differences between the prediction and validation data (p < 0.05) when the meat extract concentration exceeded 0.2%. These discrepancies suggest that refinements are needed to improve the accuracy of protease activity predictions in conditions where a low meat extract concentration is utilized.
Potential sources of error for the inaccuracies observed within the models might include unmodeled biological factors, variations in experimental conditions, or inaccuracies in input parameters. Further experimental validation and model adjustments are necessary to enhance the model accuracy. Although the fitted models provided valuable insights, especially for lactate production, they were less accurate for CDM and protease activity under low-nutrient conditions. This suggests that additional biological factors not captured by the models may be influencing the system. At very low peptone and meat extract levels, micro-scale nutrient gradients, stress-induced metabolic shifts, and heterogeneous gene expression may become more pronounced, leading to non-linear behavior not captured by the quadratic models. Under such conditions with limited nutrients, cells may redirect resources toward maintenance and stress responses rather than growth or metabolite production. Local pH changes from metabolite accumulation may also affect enzyme stability and expression. These effects are difficult to capture with models based solely on macroscopic variables. Thus, further model refinement may require incorporating mechanistic or systems-level biological data to better simulate the complex physiological responses of A. marmarensis.
In summary, the application of multi-objective optimization via Pareto fronts demonstrated the feasibility of identifying operating conditions that balance biomass and product yields. This approach is particularly valuable for extremophilic organisms like A. marmarensis, where optimal conditions for growth may not align with those for metabolite production. In the broader bioprocessing field, multi-objective Pareto analysis has been successfully used to explore trade-offs between profitability, sustainability, and metabolite yields, such as in ethanol production via gasification and syngas fermentation [57,58]. Consistent with these studies, our results further demonstrate that Pareto-based optimization can effectively guide multi-dimensional decision-making in microbial bioprocess development, particularly for systems with competing biological and production objectives.
Nevertheless, despite the strength of the model-based approach and the high R2 values for lactate prediction, several limitations emerged. Most notably, the predictive accuracy of the models for CDM and protease activity diminished under low-nutrient conditions, reflecting well-known stress-induced metabolic shifts and nutrient-gradient effects that are difficult to capture in bulk models [59]. These discrepancies likely stem from unmodeled biological complexity, including stress-induced metabolic shifts, microenvironmental nutrient gradients, and heterogeneity in gene expression among cells [60]. Additionally, the use of low-order polynomial models may not sufficiently capture non-linear biological responses. Future work should incorporate mechanistic modeling, transcriptomic or proteomic data integration, and dynamic culture monitoring to improve model robustness and better simulate system behavior under variable nutrient conditions.

4. Conclusions

This study examined the effects of pH, incubation time, and nitrogen source composition on the growth and metabolite production of A. marmarensis, an obligate extremophilic bacterium with high potential for industrial bioprocessing. Peptone was found to play a more significant role than meat extract in determining cell dry mass (CDM), lactate, and protease levels. While low peptone concentrations hindered biomass and lactate production, high concentrations led to a marked decrease in protease activity. Using the response surface methodology and multi-objective optimization, we developed predictive models—most notably for lactate (R2 up to 0.92)—and identified trade-offs between growth and metabolite output. Specifically, conditions that favored a high CDM did not support maximal production of lactate or protease, highlighting a key challenge in optimizing extremophilic systems for multiple outputs. Pareto optimization helped identify feasible conditions and balance competing production goals. However, the reduced model accuracy under low-nutrient conditions suggests unaccounted for biological factors influence system behavior. To our knowledge, this is the first study to investigate how metabolite production by obligate extremophiles can be maximized relative to cellular mass while maintaining vigorous cell proliferation. This is particularly important, as product yield per unit of biomass is a key factor in achieving effective and economical bioproduction in industrial biotechnology. Future studies should focus on refining model accuracy through the integration of omics data and dynamic culture monitoring. Additionally, validating the findings in scalable bioreactor systems will be essential to assess the industrial applicability and robustness under real-world process conditions.

Author Contributions

Y.A. conducted the experimental work and drafted the manuscript. E.K. contributed to the experimental work and manuscript writing. N.A.S. developed the models for data validation. D.K. supervised the study and provided the necessary resources. All authors have read and agreed to the published version of the manuscript.

Funding

This research received no external funding.

Institutional Review Board Statement

Not applicable.

Informed Consent Statement

Not applicable.

Data Availability Statement

The data supporting the findings of this study are included in the main manuscript and Appendix A.

Acknowledgments

The authors would like to express their sincere gratitude to Berna Sariyar Akbulut from Marmara University and Esra Göv from Adana Alparslan Türkeş Science and Technology University for their valuable support throughout the course of this work.

Conflicts of Interest

Author Eldin Kurpejović was employed by the company Acies Bio d.o.o. The remaining authors declare that the research was conducted in the absence of any commercial or financial relationships that could be construed as a potential conflict of interest.

Abbreviations

The following abbreviations are used in this manuscript:
RSMResponse Surface Methodology
CDMCell Dry Mass
TCATrichloroacetic Acid
hHours

Appendix A

Figure A1. Alkalihalophilus marmarensis on modified alkaline NB.
Applmicrobiol 05 00069 g0a1
Table A1. The analysis of variance (ANOVA) for condition, time, and pH on CDM, lactate concentration, and protease activity.
SourceType III Sum of SquaresdfMean SquareFSig.
Cell Dry MassCorrected Model82.56 a471.7610.200.00
Intercept1580.1611580.169173.600.00
Condition50.00114.5526.390.00
Time2.5512.5514.780.00
pH1.8311.8310.620.00
Media * Time4.84110.442.550.01
Media * pH9.35110.854.930.00
Time * pH0.3310.331.940.17
Media * Time * pH13.67111.247.220.00
Error16.54960.17
Total1679.26144
Corrected Total99.10143
a. R Squared = 0.833 (Adjusted R Squared = 0.751)
Lactate ConcentrationCorrected Model1698.79 a4736.1415.770.00
Intercept10,511.297110,511.304586.720.00
Condition1145.82511104.1745.450.00
pH151.8511151.8566.260.00
Time64.567164.5728.170.00
Media * Time257.9521123.4510.230.00
Media * pH63.195115.742.510.01
Time * pH1.13611.140.500.48
Media * Time * pH14.267111.300.570.85
Error110.001482.29
Total12,320.09196
Corrected Total1808.79495
a. R Squared = 0.939 (Adjusted R Squared = 0.880)
Protease ActivityCorrected Model22,361.27 a47475.7759.930.00
Intercept9931.7519931.751251.020.00
Condition19,611.55111782.87224.570.00
Time844.381844.38106.360.00
pH15.56115.561.960.17
Media * Time1031.281193.7511.810.00
Media * pH297.091127.013.400.00
Time * pH230.281230.2829.010.00
Media * Time * pH331.131130.103.790.00
Error762.13967.94
Total33,055.16144
Corrected Total23,123.41143
a. R Squared = 0.967 (Adjusted R Squared = 0.951)
Table A2. R2 values obtained from models for CDM, lactate concentration, and protease activity.
Type of ModelR2 Values
CDM (g/L)Lactate Concentration (g/L)Protease Activity (U/mL)
pH 8.8pH 10.5pH 8.8pH 10.5pH 8.8pH 10.5
244824482448244824482448
Linear Model0.480.480.490.420.350.730.570.810.610.640.640.76
Quadratic Model0.810.830.730.790.620.920.580.850.790.810.850.91
Pure Quadratic Model0.810.820.730.790.470.740.580.810.740.710.80.85
Table A3. Selected multi-objective optimization solutions for CDM, lactate concentration, and protease activity comprising the three-dimensional Pareto front.
Pareto Solution
No.
DependentOutput Variables
Meat Extract
(%, w/v)
Peptone (%, w/v)CDM
(g/L)
Lactate
(g/L)
Protease
(U/mL)
10.10023.03314.1749.29410.555
22.19962.00863.62515.0245.462
32.77170.11761.16616.85910.853
42.2780.10221.26612.60722.567
52.10840.75522.33412.46417.863
61.07520.75962.5514.88338.222
72.98550.10081.08018.6866.095
80.69180.56532.3611.22350.441
92.64422.0133.56517.3321.004
100.38332.97594.1599.9629.926

References

  1. Merino, N.; Aronson, H.S.; Bojanova, D.P.; Feyhl-Buska, J.; Wong, M.L.; Zhang, S.; Giovannelli, D. Living at the Extremes: Extremophiles and the Limits of Life in a Planetary Context. Front. Microbiol. 2019, 10, 447–668. [Google Scholar] [CrossRef] [PubMed]
  2. Marzban, G.; Tesei, D. The Extremophiles: Adaptation Mechanisms and Biotechnological Applications. Biology 2025, 14, 412. [Google Scholar] [CrossRef] [PubMed]
  3. Preiss, L.; Hicks, D.B.; Suzuki, S.; Meier, T.; Krulwich, T.A. Alkaliphilic Bacteria with Impact on Industrial Applications, Concepts of Early Life Forms, and Bioenergetics of ATP Synthesis. Front. Bioeng. Biotechnol. 2015, 3, 146008. [Google Scholar] [CrossRef] [PubMed]
  4. Denizci, A.A.; Kazan, D.; Erarslan, A. Bacillus marmarensis Sp. Nov., an Alkaliphilic, Protease-Producing Bacterium Isolated from Mushroom Compost. Int. J. Syst. Evol. Microbiol. 2010, 60, 1590–1594. [Google Scholar] [CrossRef] [PubMed]
  5. Wernick, D.G. Toward Nitrogen-Neutral and Contamination-Resistant Biofuels and Chemicals for a Sustainable Future. Ph.D. Thesis, The University of California, Berkeley, CA, USA, 2015. [Google Scholar]
  6. Joshi, A.; Thite, S.; Karodi, P.; Joseph, N.; Lodha, T. Alkalihalobacterium elongatum Gen. Nov. Sp. Nov.: An Antibiotic-Producing Bacterium Isolated from Lonar Lake and Reclassification of the Genus Alkalihalobacillus into Seven Novel Genera. Front. Microbiol. 2021, 12, 722369. [Google Scholar] [CrossRef] [PubMed]
  7. Wernick, D.G.; Pontrelli, S.P.; Pollock, A.W.; Liao, J.C. Sustainable Biorefining in Wastewater by Engineered Extreme Alkaliphile Bacillus marmarensis. Sci. Rep. 2016, 6, 20224. [Google Scholar] [CrossRef] [PubMed]
  8. Kerimak Öner, M.N. Purification and Characterization of Alkaline Protease from Obligate Alkaliphilic Bacillus marmariensis GMBE 72. Ph.D. Thesis, The Univesity of Kocaeli, Kocaeli, Türkiye, 2009. [Google Scholar]
  9. Canpulat, M. Co-Production of Enzymes and Nanoparticles by Extremophilic Microorganisms. M.Sc. Thesis, Marmara University, Istanbul, Türkiye, 2022. [Google Scholar]
  10. Sethi, S.; Bhatti, G.S. Trends in Biotechnology of Polyextremophiles; Springer Nature: Berlin/Heidelberg, Germany, 2024; pp. 417–440. ISBN 3031550323. [Google Scholar]
  11. Atakav, Y.; Pinar, O.; Kazan, D. Investigation of the Physiology of the Obligate Alkaliphilic Bacillus marmarensis Gmbe 72t Considering Its Alkaline Adaptation Mechanism for Poly(3-Hydroxybutyrate) Synthesis. Microorganisms 2021, 9, 462. [Google Scholar] [CrossRef] [PubMed]
  12. Fujinami, S.; Fujisawa, M. Industrial Applications of Alkaliphiles and Their Enzymes-Past, Present and Future. Environ. Technol. 2010, 31, 845–856. [Google Scholar] [CrossRef] [PubMed]
  13. Horikoshi, K. Alkaliphiles-Genetic Properties and Applications of Enzymes; Kodansha: Tokyo, Japan, 2006; pp. 125–141. ISBN 4-06-211513-1. [Google Scholar]
  14. Mamo, G.; Mattiasson, B. Biotechnology of Extremophiles: Advances and Challenges; Rampelotto, P.H., Ed.; Springer International Publishing: Cham, Switzerland, 2016; pp. 243–272. ISBN 978-3-319-13521-2. [Google Scholar]
  15. Mesbah, N.M. Industrial Biotechnology Based on Enzymes from Extreme Environments. Front. Bioeng. Biotechnol. 2022, 10, 870083. [Google Scholar] [CrossRef] [PubMed]
  16. Özgören, T. Production of Polyhydroxyalkanoate from Extreme Obligate Alkaliphilic Strain Bacillus marmarensis Gmbe 72 T Isolated from Mushroom Compost. M.Sc. Thesis, Marmara University, Istanbul, Türkiye, 2017. [Google Scholar]
  17. Verma, J.; Pandey, S.; Kumar, C.; Saxena, S. A Detergent-Compatible Alkaline Metalloprotease from Bacillus pseudofirmus BBAU-19: Characterization and Application. Proc. Natl. Acad. Sci. India Sect. B Biol. Sci. 2023, 93, 499–510. [Google Scholar] [CrossRef]
  18. Fu, Y.; Rao, Y.; Liao, Y.; Zhang, Q.; Ma, X.; Cai, D.; Chen, S. Protein Engineering, Expression Optimization, and Application of Alkaline Protease from Alkalihalobacillus clausii FYX. Int. J. Biol. Macromol. 2025, 307, 141891. [Google Scholar] [CrossRef] [PubMed]
  19. Saberianpour, S.; Abkhooie, L.; Elyasifar, B.; Dilmaghani, A. Screening and Optimization of Protease Enzyme Produced by Strains of Alkalihalobacillus sp. and Bacillus sp. Curr. Biotechnol. 2020, 9, 40–45. [Google Scholar] [CrossRef]
  20. Box, G.E.P.; Wilson, K.B. Breakthroughs in Statistics: Methodology and Distribution; Springer: New York, NY, USA, 1992; pp. 270–310. ISBN 978-1-4612-4380-9. [Google Scholar]
  21. Breig, S.J.M.; Luti, K.J.K. Response Surface Methodology: A Review on Its Applications and Challenges in Microbial Cultures. Mater. Today Proc. 2021, 42, 2277–2284. [Google Scholar] [CrossRef]
  22. Suriya, P.; Sangeetha, S.P. Optimization of Microbial Fermentation Processes Using RSM Approach for Soil Improvement. J. Build. Pathol. Rehabil. 2025, 10, 72. [Google Scholar] [CrossRef]
  23. Amaradio, M.N.; Ojha, V.; Jansen, G.; Gulisano, M.; Costanza, J.; Nicosia, G. Pareto Optimal Metabolic Engineering for the Growth-coupled Overproduction of Sustainable Chemicals. Biotechnol. Bioeng. 2022, 119, 1890–1902. [Google Scholar] [CrossRef] [PubMed]
  24. Maity, S.; Chattopadhyay, R.; Sinha, S.K.; Regar, M.L. Applications of Selected Response Surface Design of Experiments and Advanced Control Charts in Textile Engineering. In Textile Calculation; Woodhead Publishing: Cambridge, UK, 2023; pp. 13–55. [Google Scholar] [CrossRef]
  25. Veza, I.; Spraggon, M.; Fattah, I.M.R.; Idris, M. Response Surface Methodology (RSM) for Optimizing Engine Performance and Emissions Fueled with Biofuel: Review of RSM for Sustainability Energy Transition. Results Eng. 2023, 18, 101213. [Google Scholar] [CrossRef]
  26. Sigg, A.; Klimacek, M.; Nidetzky, B. Pushing the Boundaries of Phosphorylase Cascade Reaction for Cellobiose Production II: Model-based Multiobjective Optimization. Biotechnol. Bioeng. 2024, 121, 566–579. [Google Scholar] [CrossRef] [PubMed]
  27. Claes, E.; Heck, T.; Coddens, K.; Sonnaert, M.; Schrooten, J.; Verwaeren, J. Bayesian Cell Therapy Process Optimization. Biotechnol. Bioeng. 2024, 121, 1569–1582. [Google Scholar] [CrossRef] [PubMed]
  28. Pogodaev, A.; Hernández Rodríguez, T.; Li, M.; García Münzer, D.G. Modeling of Bioprocess Pre-Stages for Optimization of Perfusion Profiles and Increased Process Understanding. Biotechnol. Bioeng. 2024, 121, 228–237. [Google Scholar] [CrossRef] [PubMed]
  29. Takami, H.; Akiba, T.; Horikoshi, K. Production of Extremely Thermostable Alkaline Protease from Bacillus sp. No. AH-101. Appl. Microbiol. Biotechnol. 1989, 30, 120–124. [Google Scholar] [CrossRef]
  30. Kishore, G.; Karthik, A.; Gopal, S.; Kumar, A.R.; Bhat, M.; Udupa, N. Development of RP-HPLC Method for Simultaneous Estimation of Lactic Acid and Glycolic Acid. Pharma Chem. 2013, 5, 335–340, ISSN 0975-413X. [Google Scholar]
  31. Fitlm. Available online: https://www.mathworks.com/help/stats/fitlm.html (accessed on 21 April 2025).
  32. Kula, C.; Sayar, N.A. Multi-Objective Optimization of a Novel Crude Lipase-Catalyzed Fatty Acid Methyl Ester (FAME) Production Using Low-Order Polynomial and Kriging Models. Int. J. Green Energy 2019, 16, 657–665. [Google Scholar] [CrossRef]
  33. Ahmad, A.; Banat, F.; Alsafar, H.; Hasan, S.W. An Overview of Biodegradable Poly (Lactic Acid) Production from Fermentative Lactic Acid for Biomedical and Bioplastic Applications. Biomass Convers. Biorefin. 2024, 14, 3057–3076. [Google Scholar] [CrossRef]
  34. Song, P.; Zhang, X.; Wang, S.; Xu, W.; Wang, F.; Fu, R.; Wei, F. Microbial Proteases and Their Applications. Front. Microbiol. 2023, 14, 1236368. [Google Scholar] [CrossRef] [PubMed]
  35. Razzaq, A.; Shamsi, S.; Ali, A.; Ali, Q.; Sajjad, M.; Malik, A.; Ashraf, M. Microbial Proteases Applications. Front. Bioeng. Biotechnol. 2019, 7, 110. [Google Scholar] [CrossRef] [PubMed]
  36. Gobert, A.; Tourdot-Maréchal, R.; Sparrow, C.; Morge, C.; Alexandre, H. Influence of Nitrogen Status in Wine Alcoholic Fermentation. Food Microbiol. 2019, 83, 71–85. [Google Scholar] [CrossRef] [PubMed]
  37. Soini, J.; Ukkonen, K.; Neubauer, P. High Cell Density Media for Escherichia Coli Are Generally Designed for Aerobic Cultivations-Consequences for Large-Scale Bioprocesses and Shake Flask Cultures. Microb. Cell Factories 2008, 7, 26. [Google Scholar] [CrossRef] [PubMed]
  38. Konzock, O.; Nielsen, J. TRYing to Evaluate Production Costs in Microbial Biotechnology. Trends Biotechnol. 2024, 42, 1339–1347. [Google Scholar] [CrossRef] [PubMed]
  39. Bond, J.S. Proteases: History, Discovery, and Roles in Health and Disease. J. Biol. Chem. 2019, 294, 1643–1651. [Google Scholar] [CrossRef] [PubMed]
  40. Liu, X.; John Martin, J.J.; Li, X.; Zhou, L.; Li, R.; Li, Q.; Zhang, J.; Fu, D.; Cao, H. Optimization of the Fermentation Culture Conditions of Bacillus amyloliquefaciens Ck-05 Using Response Surface Methodology. Front. Microbiol. 2025, 16, 1552645. [Google Scholar] [CrossRef] [PubMed]
  41. Lorca, G.L.; Chung, Y.J.; Barabote, R.D.; Weyler, W.; Schilling, C.H.; Saier, M.H. Catabolite Repression and Activation in Bacillus Subtilis: Dependency on CcpA, HPr, and HprK. J. Bacteriol. 2005, 187, 7826–7839. [Google Scholar] [CrossRef] [PubMed]
  42. Parecha, D.; Alfano, A.; Cimini, D.; Schiraldi, C. Vegan Grade Medium Component Screening and Concentration Optimization for the Fermentation of the Probiotic Strain Lactobacillus paracasei IMC 502® Using Design of Experiments. J. Ind. Microbiol. Biotechnol. 2024, 51, kuae016. [Google Scholar] [CrossRef] [PubMed]
  43. Salwan, R.; Sharma, V. Physiological and Biotechnological Aspects of Extremophiles; Elsevier: Amsterdam, The Netherlands, 2020; pp. 13–22, ISBN-10‎ 0128183225. [Google Scholar]
  44. Nguyen, P.Y.; Marques, R.; Wang, H.; Reis, M.A.M.; Carvalho, G.; Oehmen, A. The Impact of pH on the Anaerobic and Aerobic Metabolism of Tetrasphaera-Enriched Polyphosphate Accumulating Organisms. Water Res. X 2023, 19, 100177. [Google Scholar] [CrossRef] [PubMed]
  45. Balachandran, C.; Vishali, A.; Nagendran, N.A.; Baskar, K.; Hashem, A.; Abd_Allah, E.F. Optimization of Protease Production from Bacillus Halodurans under Solid State Fermentation Using Agrowastes. Saudi J. Biol. Sci. 2021, 28, 4263–4269. [Google Scholar] [CrossRef] [PubMed]
  46. Janto, B.; Ahmed, A.; Ito, M.; Liu, J.; Hicks, D.B.; Pagni, S.; Fackelmayer, O.J.; Smith, T.-A.; Earl, J.; Elbourne, L.D.H.; et al. Genome of Alkaliphilic Bacillus pseudofirmus OF4 Reveals Adaptations That Support the Ability to Grow in an External pH Range from 7.5 to 11.4. Environ. Microbiol. 2011, 13, 3289–3309. [Google Scholar] [CrossRef] [PubMed]
  47. Horikoshi, K. Alkaliphiles: Some Applications of Their Products for Biotechnology. Microbiol. Mol. Biol. Rev. 1999, 63, 735–750. [Google Scholar] [CrossRef] [PubMed]
  48. Puri, S.; Beg, Q.K.; Gupta, R. Optimization of Alkaline Protease Production from Bacillus sp. by Response Surface Methodology. Curr. Microbiol. 2002, 44, 286–290. [Google Scholar] [CrossRef] [PubMed]
  49. Oskouie, S.F.G.; Tabandeh, F.; Yakhchali, B.; Eftekhar, F. Response Surface Optimization of Medium Composition for Alkaline Protease Production by Bacillus clausii. Biochem. Eng. J. 2008, 1, 37–42. [Google Scholar] [CrossRef]
  50. Gupta, R.; Beg, Q.K.; Khan, S.; Chauhan, B. An Overview on Fermentation, Downstream Processing and Properties of Microbial Alkaline Proteases. Appl. Microbiol. Biotechnol. 2002, 60, 381–395. [Google Scholar] [CrossRef] [PubMed]
  51. Habicher, T.; John, A.; Scholl, N.; Daub, A.; Klein, T.; Philip, P.; Büchs, J. Introducing Substrate Limitations to Overcome Catabolite Repression in a Protease Producing Bacillus licheniformis Strain Using Membrane-Based Fed-Batch Shake Flasks. Biotechnol. Bioeng. 2019, 116, 1326–1340. [Google Scholar] [CrossRef] [PubMed]
  52. Abdel-Fattah, Y.R.; El-Enshasy, H.A.; Soliman, N.A.; El-Gendi, H. Bioprocess Development for Production of Alkaline Protease by Bacillus pseudofirmus Mn6 through Statistical Experimental Designs. J. Microbiol. Biotechnol. 2009, 19, 378–386. [Google Scholar] [CrossRef] [PubMed]
  53. Patel, R.; Dodia, M.; Singh, S. Extracellular Alkaline Protease from a Newly Isolated Haloalkaliphilic Bacillus sp.: Production and Optimization. Process Biochem. 2005, 40, 3569–3575. [Google Scholar] [CrossRef]
  54. Zhang, Y.; Hu, J.; Zhang, Q.; Cai, D.; Chen, S.; Wang, Y. Enhancement of Alkaline Protease Production in Recombinant Bacillus licheniformis by Response Surface Methodology. Bioresour. Bioprocess. 2023, 10, 27. [Google Scholar] [CrossRef] [PubMed]
  55. Patel, S.; Gupta, R.S. A Phylogenomic and Comparative Genomic Framework for Resolving the Polyphyly of the Genus Bacillus: Proposal for Six New Genera of Bacillus Species, Peribacillus Gen. Nov., Cytobacillus Gen. Nov., Mesobacillus Gen. Nov., Neobacillus Gen. Nov., Metabacillus Gen. Nov. and Alkalihalobacillus Gen. Nov. Int. J. Syst. Evol. Microbiol. 2020, 70, 406–438. [Google Scholar] [CrossRef] [PubMed]
  56. Sharma, K.M.; Kumar, R.; Panwar, S.; Kumar, A. Microbial Alkaline Proteases: Optimization of Production Parameters and Their Properties. J. Genet. Eng. Biotechnol. 2017, 15, 115–126. [Google Scholar] [CrossRef] [PubMed]
  57. Patané, A.; Jansen, G.; Conca, P.; Carapezza, G.; Costanza, J.; Nicosia, G. Multi-Objective Optimization of Genome-Scale Metabolic Models: The Case of Ethanol Production. Ann. Oper. Res. 2019, 276, 211–227. [Google Scholar] [CrossRef]
  58. de Medeiros, E.M.; Noorman, H.; Maciel Filho, R.; Posada, J.A. Multi-Objective Sustainability Optimization of Biomass Residues to Ethanol via Gasification and Syngas Fermentation: Trade-Offs Between Profitability, Energy Efficiency, and Carbon Emissions. Fermentation 2021, 7, 201. [Google Scholar] [CrossRef]
  59. Snoeck, S.; Guidi, C.; De Mey, M. “Metabolic Burden” Explained: Stress Symptoms and Its Related Responses Induced by (over)Expression of (Heterologous) Proteins in Escherichia Coli. Microb. Cell Factories 2024, 23, 96. [Google Scholar] [CrossRef] [PubMed]
  60. Evers, T.M.J.; Hochane, M.; Tans, S.J.; Heeren, R.M.A.; Semrau, S.; Nemes, P.; Mashaghi, A. Deciphering Metabolic Heterogeneity by Single-Cell Analysis. Anal. Chem. 2019, 91, 13314–13323. [Google Scholar] [CrossRef] [PubMed]
Figure 1. The process workflow of this study.
Applmicrobiol 05 00069 g001
Figure 2. Main effects plots for CDM at pH 8.8 at (a) 24 h and (b) 48 h and pH 10.5 at (c) 24 h and (d) 48 h for meat extract and peptone % (w/v).
Applmicrobiol 05 00069 g002
Figure 3. Main effects plots for lactate production at pH 8.8 at (a) 24 h and (b) 48 h and pH 10.5 at (c) 24 h and (d) 48 h for meat extract and peptone % (w/v).
Applmicrobiol 05 00069 g003
Figure 4. Main effects plots for total nitrogen and P/N values at pH 8.8 at (a) 24 h and (b) 48 h and pH 10.5 at (c) 24 h and (d) 48 h for meat extract and peptone % (w/v).
Applmicrobiol 05 00069 g004
Figure 5. Main effects plots for protease activity at pH 8.8 at (a) 24 h and (b) 48 h and pH 10.5 at (c) 24 h and (d) 48 h for meat extract and peptone % (w/v).
Applmicrobiol 05 00069 g005
Figure 6. A model-generated representation of response surfaces in three dimensions for the yield of (a) CDM (g/L), (b) lactate (g/L), and (c) protease activity (U/mL). The surface color gradient (blue to red) indicates increasing response values, with red corresponding to the highest levels of the respective response variable (CDM, lactate, or protease).
Applmicrobiol 05 00069 g006
Figure 7. Pareto plot for (a) CDM–lactate concentration, (b) CDM–protease activity, (c) lactate concentration–protease activity.
Applmicrobiol 05 00069 g007
Table 1. The effect of meat extract and peptone concentrations % (w/v) on A. marmarensis CDM.
SampleMeat ExtractPeptoneCell Dry Mass (g/L)
pH 8.8pH 10.5
24 h48 h24 h48 h
10.102.553.3 ± 1.33.5 ± 1.42.9 ± 0.14.0 ± 0.2
20.8251.3253.7 ± 0.14.0 ± 0.13.4 ± 0.24.1 ± 0.7
30.8253.7753.7 ± 0.24.1 ± 0.33.3 ± 0.13.7 ± 0.1
41.203.803.8 ± 0.14.5 ± 0.43.4 ± 0.13.8 ± 0.1
51.500.402.5 ± 0.22.2 ± 0.12.6 ± 0.41.7 ± 0.2
61.550.101.9 ± 0.21.5 ± 0.21.4 ± 0.30.9 ± 0.2
71.552.553.7 ± 0.24.1 ± 0.23.2 ± 0.23.7 ± 0.4
81.555.003.6 ± 0.23.8 ± 0.33.3 ± 0.13.7 ± 0.1
91.804.203.5 ± 0.13.6 ± 0.13.4 ± 0.13.8 ± 0.1
102.2751.3253.5 ± 0.13.6 ± 0.23.2 ± 0.23.8 ± 0.1
112.2753.7753.5 ± 0.23.6 ± 0.13.3 ± 0.13.6 ± 0.1
123.002.553.5 ± 0.23.9 ± 0.13.0 ± 0.13.7 ± 0.1
Table 2. The effect of meat extract and peptone concentration % (w/v) on lactate synthesis.
SampleMeat ExtractPeptoneLactate Concentration (g/L)
pH 8.8pH 10.5
24 h48 h24 h48 h
10.102.557.4 ± 1.77.5 ± 0.47.8± 0.78.0 ± 0.0
20.8251.3256.4 ± 0.65.2 ± 0.67.5± 0.06.8 ± 1.0
30.8253.77512.3 ± 4.312.2 ± 0.19.5 ± 0.012.8 ± 0.9
41.203.808.5 ± 0.611.8 ± 1.68.0 ± 1.113.3 ± 0.5
51.500.407.1 ± 0.26.8 ± 0.34.8 ± 0.35.9 ± 0.5
61.550.104.6 ± 0.35.4 ± 0.13.5 ± 0.64.8 ± 1.0
71.552.557.6 ± 0.410.4 ± 0.88.9 ± 0.410.8 ± 0.3
81.555.009.8 ± 0.113.7 ± 0.615.3 ± 1.118.4 ± 0.3
91.804.209.6 ± 0.89.9 ± 1.017.5 ± 1.417.1 ± 0.1
102.2751.32510.8 ± 0.912.4 ± 1.218.2 ± 1.919.3 ± 0.3
112.2753.7759.4 ± 0.212.1 ± 1.717.5 ± 0.318.1 ± 0.9
123.002.554.7 ± 0.311.6 ± 1.511.1 ± 0.516.6 ± 2.4
Table 3. Effect of meat extract and peptone concentration % (w/v) on protease activity.
SampleMeat ExtractPeptoneProtease Activity (U/mL)
pH 8.8pH 10.5
24 h48 h24 h48 h
10.102.558.3 ± 1.612.7 ± 7.44.6 ± 1.914.9 ± 0.1
20.8251.32514.6 ± 1.425.4 ± 9.012.2 ± 0.931.7 ± 5.5
30.8253.7750006.7 ± 0.9
41.203.800000
51.500.4036.4 ± 2.741.7 ± 5.026.3 ± 5.743.5 ± 1.6
61.550.1018.2 ± 2.119.8 ± 4.616.4 ± 5.137.7 ± 4.2
71.552.5508.4 ± 4.909.5 ± 4.5
81.555.0003.2 ± 0.500
91.804.200000
102.2751.3250000
112.2753.7750000
123.002.550003.7 ± 2.6
Table 4. Optimum output values for each dependent variable. Meat extract and peptone are given in % (w/v).
pHTime (h)Meat ExtractPeptone
CDM (g/L)8.8 480.103.03
Lactate (g/L)8.8483.001.61
Protease (U/mL)10.5480.100.10
Table 5. Prediction and validation data from experiments for CDM (g/L), lactate concentration (g/L), and protease activity (U/mL). Meat extract and peptone are given in % (w/v).
Meat Extract PeptoneCDMLactate ConcentrationProtease Activity
PredictionValidationPredictionValidationPredictionValidation
0.103.03-3.7 ± 0.4--
0.100.10 16.2 ± 1.0
3.001.61 -16.6 ± 1.4-
1.83.04.14.0 ± 0.714.919.3 ± 0.9--
0.21.403.43.4 ± 0.1--41.830.9 ± 3.0
2.00.20--11.812.2 ± 2.024.021.2 ± 4.7
2.62.02.62.4 ± 0.74.94.9 ± 0.938.232.1 ± 7.6
1.00.753.63.3 ± 0.617.320.6 ± 2.911.1 ± 2.6
Disclaimer/Publisher’s Note: The statements, opinions and data contained in all publications are solely those of the individual author(s) and contributor(s) and not of MDPI and/or the editor(s). MDPI and/or the editor(s) disclaim responsibility for any injury to people or property resulting from any ideas, methods, instructions or products referred to in the content.