1. Introduction
The emergence and rapid global spread of the novel coronavirus disease 2019 (COVID-19) posed an unprecedented challenge to public health and healthcare systems worldwide [
1]. The highly contagious nature of the virus, SARS-CoV-2, necessitated the development of efficient diagnostic tools for early detection and containment [
2].
These challenges underscore the importance of developing rapid, accessible, and reliable alternatives for the detection of COVID-19. Despite ongoing efforts, the pandemic continues to be a global public health challenge, with many countries maintaining restrictions to mitigate transmission and protect healthcare services from overwhelming new infections.
Furthermore, the asymptomatic spread of COVID-19 among individuals, particularly within university populations, has raised significant concerns [
3]. Asymptomatic carriers can unknowingly contribute to the transmission of the virus, making early and frequent testing of paramount importance in preventing outbreaks within educational institutions [
4].
Multiple sample collection methods have been explored for the detection of infected individuals, including posterior pharyngeal swabs, mid-nasal swabs, and saliva [
5,
6,
7,
8]. However, all these samples must undergo analysis using the current gold standard for virus detection, real-time polymerase chain reactions (RT-qPCRs). Despite its accuracy, RT-qPCR testing has limitations, including the time required for processing and the need for specialized laboratory facilities [
9]. The analysis is typically not conducted at the collection site, necessitating costly transportation of the samples to a certified laboratory. Moreover, RT-qPCR testing is highly accurate for known pathogens that are targeted for amplification, but it may not always detect emerging variants of concern. To be effective as a screening test, the frequency of the testing and speed of reporting are minimally related to the individual sensitivity of the test [
10,
11].
Therefore, there is a pressing need to implement efficient and easily deployable testing methods capable of identifying both symptomatic and asymptomatic cases, facilitating timely interventions and reducing the risk of viral transmission.
In response to these imperatives, this study aimed to validate the use of a Real-Time High-Throughput Breathalyzer, the TERA breath analyzer (TERA.Bio
®, Herzliya, Israel), as an innovative and accessible tool for the detection of SARS-CoV-2 within a university population. In the first section of our study, we focus on the validation of the TERA compared to the RT-qPCR method, which is considered the gold standard for SARS-CoV-2 detection, as recommended by the World Health Organization [
12]. Our goal was to assess the TERA.Bio
®’s accuracy, sensitivity, and specificity in detecting SARS-CoV-2 in breath samples, establishing its reliability as a diagnostic tool.
In the second part of our study, we transitioned from the validation phase to the implementation phase, highlighting the critical aspect of monitoring and follow-up. Effective containment of COVID-19 within the university setting necessitates not only accurate initial detection but also ongoing monitoring. This is particularly vital in a dynamic academic environment where individuals constantly interact, creating opportunities for viral spread. We aimed to establish a longitudinal follow-up system to track the presence of the virus within the university community over time, regardless of symptomatic or asymptomatic status. By doing so, we intended to contribute valuable insights into the dynamics of COVID-19 transmission within the university setting, assess the effectiveness of mitigation strategies, and facilitate prompt responses to potential outbreaks.
2. Methods
2.1. Study Design and Population
This real-world, observational study consisted of two distinct phases: the validation phase and the longitudinal monitoring (surveillance) phase. The validation phase employed a cross-sectional design, whereas the longitudinal monitoring phase followed a prospective cohort approach.
The sample size was determined through a convenience sampling strategy, which first included individuals exhibiting symptoms of COVID-19 and those who had close contact with symptomatic or known positive students at the University of Miami, located in the Coral Gables or downtown Miami medical campus. The sample included a broad demographic range in terms of age, gender, health status, and campus locations, reflecting the diversity of the University of Miami population, and the study’s comprehensive temporal span across different pandemic phases further supports its representativeness. These individuals provided their consent for simultaneous testing using the Tera BioStation breath analyzer (TERA.Bio®, Herzliya, Israel) and mid-nasal swab RT-qPCR tests. The validation phase underwent testing during the Spring Semester, which commenced later than usual due to the pandemic, spanning from 8 February 2021 to 31 May 2021.
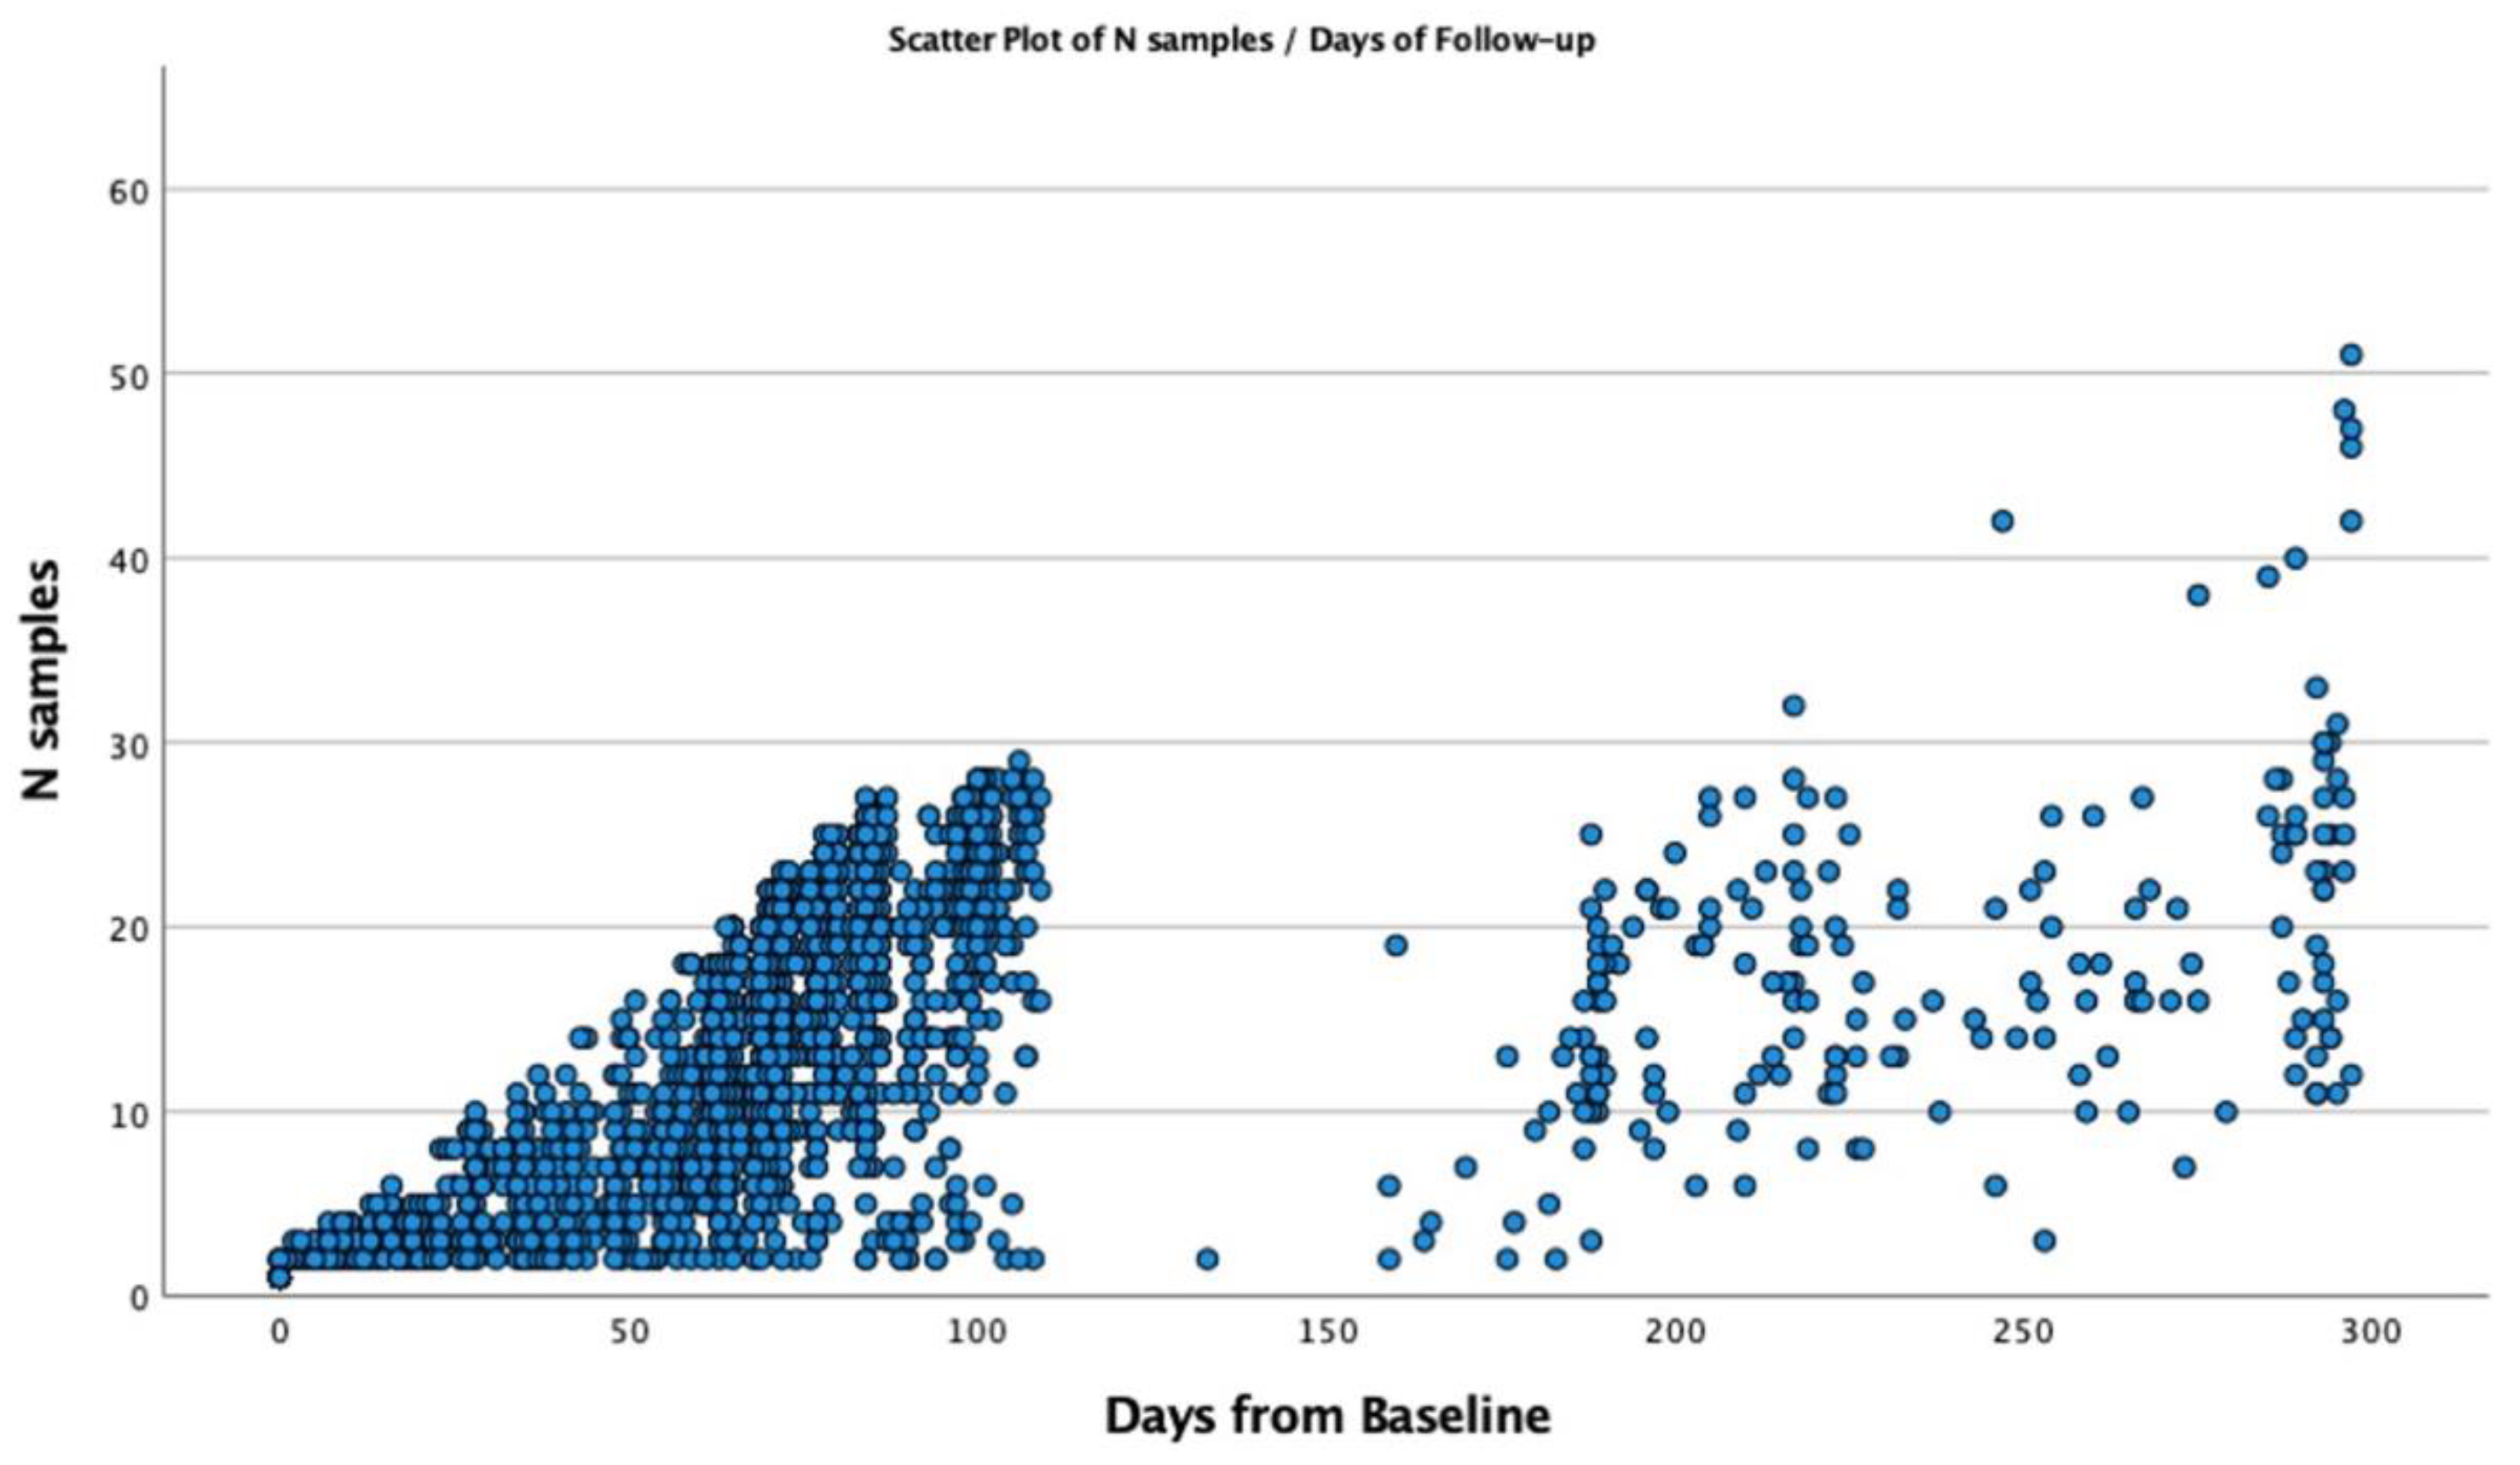
The longitudinal monitoring cohort was assembled during the Fall Semester, from 15 August 2021 to 20 December 2021, during which 8796 TERA.Bio® tests were administered. This monitoring period coincided with two significant waves of SARS-CoV-2 in Miami. The first wave, occurring primarily with the DELTA variant, transpired from 10 July 2021 to 26 October 2021, while the second wave featured the OMICRON variant of SARS-CoV-2 and extended from 1 December 2021 to 10 February 2022. In the period of longitudinal monitoring, a total of 3668 subjects actively participated in TERA.Bio® tests conducted twice weekly. Selection for participation was based on their residence hall on campus, and it was extended to encompass other students and staff who preferred not to undergo mid-nasal RT-qPCR testing. The monitoring testing was a key component in the comprehensive COVID-mitigation strategy by enabling the isolation of individuals with SARS-CoV-2 infection. Moreover, it significantly contributed to the prompt and thorough contact tracing and quarantine procedures within the campus community.
Data collection encompassed a range of variables, including demographic and clinical parameters, anthropometric measurements, and the medical history of comorbidities. Additionally, participants were required to provide self-reported information regarding current and prior COVID infections, as well as any symptoms associated with COVID. The list of symptoms under investigation included cough, sore throat, shortness of breath, non-allergy related runny nose, loss or reduction of smell or taste, muscular pain, headache, fatigue, chills, sleepiness, and gastrointestinal (GI) symptoms such as vomiting, diarrhea, and abdominal pain.
For analytical purposes, the symptoms were grouped into four categories: “none”, “1 symptom”, “2–5 symptoms”, or “6 or more symptoms”.
2.2. Ethics
This study received approval from the University of Miami Institutional Review Board (IRB), along with the necessary approvals from ancillary committees responsible for overseeing the research. Informed consent was obtained from all participants involved in the studies (Clinical Study IDs 20201211 and 20210115).
2.3. Tera BioStation Breath Analyzer and RT-qPCR Sampling Protocol
During the pandemic, the University of Miami implemented a comprehensive COVID-19 surveillance program, mandating mid-nasal swab RT-qPCR testing for all campus residents. Students residing on campus were given the option to participate in a novel breath testing program using the Tera BioStation breath analyzer (TERA.Bio®, Herzliya, Israel). Those opting out of the breath test were required to undergo the standard nasal swab testing. Additionally, a select group of non-residential students, mandated for on-campus presence, were also included in the nasal swab testing protocol, with ten individuals opting for the breath test alternative.
An electronic consent (e-consent) process was utilized, leveraging the Research Electronic Data Capture (REDCap) system and electronic medical records for efficient and secure data management. This system ensured validated data capture and integrated seamlessly with the university’s existing health record systems [
13,
14].
Students consenting to the breath test were sent automated text reminders through the patient portal, prompting bi-weekly test scheduling. Non-compliance triggered follow-up reminders, with persistent non-compliance reported to the Dean of Students.
For operational efficiency, three testing sites were strategically located near student residential halls. The entire testing process, including consent registration, sample collection, and result notification, was streamlined to take approximately 10 min. Upon arrival at the testing site, students were provided with a QR-coded TeraTube (TERA.Bio®, Herzliya, Israel). for sample collection, instructed to blow into the tube thrice, seal it, and hand it over for immediate analysis. The TERA.Bio® delivered results within three minutes, categorizing them as “clear”, “not clear”, or “retest”.
Results were promptly recorded in the electronic medical record system and communicated to students via SMS. In cases where results were “not clear” or “retest”, students were directed to undergo an additional FDA-authorized COVID-19 test. A “not clear” breath test result necessitated an immediate on-site mid-nasal RT-qPCR test for a conclusive diagnosis.
Support for the testing process was available around the clock through a dedicated phone line and email, staffed by the university’s screening team. The location of testing sites and the streamlined protocol were designed to ensure minimal disruption to student routines while maintaining efficient and effective campus-wide surveillance.
2.4. Terahertz (THz) Spectroscopy Overview
Terahertz (THz) spectroscopy is a powerful technique used to investigate the properties of materials using electromagnetic waves in the terahertz frequency range (0.1 to 10 THz). This technology is particularly valuable in biomedical imaging, material characterization, and non-destructive testing, due to its ability to penetrate various materials without causing ionization. Several THz spectroscopic techniques exist, each differing in their operational principles and resolution.
Terahertz Time-Domain Spectroscopy (THz-TDS) operates by measuring the time delay of terahertz pulses as they pass through a sample. This technique typically offers a resolution of up to 10 GHz and is widely used for detailed analysis of electromagnetic properties such as absorption coefficient, refractive index, and dielectric constant.
Frequency-Domain Spectroscopy (FDS) measures the absorption and phase shift of continuous-wave terahertz radiation as a function of frequency. FDS systems generally achieve resolutions better than 50 MHz and are particularly useful for the detailed analysis of material properties over a wide range of frequencies.
Terahertz Emission Spectroscopy detects and measures the THz radiation emitted by a sample when excited by a laser. This method operates with a resolution in the range of a few GHz and is commonly used for analyzing the emission characteristics of semiconductor materials and devices.
2.5. THz Technology in the Tera BioStation T101
THz radiation has an expanding range of applications, which utilizes its special properties.
One can find this spectral range useful for many applications, such as general imaging; non-destructive-tests (NDT); biomedical imaging; spectroscopy; defense and national security; remote sensing; and even communication. The underlying technology of the TERA breath analyzer, which employs Terahertz Impedance Spectroscopy for detecting biological nanoparticles, has been previously described [
15].
A major advantage of THz radiation is that it is characterized by low energy; hence, it does not cause the ionization of biomolecules. Moreover, this property of low photon energy enables us to interact with many materials via several mechanisms, and it opens a window to many interactions. These mechanisms include phonons and weak bond vibrations and, thus, are unique to chemical and physical compositions.
This characteristic of non-ionized low photon energy has a significant potential in medical diagnosis and medical treatments. It has unique bio-fingerprints such as VOCs, viruses, bacteria, etc.
In this study, the Tera BioStation T101 employs Frequency-Domain Spectroscopy (FDS) as its core technology. The FDS system in the Tera BioStation T101 is designed to capture and analyze the spectral signatures of biomaterials by measuring the absorption and phase shift of terahertz waves as they interact with the breath samples. This allows for the identification of complex patterns associated with the presence of SARS-CoV-2, making it an effective tool for non-invasive COVID-19 detection.
2.6. System Description
The breath analysis tests were carried out via a portable electronic station named the Tera BioStation T101. The endogenic and exogenic bio-materials of respiratory aerosols are collected in a single use accessory device named a TeraTube and then inspected by the Tera BioStation T101.
Using integrated THz technology, the Tera BioStation T101 diagnostic platform, through its AI algorithm, can distinguish between healthy and suspected infected patients. Its advantage is in the combination of spectral signatures of biomaterials (using the spectroscopy system performed by the THz system) in the THz spectral bandwidth and the uniq AI algorithm, which was developed by Tera Ltd.
The main components of the “BioStation” include two distributed-feedback class IIIB lasers, electric temperature control units, a control unit, a power unit, and a set of two photo-mixers. The two laser beams are combined, creating a beating phenomenon. This beating then modulates a photocurrent at a tuned THz frequency, illuminating the photo-mixers. The THz beam travels from the photo-mixer transmitter through the “Teratube” sample, and the signal is received at the photo-mixer receiver. This signal is then analyzed and associated with the algorithm to provide an answer.
2.7. Statistical Analyses
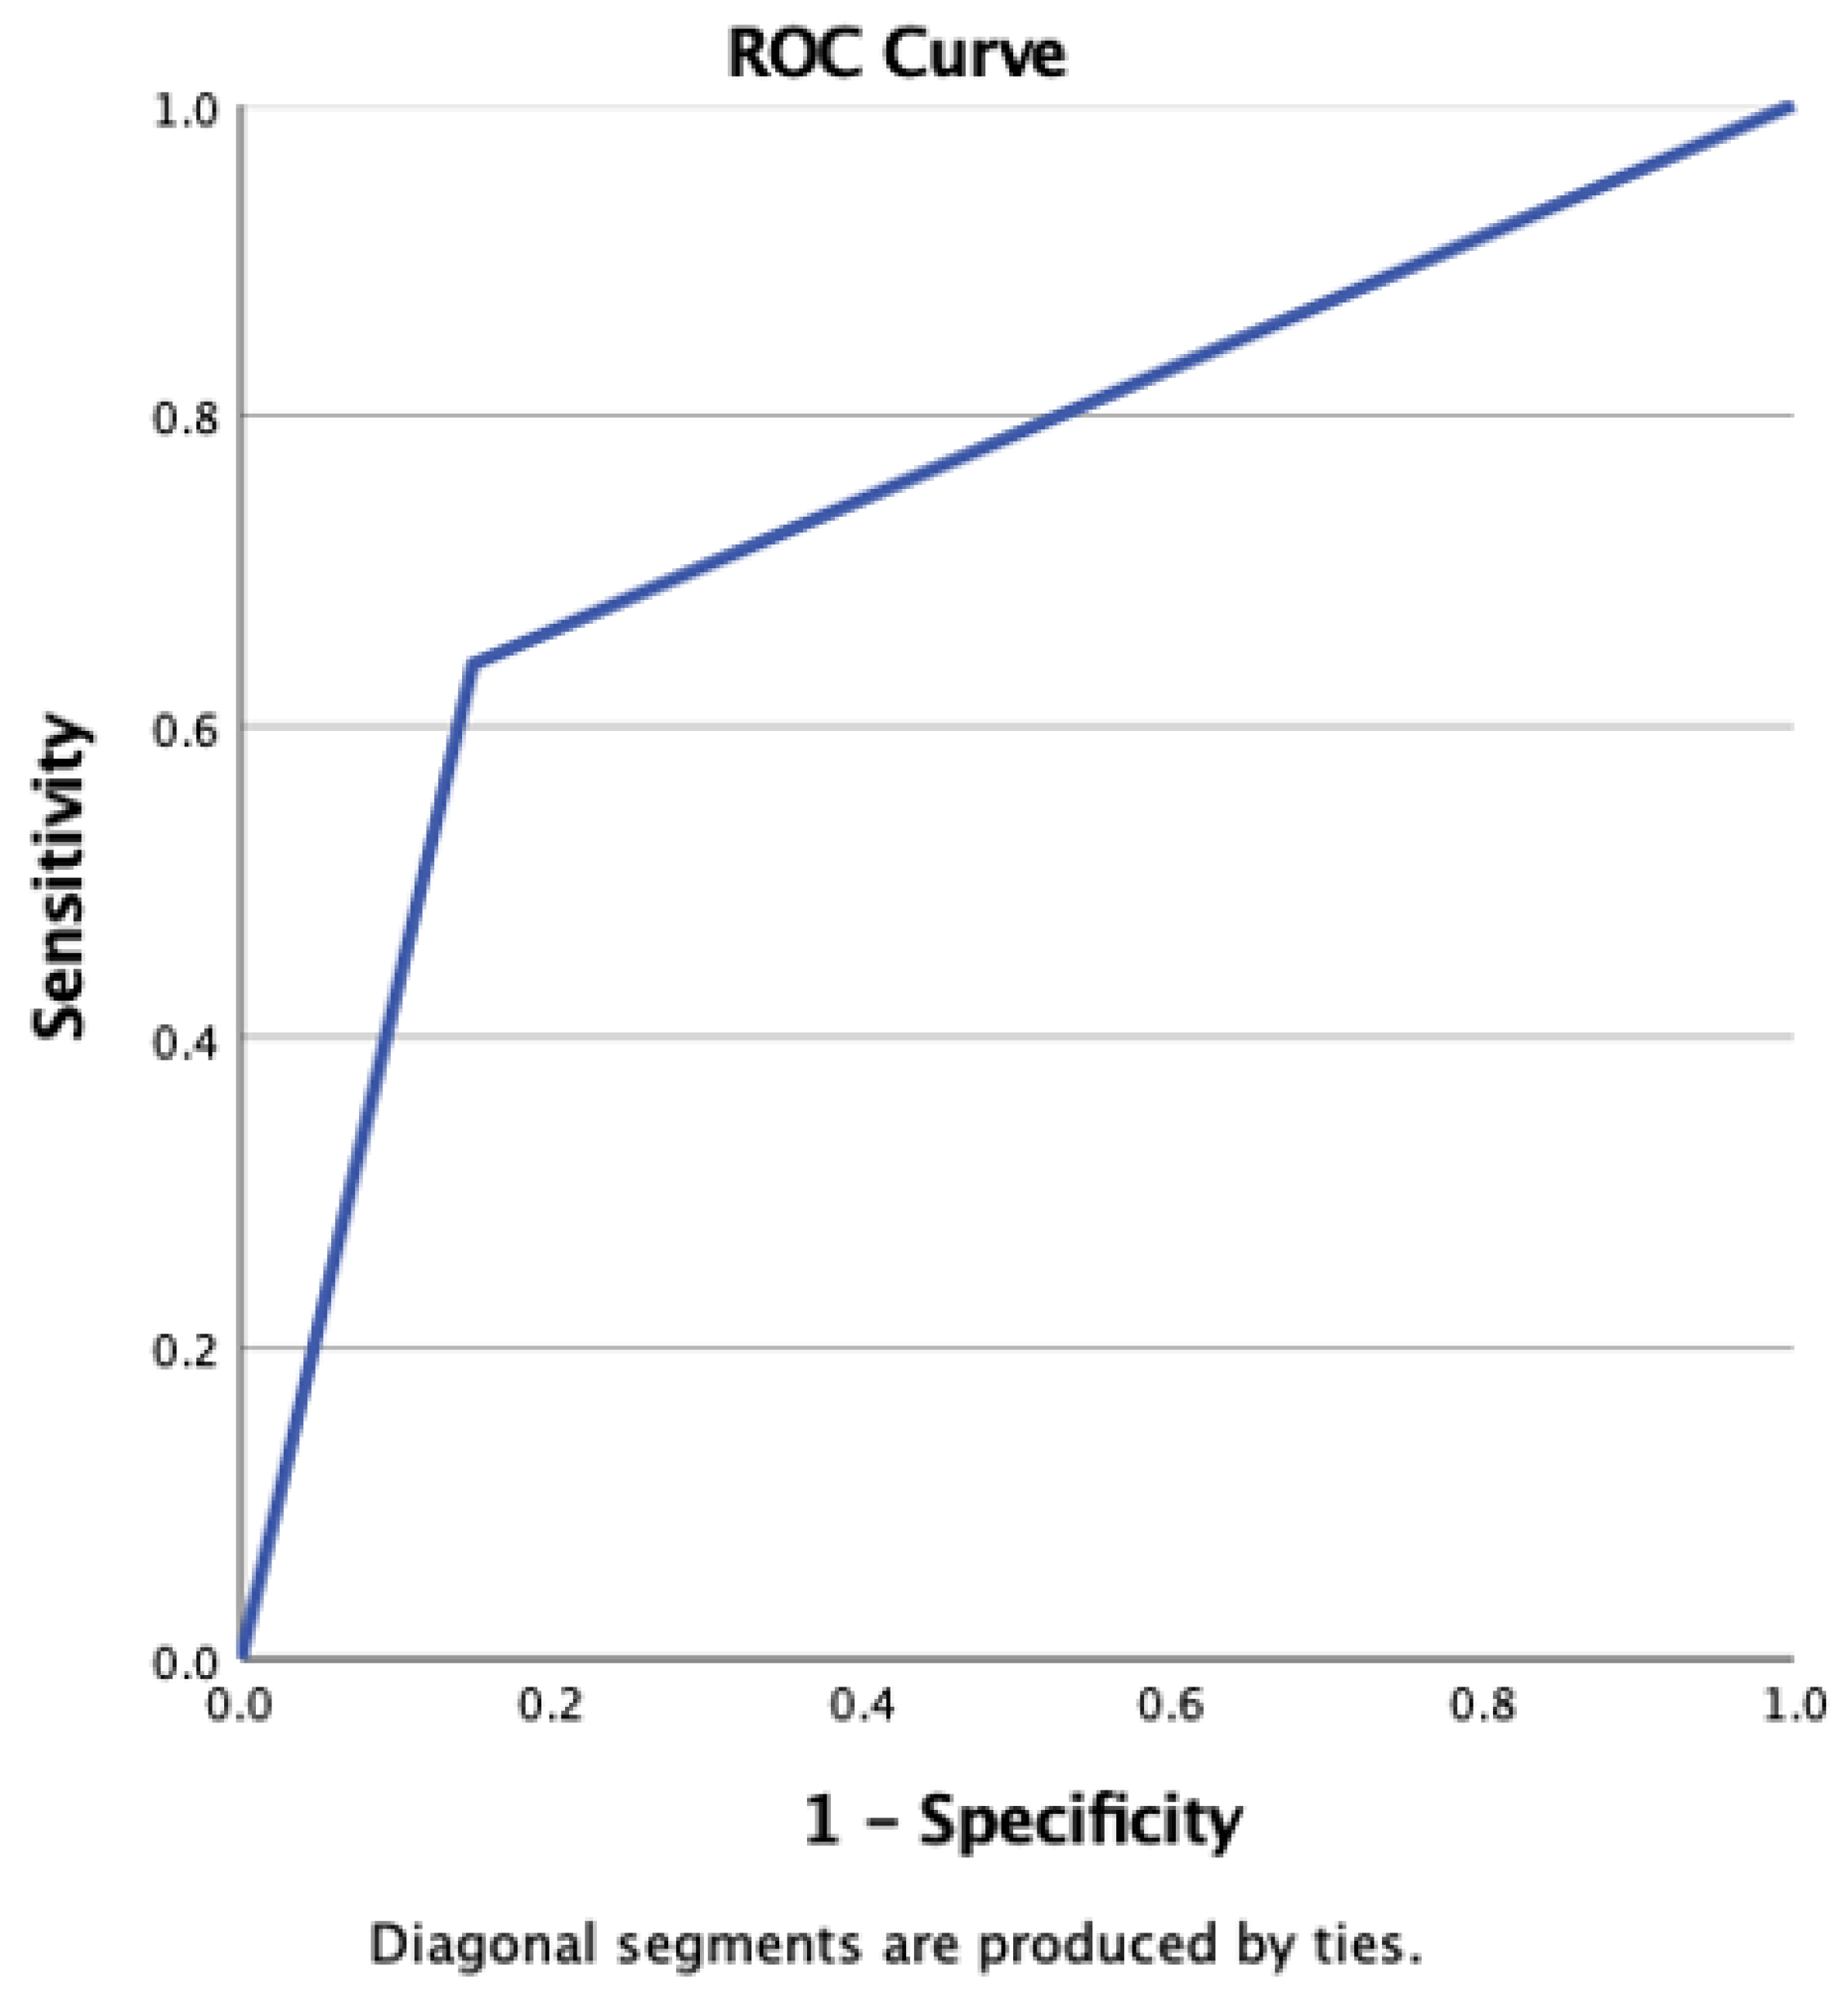
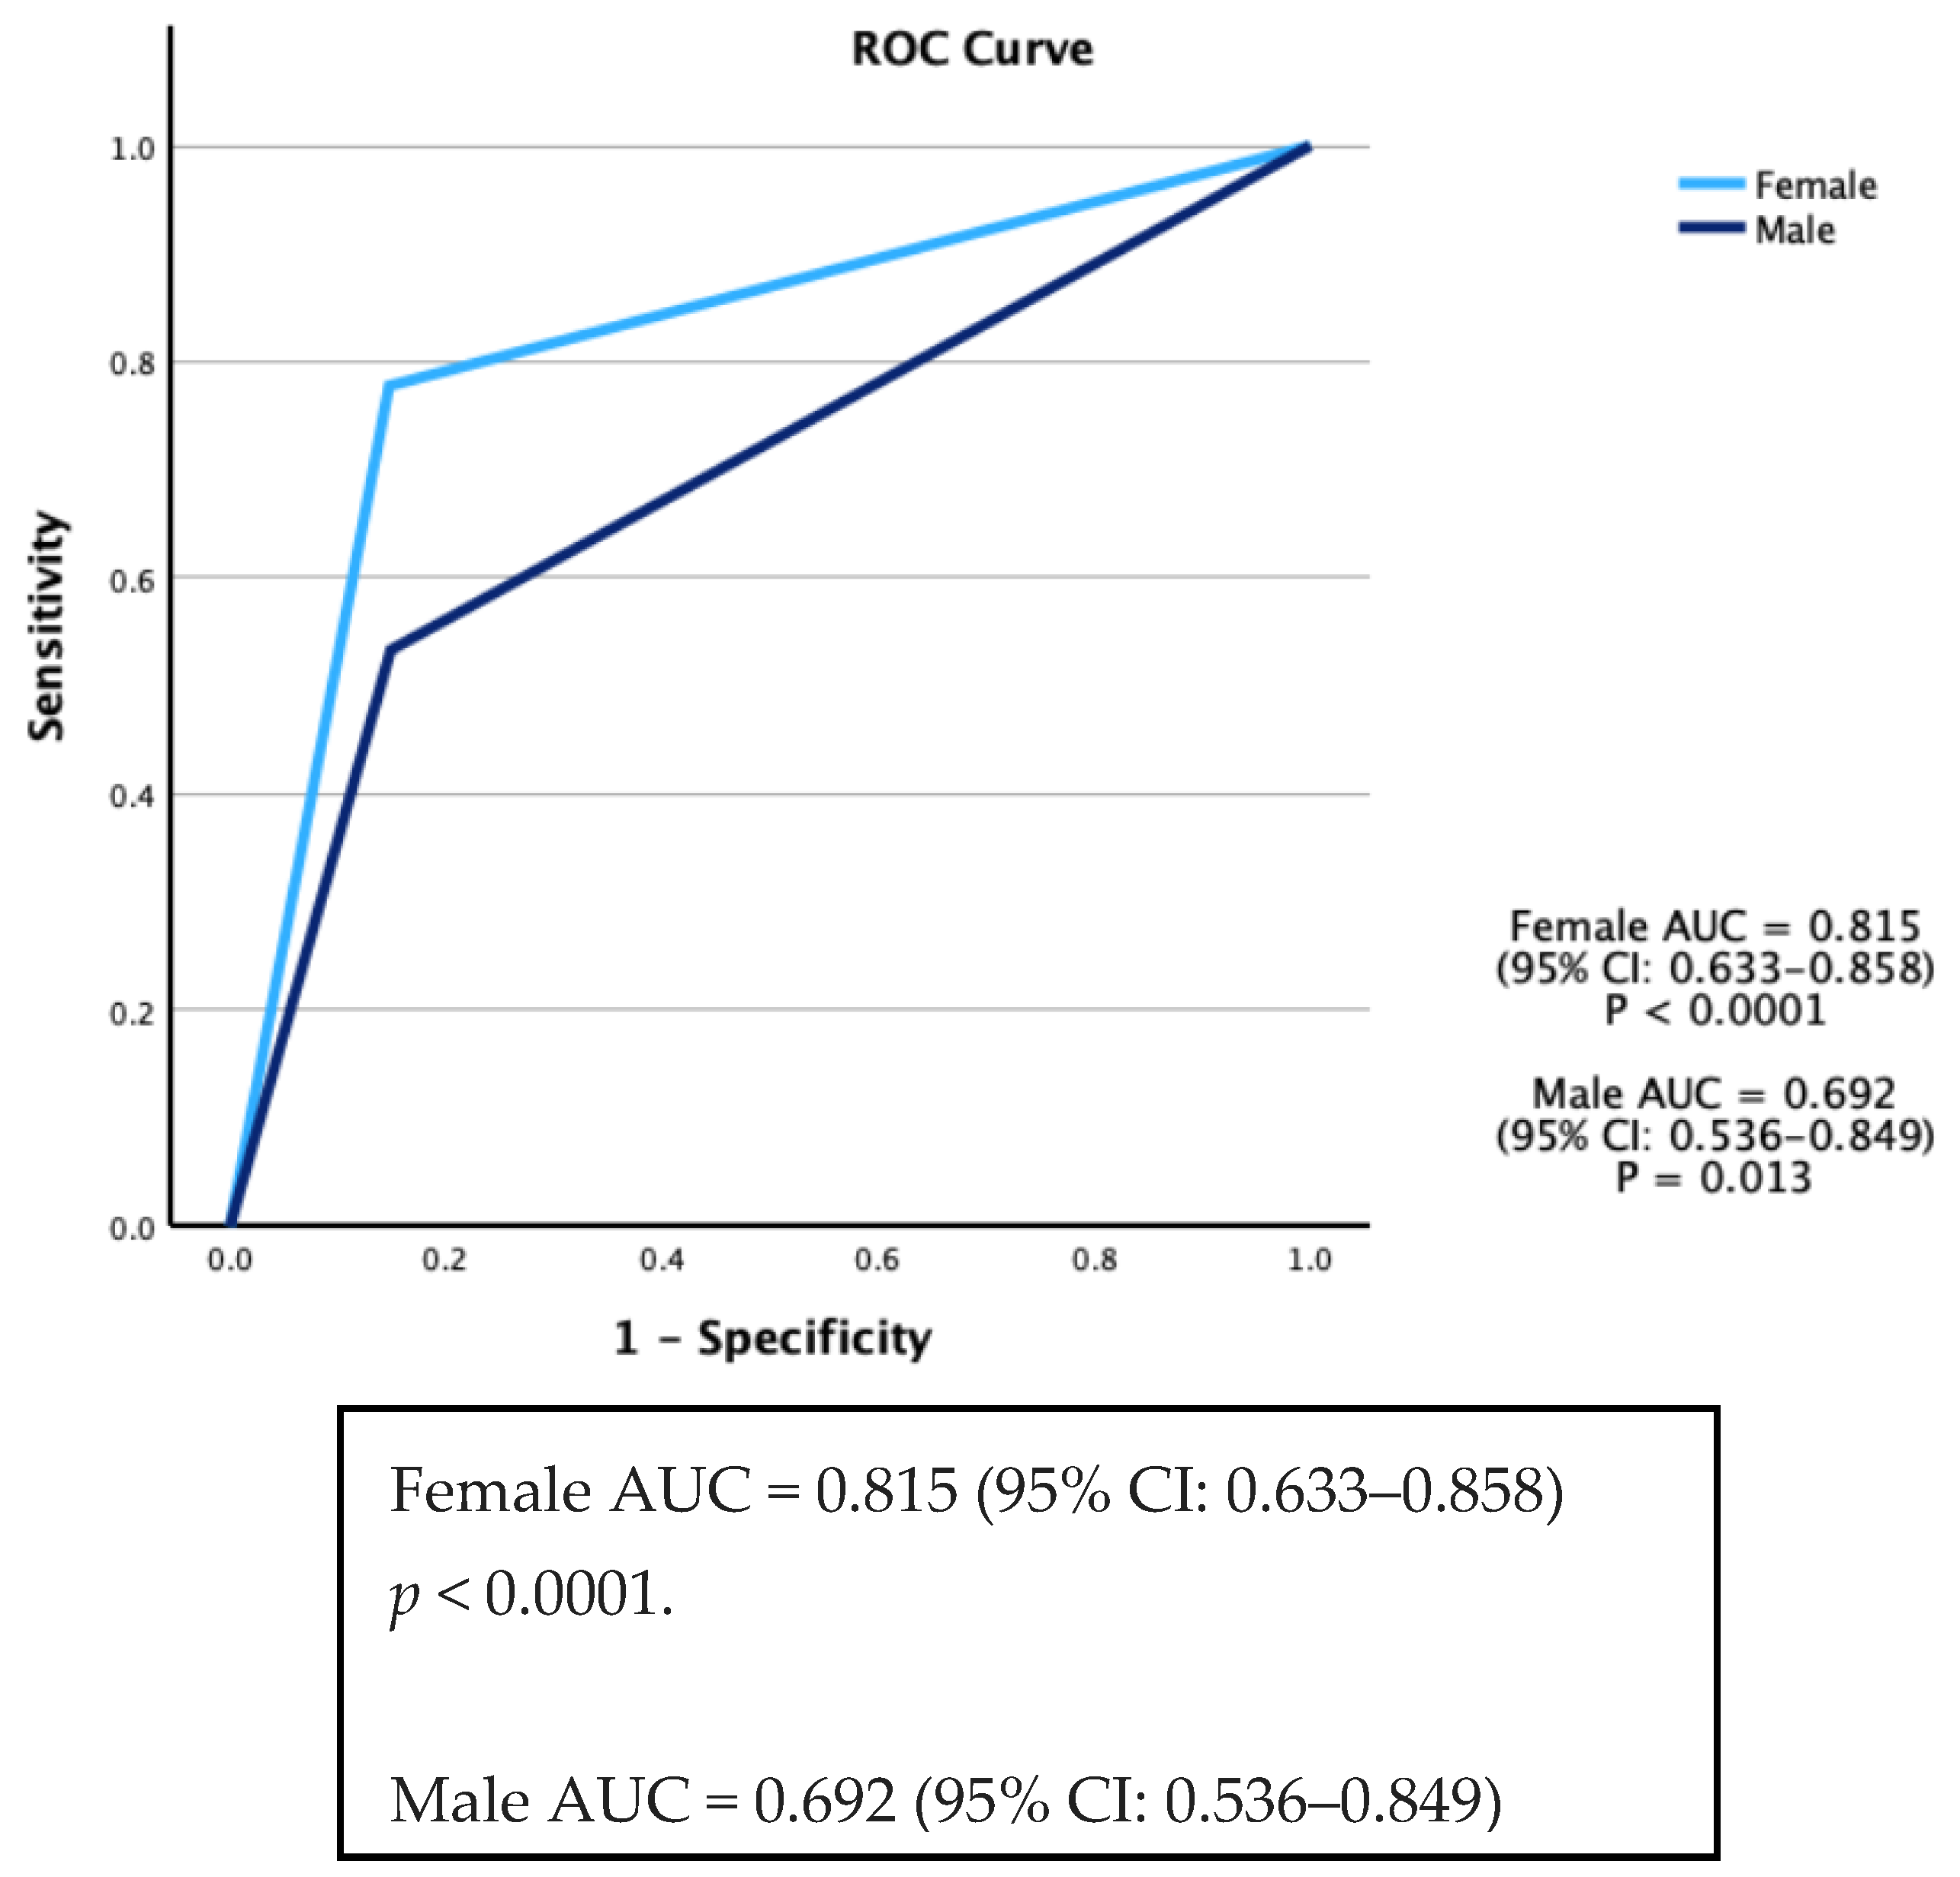
Continuous variables are presented as either mean ± standard deviation (SD) or median and interquartile intervals (25th–75th), depending on the distribution of the data. Statistical comparisons for these variables were performed using the t-test or rank sum test, as deemed appropriate. For the assessment of associations among categorical variables, the χ2 test or Fisher’s exact test was employed. Sensitivity and specificity were defined as the ability of a test to accurately identify individuals who were either SARS-CoV-2 positive (True Positive rate) or SARS-CoV-2 negative (True Negative rate). To evaluate the validity of the TERA.Bio® test with RT-qPCR tests as the gold standard, the Area under the Curve (AUC) of the Receiver Operating Characteristics (ROCs) was calculated. The Youden index (J) was calculated for each threshold value of the TERA.Bio® test when compared with the gold standard RT-qPCR. The threshold that maximizes the Youden index was identified as the optimal cut-off point for the TERA.Bio® breath analyzer. Adjusted ROC curves were constructed using a logistic regression procedure, treating the state variable as the dependent variable and including selected covariates. Predicted probabilities were saved as a variable for subsequent use in ROC analysis. Covariates used in this model comprised sex, age, and current and past smoking status.
Statistical significance was defined as a p-value less than 0.05 for all analyses. The data were analyzed using IBM SPSS® v28.0 (New York, NY, USA).
2.8. Role of Funders
The funding and the support for this study were jointly provided by the University of Miami and the Tera Grant Initiative. The funders played a crucial role in facilitating the research by providing the necessary financial support and resources. However, they had no involvement in the study design, collection, analysis, or interpretation of data. The preparation of this manuscript, including the writing and decision to submit it for publication, was conducted independently by the research team. All aspects of the research were performed with full academic freedom, and the funders did not influence the study outcomes or the conclusions drawn by the researchers. The integrity and objectivity of the research were maintained throughout, ensuring that the findings and conclusions presented in this study are solely those of the authors.
4. Discussion
This study employed two approaches, involving both a validation phase and a prospective cohort for longitudinal monitoring (surveillance), encompassing a total of 3619 participants. The results from this validation study showed that the Real-Time High-Throughput Breathalyzer is a reliable tool for detecting SARS-CoV-2 in individuals within a university population. It exhibited an overall sensitivity of 64% and a specificity of 85.1%. These performance characteristics align with those reported in previous studies that focused on rapid and self-tests utilizing antigen-based diagnostics, especially when compared to self-testing conducted on the same day as RT-qPCR sampling [
16].
The first breath analyzer approved under an emergency use authorization by the US FDA for COVID-19 was the InspectIR COVID-19 Breathalyzer employing gas chromatography and mass spectroscopy (GC–MS). It showed high accuracy in detecting COVID-19 and its Omicron variant through breath analysis [
17]. Since then, other studies have also demonstrated the potential of breath analysis in detecting SARS-CoV-2 infections among patients with moderate to severe cases who are receiving treatment in hospitals or intensive care units [
18,
19,
20]. Grassin-Delyle et al. [
21] also published a study in
EBioMedicine, where they analyzed distinct VOCs in the breath of mechanically ventilated adults suffering from COVID-19. This breath signature was then contrasted with a control group of ventilated patients who had acute respiratory distress syndrome but not COVID-19. Recently, the feasibility of using UV spectroscopy on exhaled breath was demonstrated, specifically analyzing carbonyl VOCs, to distinguish COVID-19 positive individuals, highlighting the potential of breath analysis as a rapid, non-invasive diagnostic tool for the disease [
22].
Additionally, breath analysis had shown promise in identifying individuals with mild symptoms who are infected with the virus [
23]. However, the technology employed in these studies involves GC–MS. It is important to note that TERA.Bio
® technology and GC–MS are distinct analytical techniques. While GC–MS focuses on the specific VOCs present in breath samples, the TERA.Bio
® operates by identifying patterns and features associated with COVID-19 materials (complexes) within the spectrum. In comparison to liquid chromatography–mass spectrometry, the TERA.Bio
® breath analyzer offers several advantages, including rapid results (usually in under 5 min from registration to result), the ability to operate without the need for medical personnel, and cost-effectiveness. These attributes make TERA.Bio
® technology a practical choice for widespread population testing and monitoring during a pandemic.
A breath analyzer, when used in conjunction with rigorous contact tracing, swift isolation, and quarantine procedures, and under the guidance of a collaborative leadership structure that facilitates quick decision making and adaptation to emerging data, plays a vital role in curbing the spread of SARS-CoV-2 within a university environment [
15].
These components form the foundation for ongoing monitoring and operational feasibility, even in the face of worsening local transmission throughout the semester. In the case of COVID-19 transmission, the surveillance phase applied in this study encompassed a comprehensive strategy that involved testing, contact tracing, and the efficient management of isolation and quarantine measures, effectively controlling COVID-19 transmission within the university setting.
One limitation of the study was the difficulty in seamlessly integrating the results of the TERA breath analyzer with individual participant records. The TERA machine, a stand-alone device, lacks connectivity with other systems and does not retain any participant information, posing a significant challenge in data management and analysis. To overcome this, the study utilized the electronic medical record system’s capability to scan the QR code on the testing tube specimen. This approach enabled the researchers to link each breath test specimen directly to the respective medical record.
During the study period, vaccination efforts against COVID-19 were in full swing across the United States, including in Miami-Dade County. By mid-2021, approximately 60–70% of the eligible population in the region had received at least one dose of a COVID-19 vaccine. Within the study cohort, a significant number of participants were vaccinated, particularly among university staff and older students, which may have influenced the results. Vaccination has been shown to reduce the severity of COVID-19 symptoms and lower viral load, potentially affecting the sensitivity of detection methods such as the TERA.Bio® breath analyzer. However, the influence of vaccination on the breathalyzer’s performance was not directly assessed in this study. It is worth noting that vaccinated individuals may exhibit lower concentrations of viral biomarkers in their breath, which could lead to reduced sensitivity in non-invasive tests like the TERA.Bio®. Further studies are recommended to explore the interaction between vaccination status and breath analysis results, particularly in the context of new and emerging variants of concern.
A significant strength of this study is its large sample size, which offered a comprehensive representation of the university population, thereby providing valuable insights into the efficacy of the TERA breath analyzer in a real-world environment characterized by high population density, thereby underscoring the utility of this approach in managing pandemic situations in similar settings.
The TERA.Bio® breath analyzer also offers significant advantages in terms of cost-effectiveness and operational efficiency, particularly in large-scale testing environments like universities. One of its key benefits is its non-invasive nature, requiring only a simple breath sample, which reduces the risk of cross-contamination and eliminates the need for physical contact, unlike Rapid Antigen Tests (RATs). The system provides rapid results within 5–10 min from sample collection, significantly faster than the 25 h typically required for RT-qPCR tests and often quicker than some RATs. Additionally, the direct cost per test for the TERA.Bio® system is approximately $5.00, which is considerably lower than the $30.00 per test for mid-nasal RT-qPCR testing. This cost advantage becomes particularly important in scenarios where frequent testing is necessary on a large scale, such as in university settings with thousands of tests conducted weekly. The ease of use is another critical factor, as the TERA.Bio® system does not require specialized personnel for test administration, allowing students and staff to self-administer the breath test with minimal training. These factors combine make the TERA.Bio® breath analyzer a practical and cost-effective choice for continuous surveillance in large populations, especially where rapid decision making and immediate isolation of potential cases are essential.


