Figure 1.
Outline of the study including tested variables and characterization of freeze-dried L. reuteri R2LC.
3.1. Effects of Experimental Factors on Physicochemical Properties of Lyophilized R2LC
The effects of varying the selected experimental factors (type and concentration of lyoprotectant, bacterial concentration, and freeze-drying program) on the measured physicochemical outcomes are summarized in
Table 1,
Table 2,
Table 3,
Table 4 and
Table 5 and
Figure 2,
Figure 3,
Figure 4,
Figure 5 and
Figure 6. Statistically significant differences, including the associated effect sizes (η
2p) are highlighted in the tables and detailed post hoc tests are included in the
supplementary data sheets.
Table 1.
Main effects and interactions of the experimental factors affecting water content. p-values in bold indicate statistically significant effects.
Table 1.
Main effects and interactions of the experimental factors affecting water content. p-values in bold indicate statistically significant effects.
| Factors | F | p | η2p |
|---|
| Lyoprotectant type | 14.495 | 0.004 | 0.617 |
| Annealing | 6.035 | 0.036 | 0.401 |
| Lyoprotectant concentration | 33.819 | <0.001 | 0.883 |
| Bacterial concentration | 27.711 | <0.001 | 0.755 |
| Lyoprotectant × Annealing | 5.326 | 0.046 | 0.372 |
| Lyoprotectant × Lyoprotectant concentration | 9.511 | 0.006 | 0.679 |
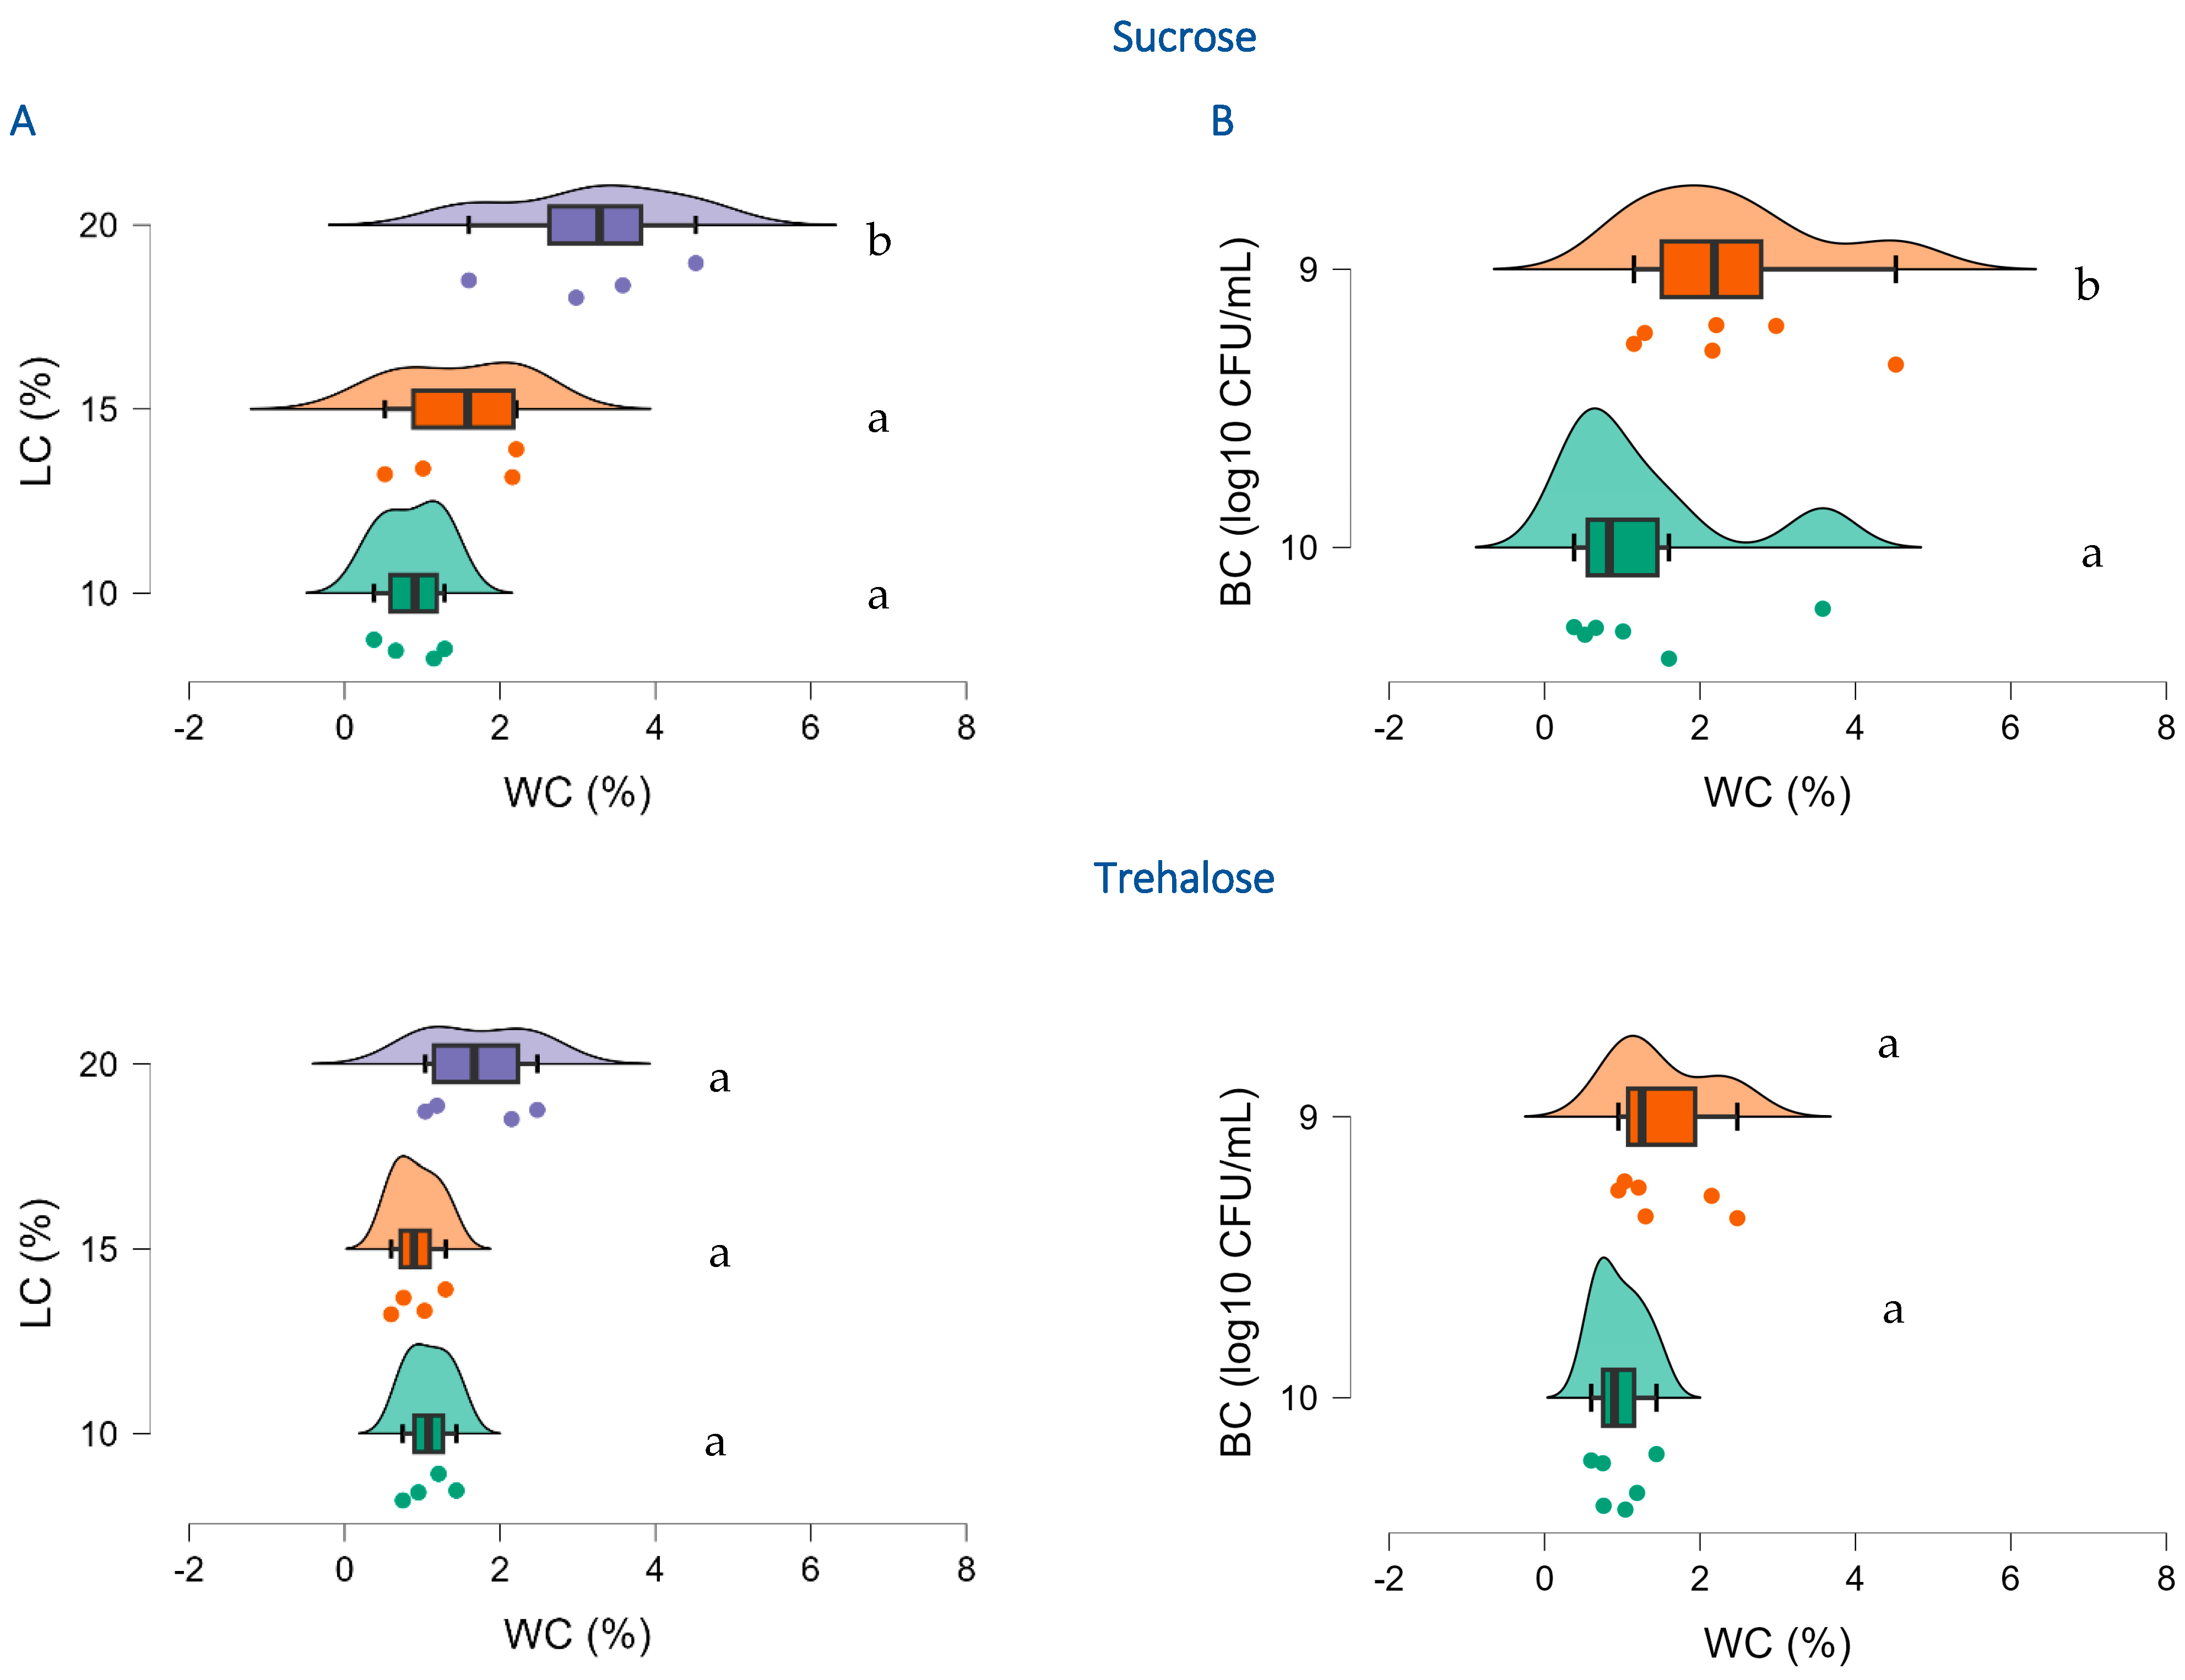
All factors significantly affected the water content of freeze-dried R2LC, and in particular using the highest concentration of sucrose (20%) gave an elevated water content (t = 0.271,
ptukey = 0.004) (
Figure 2 and
Table S3). Also, the concentration of bacteria had an impact and 10
9 CFU/mL resulted in significantly higher water content than 10
10 CFU/mL using sucrose (t = 4.933,
ptukey = 0.004) as lyoprotectants (
Figure 2). Furthermore, annealing resulted in significantly elevated water content in the highest (20%) sucrose concentration (t = 10.829,
ptukey = 0.047).
Figure 2.
Effect of lyoprotectant concentration (A), bacterial concentration (B) and type of lyoprotectant (sucrose and trehalose) on water content of freeze-dried R2LC. LC: Lyoprotectant concentration; BC: Bacterial concentration, and WC: Water content. Datasets with different letters are significantly different (p < 0.01; data presented in A,B are not compared). (A): violet represents 20%, orange 15% and green 10% lyoprotectant concentration, respectively; (B): orange represents 109 CFU/mL and green 1010 CFU/mL R2LC.
ANOVA revealed significant effects of lyoprotectant type and bacterial concentration on glass transition temperature (Tg) (
Table 2 and
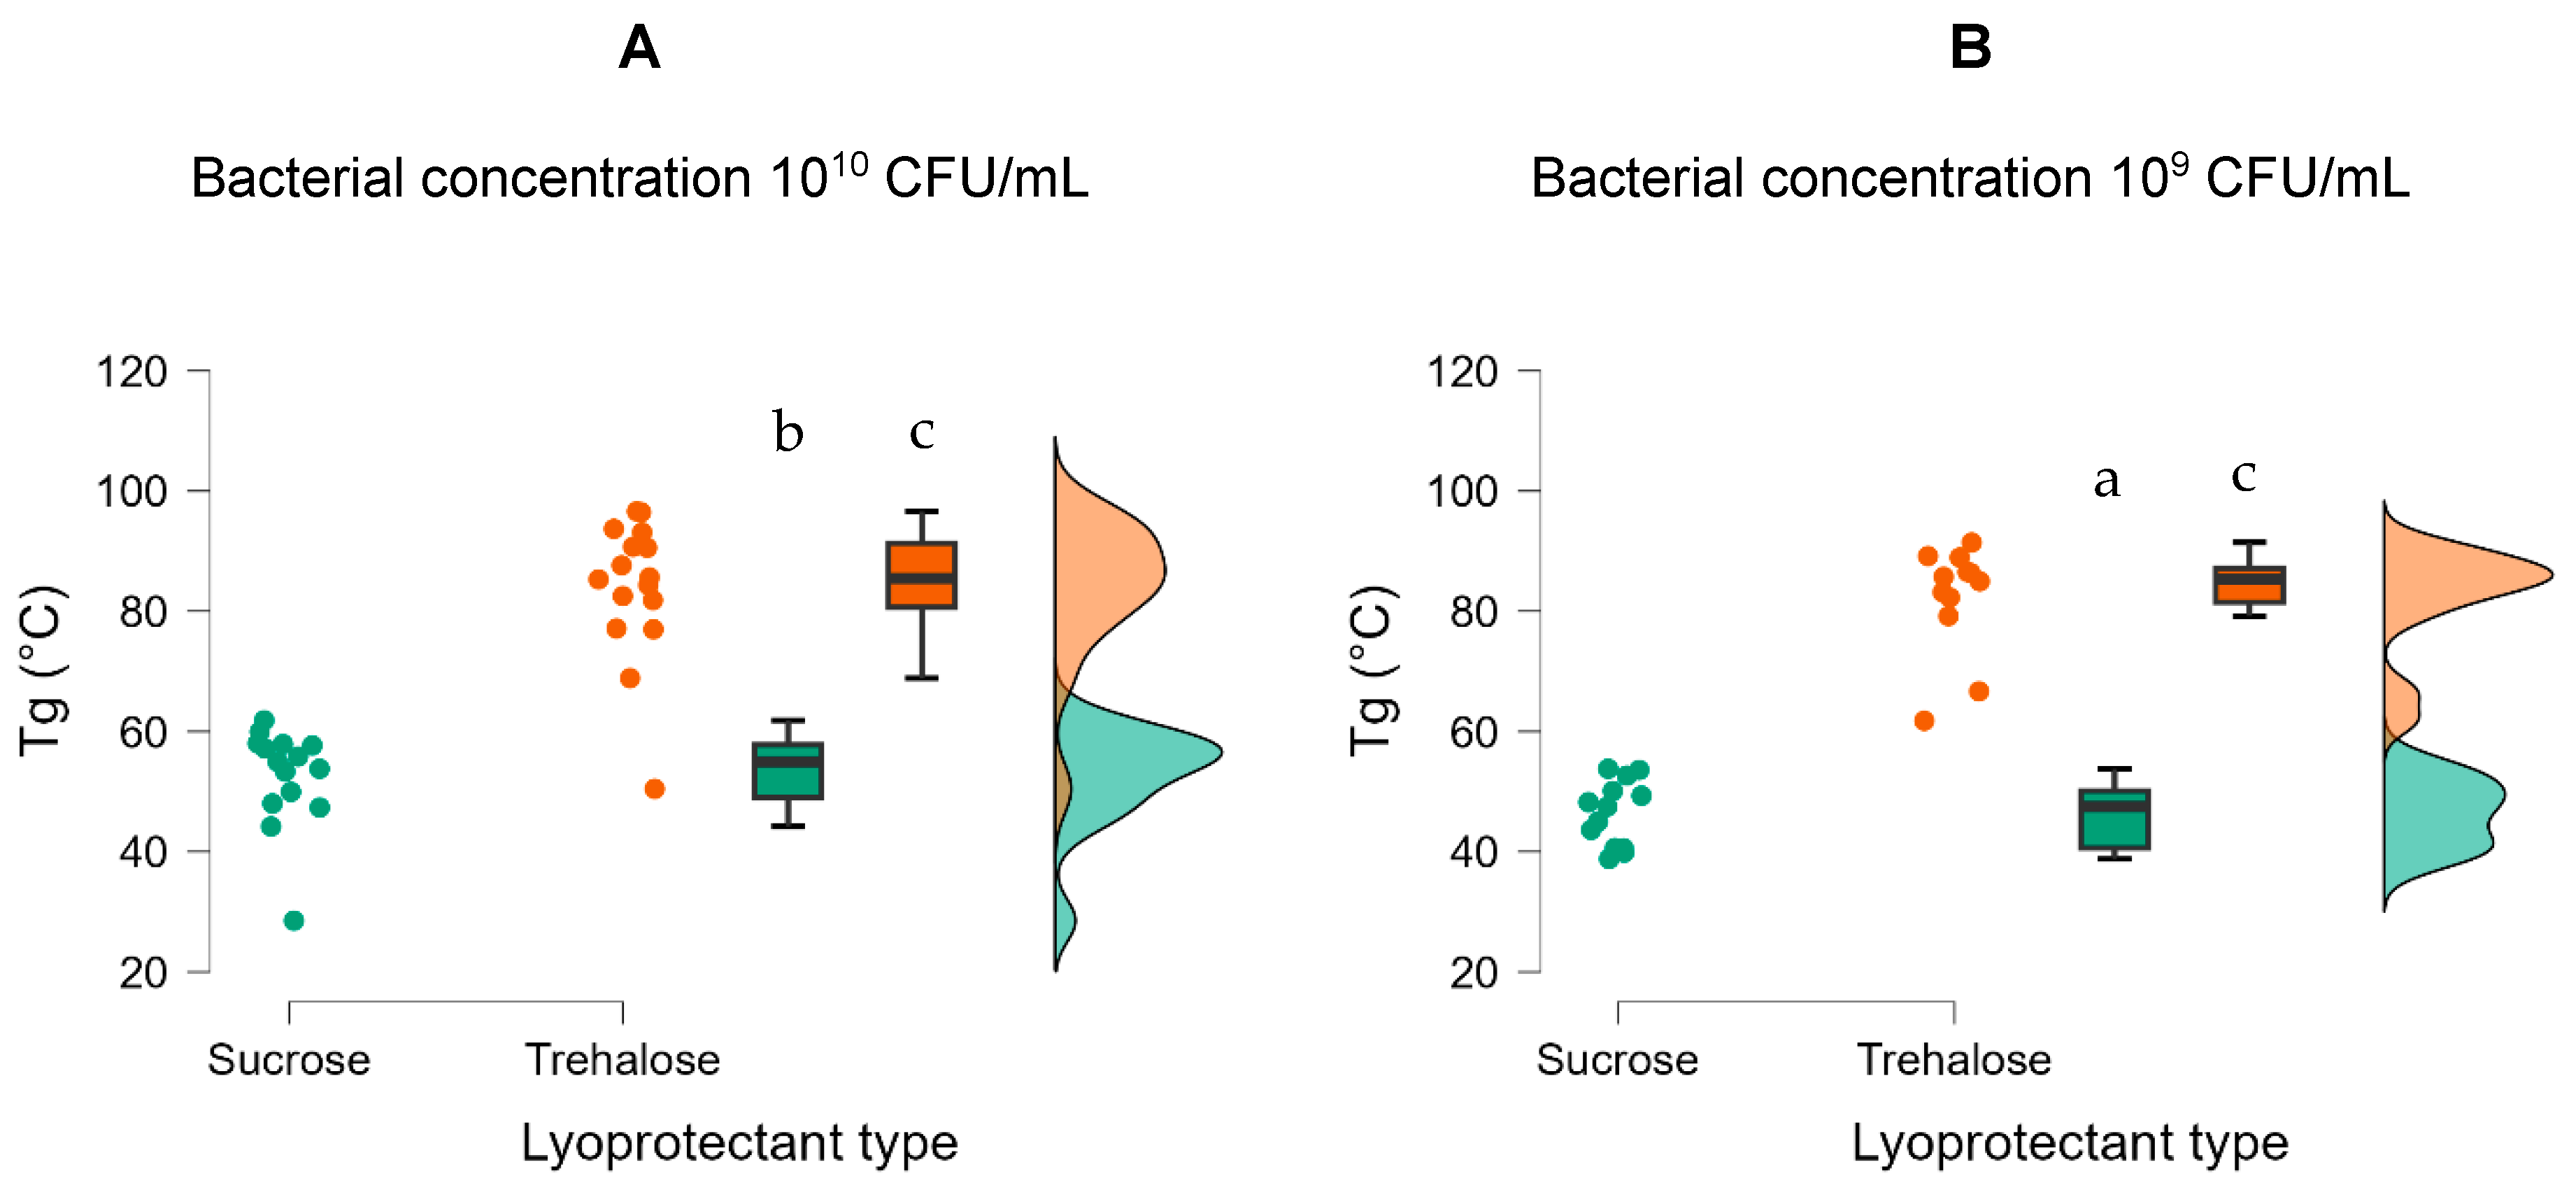
Table S4). The Tg for the samples containing trehalose was around 30–40 °C higher than for samples with sucrose (
Figure 3). Post hoc analysis showed that the type of lyoprotectant had a large impact on the glass transition temperature, where trehalose resulted in a significantly higher Tg than sucrose (t = 15.930,
ptukey < 0.001) (
Figure 3). In addition, the concentration of bacteria had a significant (
ptukey = 0.010) effect on the glass transition temperature (
Table 2 and
Figure 3). Also, a significantly higher Tg was observed at high (10
10 CFU/mL) concentration of both sucrose and trehalose (
Figure 3B).
Table 2.
Main effects and interactions of the experimental factors affecting glass transition temperature (Tg) of freeze-dried R2LC. p-values in bold indicate statistically significant effects.
Table 2.
Main effects and interactions of the experimental factors affecting glass transition temperature (Tg) of freeze-dried R2LC. p-values in bold indicate statistically significant effects.
| Factors | F | p | η2p |
|---|
| Lyoprotectant type | 253.768 | <0.001 | 0.861 |
| Annealing | 0.462 | 0.500 | 0.011 |
| Lyoprotectant concentration | 1.467 | 0.243 | 0.067 |
| Bacterial concentration | 7.305 | 0.010 | 0.151 |
| Annealing × Bacterial concentration | 10.298 | 0.003 | 0.201 |
| Lyoprotectant concentration × Bacterial concentration | 4.422 | 0.018 | 0.177 |
Figure 3.
Effect of high (A) and low (B) bacterial concentration and type of lyoprotectant on glass transition temperature of freeze-dried R2LC. Datasets with different letters are significantly different (p < 0.01; data presented in A,B are compared). Green represents samples with sucrose and orange represents samples with trehalose as lyoprotectant.
The lyoprotectant type, lyoprotectant concentration, and bacterial concentration significantly impacted the aggregation of freeze-dried R2LC (
Table 3). Post hoc analysis revealed that the difference between sucrose and trehalose was statistically significant t = −2.329,
ptukey = 0.022 (
Table S5). Also, the higher concentration of bacteria (10
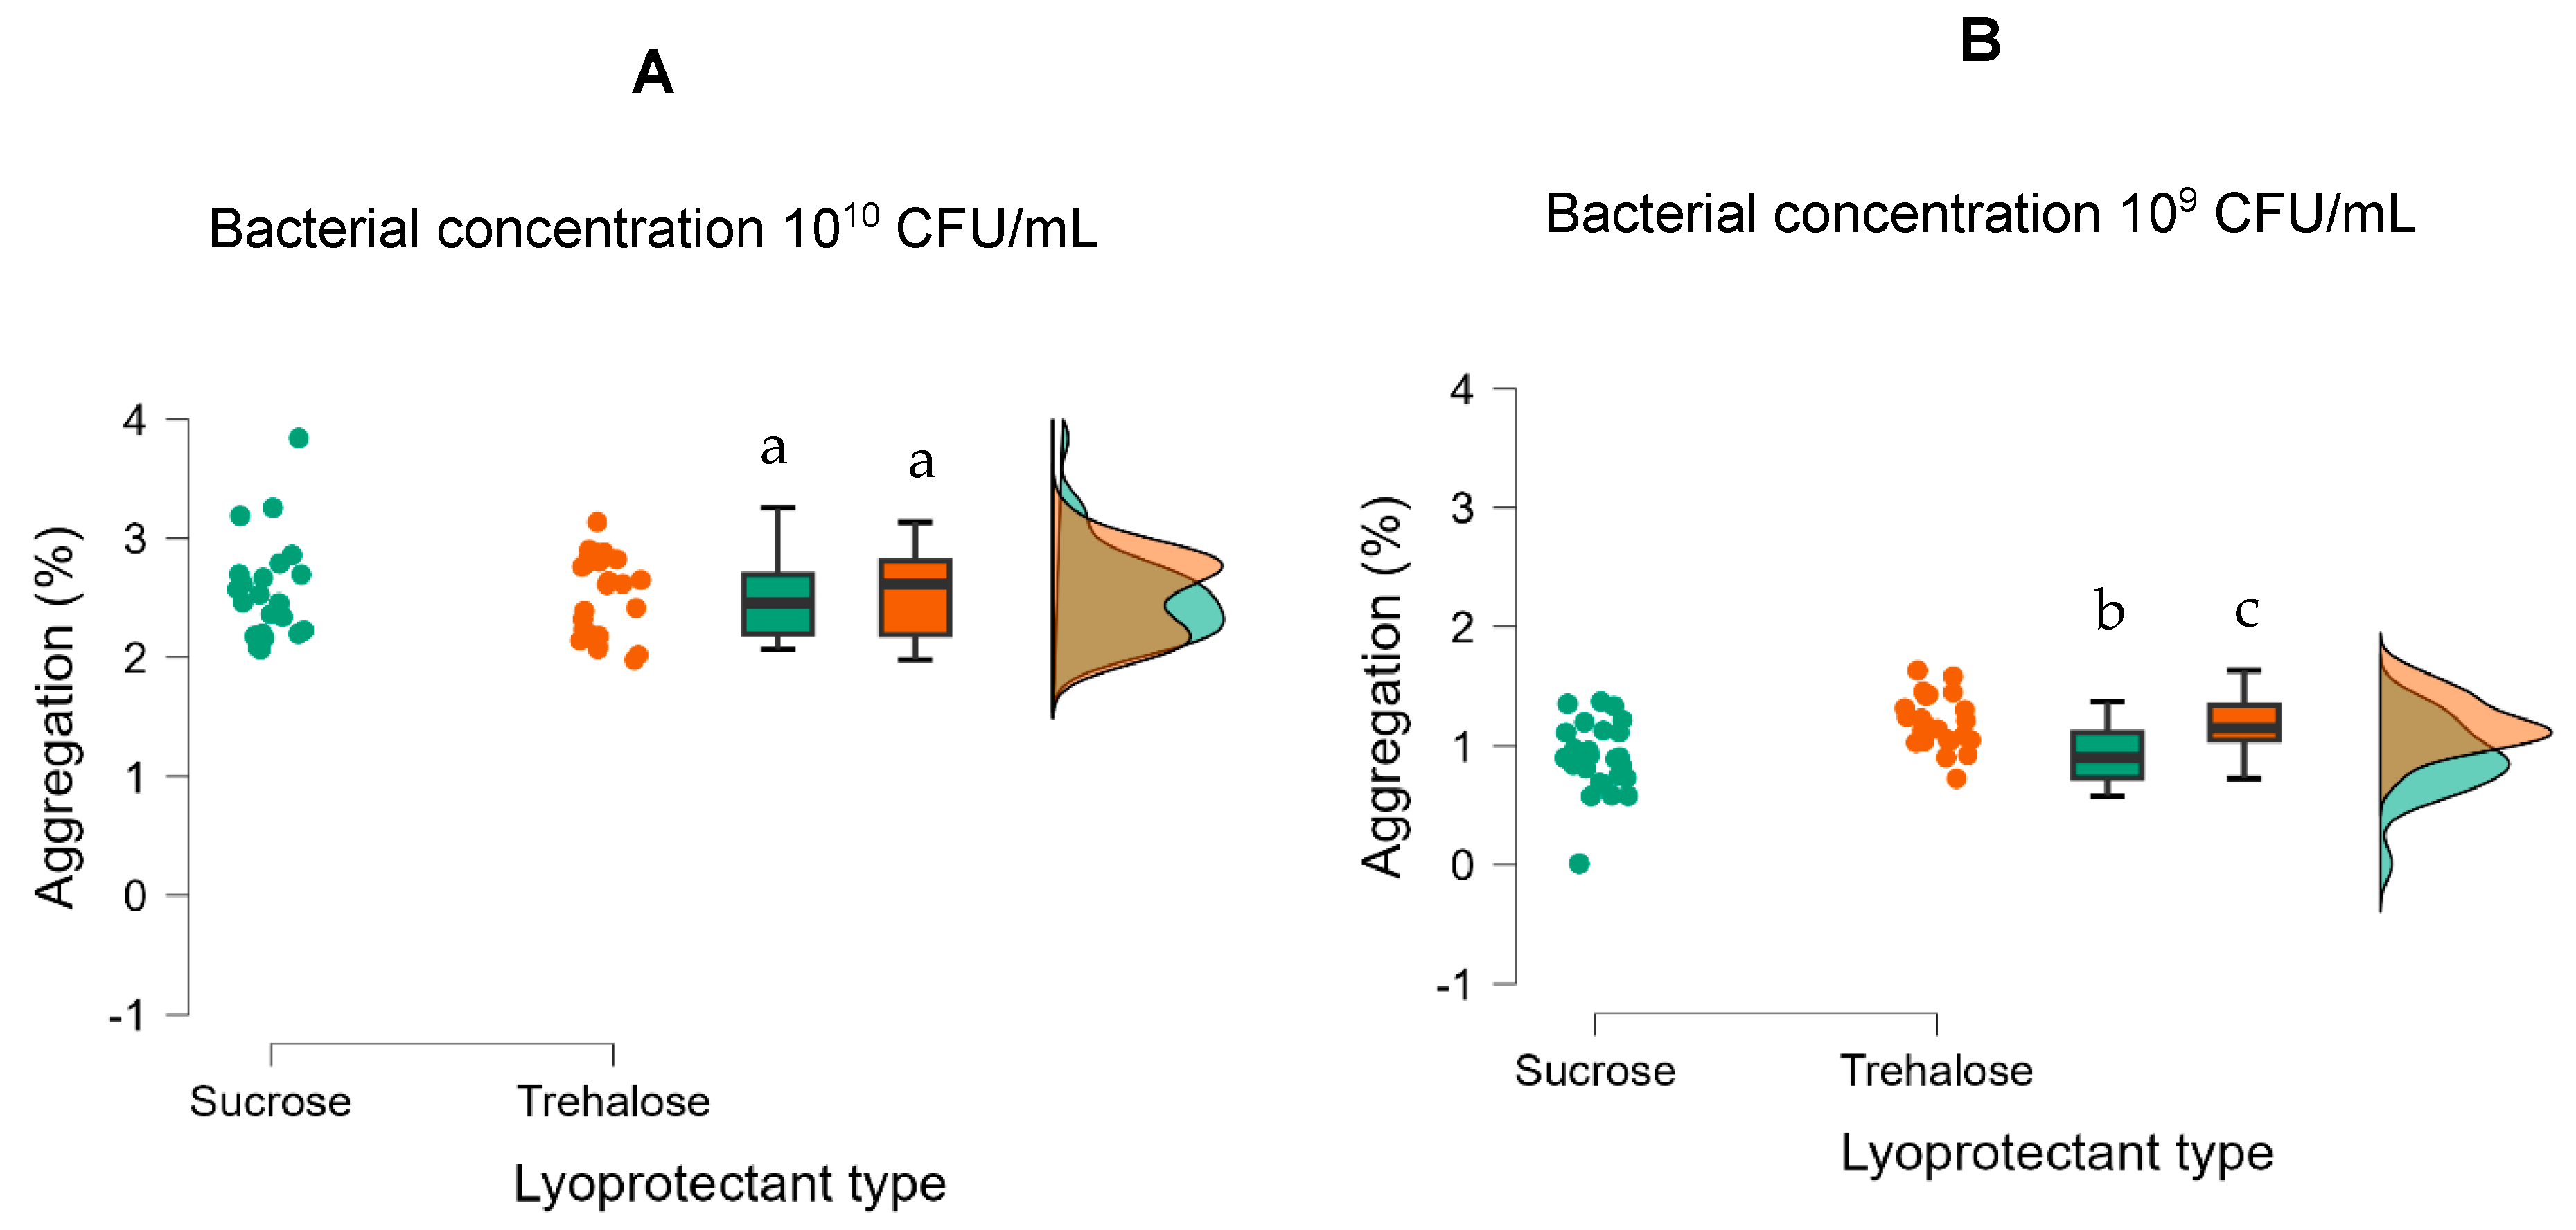
10 CFU/mL) promoted aggregation and gave approximately 2 times more aggregates than for the lower concentration of bacteria, when using formulations with both sucrose (t = 19.757,
ptukey < 0.001) and trehalose (t = 15.634,
ptukey < 0.001) as a lyoprotectant (
Figure 4 and
Table S5).
Table 3.
Main effects and interactions of the experimental factors affecting aggregation of freeze-dried R2LC. p-values in bold indicate statistically significant effects.
Table 3.
Main effects and interactions of the experimental factors affecting aggregation of freeze-dried R2LC. p-values in bold indicate statistically significant effects.
| Factors | F | P | η2p |
|---|
| Lyoprotectant type | 5.425 | 0.022 | 0.062 |
| Annealing | 2.250 | 0.137 | 0.027 |
| Lyoprotectant concentration | 6.418 | 0.003 | 0.135 |
| Bacterial concentration | 625.580 | <0.001 | 0.884 |
| Lyoprotectant × Annealing | 13.163 | <0.001 | 0.138 |
| Lyoprotectant × Bacterial concentration | 7.851 | 0.006 | 0.087 |
Figure 4.
Effect of low (A) and high (B) bacterial concentration and type of lyoprotectant (sucrose and trehalose) on aggregation of freeze-dried R2LC. Datasets with different letters are significantly different (p < 0.01; data presented in A,B are compared). Green represents samples with sucrose and orange represents samples with trehalose as lyoprotectant.
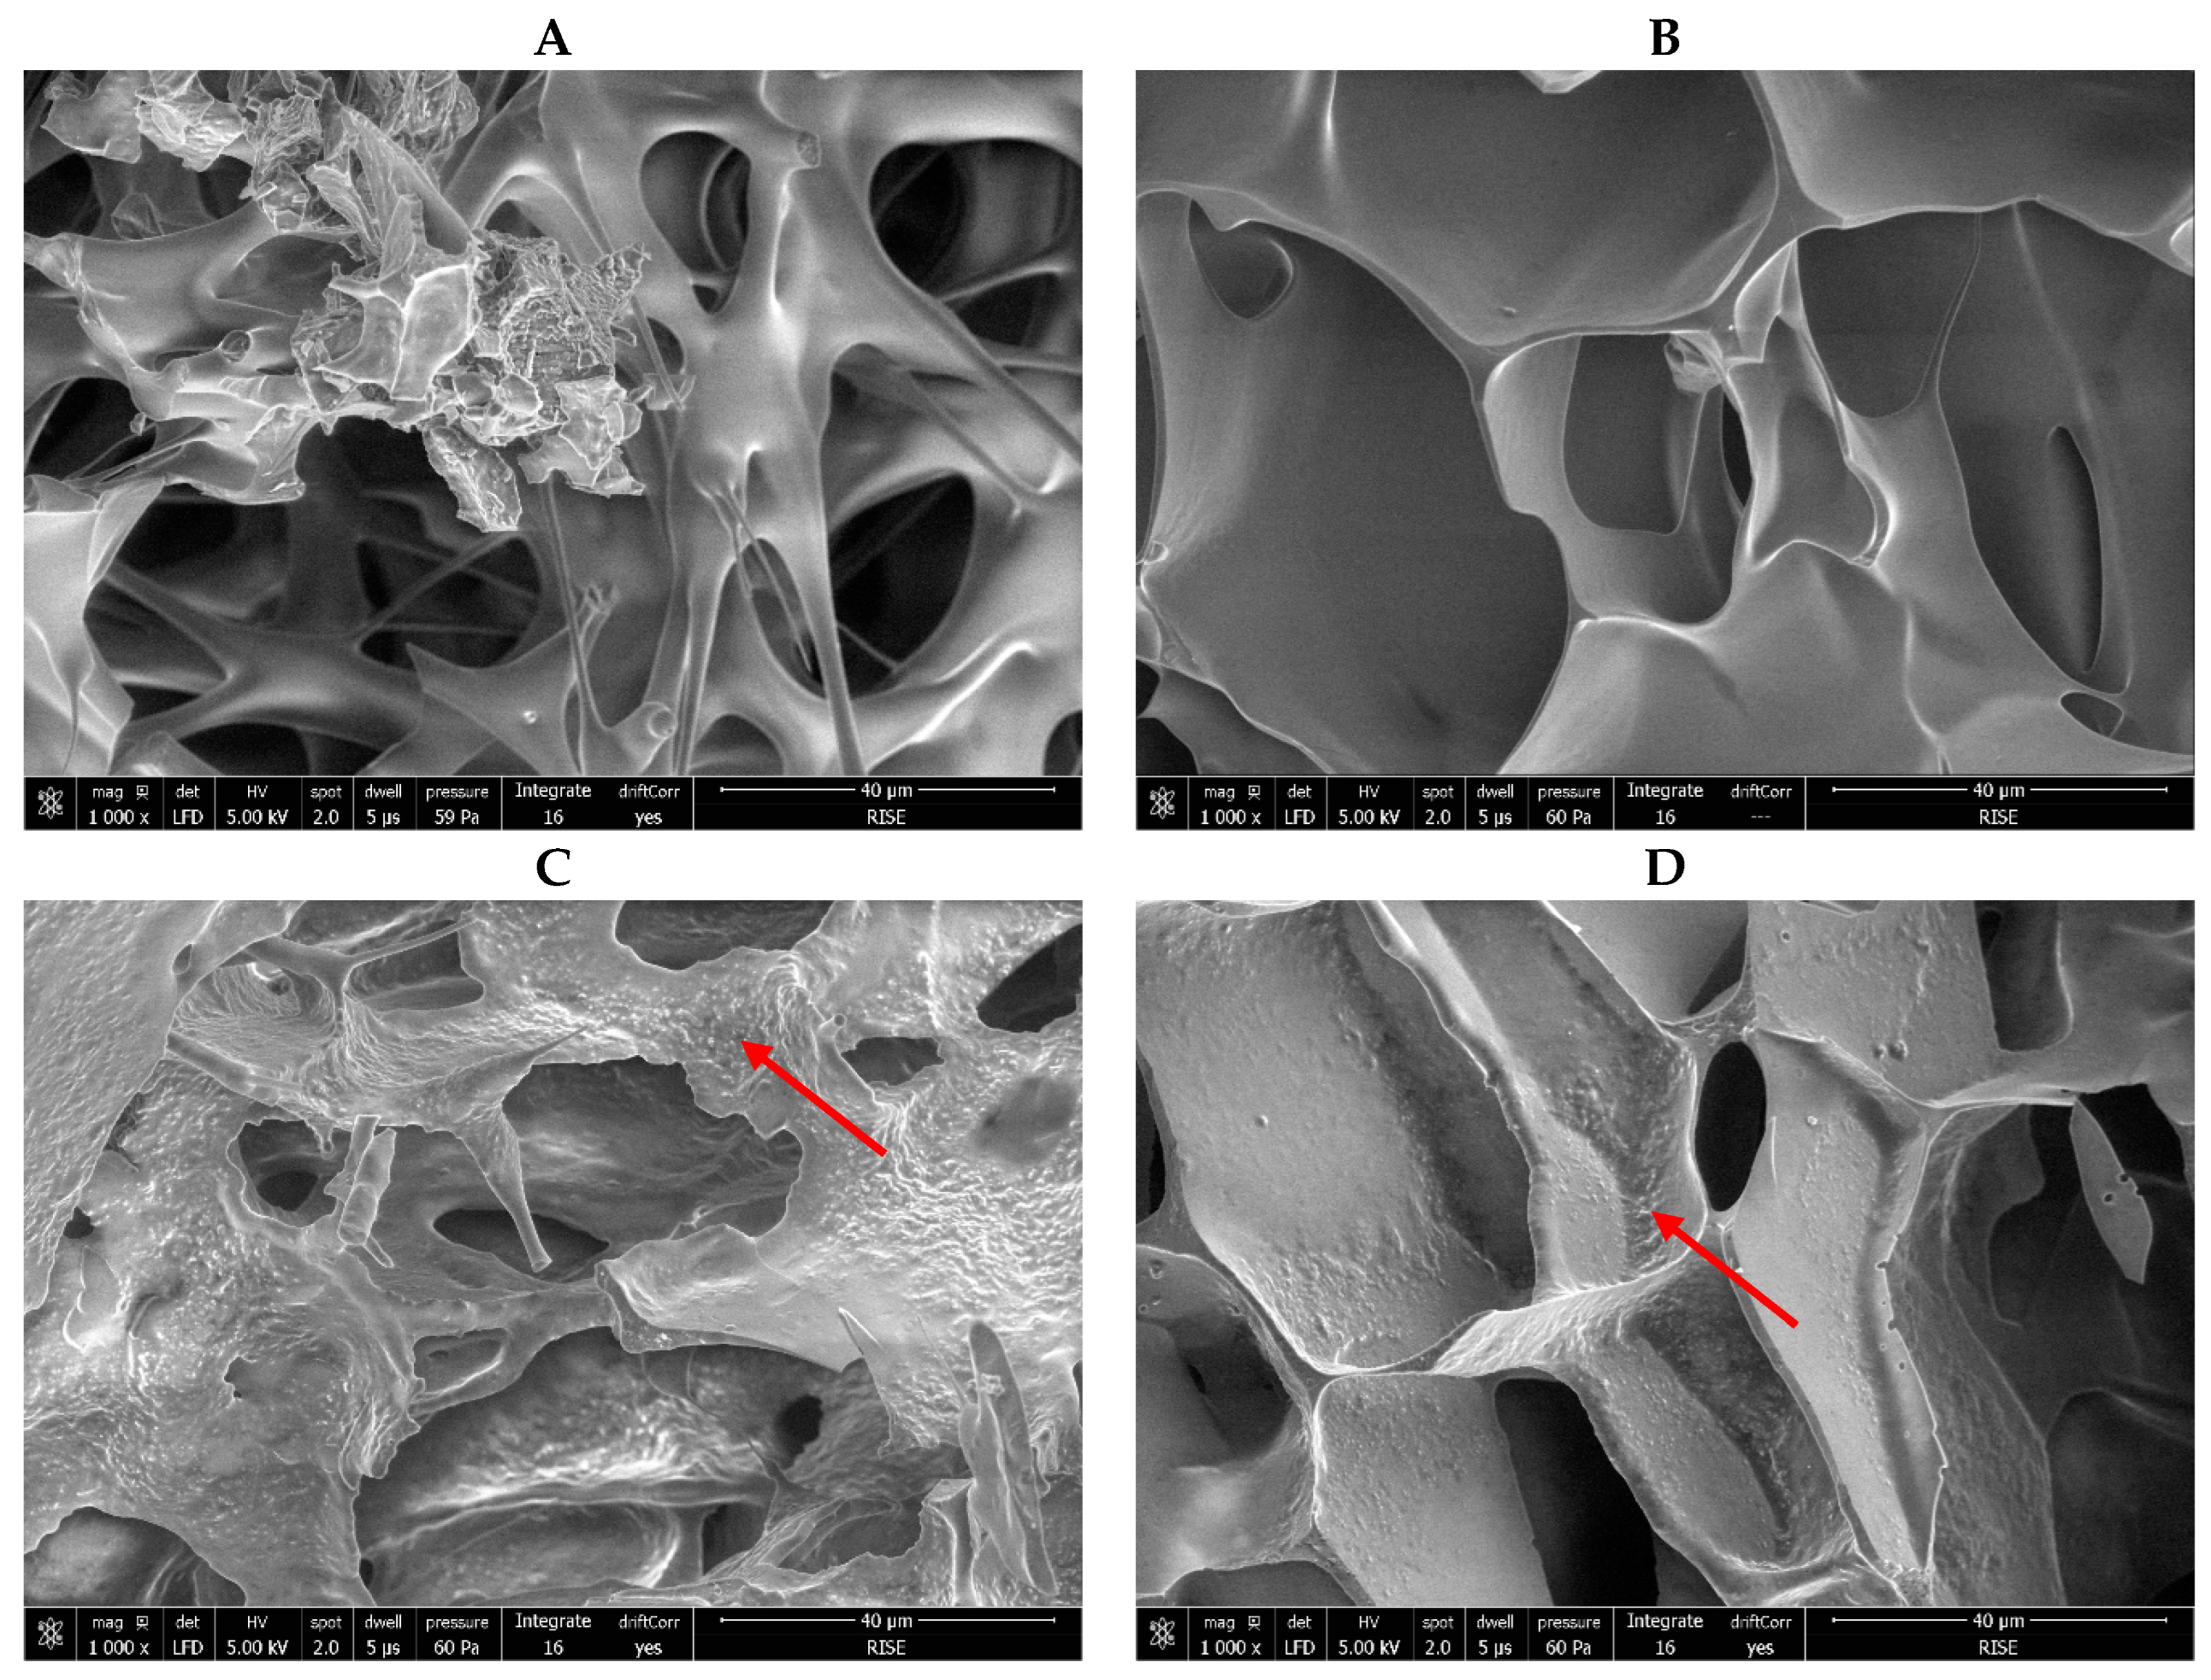
Scanning electron microscopy was carried out for the characterization of the matrix structure and observation of bacterial structures. The matrices for all samples were amorphous (examples are seen in
Figure 5). Bacterial cells were not visible in formulations with the lower bacterial concentration (
Figure 5A,B) because they were well-covered by the matrix (
Figure 5A), while for the higher bacterial concentration, the cells were noticeable under the surface of the matrix (
Figure 5C,D; shown by a red arrow). In addition, matrix porosity was determined by analysing the SEM images, and an ANOVA showed that there were no significant differences between the samples (
Supplementary Table S6).
Figure 5.
Examples of scanning electron microscopy (SEM) images of freeze-dried R2LC. All samples contain 10% lyoprotectant and were dried without an annealing step. (A) Sucrose with 109 CFU/mL; (B) Trehalose with 109 CFU/mL; (C) Sucrose with 1010 CFU/mL; (D) Trehalose with 1010 CFU/mL, bacterial cells embedded in the matrix shown by red arrows. All images have 1000× magnification.
The cake appearance, which was observed visually, was significantly affected by the lyoprotectant concentration and bacterial concentration (
p < 0.001 and
p = 0.008 respectively) according to a Kruskal–Wallis test (
Table 4). In addition, Tukey’s post hoc tests showed that lower (10
9 CFU/mL) R2LC concentration and the highest lyoprotectant concentration (20%) promoted a partial or fully collapsed cake using both sucrose and trehalose as lyoprotectants (
Table S2).
Table 4.
Main effects of the experimental factors affecting cake appearance. p-values in bold indicate statistically significant effects.
Table 4.
Main effects of the experimental factors affecting cake appearance. p-values in bold indicate statistically significant effects.
| Factor | Statistic | df | p |
|---|
| Lyoprotectant type | 0.069 | 1 | 0.792 |
| Annealing | 0.140 | 1 | 0.709 |
| Lyoprotectant concentration | 23.985 | 2 | <0.001 |
| Bacterial concentration | 6.979 | 1 | 0.008 |
3.2. Effect of Accelerated Storage on Water Content of Freeze-Dried R2LC
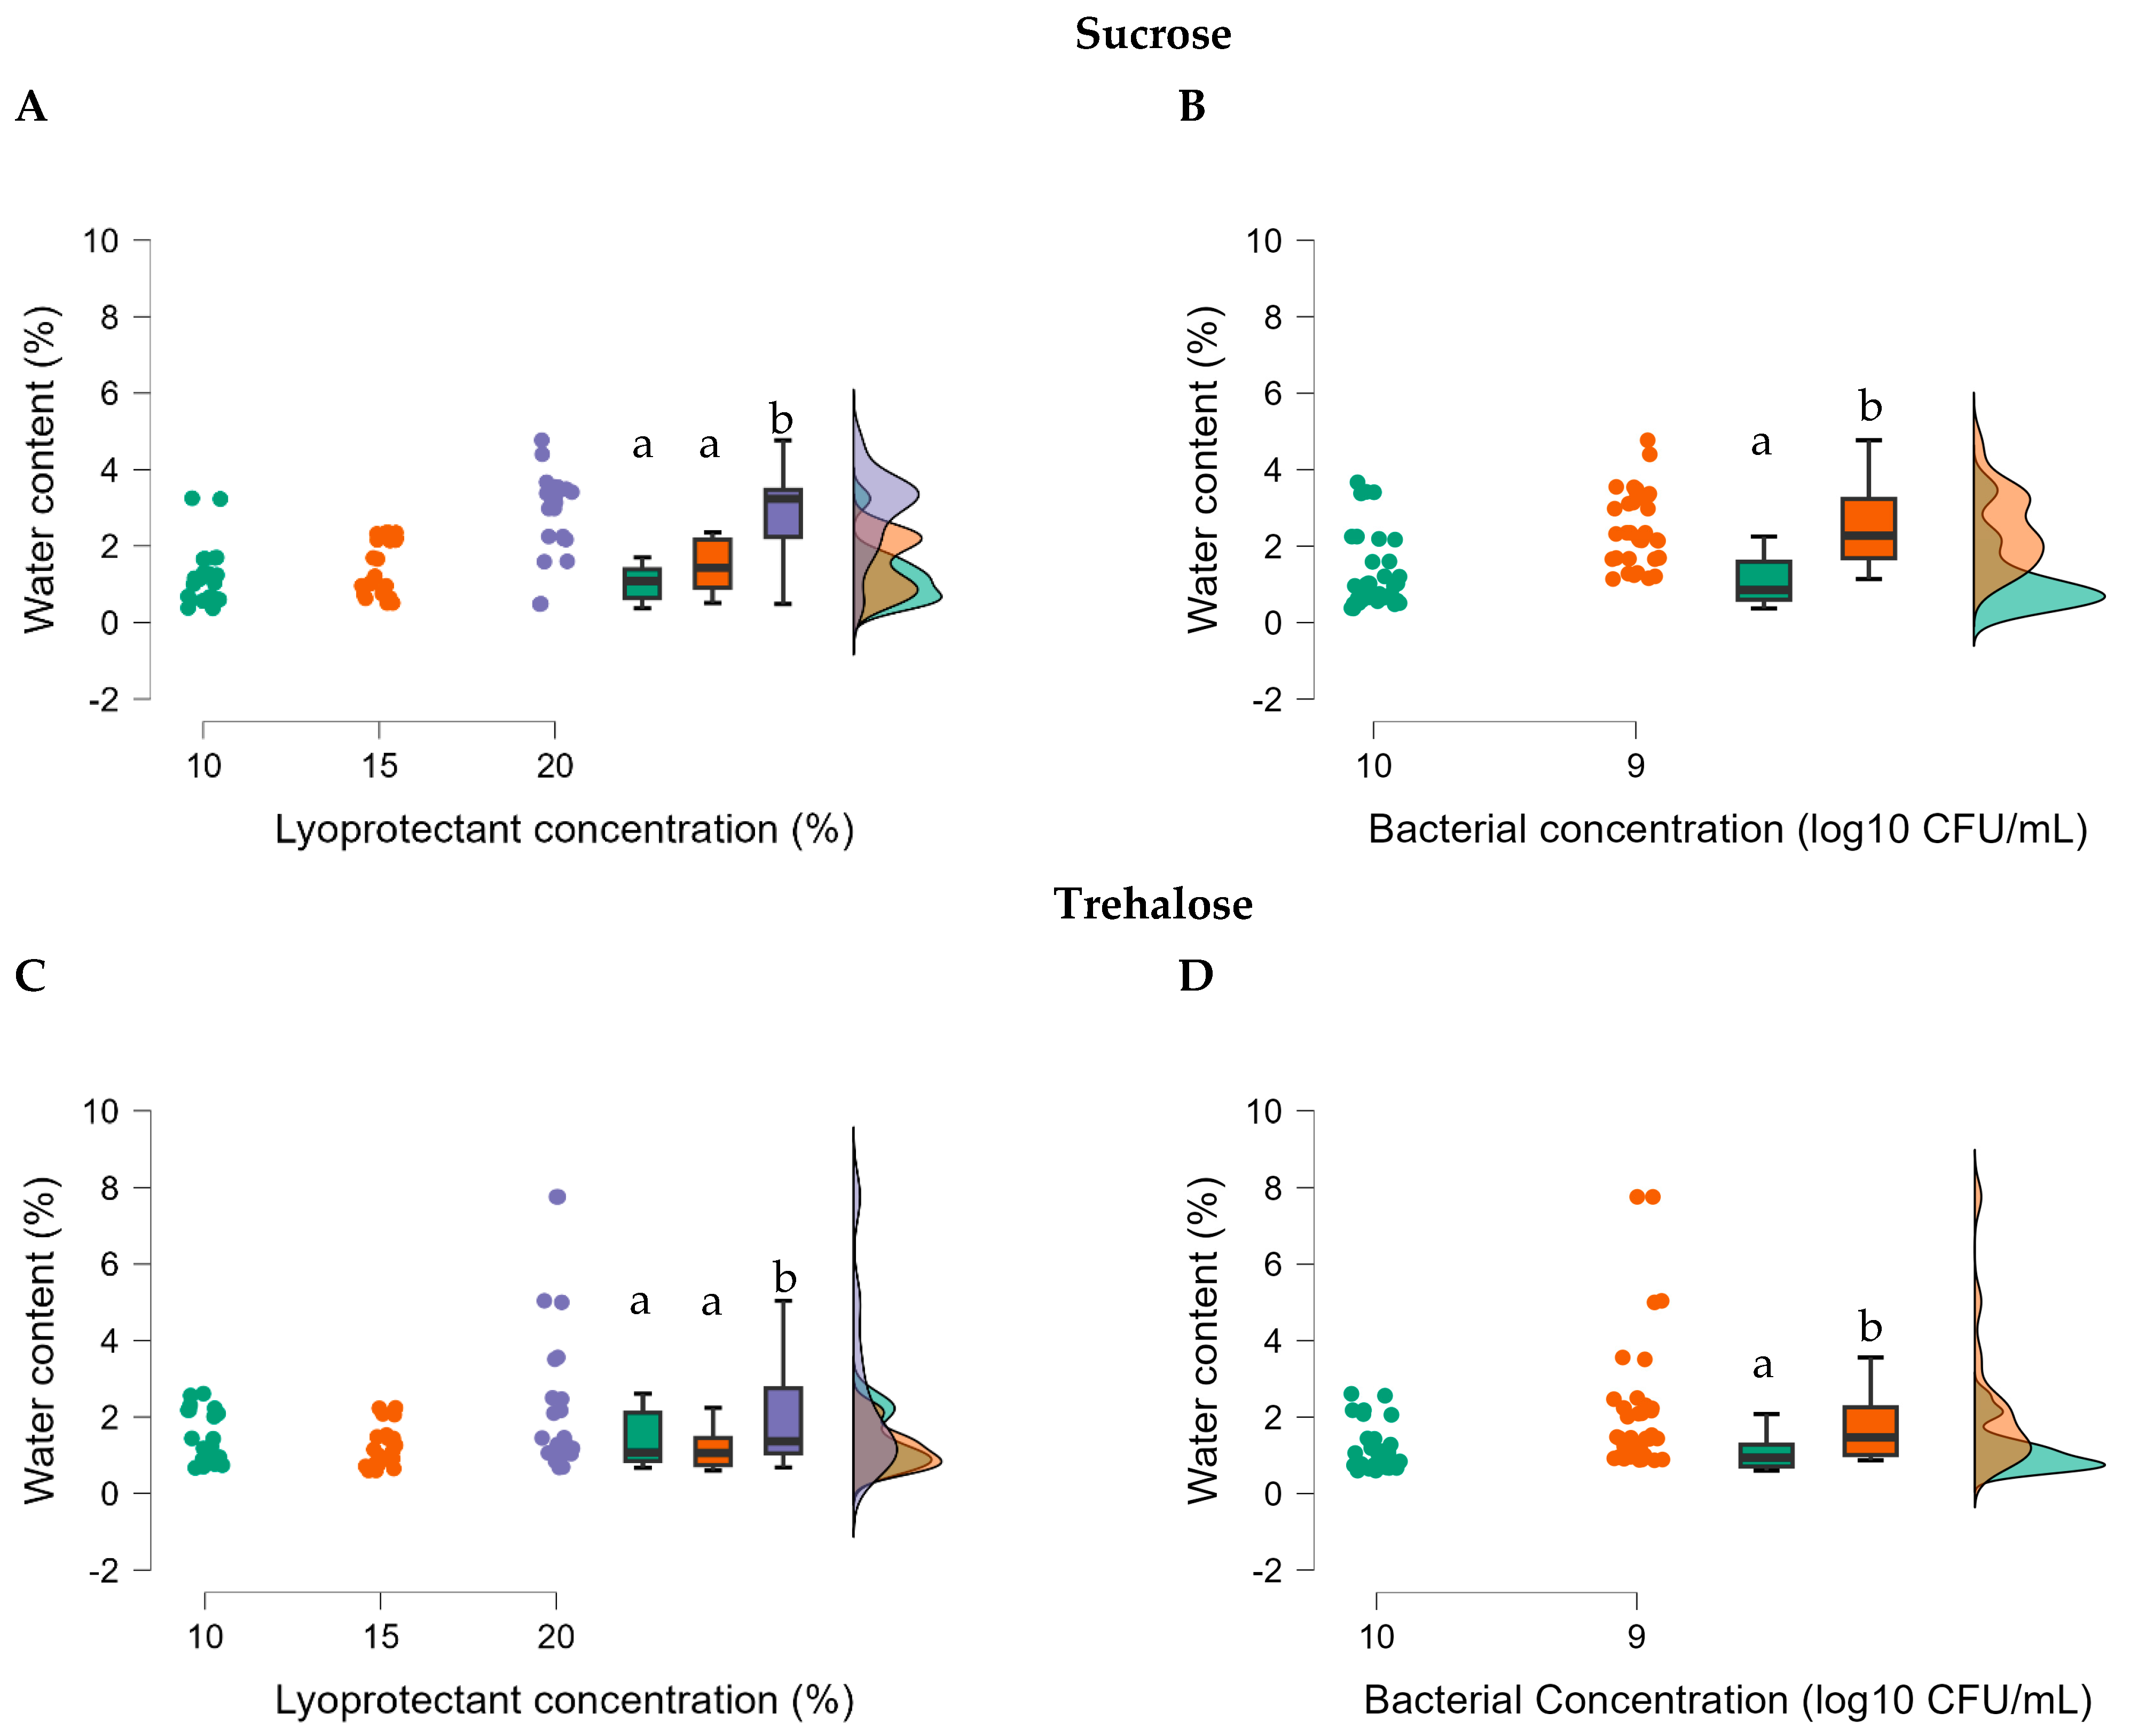
To investigate the effect of accelerated storage on water content, the samples were stored at 37 °C and water content was measured after 2 weeks. We observed that samples with the highest lyoprotectant concentration (20%) and lower concentration of bacteria (10
9 CFU/mL) had increased water content after storage, when using both sucrose and trehalose as lyoprotectants (
ptukey < 0.001) (
Table 5,
Figure 6, and
Table S8).
Table 5.
Main effects and interactions of the experimental factors affecting water content of freeze-dried R2LC during accelerated storage. p-values in bold indicate statistically significant effects.
Table 5.
Main effects and interactions of the experimental factors affecting water content of freeze-dried R2LC during accelerated storage. p-values in bold indicate statistically significant effects.
| Factors | F | p | η2p |
|---|
| Lyoprotectant type | 1.970 | 0.163 | 0.015 |
| Annealing | 0.005 | 0.943 | <0.001 |
| Lyoprotectant concentration (%) | 38.179 | <0.001 | 0.372 |
| Lyoprotectant × Annealing | 15.335 | <0.001 | 0.106 |
| Bacterial Concentration | 63.277 | <0.001 | 0.329 |
| Annealing × Bacterial Concentration | 3.450 | 0.066 | 0.026 |
| Lyoprotectant concentration (%) × Bacterial Concentration | 9.938 | <0.001 | 0.134 |
Figure 6.
Accelerated storage: Effect of the different lyoprotectant types of sucrose (A,B) and trehalose (C,D) and interactions with lyoprotectant concentrations and bacterial concentrations on water content of freeze-dried R2LC. Datasets with different letters are significantly different (p < 0.01; data presented in A,C are compared and B,D are compared). (A,C), violet represents 20%, orange 15% and green 10% lyoprotectant concentration, respectively; (B,D), orange represents l09 CFU/mL and green represents 1010 CFU/mL R2LC.
3.3. Effects of Experimental Factors on Biological Properties of Lyophilized R2LC
The impact of the experimental factors on the biological outcomes of freeze-drying survival, metabolic activity, and storage stability was evaluated. We first investigated how well the bacteria survived the lyophilization process, and it was found that the type and concentration of lyoprotectant and annealing had an impact. All factors apart from bacterial concentration significantly affected the freeze-drying survival (
p < 0.001) (
Table 6). Also, all factors except lyoprotectant concentration significantly affected the metabolic activity of freeze-dried R2LC (
p < 0.001) (
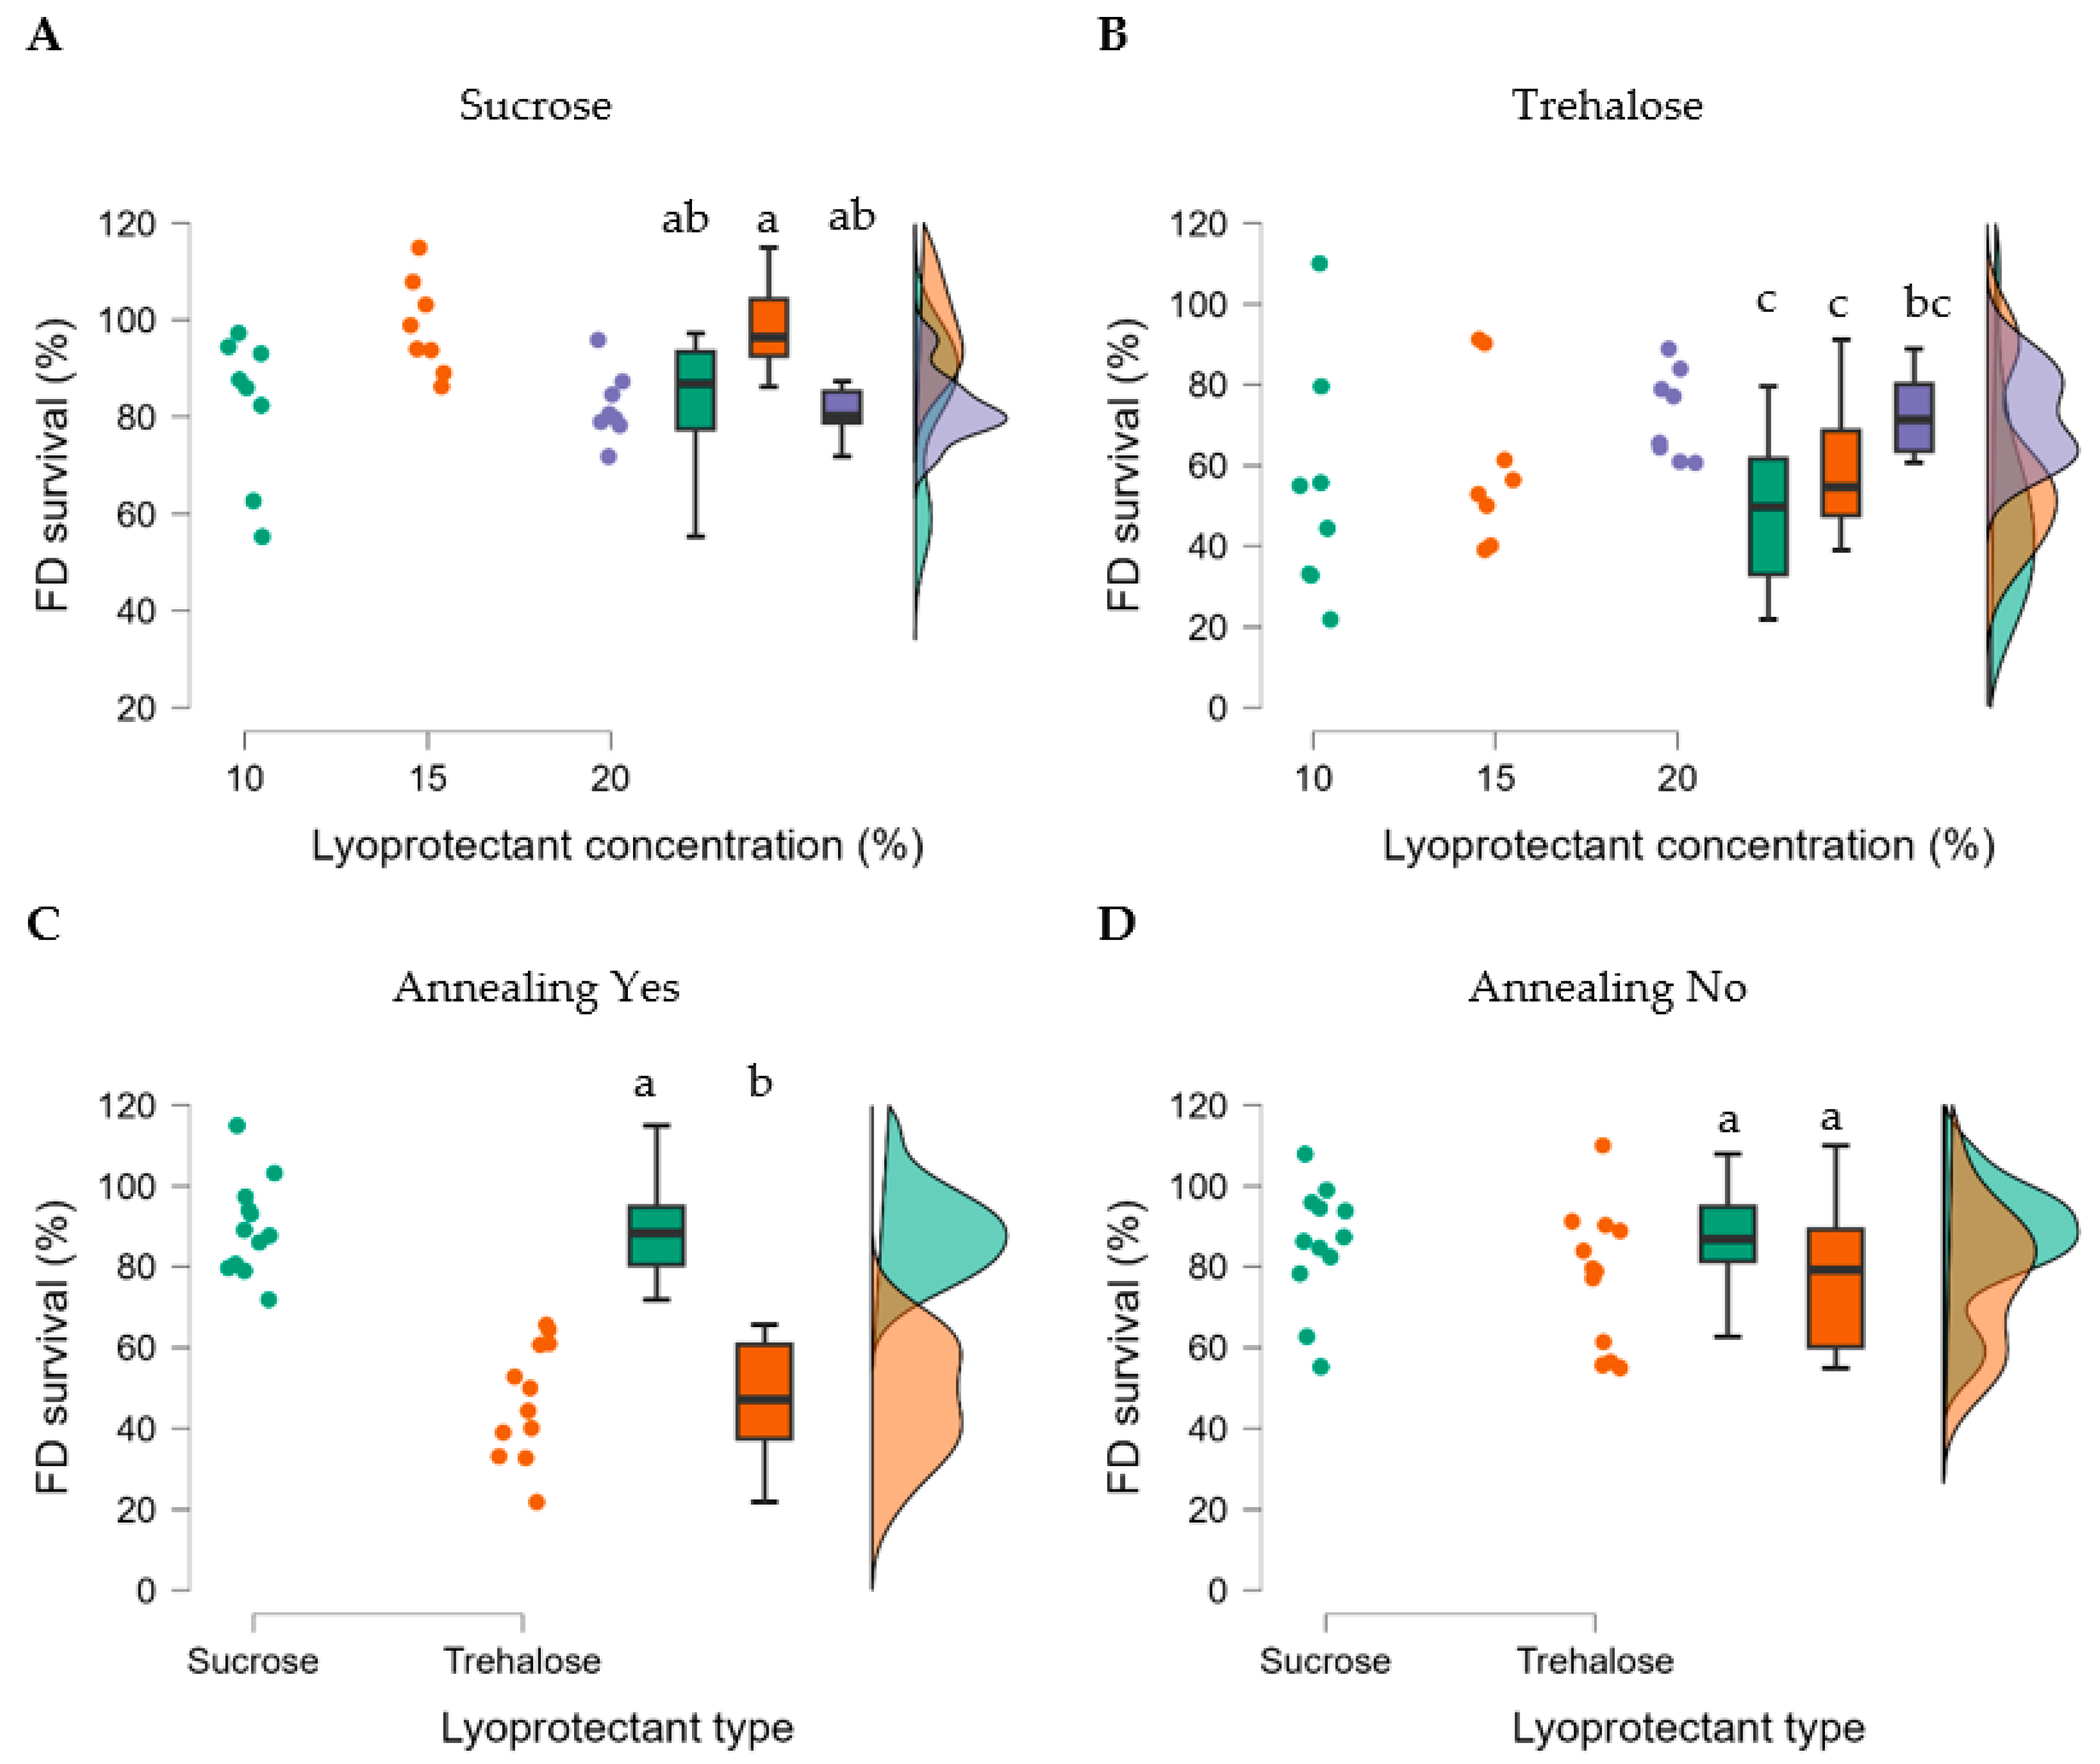
Table 7). Post hoc analysis showed that sucrose resulted in significantly higher survival than trehalose (t = 7.007,
ptukey < 0.001) (
Figure 7 and
Table S9). In addition, annealing had a positive effect when using sucrose but not trehalose as lyoprotectant (t = 8.292,
ptukey < 0.001) (
Figure 8E,F). A final observation was that the concentration of lyoprotectant had an impact on the survival, with 15% being most efficient for sucrose and 20% for trehalose (t = 4.133,
ptukey = 0.003) (
Figure 7A,B).
Table 6.
Main effects and interactions of the experimental factors affecting freeze-drying survival of freeze-dried R2LC. p-values in bold indicate statistically significant effects.
Table 6.
Main effects and interactions of the experimental factors affecting freeze-drying survival of freeze-dried R2LC. p-values in bold indicate statistically significant effects.
| Factors | F | p | η2p |
|---|
| Lyoprotectant type | 49.097 | <0.001 | 0.584 |
| Annealing | 12.986 | <0.001 | 0.271 |
| Lyoprotectant concentration | 3.568 | 0.039 | 0.169 |
| Bacterial concentration | 1.279 × 10⁻⁴ | 0.991 | 3.654 × 10⁻⁶ |
| Lyoprotectant × Annealing | 22.274 | <0.001 | 0.389 |
| Lyoprotectant × Lyoprotectant concentration | 5.383 | 0.009 | 0.235 |
| Lyoprotectant × Bacterial concentration | 3.188 | 0.083 | 0.083 |
| Annealing × Bacterial concentration | 3.838 | 0.058 | 0.099 |
Figure 7.
Effect of lyoprotectant sucrose (A) and trehalose (B), with annealing (C), and without annealing (D) on freeze-drying survival. Datasets with different letters are significantly different (p < 0.01; data presented in A,B are compared and C,D are compared). (A,B), violet represents 20%, orange 15% and green 10% lyoprotectant concentration, respectively; (C,D), orange represents samples with sucrose and green represents trehalose as lyoprotectant.
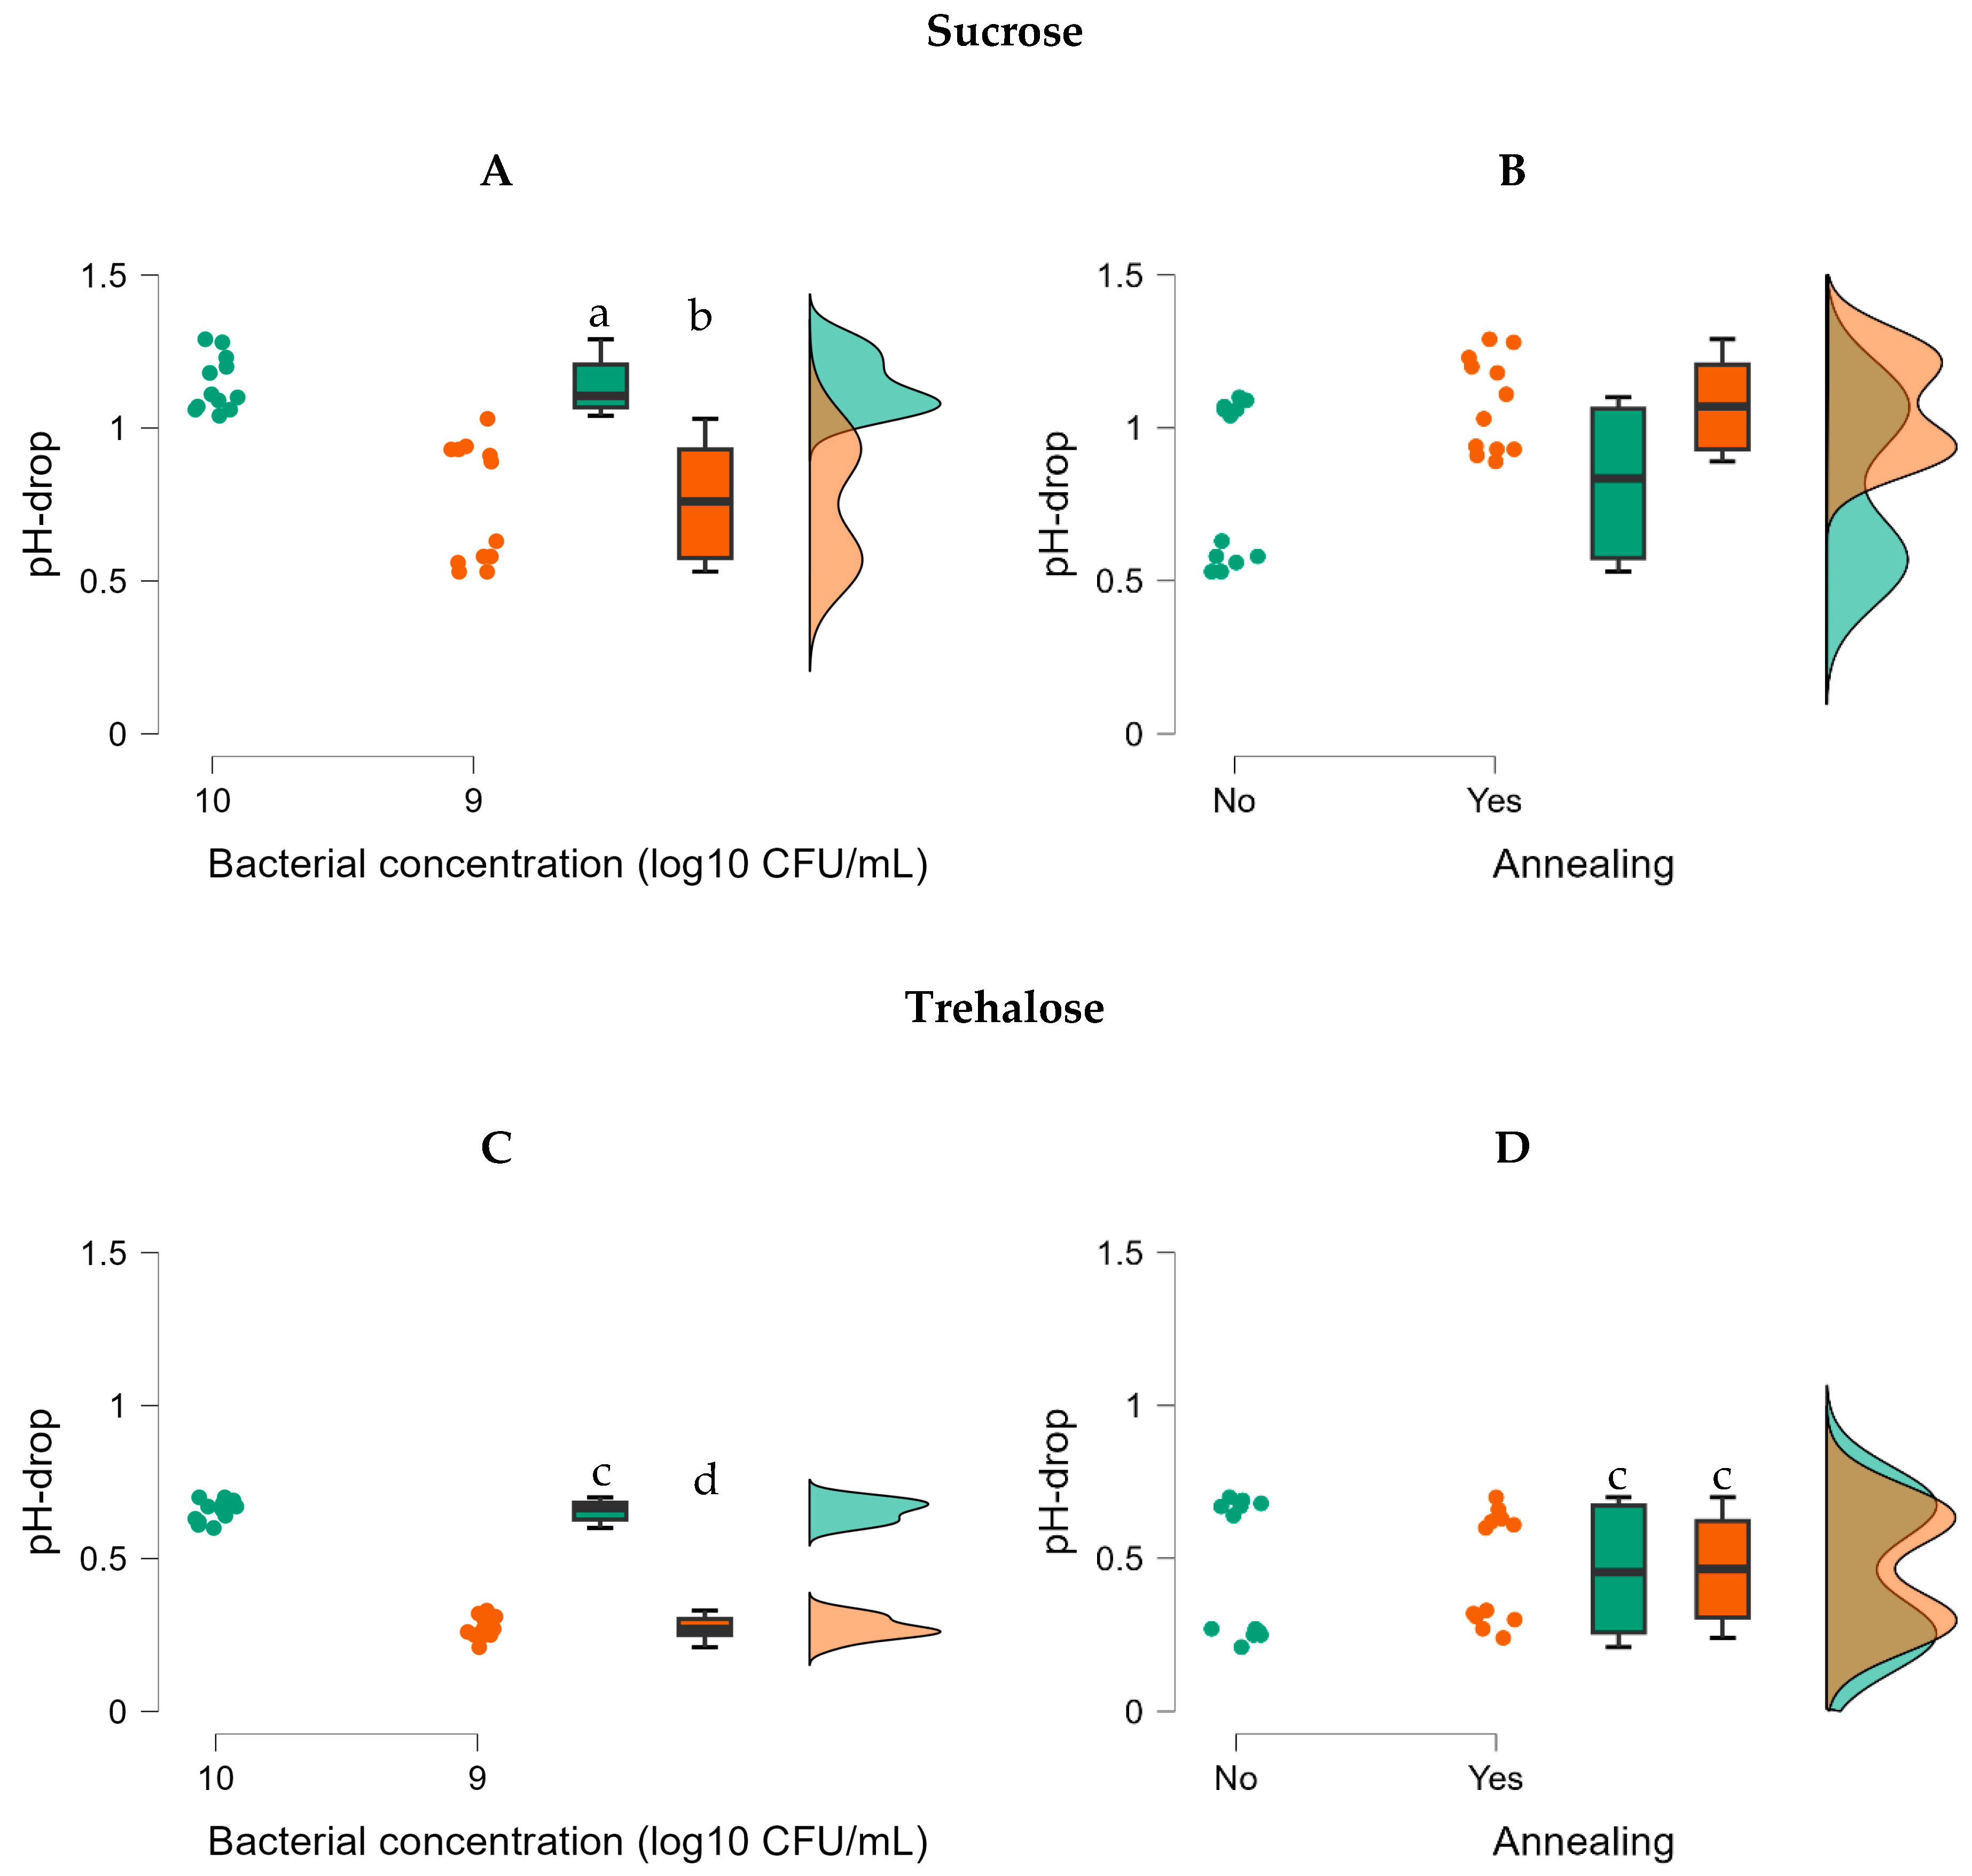
Furthermore, the metabolic activity of the freeze-dried R2LC was investigated and it was shown that sucrose gave a higher metabolic activity than trehalose (t = 43.608,
ptukey < 0.001) (
Figure 8,
Table 7, and
Table S10). In addition, using an annealing step had a positive impact when using sucrose (t = 16.428,
ptukey < 0.001) but not trehalose (t = 0.159,
ptukey = 0.999) as the lyoprotectant (
Figure 8B,D). Additionally, a higher bacterial concentration gave an increased metabolic activity (t = 34.811,
ptukey < 0.001) (
Figure 8A,C).
Table 7.
Main effects and interactions of the experimental factors affecting freeze-drying metabolic activity of freeze-dried R2LC. p-values in bold indicate statistically significant effects.
Table 7.
Main effects and interactions of the experimental factors affecting freeze-drying metabolic activity of freeze-dried R2LC. p-values in bold indicate statistically significant effects.
| Factors | F | p | η2p |
|---|
| Lyoprotectant type | 1901.639 | <0.001 | 0.982 |
| Annealing | 137.569 | <0.001 | 0.797 |
| Lyoprotectant concentration | 2.150 | 0.132 | 0.109 |
| Bacterial concentration | 1211.809 | <0.001 | 0.972 |
| Lyoprotectant × Annealing | 132.329 | <0.001 | 0.791 |
| Annealing × Bacterial concentration | 47.846 | <0.001 | 0.578 |
| Lyoprotectant concentration × Bacterial concentration | 5.708 | 0.007 | 0.246 |
Figure 8.
Effect of lyoprotectant, annealing, and bacterial concentration on metabolic activity. Datasets with different letters are significantly different (
p < 0.01; data presented in
A,
C are compared and
B,
D are compared). (
A,
C), orange represents 10
9 CFU/mL and green represents 10
10 CFU/mL R2LC;
Figure 6B,D, orange represents samples with annealing step and green represents samples without annealing step.
3.4. Effect of Accelerated Storage Stability on Biological Properties
Storage stability of the freeze-dried R2LC samples was investigated after incubation at 37 °C (a temperature resulting in an accelerated decline in activity) for 2 weeks. As shown in
Table 8,
Table S11 and S12, both types of lyoprotectant and bacterial concentration had a significant impact on survival and metabolic activity. Post hoc Tukey tests revealed that sucrose gave significantly better survival (t = 4.412,
ptukey < 0.001) and often more than 2 times higher metabolic activity (t = 2.444,
ptukey = 0.033) than trehalose (
Figure 9). Interestingly, 10–15% sucrose gave the best stability for the lower bacterial concentration, while 15–20% sucrose was better for the higher bacterial concentration (
Figure 9A,C). Trehalose gave better stability for the highest bacterial concentration than for the lower concentration (
Figure 9B,D). Furthermore, the survival was significantly lower for the trehalose-containing formulations compared to the formulations with sucrose.
Table 8.
Main effects and interactions of the experimental factors affecting biological properties (A) storage survival and (B) metabolic activity of freeze-dried R2LC storage stability at week 2. p-values in bold indicate statistically significant effects.
Table 8.
Main effects and interactions of the experimental factors affecting biological properties (A) storage survival and (B) metabolic activity of freeze-dried R2LC storage stability at week 2. p-values in bold indicate statistically significant effects.
| A |
| Factors | F | p | η2p |
| Lyoprotectant type | 19.470 | <0.001 | 0.357 |
| Annealing | 3.154 | 0.084 | 0.083 |
| Lyoprotectant concentration | 2.324 | 0.113 | 0.117 |
| Bacterial concentration | 5.445 | 0.025 | 0.135 |
| Lyoprotectant × Annealing | 7.925 | 0.008 | 0.185 |
| Lyoprotectant × Lyoprotectant concentration | 3.609 | 0.038 | 0.171 |
| Lyoprotectant × Bacterial concentration | 6.463 | 0.016 | 0.156 |
| Annealing × Bacterial concentration | 3.086 | 0.088 | 0.081 |
| Lyoprotectant concentration × Bacterial concentration | 9.728 | <0.001 | 0.357 |
| B |
| Factors | F | p | η2p |
| Lyoprotectant type | 5.971 | 0.033 | 0.352 |
| Annealing | 1.097 | 0.317 | 0.091 |
| Lyoprotectant concentration | 2.675 | 0.113 | 0.327 |
| Bacterial concentration | 45.088 | <0.001 | 0.804 |
| Lyoprotectant × Bacterial concentration | 4.133 | 0.067 | 0.273 |
| Lyoprotectant concentration × Bacterial concentration | 11.184 | 0.002 | 0.670 |
Figure 9.
Evaluation of accelerated stability after 2 weeks. Effects of different factors and their interactions on survival (A,B) and metabolic activity (C,D) of freeze-dried R2LC. Datasets with different letters are significantly different (p < 0.01; data presented in A,B compared and C,D are compared).

