Article

Soil Bacteriome Resilience and Reduced Nitrogen Toxicity in Tomato by Controlled Release Nitrogen Fertilizer Compared to Urea

by
Carley R. Rohrbaugh
1,†,
Mary M. Dixon
1,†,
Jorge A. Delgado
2,
Daniel K. Manter
2,* and
Jorge M. Vivanco
1,*
1
Department of Horticulture and Landscape Architecture, Colorado State University, Fort Collins, CO 80525, USA
2
Soil Management and Sugar Beet Research Unit, Agricultural Research Service, United States Department of Agriculture, Fort Collins, CO 80526, USA
*
Authors to whom correspondence should be addressed.
These authors contributed equally to this work.
Appl. Microbiol. 2023, 3(4), 1262-1276; https://doi.org/10.3390/applmicrobiol3040087
Submission received: 20 October 2023 / Revised: 13 November 2023 / Accepted: 16 November 2023 / Published: 20 November 2023
(This article belongs to the Special Issue Microbiome in Ecosystem 2.0)

Abstract

:
Controlled release fertilizers (CRFs) mitigate negative effects of high nitrogen (N) fertilization rates, such as N toxicity and soil N loss. However, it is unknown if potentially toxic rates of CRF and quick release fertilizer differentially affect soil bacterial communities. To examine potential N toxicity effects on soil microbial communities, we grew tomato (Solanum lycopersicum “Rutgers”) for eight weeks in soils that were fertilized with high levels of quick release or controlled release urea and in soils with either low or high initial microbial N competitor populations. In both soils, we observed N toxicity in urea-fertilized tomatoes, but toxicity was ameliorated with CRF application. Controlled release fertilization increased soil N retention, thereby reducing soil N loss. While N toxicity symptoms manifested in the plant, the soil microbiome was only minorly affected. There were subtle differences in soil bacterial populations, in which nitrifying bacteria accumulated in soils fertilized at high N rates, regardless of the type of N fertilizer used. Ultimately, CRF reduced plant N toxicity symptoms but did not change the soil microbiome compared to quick release urea. These results show that while there are clear benefits of CRF regarding N toxicity tolerance on crops, the soil microbiome is resilient to this abiotic stressor.

1. Introduction

Nitrogen (N) is an essential nutrient for plant growth and development [1]. Although it is the most-demanded nutrient by plants, N is often not efficiently taken up by crops in agroecosystems. Only approximately 50% of applied N is recovered by the plant, and the remainder is lost to soil accumulation, atmospheric volatilization, or is discharged to aquatic ecosystems [2]. These losses cause environmental problems because leaching of soil nitrate promotes algal blooms in water systems which results in dead zones, and volatilized nitrous oxide can exacerbate negative effects of climate change by damaging the ozone layer [3]. Excess N fertilization can also negatively affect soil microbial community structure by reducing microbial diversity and biomass [4,5]. In response to N fertilization, surface soil bacterial community richness reduces and overall community composition changes [6]. In the rhizosphere of major agronomic crops such as barley (Hordeum vulgare) and wheat (Triticum aestivum), beneficial soil bacteria populations destabilize with increasing rates of inorganic N fertilization [7,8].
Further, N fertilization may promote growth of N competitors (i.e., microbes that compete with plant roots for N assimilation). Even under fertile conditions, plants and soil microbes are often limited by inorganic N, and therefore, plant roots and soil microbes compete for this nutrient [9]. Microbes take up N more quickly than plant roots [10,11]. Thus, competition by microbes is strong shortly after N is applied to soils, especially among nitrifiers [12]. Nitrifiers, including ammonium oxidizing bacteria (AOB), directly compete with plants for ammonium, and AOB have been shown to progressively increase in abundance with increasing fertilization rates [13]. In addition to nitrifying bacteria, denitrifying bacteria and decomposing bacteria compete with plant roots to assimilate forms of bioavailable N (NO3, NH4+) [14]. By inhibiting growth of nitrifying bacteria, agroecosystems can mitigate losses caused by microbial nitrifiers [15]. Biocidal treatments, particularly autoclave sterilization, have been shown to be effective in reducing the population of nitrifying bacteria [16].
New technologies are needed to make nitrogen more available to plants while minimizing the negative effects associated with excess fertilization. Among those approaches is the use of polymer-coated, controlled released fertilizers (CRFs). Controlled release fertilizers increase plant productivity while mitigating environmental risks caused by N losses from agroecosystems [17,18,19], through reducing leaching [20] and nitrous oxide loss [21,22]. As quick release urea, N is supplied to plants at high localized concentrations [23], resulting in crop toxicity, especially in stages of early crop development [24]. Nitrogen toxicity is of concern because, to meet crop demand, growers may be overapplying N fertilizer [25].
Although it is well known how quick release N application affects the soil microbial communities, studies are lacking on how slow release N fertilizers affect N-cycling bacteria and if these different types of fertilizer can ameliorate the effects of N toxicity on plants and the soil microbiome. Here, we fertilized tomato (Solanum lycopersicum) with either quick release urea or slow release Environmentally Smart Nitrogen (ESN) at high doses to induce plant toxicity. ESN is a polymer-coated urea fertilizer which may enhance plant N assimilation because it releases N over a period of approximately 40 days in soils above 20 °C [26]. We grew tomato in either autoclave-sterilized or unsterilized soil. The autoclave-sterilized soil functioned as a control to minimize the effects of microbial N competitors.

2. Materials and Methods

2.1. Soil and Plant Selection

The study was performed in a greenhouse at the Horticulture Center of Colorado State University (CSU), Fort Collins, Colorado (40.566, −105.086) from October to December 2021. Following recommendations by the Tomato Genetics Resource Center (University of California Davis, Davis, CA, USA) to increase germination rates, tomato, Solanum lycopersicum cv. Rutgers (henceforth, “tomato”), seeds were sterilized with 3% sodium hypochlorite and rinsed with distilled water. Seeds were pre-germinated on wet filter paper and stored in Petri dishes for seven days. Seedlings were transplanted to a potting mix to promote root establishment for 12 days. Plants were then transplanted into 15 cm diameter pots with 1.2 kg air-dried agricultural soil.
The soil used in the study was a fine-loamy, mixed, mesic Aridic Haplustalfs with low N concentration (5.25 mg/kg NO3-N). Soil was collected from the Agricultural Research, Development, and Education Center (ARDEC) in Fort Collins, Colorado. The soil was collected from a USDA-ARS long-term study control plot that had not been fertilized with N for 20 years. Soil was sieved with a 1 cm sieve and air-dried prior to the study. One half of the treatments used autoclave-sterilized soil with the purpose of reducing the initial load of N competitors. The soil in this treatment was first steam pressurized in a Lindig soil steamer (Lindig Manufacturing Co., St. Paul, MN, USA)at the Crops Research Laboratory USDA-ARS, Fort Collins, CO at 76 °C for 6 h. To remove all water content, the soil was left to air dry for two weeks. The soil was then autoclaved using a STERIS autoclave (STERIS, Dublin, Ireland) for three 15 min liquid cycles at 121 °C. Soil was again dried before administering soil into pots. Autoclave sterilization is commonly used in research to reduce soil microbial diversity [27,28,29]. While certain microbial populations attenuate, some taxa can survive and recover rapidly [30].
Plants were watered to field capacity (24.9% volumetric) once per day via top watering. Pots contained drainage holes for excess moisture to be able to drain out. To determine differences in the bulk soil microbiome as a function of fertilizer type and rate exclusively, we included a no-plant control treatment. Temperatures ranged from 20 °C to 33 °C with a photoperiod of 14 h. Treatments were arranged in a completely randomized design as determined by an open source sample randomization software [31]. Because N application can affect flowering time [32] and plant development can modify the composition of the soil microbiome [33], we grew tomatoes throughout their vegetative phase so as not to conflate the changes we see in the microbiome with changes that would occur naturally with plant development. Plants grew for eight weeks after transplantation. Each treatment consisted of a pot either with or without a tomato plant filled with either sterilized or non-sterilized soil and amended with either quick release fertilizer or controlled release fertilizer or left unfertilized. For treatments that were fertilized, plants were fertilized at either high or low rates of fertilization. There was a balanced distribution of the plant/no-plant treatment, the sterilized/unsterilized soil treatment, and the urea-fertilized/ESN-fertilized/unfertilized treatment. With the fertilized treatments, there was a high rate and a low rate of fertilization. There were ten replicates per treatment and a total of 200 pots.

2.2. Fertilizer Selection

Two types of N fertilizers were used for this study: polymer-coated, Environmentally Smart Nitrogen (ESN) (44% N) and quick release urea (46% N). Fertilizer was applied to the pots one week after transplantation at high rates (2 g urea (0.92 g N), 2.05 g ESN (0.90 g N)) and low rates (0.5 g urea 107 (0.23 g N), 0.55 g ESN (0.24 g N)) (Table 1). Slightly higher amounts of ESN were used to provide the same N application rate for both fertilizer treatment types. The fertilizer applied was in granular form and was lightly buried (5 cm depth) in four places surrounding the plant. The high rate of fertilization is approximately twice the recommendation for tomato production, whereas the low rate is approximately half the recommended rate for tomato production.

2.3. Plant Biomass Sampling

The shoots and roots were cleaned immediately following harvest. For this study, shoots refer to the tomato plant’s total aboveground biomass. Cleaning consisted of gently rinsing the plant shoots and roots with water. After cleaning, the shoots and roots were placed in a drying oven at 80 °C for 2 days, and the dry biomass of shoots and roots was weighed and totaled for analysis.

2.4. DNA Extraction and 16S Amplicon Sequencing with MinION Flow Cells

After eight weeks of plant growth following fertilization, bulk soil was collected for DNA extractions and soil nitrate analysis by collecting four soil cores around the diameter of each experimental unit (N = 200). These 4 soil cores were agglomerated into individual 15 mL falcon tubes and stored at −20 °C for DNA extractions. Soil core collection was repeated, and bulk soil was dried. Dry soil was sieved (2 mm sieve size). Soil nitrate-N was determined through a 1 M KCl extraction method at Ward Laboratories (Kearney, NE, USA).
Total DNA was extracted from each 0.25 g of the bulk soil sample using a DNeasy Powersoil PRO isolation kit and QIAcube (Qiagen, Hilden, Germany) according to the manufacturer’s instruction. The DNA was then quantified using a Qubit fluorometer (Invitrogen Qubit 4 fluorometer, Invitrogen, Waltham, MA, USA). Extracted DNA was stored in individual tubes at −20 °C.
Based on Qubit concentrations (ng/μL), extracted DNA was diluted 10× with HPLC water to lower DNA concentrations. Master mix was then created, which consisted of 10 μL of Phusion HSII master mix, 7.2 μL H2O, 0.4 μL forward primer (10 µM), and 0.4 μL reverse primer (10 µM) for a total of 18 μL master mix per 2 μL sample. Bacterial primers used were Bact_27F-Mn (5′–TTTCTGTTGGTGCTGATATTGC AGRGTTYGATYMTGGCTCAG–3′) and Bact_1492R-Mn (5′–ACTTGCCTGTCGCTCTATC TTC TACCTTGTTACGACTT–3′). Polymerase chain reaction (PCR) settings were 98 °C for 30 s, 98 °C for 15 s, 50 °C for 15 s, and 72 °C for 60 s for 25 cycles, and 72 °C for 5 min. After the first PCR, equal volumes of DNA and beads were mixed. A 96-pronged paramagnetic stand, which selectively binds to nucleic acids, was used to purify samples with 2 rinses (30 s each) with 70% EtOH. DNA samples were then eluted in a 96-well plate with 40 µL PCR grade water and beads were removed using a magnetic stand. DNA was quantified using a Qubit fluorometer with high-sensitivity assay solutions. Purified PCR products were then diluted 1:10 in nuclease-free water and barcoded using the PCR Barcoding Expansion 1–96 kit (ONT, Oxford, UK). Barcoding was performed in 50 μL reactions with 1× Phusion HSII Master Mix, 1 μL sample-specific PCR barcode, and 5 μL diluted PCR1 product or water for the negative control. Reactions were placed in a thermocycler (Thermo Fisher Scientific, Waltham, MA, USA) for the following protocol: 98 °C for 30 s followed by 15 cycles of 98 °C for 15 s, 62 °C for 15 s, and 72 °C for 60 s, and a final extension at 72 °C for 5 min.
After the second PCR, barcoded 16S rRNA amplicons were pooled at equal volumes, purified with AMPure beads, and adjusted to a final concentration of 20 ng/µL in preparation for loading onto a flow cell (R9.4.1) for sequencing. To prepare the flow cell, air (~20 µL) was removed using a pipette. The flow cell was then primed with flush buffer, and 50 µM of the pooled 16S rRNA library was loaded into the sampling port. In total, there were three PCR runs to complete sequencing of the bulk soil. For the first two runs, 80 samples were sequenced, and the remaining 40 were sequenced in a third pool. MinKNOW software was used to sequence the pooled library for 48 h at the USDA-ARS facility in Fort Collins, CO. Raw data were downloaded and base-called and demultiplexed using Guppy v6.0.1. Sequences were filtered based on length (1000–2000 bp) and a minimum q-score of 70 using Filtlong v0.2.1 [34] and Cutadapt v3.2 [35]. Chimeras were filtered using vsearch [36], and taxonomy was assigned with minimap2 v2.22 [37] using the default NCBI-linked reference database from EMU. Error-correcting was carried out with Emu v3.0.0 [38] which applies an expectation minimization algorithm to adjust taxonomic assignments using up to 50 sequence alignments per sequence read. Samples with less than 10,000 reads were removed from all down-stream analyses. After filtering, 149 samples remained.
Functional gene abundances classified by KEGG ontologies (Table 2) were estimated for the entire EMU reference database [38] using PICRUSt2 [39]. PICRUSt2 is a valuable tool that has been shown to accurately correlate with certain gene-specific primers [40]. The first two steps of the default PICRUSt2 pipeline were performed. First, the Python script (place_seqs.py) which utilizes HMMER [41] was used to add the query sequences to the default PICRUSt2 prokaryotic 16S rRNA phylogenetic tree using EPA-NG [42]. Second, the python Script (hsp.py) which utilizes the castor R package [43] was used to predict 16S rRNA and functional gene copies per genome. Functional gene abundances (copies g−1 soil FW) for each sample and N-cycle gene of interest were calculated as follows:
G e n e   C P S = i = 1 S o b s n i N × G e n e   C P G i 16 S   C P G i × 16 S   C P S
where Gene CPS = functional gene copies g−1 soil FW,
Sobs = number of observed amplicon sequence variants (ASVs),
ni = number of sequenced reads in ASV i,
N = number of sequenced reads,
Gene CPGi = functional gene copies per genome for ASV i,
16S CPGi = 16S rRNA copies per genome for ASV i,
16S CPS = 16S rRNA copies g−1 soil FW.
Table 2. KEGG orthologues selected for PICRUSt analysis.
Gene Process Reaction KEGG Entry
nifHN-fixation N2 > NH3K02588
pmoA-amoANitrification NH3 > NH2OHK10944
haoNitrification NH2OH > NO2K10535
nirKDenitrification NO2 > NOK00368
nosZDenitrificationN2O > N2K00376

2.5. Statistical Analysis

All data were analyzed with R (Version 4.1.2, R Core Team, Indianapolis, IN, USA) and RStudio (Version 2023.06.0, Boston, MA, USA) A three-way ANOVA with interaction effects was run for plant biomass (Biomass~Fertilizer Rate, Fertilizer Type, Autoclave Sterilization), and a four-way ANOVA with interaction effects was run for soil nitrate (Y~Fertilizer Rate, Fertilizer Type, Autoclave Sterilization, Plant Presence). There was an unfertilized control and low and high fertilizer rate. Fertilizer type includes the unfertilized control, ESN, and urea. Autoclave sterilization includes a sterilized and unsterilized treatment. Plant presence indicated pots to have either a plant present or no plant. For the soil NO3 analysis, data were log-transformed to achieve normal distribution of residuals. A Tukey’s honest significant difference (HSD) test was used for comparisons of means, and statistical differences were assigned at alpha less than 0.05. To test for the effects of the treatments on microbial community composition, a permutational multivariate analysis of variance (perMANOVA) was used to test for significant differences in microbial community composition using Bray–Curtis distances on Hellinger-transformed relative abundances. A db-RDA ordination was used to visualize differences in microbial community composition using Bray–Curtis distances on Hellinger-transformed relative abundances. Differences in bacterial species abundances between fertilizer treatments were tested with negative binomial generalized linear models using the DESeq2 package [44] with a false-discovery rate of 0.05. To determine how the fertilization treatments may have altered microbial population dynamics, a likelihood ratio test was run on the unnormalized count data (Bacterial Counts~Fertilizer Rate, Fertilizer Type). A three-way ANOVA was run for the total abundance (gene copies g −1 soil) of selected N cycling genes (Gene Copies~Fertilizer Rate, Fertilizer Type, Autoclave Sterilization).

3. Results

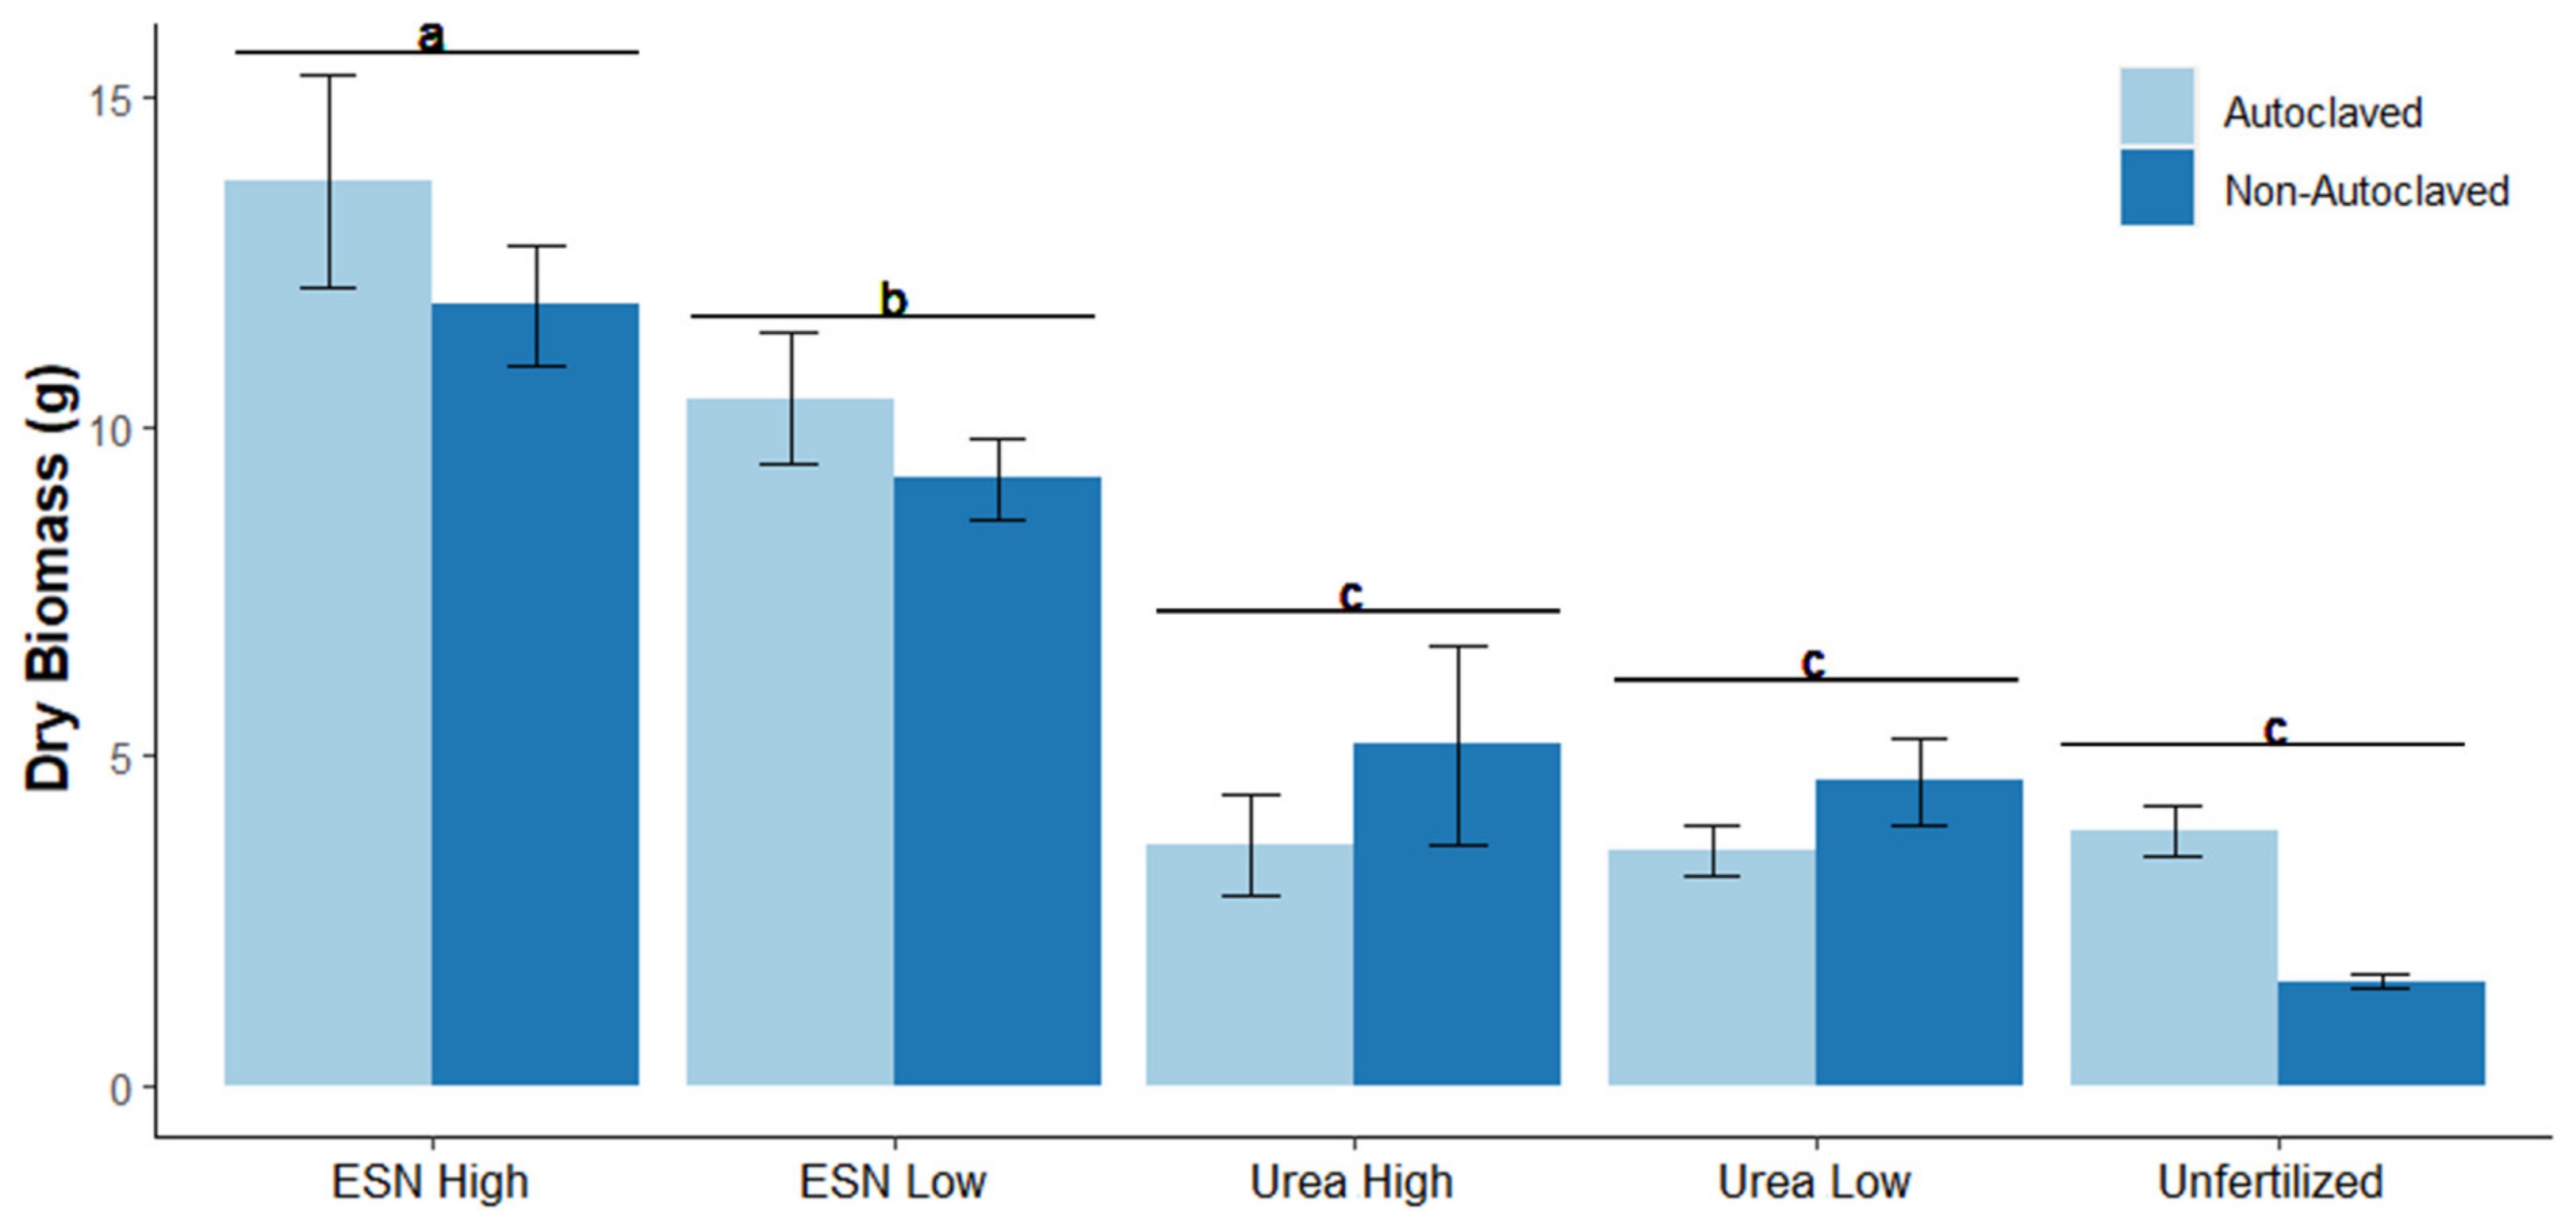
3.1. Total Plant Biomass

For treatments that had a plant present, the interaction between fertilizer rate and type significantly affected tomato dry biomass (p < 0.05) (Figure 1). At high rates of ESN, tomatoes accumulated greater biomass than at a low rate of ESN, either rate of urea, or the unfertilized control (Figure 1). The low rate of ESN resulted in less biomass accumulation than the high rate of ESN but more biomass than high rates of urea, low rates of urea, or the unfertilized control (Figure 1). Nitrogen toxicity symptoms manifested as shown in the urea-fertilized treatments; regardless of fertilization rates, urea-fertilized plants accumulated the same biomass as those that received no fertilizer (p > 0.05) (Figure 1). Although autoclave sterilization by itself did not significantly change biomass (p > 0.05), there was a significant interaction effect between autoclave sterilization and the type of fertilization (p < 0.05). In autoclaved soil, urea-fertilized plants had less biomass than ESN-fertilized plants and the unfertilized control (p < 0.05).

3.2. Soil Nitrate Analysis

Similar to the biomass results, for treatments with a plant present, the interaction between fertilizer rate and type significantly affected the log-transformed nitrate-N concentration in the soil (p < 0.05) (Figure 2). The high rate of ESN resulted in the greatest accumulation of soil N (p < 0.05) (Figure 2). The low rate of ESN, both rates of urea, and the unfertilized control did not differ in the final log-transformed soil nitrate-N concentration (p > 0.05) (Figure 2). Autoclave sterilization decreased the log-transformed soil N concentration (p < 0.05), but there was no interaction effect present between autoclave sterilization of the soil and fertilization rate or fertilization type (p > 0.05) (Figure 2).
For the treatments without a plant present, we observed a similar trend in the soil in which the greatest concentration of soil N was observed in the high rate of ESN treatment (p < 0.05) (Supplemental Figure S1). The low rate of ESN and high rate of urea had greater soil N concentration than the low rate of urea and the unfertilized control (p < 0.05) (Supplemental Figure S1). Unlike the soils with a plant present, soils without a plant were unaffected by the soil sterilization treatment (p > 0.05) (Supplementary Figure S1).

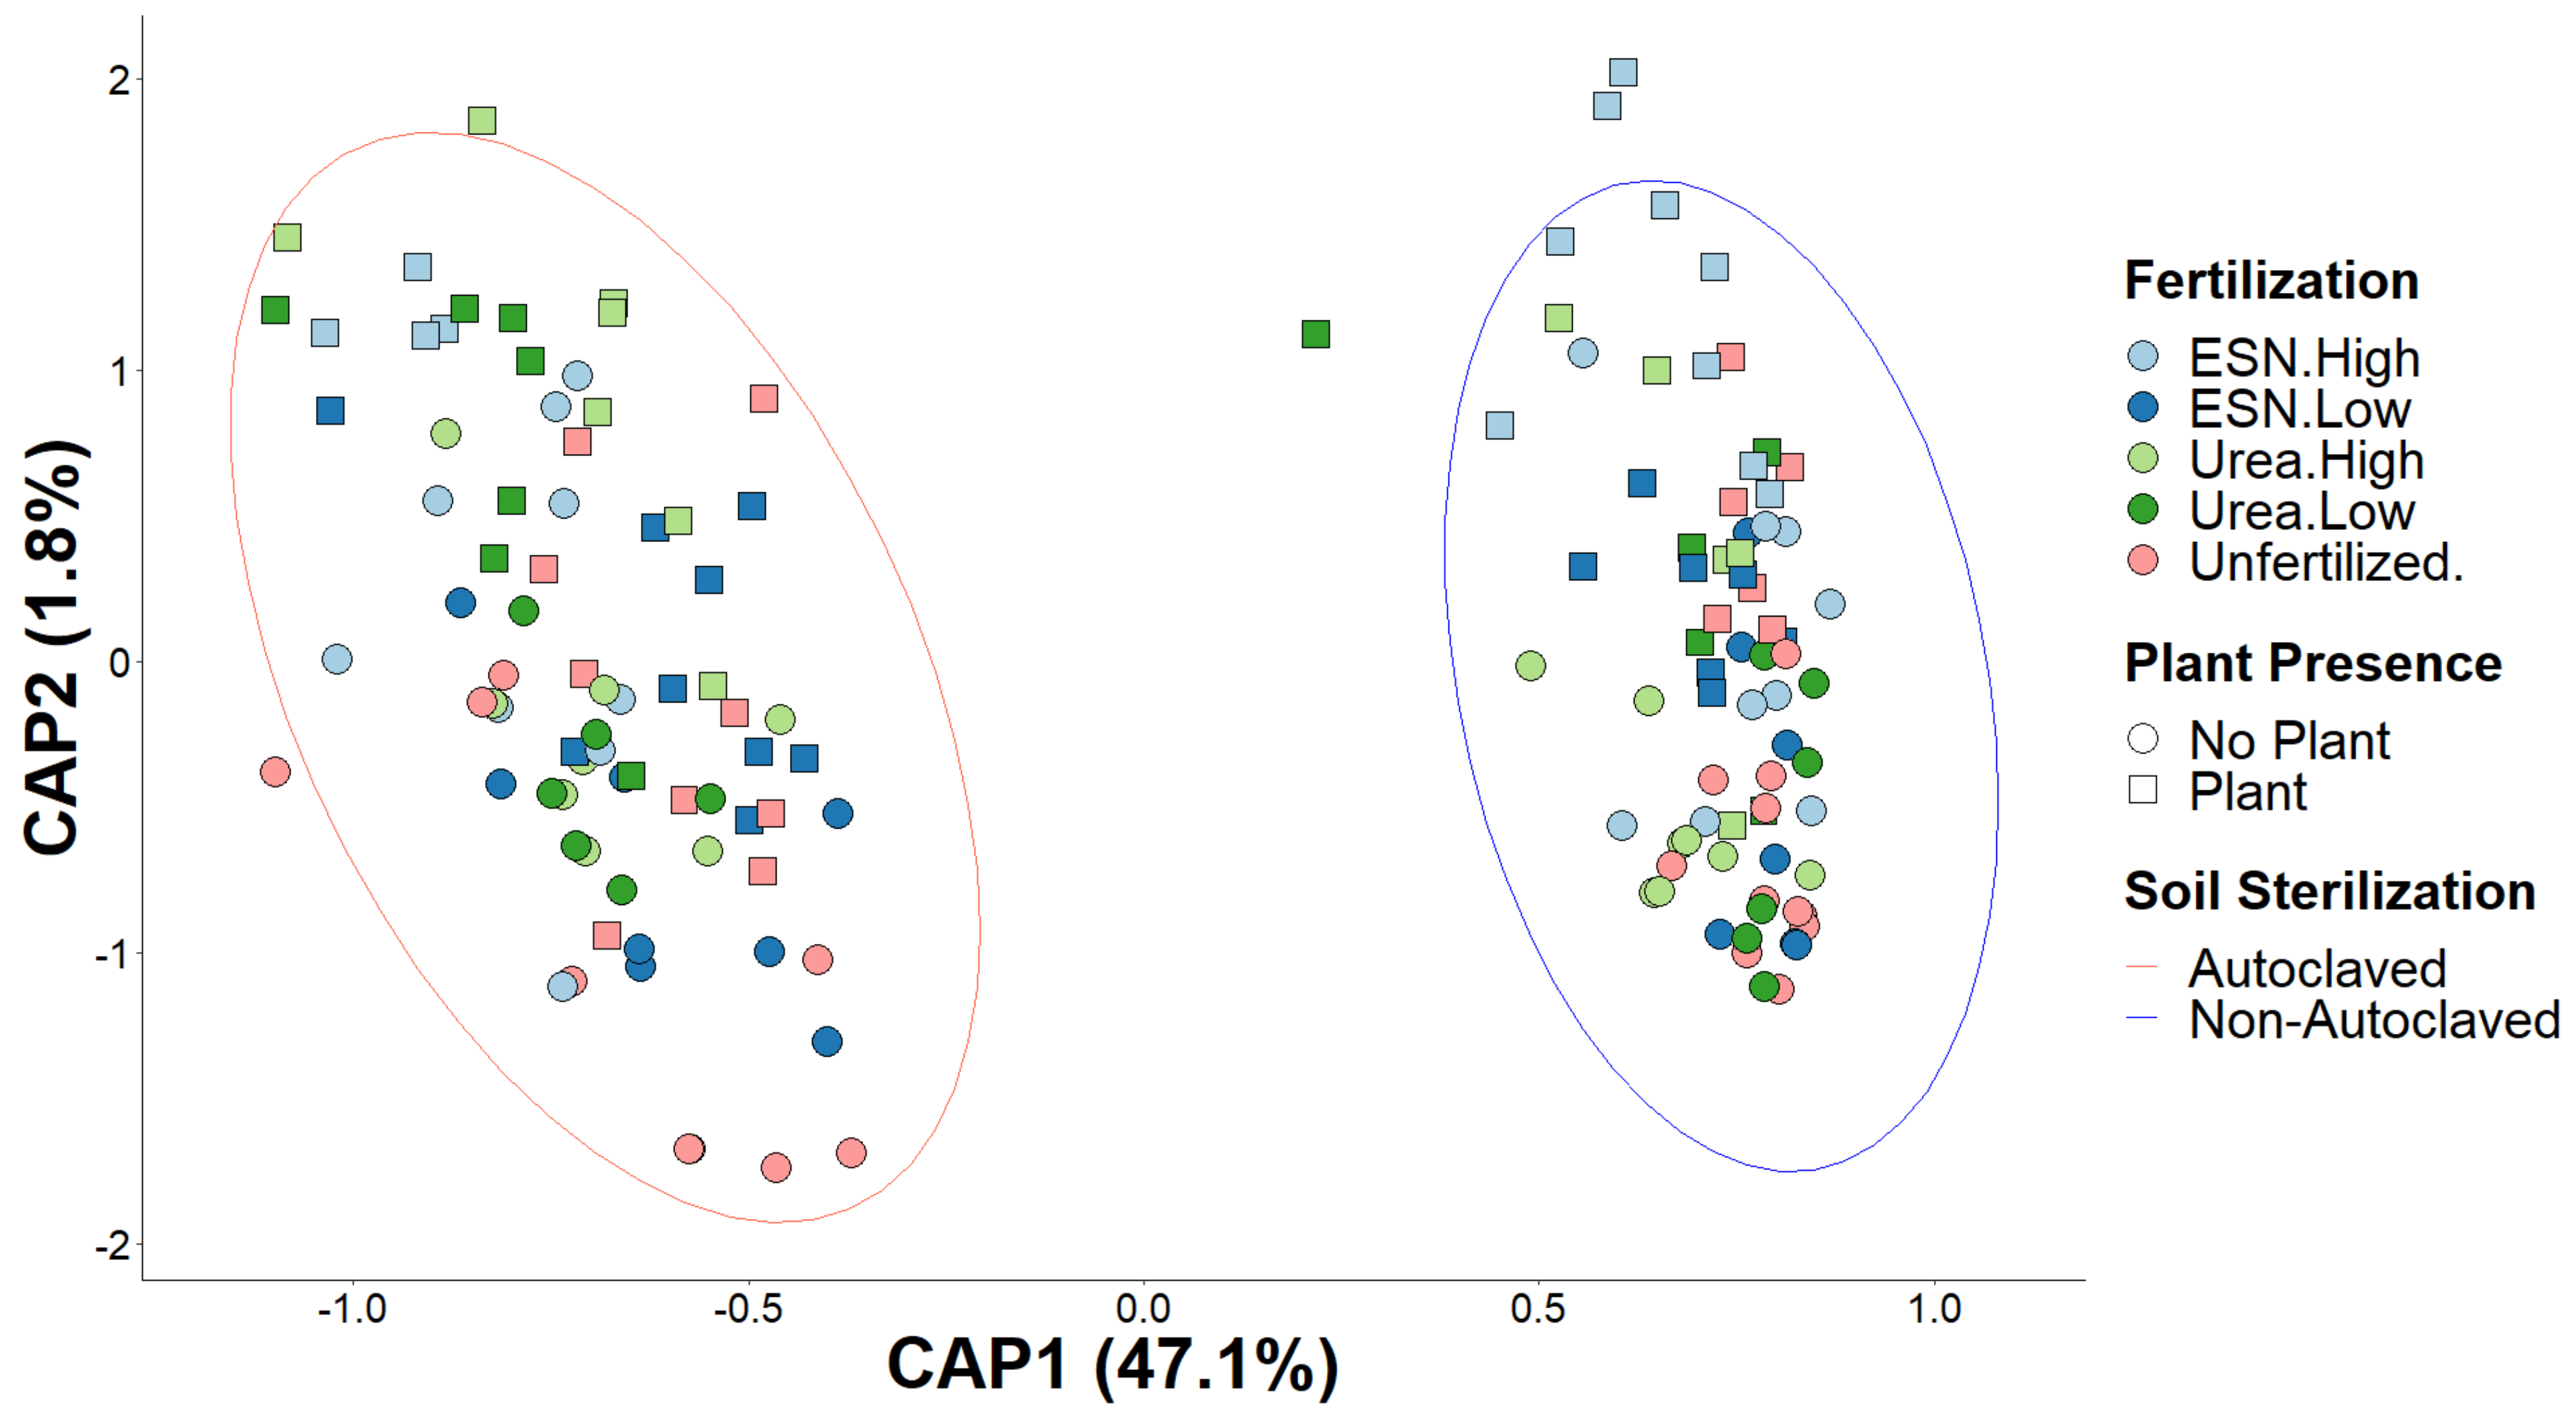
3.3. Soil Bacterial Community Composition

The bulk soil bacterial community structure changed with autoclave sterilization (p < 0.05) and plant presence (p < 0.05), but it did not change with fertilizer rate (p > 0.05) or fertilizer type (p > 0.05) (Figure 3). There was no significant interaction effect observed between the treatments. Initial soil sterilization was the greatest driver of change in community composition, with R2 = 0.47 (Figure 3).

3.4. Bacteria Abundance Changes with Fertilizer

Although the type of fertilizer used did not significantly change the overall community based on a perMANOVA using Bray–Curtis distances comparing the overall microbial structure, there were six bacterial species that changed in abundance as a result of fertilization (Table 3). Compared to the unfertilized control, six bacteria were significantly enriched in the bulk soil of the high rate of both ESN and urea (Nitrobacter winogradskyi, Nitrosomonas communis, Nitrosospira multiformis, Bacillus sp. OxB-1, Brevendimonas naejangsanensis, Nitrosospira briensis) (p < 0.05) (Table 3). Bulk soil fertilized with the high rate of ESN also had greater bacterial populations compared to the low rate of urea (Nitrosospira lacus, Nitrosospira multiformis, Nitrospira defluvii, Archangium gephyra, Brevendimonas naejangsanensis, Nitrosospira briensis) and low rate of ESN (Nitrosospira multiformis, Brevendimonas naejangsanensis, Nitrosospira briensis) (p < 0.05) (Table 3). The high rate of urea also showed increased bacterial abundances compared to the other fertilizer groups: high ESN (Sporosarcina koreensis, Sporosarcina luteola, Sporosarcina soli) (p < 0.05), low ESN (Sporosarcina koreensis, Sporosarcina luteola, Sporosarcina soli, Brevendimonas naejangsanensis, Nitrosospira briensis) (p < 0.05), low urea (Sporosarcina koreensis, Sporosarcina luteola, Sporosarcina soli, Bacillus lentus, Brevendimonas naejangsanensis) (p < 0.05) (Table 3).
There was also bacterial enrichment in the low rates of fertilization in which the low rate of ESN had two soil bacteria increased compared to the unfertilized control (Bacillus lentus, Bacillus sp. OxB-1) (p < 0.05), and the low rate of urea had one increase relative to the control (Bacillus sp. OxB-1) (p < 0.05) (Table 3). The unfertilized control showed one bacterial species to have a greater population than the high rate of ESN (Chthoniobacter flavus) and one greater than the high rate of urea (Archangium gephyra) (p < 0.05) (Table 3). These bacteria enriched in soils that were unfertilized or fertilized at low rates were not nitrifying or denitrifying bacteria. Rather, among all differentially abundant bacteria, those with the capability of nitrification and denitrification were enriched in soils fertilized at the high rate of urea and high rate of ESN (Table 3).

3.5. Nitrogen-Cycling Bacteria Abundance

Autoclave sterilization greatly affected the soil microbiome. The total abundance of N-cycling bacteria (as determined by 16S rRNA gene copies g−1 soil) decreased with autoclave sterilization (p < 0.05) (Table 4). An interaction effect was present between the fertilization and soil sterilization treatment which affected the abundance of N-fixing bacteria, as predicted by the nifH gene (p < 0.05) (Table 4). Most non-autoclaved soils (unfertilized, high rate of ESN, high rate of urea, low rate of urea) had more N-fixing bacteria than most of the autoclaved soils (unfertilized, low rate of urea, high rate of urea) (p < 0.05) (Table 4). Two genes were identified to determine the presence of nitrifying bacteria: pmoA-amoA, hao. There was a significant interaction effect between fertilization and autoclave sterilization when examining both genes. The high rate of ESN had a greater abundance of pmoA-amoA than every other treatment (p < 0.05) and a greater abundance of hao than every treatment (p < 0.05) except the high rate of urea in non-autoclaved soil (p > 0.05) (Table 4). Two genes were also selected to identify denitrifying bacteria: nirK and nosZ. Unlike what was observed for the nitrifying genes, there was only a significant interaction effect regarding the nirK gene, wherein the high rate of urea and the high rate of ESN in the non-autoclaved soil had a greater abundance of nirK-hosting bacteria than the low rate of urea and unfertilized control in the autoclave-sterilized soil (p < 0.05) (Table 4). Although the interaction effect was not significant for the abundance of the nosZ gene, there was a significant effect of soil sterilization (p < 0.05). Soils that were autoclaved had less of an abundance of nosZ compared to soils that were not autoclaved (p < 0.05) (Table 4).

4. Discussion

Excessive nitrogen (N) fertilization causes agricultural losses through stunted crop growth [45], nitrate leaching [46], and nitrification [47]. Nitrogen toxicity, especially in the form of ammonium (NH4+), reduces plant biomass accumulation [48] and increases incidence of chlorosis [49] and leaf tip necrosis [50]. With increasing NH4+ fertilization in tomato, N use efficiency, leaf area, and biomass decrease [45], and bulk soil microbial diversity decreases [51]. However, little research has been conducted on how the release rate of potentially toxic levels of N affects soil microbial communities. Here, we imposed N toxicity through application of high rates of quick release urea. To examine if N toxicity symptoms would be present if applied at a different release rate, equivalent concentrations of polymer-coated Environmentally Smart Nitrogen (ESN) were also applied to plants.
As expected, high rates of quick release N resulted in the manifestation of N toxicity symptoms. Observationally, our urea-fertilized tomatoes showed signs of chlorosis and tip burn. Reduced growth rate is another known symptom of N toxicity [52], and this growth pattern was observed in our tomato plants grown at the highest rate of quick release N. At low and high rates of urea fertilization, tomato biomass accumulation was unchanged relative to the control, suggesting that when toxic rates of N are applied in soluble forms, tomato seedling growth is largely affected. Other researchers have observed stunted growth as a result of toxic rates of N fertilization in vegetables such as lettuce (Lactuca sativa) [49], green bean (Phaseolus vulgaris) [53], and pepper (Capsicum annum) [54]. However, using CRF to alleviate tomato N toxicity symptoms may not be effective in all circumstances. Ozores-Hampton et al. [55] found that polymer-coated urea did not increase yield compared to soluble N in all treatments; in soils with an established pool of high NH4+-N concentration, high rates (190 kg/ha) of polymer-coated urea exacerbated N toxicity. The authors suggested that the reason that N toxicity symptoms manifested was because of cold temperature events and a saturated soil condition and that polymer-coated urea benefits are optimized when soils are well drained and in non-freezing conditions [55].
While we observed clear amelioration of N toxicity from the use of ESN compared to urea, the soil microbiome was left largely unaffected by the fertilizer treatment. The soil microbiome showcased great resiliency; the whole bacterial community composition did not change as a function of fertilizer rate or type. This finding is supported by a recent study which found that the wheat soil microbiome did not change when fertilized with urea compared to a microalgae-based biofertilizer [56]. Further, Lourenço et al. [57] determined that while soil microbiomes were initially altered by the application of organic and inorganic N, they eventually recovered their original soil microbial community. Therefore, at common fertilization rates, soil microbiomes are largely unaffected across a crop’s growing period. However, even though soil microbiomes recover with time, at the point of applying an organic N fertilizer, soil microbial communities change [57]. One possible explanation for why the soil bacteriome was minimally affected by N toxicity is that the autoclaving process may have promoted healthy root growth that may have mitigated potential N toxicity. Soil sterilization via autoclave has been shown to increase wheat root biomass, length, surface area, and volume compared to plants grown in soils that were left unsterilized [58]. Soil sterilization via autoclave may bring strong benefits to plants, particularly in the short term (i.e., within one planting cycle). In a recent study conducted by Newberger et al. [29], it was found that plant biomass increased in the first cycle of planting, but in the second cycle, biomass decreased in the soils that were initially autoclaved. Thus, soil sterilization may benefit plant growth and soil microbiome resiliency, especially in the time period of a single planting cycle. Soil microbiome resiliency may also be attributed to functional redundancy that occurs in microbial ecosystems [59]. Future studies should therefore incorporate comprehensive functional profiling to elucidate possible redundancies that may be supporting microbial and plant growth in conditions of high N stress.
Although we did not see changes in the overall community based on perMANOVA, subtle species-level changes were observed as a result of fertilization. High rates of urea fertilization have been shown to alter rhizosphere and bulk soil bacterial richness and community composition in vegetable crops [51]. Similarly, regardless of fertilizer type, when N was applied at high rates, nitrifying bacteria increased in abundance, and these bacteria may have competed with plants for N assimilation. Nitrifying bacteria have been used to recover N from wastewater because they have effective (over 80%) NH4+-N and total N removal efficiencies in pure culture and open reactor systems [60]. In studies using stable isotope probing, researchers have found that in the short term, microbes effectively compete with plant roots for N in the soil solution, particularly for NH4+-N [12,61,62]. Thus, bacteria in our targeted amplicon sequencing study, especially those capable of nitrification, may be responding to and assimilating the increased levels of nutrition. Compared to whole metagenome sequencing, targeted amplicon sequencing has lower sensitivity [63], and therefore, future studies investigating the effects of varying N rates on the soil microbiome should incorporate sequencing of whole genomes.
Nitrification produces soil-mobile nitrate and gaseous nitrous oxide, which can result in up to 50% losses of plant-available N [47]. We found that when N was applied as quick release urea and at the low rate of ESN, soil N retention (i.e., final plant-available soil nitrate-N concentration) was as low as the unfertilized control. Similarly, Mo et al. [46] modeled urea loss from soil systems through rain-driven leaching and found that urea leaching from agroecosystems is a risk and urea should not be applied before heavy rain events. However, these losses are mitigated when urea is supplied in a polymer-coated form [64]. Polymer-coated ESN has been shown to release in clay soils across a period of 40 days when temperatures are above 20 °C [26]. Therefore, although urea may be quickly lost from soil systems, N release by ESN is delayed and thus reduces N loss from soil systems. We found that when ESN was used to fertilize plants at high rates, soil N retention was greater than for urea-fertilized plants, the low rate of ESN, and the unfertilized control. This finding is in congruence with other studies that have determined slow-releasing N fertilizers to have greater final soil N concentration [64,65,66]. Because CRF releases nutrients slowly [67], a majority of available N may have been taken up by the plant roots when ESN was applied at low rates. Thus, a smaller pool of plant-available N would remain at the end of the growing period. Further, polymer-coated urea fertilizers, including ESN, have been recently shown to reduce gaseous N losses from volatilization [68]. However, a limitation here is that we did not measure other soil N fractions, which could illustrate soil N dynamics in greater detail.
Although the high rate of ESN promoted soil N retention, it did not increase the abundance of nitrifying bacteria relative to the high rate of urea. Rather, nitrifying bacteria responded more to the total amount of N fertilizer applied. This finding is in contrast with Ma et al. [69] who found that, compared to quick release urea, application of polymer-coated urea caused an increase in N-cycling bacteria. These differences could be attributed to the authors growing a different crop (wheat) for a longer time (approximately 200 days), both of which can affect the soil microbiome [33,70]. In our study, we harvested plants 56 days after fertilization, which is after all the N in the ESN was expected to release [26]. Thus, future studies investigating how slow release fertilizers affect soil microbial communities might benefit from examining soils temporally in order to observe potential changes as the slow release fertilizer dissolves. Rather than fertilization causing the greatest change in N-cycling bacterial populations, it was autoclave sterilization of the soil that was the greatest driver of change. Autoclave sterilization explained nearly 50% of the variation in the composition of the microbiome and resulted in reduced NO3-N accumulation in the soil. This reduction in soil N from autoclaving the soil may explain the differences in bacterial population dynamics. For example, autoclave sterilizing the soil led to a decrease in the abundance of denitrifying bacteria and N-fixing bacteria. This finding is in agreement with Li et al. [28] who found that the N fixation gene (nifH) decreased in soils that had been sterilized. Thus, autoclave sterilization allowed for soils to repopulate with bacteria that had functions other than N cycling and may have led to a reduction in microbial N competitors. This conclusion is supported by a recent study [71] reporting that tomatoes grown in soils that were heavily disrupted by autoclave sterilization showed increased growth likely as a result of reduced competition (including both plant–microbe and microbe–microbe competition) in the rhizosphere. The total abundance of bacteria also decreased as a function of autoclave sterilization. However, fertilization did not have a significant effect. This finding is in contrast with Castellano-Hinojosa [51] who reported a decrease in the amplicon sequence variant values when bulk soils with tomato were fertilized with urea. However, the authors applied recommended (i.e., non-toxic) rates of urea and collected samples when tomatoes were fruiting, both of which may have affected the composition of the microbiome. Thus, future studies on N toxicity may benefit from focusing on temporal elements which influence how microbial communities respond to N.

5. Conclusions

In summary, N toxicity did not affect the whole soil microbiome but did affect plant health. Controlled release Environmentally Smart Nitrogen (ESN) mitigated the effects of N toxicity as indicated by biomass and soil NO3-N retention; ESN-fertilized plants accumulated the greatest biomass, even at toxic rates. High rates of N increase the population of nitrifying bacteria. Greater nitrification rates coupled with overall high rates of N fertilization may increase N loss from agroecosystems which may increase incidence of N contamination in groundwater. These negative effects may be ameliorated by using polymer-coated fertilizer, because ESN increased soil N retention compared to urea-fertilized plants.

Supplementary Materials

The following supporting information can be downloaded at: https://www.mdpi.com/article/10.3390/applmicrobiol3040087/s1, Figure S1: Nitrate-N Concentration in Soils without a Plant.

Author Contributions

Conceptualization, C.R.R., J.A.D., D.K.M. and J.M.V.; Methodology, J.A.D., D.K.M. and J.M.V.; Formal analysis, M.M.D. and D.K.M.; Investigation, C.R.R.; Data curation, M.M.D., C.R.R. and D.K.M.; Writing—original draft, C.R.R., M.M.D. and J.M.V.; Writing—review & editing, C.R.R., M.M.D., J.A.D., D.K.M. and J.M.V.; Visualization, M.M.D.; Supervision, J.M.V.; Project administration, J.M.V.; Funding acquisition, J.A.D. and D.K.M. All authors have read and agreed to the published version of the manuscript.

Funding

This research was funded through the USDA Cooperative Agreement.

Data Availability Statement

Data are contained within the article and Supplementary Materials.

Acknowledgments

We also thank Timothy Creed for kindly helping to extract and sequence microbial DNA.

Conflicts of Interest

The authors declare no conflict of interest.

References

  1. Kraiser, T.; Gras, D.E.; Gutiérrez, A.G.; Gonzalez, B.; Gutiérrez, R.A. A holistic view of nitrogen acquisition in plants. J. Exp. Bot. 2011, 62, 1455–1466. [Google Scholar] [CrossRef]
  2. Galloway, J.N.; Dentener, F.J.; Capone, D.G.; Boyer, E.W.; Howarth, R.W.; Seitzinger, S.P.; Asner, G.P.; Cleveland, C.C.; Green, P.; Holland, E.A. Nitrogen cycles: Past, present, and future. Biogeochemistry 2004, 70, 153–226. [Google Scholar] [CrossRef]
  3. Cameron, K.C.; Di, H.J.; Moir, J.L. Nitrogen losses from the soil/plant system: A review. Ann. Appl. Biol. 2013, 162, 145–173. [Google Scholar] [CrossRef]
  4. Zhao, Z.-B.; He, J.-Z.; Geisen, S.; Han, L.-L.; Wang, J.-T.; Shen, J.-P.; Wei, W.-X.; Fang, Y.-T.; Li, P.-P.; Zhang, L.-M. Protist communities are more sensitive to nitrogen fertilization than other microorganisms in diverse agricultural soils. Microbiome 2019, 7, 33. [Google Scholar] [CrossRef]
  5. Yang, T.; Lupwayi, N.; Marc, S.-A.; Siddique, K.H.; Bainard, L.D. Anthropogenic drivers of soil microbial communities and impacts on soil biological functions in agroecosystems. Glob. Ecol. Conserv. 2021, 27, e01521. [Google Scholar] [CrossRef]
  6. Zeng, J.; Liu, X.; Song, L.; Lin, X.; Zhang, H.; Shen, C.; Chu, H. Nitrogen fertilization directly affects soil bacterial diversity and indirectly affects bacterial community composition. Soil Biol. Biochem. 2016, 92, 41–49. [Google Scholar] [CrossRef]
  7. Kavamura, V.N.; Hayat, R.; Clark, I.M.; Rossmann, M.; Mendes, R.; Hirsch, P.R.; Mauchline, T.H. Inorganic nitrogen application affects both taxonomical and predicted functional structure of wheat rhizosphere bacterial communities. Front. Microbiol. 2018, 9, 1074. [Google Scholar] [CrossRef]
  8. Dixon, M.; Rohrbaugh, C.; Afkairin, A.; Vivanco, J. Impacts of the Green Revolution on Rhizosphere Microbiology Related to Nutrient Acquisition. Appl. Microbiol. 2022, 2, 992–1003. [Google Scholar] [CrossRef]
  9. Kaye, J.P.; Hart, S.C. Competition for nitrogen between plants and soil microorganisms. Trends Ecol. Evol. 1997, 12, 139–143. [Google Scholar] [CrossRef]
  10. Kuzyakov, Y.; Xu, X. Competition between roots and microorganisms for nitrogen: Mechanisms and ecological relevance. New Phytol. 2013, 198, 656–669. [Google Scholar] [CrossRef]
  11. Liu, Q.; Qiao, N.; Xu, X.; Xin, X.; Han, J.Y.; Tian, Y.; Ouyang, H.; Kuzyakov, Y. Nitrogen acquisition by plants and microorganisms in a temperate grassland. Sci. Rep. 2016, 6, 22642. [Google Scholar] [CrossRef]
  12. Inselsbacher, E.; Umana, N.H.-N.; Stange, F.C.; Gorfer, M.; Schüller, E.; Ripka, K.; Zechmeister-Boltenstern, S.; Hood-Novotny, R.; Strauss, J.; Wanek, W. Short-term competition between crop plants and soil microbes for inorganic N fertilizer. Soil Biol. Biochem. 2010, 42, 360–372. [Google Scholar] [CrossRef]
  13. Kastl, E.-M.; Schloter-Hai, B.; Buegger, F.; Schloter, M. Impact of fertilization on the abundance of nitrifiers and denitrifiers at the root–soil interface of plants with different uptake strategies for nitrogen. Biol. Fertil. Soils 2015, 51, 57–64. [Google Scholar] [CrossRef]
  14. Zhu, Q.; Riley, W.J.; Tang, J.; Koven, C.D. Multiple soil nutrient competition between plants, microbes, and mineral surfaces: Model development, parameterization, and example applications in several tropical forests. Biogeosciences 2016, 13, 341–363. [Google Scholar] [CrossRef]
  15. Norton, J.; Ouyang, Y. Controls and adaptive management of nitrification in agricultural soils. Front. Microbiol. 2019, 10, 1931. [Google Scholar] [CrossRef]
  16. Alphei, J.; Scheu, S. Effects of biocidal treatments on biological and nutritional properties of a mull-structured woodland soil. In Soil Structure/Soil Biota Interrelationships; Elsevier: Amsterdam, The Netherlands, 1993; pp. 435–448. [Google Scholar]
  17. Dimkpa, C.O.; Fugice, J.; Singh, U.; Lewis, T.D. Development of fertilizers for enhanced nitrogen use efficiency–Trends and perspectives. Sci. Total Environ. 2020, 731, 139113. [Google Scholar] [CrossRef]
  18. Timilsena, Y.P.; Adhikari, R.; Casey, P.; Muster, T.; Gill, H.; Adhikari, B. Enhanced efficiency fertilisers: A review of formulation and nutrient release patterns. J. Sci. Food Agric. 2015, 95, 1131–1142. [Google Scholar] [CrossRef]
  19. Delgado, J.; Mosier, A. Mitigation Alternatives to Decrease Nitrous Oxides Emissions and Urea-Nitrogen Loss and Their Effect on Methane Flux; Wiley Online Library: Hoboken, NJ, USA, 1996. [Google Scholar]
  20. Rathnappriya, R.; Sakai, K.; Okamoto, K.; Kimura, S.; Haraguchi, T.; Nakandakari, T.; Setouchi, H.; Bandara, W. Examination of the effectiveness of controlled release fertilizer to balance sugarcane yield and reduce nitrate leaching to groundwater. Agronomy 2022, 12, 695. [Google Scholar] [CrossRef]
  21. Thapa, R.; Chatterjee, A.; Awale, R.; McGranahan, D.A.; Daigh, A. Effect of enhanced efficiency fertilizers on nitrous oxide emissions and crop yields: A meta-analysis. Soil Sci. Soc. Am. J. 2016, 80, 1121–1134. [Google Scholar] [CrossRef]
  22. Akiyama, H.; Yan, X.; Yagi, K. Evaluation of effectiveness of enhanced-efficiency fertilizers as mitigation options for N2O and NO emissions from agricultural soils: Meta-analysis. Glob. Chang. Biol. 2010, 16, 1837–1846. [Google Scholar] [CrossRef]
  23. Sempeho, S.I.; Kim, H.T.; Mubofu, E.; Hilonga, A. Meticulous overview on the controlled release fertilizers. Adv. Chem. 2014, 2014, 363071. [Google Scholar] [CrossRef]
  24. Lawrencia, D.; Wong, S.K.; Low, D.Y.S.; Goh, B.H.; Goh, J.K.; Ruktanonchai, U.R.; Soottitantawat, A.; Lee, L.H.; Tang, S.Y. Controlled release fertilizers: A review on coating materials and mechanism of release. Plants 2021, 10, 238. [Google Scholar] [CrossRef] [PubMed]
  25. Houser, M. Farmer Motivations for Excess Nitrogen Use in the US Corn Belt. Case Stud. Environ. 2022, 6, 1688823. [Google Scholar] [CrossRef]
  26. Golden, B.; Slaton, N.; Norman, R.; Gbur, E.; Wilson, C. Nitrogen release from environmentally smart nitrogen fertilizer as influenced by soil series, temperature, moisture, and incubation method. Commun. Soil Sci. Plant Anal. 2011, 42, 1809–1824. [Google Scholar] [CrossRef]
  27. Liu, H.; Qiu, Z.; Ye, J.; Verma, J.P.; Li, J.; Singh, B.K. Effective colonisation by a bacterial synthetic community promotes plant growth and alters soil microbial community. J. Sustain. Agric. Environ. 2022, 1, 30–42. [Google Scholar] [CrossRef]
  28. Li, K.; DiLegge, M.J.; Minas, I.S.; Hamm, A.; Manter, D.; Vivanco, J.M. Soil sterilization leads to re-colonization of a healthier rhizosphere microbiome. Rhizosphere 2019, 12, 100176. [Google Scholar] [CrossRef]
  29. Newberger, D.R.; Minas, I.S.; Manter, D.K.; Vivanco, J.M. A Microbiological Approach to Alleviate Soil Replant Syndrome in Peaches. Microorganisms 2023, 11, 1448. [Google Scholar] [CrossRef]
  30. O’sullivan, L.A.; Roussel, E.G.; Weightman, A.J.; Webster, G.; Hubert, C.R.; Bell, E.; Head, I.; Sass, H.; Parkes, R.J. Survival of Desulfotomaculum spores from estuarine sediments after serial autoclaving and high-temperature exposure. ISME J. 2015, 9, 922–933. [Google Scholar] [CrossRef]
  31. Urbaniak, G.C.; Plous, S. Research Randomizer (Version 4.0). Available online: https://www.randomizer.org/ (accessed on 1 September 2021).
  32. Zhang, S.; Liu, Y.; Du, M.; Shou, G.; Wang, Z.; Xu, G. Nitrogen as a regulator for flowering time in plant. Plant Soil 2022, 480, 1–29. [Google Scholar] [CrossRef]
  33. Chaparro, J.M.; Badri, D.V.; Vivanco, J.M. Rhizosphere microbiome assemblage is affected by plant development. ISME J. 2014, 8, 790–803. [Google Scholar] [CrossRef]
  34. Wick, R.; Menzel, P. rrwick/Filtlong: Quality Filtering Tool for Long Reads. 2017. Available online: https://github.com/rrwick/Filtlong/ (accessed on 1 December 2021).
  35. Martin, M. Cutadapt removes adapter sequences from high-throughput sequencing reads. EMBnet. J. 2011, 17, 10–12. [Google Scholar] [CrossRef]
  36. Rognes, T.; Flouri, T.; Nichols, B.; Quince, C.; Mahé, F. VSEARCH: A versatile open source tool for metagenomics. PeerJ 2016, 4, e2584. [Google Scholar] [CrossRef] [PubMed]
  37. Li, H. Minimap2: Pairwise alignment for nucleotide sequences. Bioinformatics 2018, 34, 3094–3100. [Google Scholar] [CrossRef] [PubMed]
  38. Curry, K.D.; Wang, Q.; Nute, M.G.; Tyshaieva, A.; Reeves, E.; Soriano, S.; Wu, Q.; Graeber, E.; Finzer, P.; Mendling, W. Emu: Species-level microbial community profiling of full-length 16S rRNA Oxford Nanopore sequencing data. Nat. Methods 2022, 19, 845–853. [Google Scholar] [CrossRef] [PubMed]
  39. Douglas, G.M.; Maffei, V.J.; Zaneveld, J.R.; Yurgel, S.N.; Brown, J.R.; Taylor, C.M.; Huttenhower, C.; Langille, M.G. PICRUSt2 for prediction of metagenome functions. Nat. Biotechnol. 2020, 38, 685–688. [Google Scholar] [CrossRef]
  40. Manter, D.K.; Hamm, A.K.; Deel, H.L. Community structure and abundance of ACC deaminase containing bacteria in soils with 16S-PICRUSt2 inference or direct acdS gene sequencing. J. Microbiol. Methods 2023, 211, 106740. [Google Scholar] [CrossRef]
  41. Eddy, S.R. Accelerated profile HMM searches. PLoS Comput. Biol. 2011, 7, e1002195. [Google Scholar] [CrossRef]
  42. Barbera, P.; Kozlov, A.M.; Czech, L.; Morel, B.; Darriba, D.; Flouri, T.; Stamatakis, A. EPA-ng: Massively parallel evolutionary placement of genetic sequences. Syst. Biol. 2019, 68, 365–369. [Google Scholar] [CrossRef]
  43. Louca, S.; Doebeli, M. Efficient comparative phylogenetics on large trees. Bioinformatics 2018, 34, 1053–1055. [Google Scholar] [CrossRef]
  44. Varet, H.; Brillet-Guéguen, L.; Coppée, J.-Y.; Dillies, M.-A. SARTools: A DESeq2-and EdgeR-based R pipeline for comprehensive differential analysis of RNA-Seq data. PLoS ONE 2016, 11, e0157022. [Google Scholar] [CrossRef]
  45. Barreto, R.; Prado, R.; Leal, A.; Troleis, M.; Junior, G.S.; Monteiro, C.; Santos, L.; Carvalho, R. Mitigation of ammonium toxicity by silicon in tomato depends on the ammonium concentration. Acta Agric. Scand. Sect. B—Soil Plant Sci. 2016, 66, 483–488. [Google Scholar] [CrossRef]
  46. Mo, X.; Peng, H.; Xin, J.; Wang, S. Analysis of urea nitrogen leaching under high-intensity rainfall using HYDRUS-1D. J. Environ. Manag. 2022, 312, 114900. [Google Scholar] [CrossRef] [PubMed]
  47. Beeckman, F.; Motte, H.; Beeckman, T. Nitrification in agricultural soils: Impact, actors and mitigation. Curr. Opin. Biotechnol. 2018, 50, 166–173. [Google Scholar] [CrossRef] [PubMed]
  48. Goyal, S.S.; Huffaker, R.C. Nitrogen toxicity in plants. Nitrogen Crop Prod. 1984, 97–118. [Google Scholar] [CrossRef]
  49. Hoque, M.M.; Ajwa, H.A.; Smith, R. Nitrite and ammonium toxicity on lettuce grown under hydroponics. Commun. Soil Sci. Plant Anal. 2007, 39, 207–216. [Google Scholar] [CrossRef]
  50. Shedley, E.; Dell, B.; Grove, T. Effects of inorganic nitrogen forms on growth of Eucalyptus globulus seedlings. In Plant Nutrition—From Genetic Engineering to Field Practice: Proceedings of the Twelfth International Plant Nutrition Colloquium, 21–26 September 1993, Perth, Western Australia; Springer Netherlands: Cham, The Netherlands, 1993; pp. 595–598. [Google Scholar]
  51. Castellano-Hinojosa, A.; Strauss, S.L.; González-López, J.; Bedmar, E.J. Changes in the diversity and predicted functional composition of the bulk and rhizosphere soil bacterial microbiomes of tomato and common bean after inorganic N-fertilization. Rhizosphere 2021, 18, 100362. [Google Scholar] [CrossRef]
  52. Rehman, S.; Fayaz, H.; Rehmaan, I.U.; Rashid, K.; Rashid, S. Nitrogen Toxicity in Plants, Symptoms, and Safeguards. In Advances in Plant Nitrogen Metabolism; CRC Press: Boca Raton, FL, USA, 2022; pp. 213–225. [Google Scholar]
  53. Sánchez, E.; Soto, J.M.; García, P.C.; López-Lefebre, L.R.; Rivero, R.M.; Ruiz, J.M.; Romero, L. Phenolic compounds and oxidative metabolism in green bean plants under nitrogen toxicity. Funct. Plant Biol. 2000, 27, 973–978. [Google Scholar] [CrossRef]
  54. Kamnqa, U.; Etsassala, N.G.; Akinpelu, E.A.; Nchu, F. Effects of Varying Nitrogen Fertilization on Growth, Yield and Flowering of Capsicum annuum (California wonder). In Proceedings of the 18th SOUTH AFRICA Int’l Conference on Agricultural, Chemical, Biological & Environmental Sciences (ACBES-20), Johannesburg, South Africa, 16–17 November 2020; pp. 16–17. [Google Scholar]
  55. Ozores-Hampton, M.; Simonne, E.; Morgan, K.; Cushman, K.; Sato, S.; Albright, C.; Waldo, E.; Polak, A. Can we use controlled release fertilizers (CRF) in tomato production. Proc. Fla. Tomato Inst. PRO526 2009, 10–13. [Google Scholar] [CrossRef]
  56. Shrestha, R.C.; Ghazaryan, L.; Poodiack, B.; Zorin, B.; Gross, A.; Gillor, O.; Khozin-Goldberg, I.; Gelfand, I. The effects of microalgae-based fertilization of wheat on yield, soil microbiome and nitrogen oxides emissions. Sci. Total Environ. 2022, 806, 151320. [Google Scholar] [CrossRef]
  57. Lourenço, K.S.; Suleiman, A.K.; Pijl, A.; Van Veen, J.; Cantarella, H.; Kuramae, E. Resilience of the resident soil microbiome to organic and inorganic amendment disturbances and to temporary bacterial invasion. Microbiome 2018, 6, 142. [Google Scholar] [CrossRef]
  58. Mahmood, T.; Mehnaz, S.; Fleischmann, F.; Ali, R.; Hashmi, Z.; Iqbal, Z. Soil sterilization effects on root growth and formation of rhizosheaths in wheat seedlings. Pedobiologia 2014, 57, 123–130. [Google Scholar] [CrossRef]
  59. Jurburg, S.D.; Salles, J.F. Functional redundancy and ecosystem function—The soil microbiota as a case study. In Biodiversity in Ecosystems-Linking Structure and Function; IntechOpen Limited: London, UK, 2015; pp. 29–49. [Google Scholar] [CrossRef]
  60. Han, F.; Zhou, W. Nitrogen recovery from wastewater by microbial assimilation—A review. Bioresour. Technol. 2022, 363, 127933. [Google Scholar] [CrossRef] [PubMed]
  61. Harrison, K.A.; Bol, R.; Bardgett, R.D. Preferences for different nitrogen forms by coexisting plant species and soil microbes. Ecology 2007, 88, 989–999. [Google Scholar] [CrossRef] [PubMed]
  62. Jackson, L.E.; Schimel, J.P.; Firestone, M.K. Short-term partitioning of ammonium and nitrate between plants and microbes in an annual grassland. Soil Biol. Biochem. 1989, 21, 409–415. [Google Scholar] [CrossRef]
  63. Poretsky, R.; Rodriguez-R, L.M.; Luo, C.; Tsementzi, D.; Konstantinidis, K.T. Strengths and limitations of 16S rRNA gene amplicon sequencing in revealing temporal microbial community dynamics. PLoS ONE 2014, 9, e93827. [Google Scholar] [CrossRef]
  64. Naz, M.Y.; Sulaiman, S.A. Slow release coating remedy for nitrogen loss from conventional urea: A review. J. Control. Release 2016, 225, 109–120. [Google Scholar] [CrossRef]
  65. Zhu, Q.; Zhang, M.; Ma, Q. Copper-based foliar fertilizer and controlled release urea improved soil chemical properties, plant growth and yield of tomato. Sci. Hortic. 2012, 143, 109–114. [Google Scholar] [CrossRef]
  66. Carson, L.C.; Ozores-Hampton, M.; Morgan, K.T.; Sargent, S.A. Effects of controlled-release fertilizer nitrogen rate, placement, source, and release duration on tomato grown with seepage irrigation in Florida. HortScience 2014, 49, 798–806. [Google Scholar] [CrossRef]
  67. Shaviv, A. Advances in controlled-release fertilizers. Adv. Agron. 2001, 71, 1–49. [Google Scholar]
  68. Torralbo, F.; Boardman, D.; Houx III, J.H.; Fritschi, F.B. Distinct enhanced efficiency urea fertilizers differentially influence ammonia volatilization losses and maize yield. Plant Soil 2022, 475, 551–563. [Google Scholar] [CrossRef]
  69. Ma, Q.; Qian, Y.; Yu, Q.; Cao, Y.; Tao, R.; Zhu, M.; Ding, J.; Li, C.; Guo, W.; Zhu, X. Controlled-release nitrogen fertilizer application mitigated N losses and modified microbial community while improving wheat yield and N use efficiency. Agric. Ecosyst. Environ. 2023, 349, 108445. [Google Scholar] [CrossRef]
  70. Tkacz, A.; Bestion, E.; Bo, Z.; Hortala, M.; Poole, P.S. Influence of plant fraction, soil, and plant species on microbiota: A multikingdom comparison. MBio 2020, 11, 10–128. [Google Scholar] [CrossRef] [PubMed]
  71. DiLegge, M.J.; Manter, D.K.; Vivanco, J.M. Soil microbiome disruption reveals specific and general plant-bacterial relationships in three agroecosystem soils. PLoS ONE 2022, 17, e0277529. [Google Scholar] [CrossRef] [PubMed]
Figure 1. Total tomato dry biomass. Presented as mean ± SE. Different colored bars represent soil sterilization: autoclave-sterilized (light blue) and non-autoclave-sterilized (dark blue). An analysis of variance (ANOVA) was performed with a Tukey HSD test for means testing. Different letters represent significant differences (p < 0.05) in the interaction of fertilizer rate and type.
Applmicrobiol 03 00087 g001
Figure 2. Log10-transformed nitrate-N Concentration in Soils with a Plant. Presented as mean ± SE. Different colored bars represent soil sterilization: autoclave-sterilized (light blue) and non-autoclave-sterilized (dark blue). An analysis of variance (ANOVA) was performed with a Tukey HSD test for means testing. Different letters denote significant difference at α = 0.05.
Applmicrobiol 03 00087 g002
Figure 3. Distance-based redundancy analysis (db-RDA) showing clustering based on Bray–Curtis dissimilarity of the bacterial community structure in the bulk soil of tomato. The point colors indicate the different fertilization treatments: high rate of ESN (light blue), low rate of ESN (dark blue), high rate of urea (light green), low rate of urea (dark green), unfertilized control (pink). The shape represents the treatment with either a plant present (square) or no plant present (circle). The ellipse color indicates whether the soil was autoclave-sterilized (red) or was not sterilized with an autoclave (blue). The bacterial community structure shifted primarily because of autoclave sterilization (R2 = 0.461, p < 0.05), n = 149.
Applmicrobiol 03 00087 g003
Table 1. Fertilizer treatments used in the study. Fertilizer type refers to the release rate (quick or controlled release). Fertilizer rate and quantity state how much nitrogen was applied per pot.
Fertilizer TypeFertilizer RateFertilizer Quantity (g N/Pot)
Unfertilized ControlUnfertilized ControlUnfertilized Control
Quick Release UreaHigh0.92
Quick Release UreaLow0.23
Controlled Release Environmentally Smart Nitrogen (ESN)High0.90
Controlled Release Environmentally Smart Nitrogen (ESN)Low0.24
Table 3. Differentially abundant bacterial species enriched in different fertilization treatments. A likelihood ratio test was used to determine differences. “Taxa” denotes the bacteria species that had a significantly greater abundance in the treatment represented in the “Enriched Group” column compared to the “Contrast” column. “Fold Change” shows the log-2-fold change in abundance between the “Enriched Group” and “Contrast”. The p-value was adjusted using a false discovery rate (FDR) at 0.05. KEGG orthologues were used to determine the predicted N-cycling function.
TaxaPredicted FunctionN-Cycling GeneEnriched GroupContrastFold ChangeAdjusted p-Value
Nitrobacter winogradskyiDenitrificationnarG; narH; nirKHigh ESNUnfertilized4.9977.51 × 10−7
High UreaUnfertilized4.5311.98 × 10−5
Nitrosomonas communisNitrificationpmoA; haoHigh ESNUnfertilized4.5877.22 × 10−8
High UreaUnfertilized4.1583.74 × 10−6
Nitrosospira lacusNitrification; DenitrificationpmoA;
nirK
High ESNUnfertilized3.5862.22 × 10−2
High ESNLow Urea4.0732.05 × 10−2
Nitrosospira multiformisNitrification; DenitrificationpmoA; hao;
norB;
norC;
nirK
High ESNUnfertilized2.3426.50 × 10−12
High ESNLow ESN1.8062.11 × 10−6
High ESNLow Urea1.7931.22 × 10−5
High UreaUnfertilized1.4024.32 × 10−4
Nitrospira defluviiDenitrificationnarG; narH; nirKHigh ESNUnfertilized7.5393.37 × 10−4
High ESNLow Urea7.5672.96 × 10−3
Sporosarcina koreensisDenitrificationnarG; narHHigh UreaHigh ESN30.5081.97 × 10−8
High UreaUnfertilized23.0582.70 × 10−5
High UreaLow ESN30.5781.18 × 10−8
High UreaLow Urea29.5023.66 × 10−7
Sporosarcina luteolaDenitrificationnarG; narHHigh UreaHigh ESN28.6006.11 × 10−11
High UreaUnfertilized24.8504.71 × 10−9
High UreaLow ESN28.7592.22 × 10−11
High UreaLow Urea28.9782.00 × 10−10
Sporosarcina soliDenitrificationnarG; narHHigh UreaHigh ESN27.2181.28 × 10−6
High UreaUnfertilized24.3138.93 × 10−6
High UreaLow ESN27.2559.17 × 10−7
High UreaLow Urea27.0396.04 × 10−6
Archangium gephyraNANAUnfertilizedHigh Urea1.4441.30 × 10−2
Bacillus lentusNANAHigh ESNUnfertilized18.6491.20 × 10−6
High ESNLow Urea37.4838.68 × 10−24
High UreaUnfertilized22.4403.02 × 10−9
High UreaLow Urea41.2757.21 × 10−28
Low ESNUnfertilized16.7841.23 × 10−4
Low ESNLow Urea35.6193.37 × 10−21
Bacillus sp. OxB-1NANAHigh ESNUnfertilized19.4156.50 × 10−12
High UreaUnfertilized24.8923.58 × 10−19
Low ESNUnfertilized17.1021.59 × 10−8
Low UreaUnfertilized17.3781.04 × 10−7
Brevendimonas naejangsanensisNANAHigh ESNUnfertilized18.3305.31 × 10−7
High ESNLow ESN24.9602.13 × 10−12
High ESNLow Urea24.0072.89 × 10−10
High UreaUnfertilized22.2964.82 × 10−10
High UreaLow ESN28.9262.22 × 10−16
High UreaLow Urea27.9728.63 × 10−14
Chthoniobacter flavusNANAUnfertilizedHigh ESN0.6391.73 × 10−2
Nitrosospira briensisNANAHigh ESNUnfertilized3.2562.58 × 10−10
High ESNLow ESN2.5211.85 × 10−5
High ESNLow Urea2.3255.64 × 10−4
High UreaUnfertilized2.4989.11 × 10−6
High UreaLow ESN1.7634.55 × 10−2
Oligotropha carboxidovoransNANAHigh ESNUnfertilized6.3103.77 × 10−3
Pusillimonas sp. ye3NANAHigh UreaUnfertilized7.0302.51 × 10−2
Table 4. Total abundance (gene copies g−1 soil) of selected N-cycling genes. An ANOVA was used to determine LS means. A Tukey HSD was used for means comparison. Different letters within a single column denote significant differences at α = 0.05. For columns with a significant interaction effect (nifH, pmoA-amoA, nirK), different letters represent differences in the interaction of the fertilization treatment and the autoclave sterilization treatment. For columns without a significant interaction effect (16S rRNA, nosZ), different letters represent differences in the main effect of autoclave sterilization. Values are averaged over the treatment levels with the presence of a plant.
SoilTreatmentTotalN FixationNitrificationDenitrification
16S rRNAnifHpmoA-amoAhaonirknosZ
Non-autoclavedUnfertilized2.22 × 109 a1.23 × 108 a3.26 × 107 bcd3.12 × 107 bcd2.35 × 108 ab1.92 × 108 a
Low Urea2.33 × 109 a1.41 × 108 a5.04 × 107 bc4.89 × 107 bc2.71 × 108 ab2.12 × 108 a
High Urea2.48 × 109 a1.50 × 108 a5.83 × 107 b5.62 × 107 ab3.09 × 108 a2.16 × 108 a
Low ESN2.11 × 109 a1.10 × 108 ab3.86 × 107 bcd3.68 × 107 bcd2.23 × 108 ab1.76 × 108 a
High ESN2.40 × 109 a1.36 × 108 a1.05 × 108 a9.31 × 107 a3.36 × 108 a2.02 × 108 a
AutoclavedUnfertilized1.13 × 109 b4.09 × 107 ac4.71 × 106 d4.64 × 106 d1.74 × 108 b1.31 × 108 b
Low Urea8.70 × 108 b3.24 × 107 c4.65 × 106 cd4.69 × 106 d1.41 × 108 b1.00 × 108 b
High Urea1.01 × 109 b4.41 × 107 c1.70 × 107 bcd1.67 × 107 bc2.21 × 108 ab1.44 × 108 b
Low ESN1.31 × 109 b6.74 × 107 bc1.46 × 107 bcd1.40 × 107 bc2.26 × 108 ab1.79 × 108 b
High ESN1.17 × 109 b4.51 × 107 bc1.58 × 107 bcd1.47 × 107 bcd2.08 × 108 ab1.25 × 108 b
Disclaimer/Publisher’s Note: The statements, opinions and data contained in all publications are solely those of the individual author(s) and contributor(s) and not of MDPI and/or the editor(s). MDPI and/or the editor(s) disclaim responsibility for any injury to people or property resulting from any ideas, methods, instructions or products referred to in the content.

