
Article

Functional Differentiation of Indigenous Nostocalean Cyanobacteria: Effects of Biomass and Extracellular Polymeric Substances on Rice Growth and Soil Properties


by
Neti Ngearnpat
1,
Supattra Tiche
2,
Narong Wongkantrakorn
3,
Kritsana Duangjan
4,
Kittiya Phinyo
4 and
Kritchaya Issakul
2,*
1
Department of Microbiology and Parasitology, School of Medical Sciences, University of Phayao, 19 M. 2, T. Mae Ka, A. Muang, Phayao 56000, Thailand
2
School of Energy and Environment, University of Phayao, 19 M. 2, T. Mae Ka, A. Muang, Phayao 56000, Thailand
3
Department of Botany, Faculty of Science, Kasetsart University, 50 Ngam Wong Wan Road, Lat Yao, Chatuchak, Bangkok 10900, Thailand
4
Office of Research Administration, Chiang Mai University, 239 Huay Keaw Road, Suthep, Muang, Chiang Mai 50200, Thailand
*
Author to whom correspondence should be addressed.
Crops 2026, 6(2), 40; https://doi.org/10.3390/crops6020040
Submission received: 9 February 2026 / Revised: 20 March 2026 / Accepted: 27 March 2026 / Published: 1 April 2026
(This article belongs to the Special Issue Soil Fertility Management in Crop Production)

Abstract

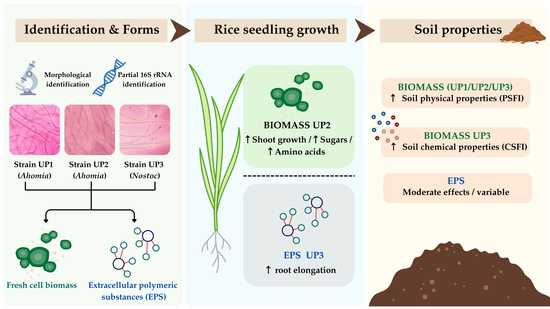
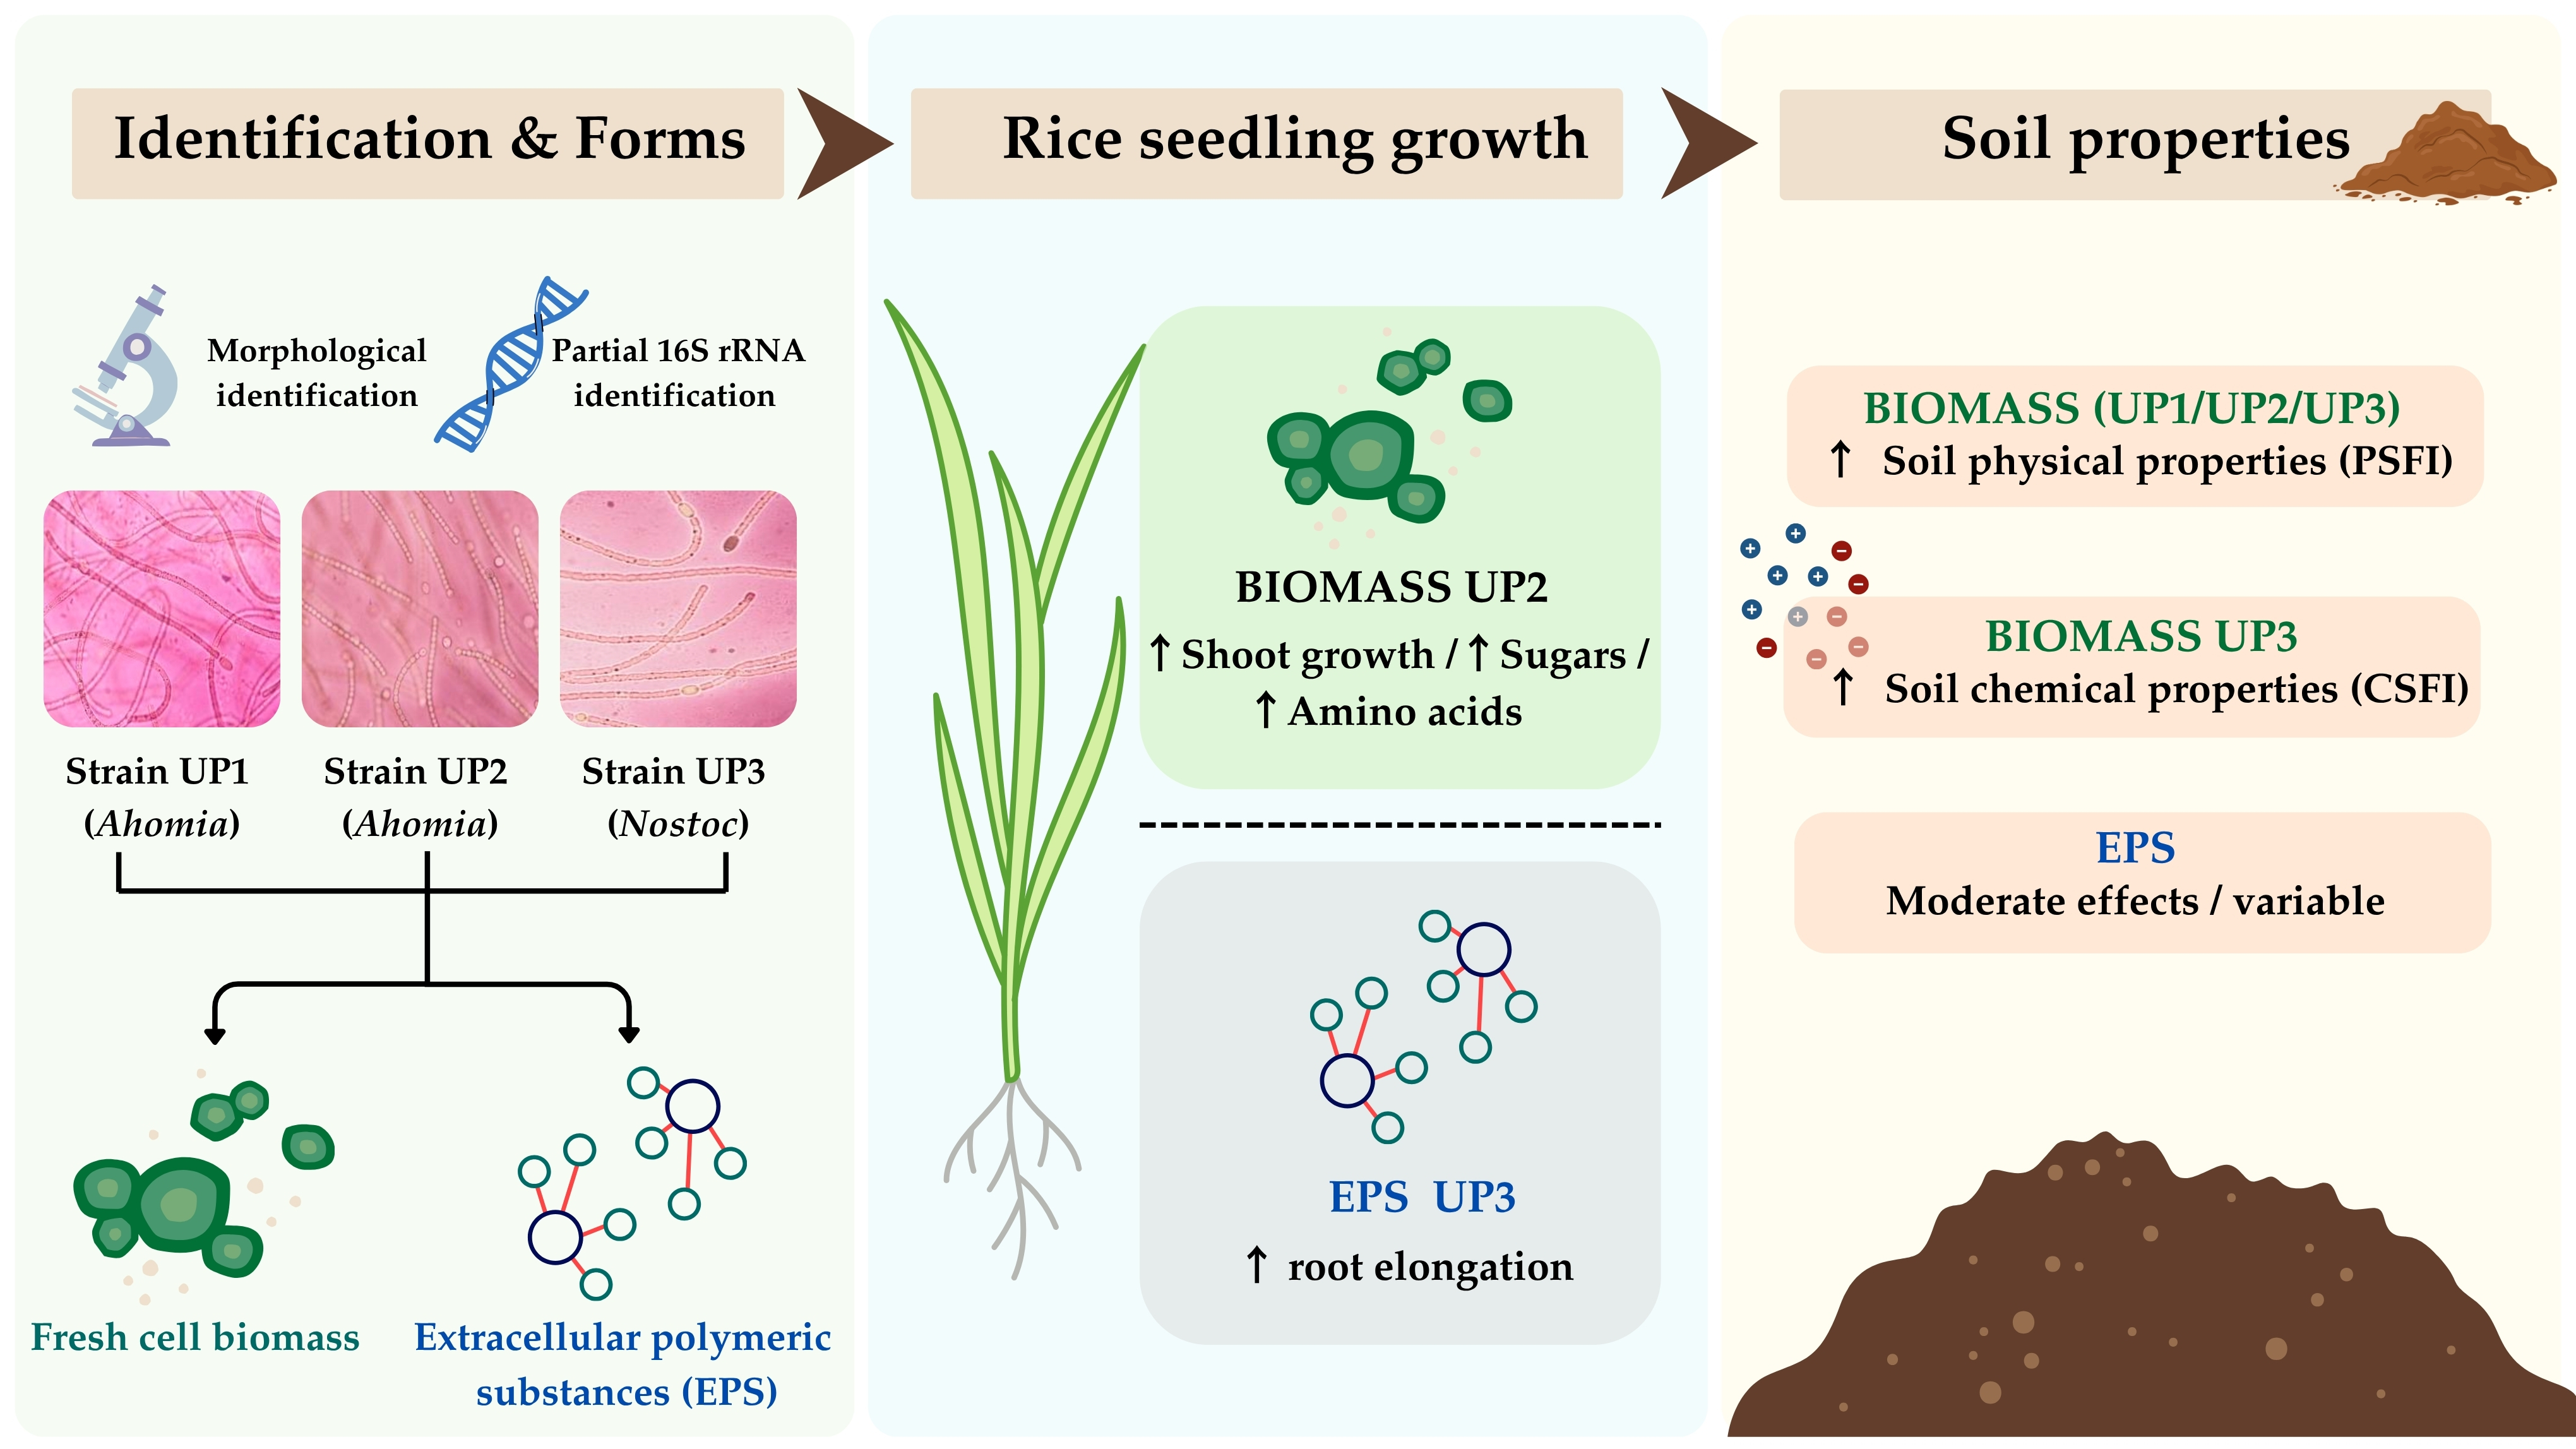
The excessive use of chemical fertilizers in rice cultivation has contributed to soil degradation, creating a need for sustainable biological alternatives. This study examined the functional diversity of three indigenous nostocalean cyanobacterial strains (UP1, UP2, and UP3) isolated from forest and paddy field ecosystems by comparing the effects of their cellular biomass and extracellular polymeric substances (EPS) on rice seedling growth and soil properties. Morphological observations and partial 16S rRNA sequence analysis indicated that strains UP1 and UP2 were affiliated with the genus Ahomia, whereas UP3 was placed within the genus Nostoc. Together, these results placed all three isolates within the heterocystous cyanobacterial order Nostocales. The strains were further characterized based on EPS production and its degree of polymerization. Seed germination and seedling vigor assays were conducted to select the most effective biomass and EPS treatments, which were subsequently evaluated in 21-day pot experiments. Fresh biomass from strain UP2 most effectively enhanced rice growth, whereas EPS from strain UP3 promoted root development. EPS application from strain UP3 significantly increased root elongation to 13.44 cm, while high biomass levels of UP2 increased total sugar and free amino acid contents, indicating distinct plant response patterns. Soil analyses revealed differential responses between biomass- and EPS-based applications, with biomass generally producing stronger effects. Biomass from all strains was associated with higher physical soil function index (PSFI) values (up to 1.35). In contrast, improvements in chemical soil function index (CSFI) were observed across treatments, with variable responses and relatively higher values recorded in biomass from strain UP3 (up to 1.24). These findings suggest strain- and form-dependent response patterns of nostocalean cyanobacteria with potential for enhancing rice growth and improving soil functionality under the controlled conditions.

Graphical Abstract

1. Introduction

Rice (Oryza sativa L.) is a crucial staple food crop worldwide, particularly in Asia, where intensive production systems have increasingly relied on large inputs of chemical fertilizers. In 2022, the utilization of synthetic fertilizers reached 185 million tonnes, with nitrogen fertilizers comprising 58% of the total. Excessive and prolonged use of chemical fertilizers has contributed to soil degradation, leading to compromised soil structure, reduced organic matter, and decreased soil fertility [1]. Specifically, long-term tillage and chemical dependency induce soil compaction, increasing bulk density and mechanical impedance. These physical constraints restrict root penetration, reduce soil aeration, and limit water availability, thereby greatly affecting the root system architecture required for optimal nutrient uptake [2]. Consequently, there is an urgent necessity for sustainable solutions to rehabilitate soil health and improve rice yield through biological means.
The utilization of cyanobacteria presents a scientifically supported, innovative solution to the challenges of rice growth in degraded soil [3,4]. Among them, heterocystous filamentous taxa within the order Nostocales serve as important biological agents in agricultural ecosystems. These organisms improve soil fertility not only by biological nitrogen fixation but also by providing cellular biomass and EPS, which represent distinct functional inputs to the soil [5]. Cyanobacterial biomass functions as a major biological carbon and nitrogen reservoir. Upon decomposition, this residual biomass contributes to nutrient cycling and stimulates microbial activity, thus influencing soil structure and fertility [6,7]. In parallel, cyanobacterial EPS form hydrated polymeric matrices in the soil environment that interact with mineral particles, water, and dissolved nutrients, influencing soil physical and chemical processes in the rhizosphere [8]. In addition to their effects on soil properties, cyanobacterial products have been reported to influence early plant development. Cyanobacteria-derived metabolites and EPS-associated compounds can affect seed germination, root elongation, and root branching, thereby modifying plant–soil interactions during seedling establishment [9,10,11]. However, these effects are highly strain-dependent and vary with the biochemical composition and structural characteristics of the cyanobacterial products applied [12]. Indigenous strains, which are adapted to local edaphic and climatic conditions, often display greater persistence and colonization efficiency than exotic strains, making them attractive candidates for locally optimized biological amendments [13]. In addition, recent studies increasingly emphasize trait-based approaches to microbial amendments, where functional characteristics such as nutrient mobilization, stress tolerance, or extracellular polymer production are considered key determinants of microbial performance in soil–plant systems [14,15,16]. In this context, the functional performance of cyanobacterial strains is closely related to the biochemical and structural properties of their EPS, including the degree of polymerization and monosaccharide composition, which influence their interactions with soil particles, water, and nutrients [17].
Despite this, most previous studies have emphasized the application of living cyanobacterial cells for nitrogen fixation, while comparatively little attention has been given to how different cyanobacterial forms—cellular biomass versus extracted EPS—from ecologically distinct strains contribute to soil physical and chemical functions or to rice seedling development. In particular, the comparative roles of biomass and EPS derived from indigenous forest and paddy-field nostocalean cyanobacteria in shaping soil properties and plant physiological responses remain insufficiently understood. Based on these considerations, we hypothesized that indigenous nostocalean cyanobacterial strains exhibit functional differences influencing rice seedling growth and soil physicochemical properties, and that their cellular biomass and EPS exert distinct effects within the rice–soil system. Therefore, the present study examined the functional diversity of three indigenous nostocalean cyanobacterial strains (UP1, UP2 and UP3) isolated from Thai forest and agricultural soils. We evaluated the effectiveness of their cellular biomass and extracted EPS for improving soil physicochemical qualities and promoting rice seedling growth. By linking strain origin, EPS characteristics, and application form to soil and plant responses, this work provides preliminary insights into the potential selection of cyanobacterial biological amendments for targeted agricultural functions.

2. Materials and Methods

2.1. Preparation of Cyanobacterial Biomass and EPS

Three indigenous cyanobacterial strains (UP1, UP2, and UP3) were isolated from forest and agricultural soils in Phayao province, Thailand. All laboratory and greenhouse experiments described in this study were conducted in 2021 at the School of Energy and Environment, University of Phayao. These strains were mass-cultured in 10 L carboys containing BG-11 (N-free) medium, prepared according to the standard BG-11 formulation described by Roncero-Ramos et al. [18], with the nitrogen source (NaNO3) omitted. All other nutrients and trace elements were maintained at the same concentrations as in the original BG-11 medium. The inoculum was prepared by transferring 50 mL of stock culture into 1000 mL of fresh medium. Cultures were maintained at 25 ± 2 °C under continuous illumination (24 h light) provided by cool-white fluorescent lamps at an intensity of approximately 40 µmol photons m−2 s−1 throughout the cultivation period. The light source was positioned at approximately 30 cm above the culture vessels to ensure uniform illumination. Continuous aeration was supplied through sterilized silicone tubing to maintain mixing of the cultures, prevent cell sedimentation, and facilitate gas exchange. Two separate batches were prepared for different purposes:

2.1.1. Preparation of Fresh Cellular Biomass

To obtain fresh cells, laboratory-grown cultures were harvested during the exponential growth phase (day 14) from BG-11 (N-free) medium. Next, 10 L of the culture broth was centrifuged at 12,000× g for 15 min. The supernatant was discarded, and the cell pellets were collected. The harvested biomass was washed twice with sterile distilled water to remove any residual medium before being used in the experiments.

2.1.2. Extraction of EPS

At the stationary phase, after 20 days of cultivation, EPS was extracted from the harvested biomass using the hot-water extraction method [19]. Briefly, the cyanobacterial cells were collected and extracted with distilled water at 100 °C for 1 h. After extraction, the suspension was centrifuged at 12,000× g for 10 min to remove intact cells and cellular debris. The supernatant containing the soluble extracellular polysaccharides was carefully collected to avoid disturbance of the cell pellet prior to EPS precipitation. The remaining pellet was subsequently resuspended in distilled water and subjected to a second extraction at 100 °C for 1 h. The supernatants from both extractions were combined, and 95% ethanol was added to achieve a final concentration of 80% (v/v). The mixture was kept at 4 °C for 24 h to precipitate the polysaccharides. After the precipitate had been recovered, the residual solvent was removed using a rotary evaporator. The resulting material was dried using a freeze-dryer to obtain the crude EPS extract. The obtained EPS powder was weighed and redissolved in sterile distilled water to prepare stock solutions for subsequent analyses and bioassays. The extracted EPS were characterized by determining their total sugar and reducing sugar contents. The total sugar content was quantified using the phenol-sulfuric acid method [20], with glucose as a standard. The reducing sugar content was determined using the dinitrosalicylic acid method [21], with glucose as a standard. Finally, the degree of polymerization (DP) was calculated using the ratio of total sugars to reducing sugars, as shown in the equation below. This parameter provides an approximate estimate of the relative polymerization level of the extracted EPS.
DP = Total   sugar   content Reducing   sugar   content

2.2. Identification of Cyanobacterial Strains

The cyanobacterial isolates were initially characterized based on morphological characteristics, including vegetative cells, heterocysts, and akinetes, following the taxonomic keys of Banerjee et al. and Soares et al. [22,23]. Genomic DNA was extracted following standard protocols. A partial 16S rRNA gene region was amplified by PCR using the universal bacterial primer pair 27F–23S30R (27F: 5′-AGAGTTTGATCCTGGCTCAG-3′; 23S30R: 5′-CTTCGCCTCTGTGTGCCTAGGT-3′). This primer pair amplifies a partial 16S rRNA gene region, generating an amplicon of approximately 700–900 bp, which was used for sequence-based identification. PCR amplification was performed in a SensoQuest LabCycler thermocycler (SensoQuest GmbH, Göttingen, Germany) using Taq DNA Polymerase 2× RED Master Mix (Ampliqon, Odense, Denmark) under the following conditions: initial denaturation at 94 °C for 5 min, followed by 35 cycles of denaturation at 94 °C for 1 min, annealing at 60 °C for 1 min, and extension at 72 °C for 1 min. PCR products were visualized by agarose gel electrophoresis to confirm the expected amplicon size. The amplified products were purified using the QIAquick PCR Purification Kit (Qiagen, Hilden, Germany) and sequenced by Sanger sequencing. The resulting sequences were compared with reference sequences in the GenBank database using the BLASTn algorithm 2.17.0 via the NCBI web interface (Bethesda, MD, USA; accessed on 12 January 2026) for preliminary taxonomic identification.
Phylogenetic relationships among the isolates and related reference strains were further inferred using partial 16S rRNA gene sequences Taxonomic affiliations were interpreted based on sequence similarity and phylogenetic placement in combination with morphological characteristics of the isolates. The obtained sequences were deposited in GenBank under accession numbers PX972695–PX972697.

2.3. Rice Seed Germination and Seedling Vigor Assay

Rice seeds (Oryza sativa L. cv. San-Pah-Tawng 1) were obtained from the Phayao Rice Seed Center, Phayao Province, Thailand. This glutinous rice cultivar is widely cultivated in northern regions and was selected as a representative cultivar due to its photoperiod insensitivity, high yield potential, and resistance to major rice diseases. Surface disinfection was performed by immersing the seeds in 10% sodium hypochlorite (NaOCl) for 10 min, followed by rinsing thoroughly with sterile distilled water [24]. The experiment was designed to compare the effects of the extracted EPS and fresh cellular biomass. EPS yields were experimentally determined from fresh biomass extraction, yielding 0.27, 0.33, and 0.44 g EPS 100 g−1 fresh biomass for strains UP1, UP2, and UP3, respectively. Each EPS powder sample was dissolved in deionized water to obtain final concentrations of 15, 30, 60, 120, and 240 mg L−1. Fresh cells of strains UP1, UP2, and UP3 were prepared at concentrations calculated based on measured EPS yields to approximate comparable EPS input levels. It should be noted that these calculated biomass concentrations were intended to approximate EPS input levels based on extraction yields, and do not represent compositional or functional equivalence between biomass and purified EPS. Fresh cyanobacterial biomass contains multiple cellular and extracellular components, and the EPS content was not directly quantified at the time of application.
Because EPS yields varied among strains, the specific biomass concentrations required to deliver these equivalent EPS loads were calculated according to the equation shown below and are summarized as follows: strain UP1: 5.5, 11.1, 22.2, 44.4, 88.8, 177.7, and 355.5 g L−1; strain UP2: 4.5, 9.1, 18.2, 36.4, 72.2, 144.4, and 288.8 g L−1 and strain UP3: 3.4, 6.8, 13.6, 27.3, 54.5, 109.0, and 208.0 g L−1 (Supplementary Table S1).
Biomass   concentration   g / L = Target   EPS   concentration   mg / L EPS   yield   g   EPS / g   fresh   biomass × 100 1000
The dry matter content of fresh cyanobacterial biomass ranged from approximately 3.1% to 3.7% across strains, corresponding to moisture contents of 96–97%. To provide a more accurate estimate of effective biomass loading, fresh biomass concentrations were additionally expressed as dry-weight equivalents using strain-specific dry matter contents. The resulting dry-weight equivalents of applied concentrations are presented in Supplementary Table S2.
The germination test was conducted using the paper substrate method described by Chinnasamy and Sundareswaran [25]. For each treatment, 2 mL of solution was applied to Petri dishes lined with filter paper. Deionized water and zeolite solutions served as the negative and positive controls, respectively. Zeolite was included as a positive reference treatment as a commonly used abiotic soil amendment, providing a non-biological benchmark for comparison with cyanobacterial biomass and EPS treatments. After 7 days of incubation, germination indices were evaluated, including germination percentage (GP), germination energy (GE), speed of germination (SG), and seedling vigor index (SVI). Seedling growth parameters (shoot and root lengths) were measured. Subsequently, the fresh weight of the seedlings was recorded, and the dry weight was determined after drying in a hot-air oven at 80 °C for 24 h.

2.4. Pot Experiment for Evaluating Rice Seedling Responses to Cyanobacterial Biomass and EPS

Topsoil (0–20 cm depth) was collected from a paddy field in Phayao Province, Thailand. Soil samples were air-dried, crushed, and passed through a 6.0 mm mesh sieve to remove any coarse debris and stones. A pot experiment was conducted using plastic containers filled with 500 g of the prepared soil. The soil was amended with the optimal concentrations of cyanobacterial biomass and EPS derived from the preliminary results (Section 2.3 above). The treatments consisted of fresh biomass: strain UP2 at 72.2, 144.4 and 288.8 g fresh biomass kg−1 soil; EPS: extracted EPS UP3 at concentrations of 30, 60, and 120 mg EPS kg−1 soil; controls: unamended soil (treated with deionized water, DI) and zeolite-amended soil served as the negative and positive controls, respectively.
Rice seeds were surface disinfected as previously described above. The seeds were imbibed in deionized water overnight, wrapped in a moist cloth, and incubated in the dark to induce germination. Then, 10 uniformly germinated seeds were transplanted into each pot. The plants were maintained under greenhouse conditions, and water was added periodically to maintain moist soil conditions (approximately 100 mL per pot) during the experiment. Pots were arranged in the greenhouse following a completely randomized design (CRD), with treatment positions randomly assigned at the start of the experiment. On 21 days after planting, the seedlings were harvested to assess growth performance. Seedling growth parameters (shoot and root lengths) as well as fresh and dry weights were recorded. In addition, physiological and biochemical traits were also evaluated. The total sugar content was analyzed using the method described in Section 2.1.2 above. The total free amino acid content was quantified using the ninhydrin-CO2 method with leucine as the standard [26]. The chlorophyll and carotenoid contents were determined based on the procedure described by Park et al. [27].

2.5. Analysis of Soil Properties

Plastic pots (20 cm diameter × 18 cm height) were each filled with 2 kg of the sieved topsoil prepared as described in Section 2.4. The soil in the pot was amended with the specific concentrations of EPS from UP1, UP2 and UP3 at a concentration of 120 mg EPS kg−1 soil. Fresh cyanobacterial biomass was applied at 177.7, 144.4, and 109 g fresh biomass kg−1 soil for UP1, UP2, and UP3, respectively. The treated soils were maintained under submerged conditions using tap water and incubated in a greenhouse for 15 days. At the end of the incubation period, soil samples were collected for physicochemical analysis. Soil bulk density was determined according to le Roux et al. [28], while soil moisture and porosity were determined using the methods of Liddle et al. [29]. The organic matter (OM) in the soil was measured as described by Ramamoorthi and Meena [30]. Standard soil analytical protocols were used to determine pH, electrical conductivity (EC), cation exchange capacity (CEC), total nitrogen, available iron (Fe), available phosphorus (P) and exchangeable cations (K+, Ca2+, Mg2+, Na+) [31].
To examine the overall relationships among soil variables and treatments, principal component analysis (PCA) was performed using the measured soil physicochemical parameters (Supplementary Tables S10, S12 and S13). The analysis was conducted using MVSP software (Multivariate Statistical Package, version 3.22; Kovach Computing Services, Pentraeth, Wales, UK). PCA was used to explore multivariate patterns among treatments and to identify major gradients in soil responses following biomass and EPS applications.
To facilitate integrated comparison of soil responses among treatments, selected soil physical and chemical properties were further summarized using functional indices. The physical soil function index (PSFI) was calculated from soil moisture, soil porosity, and bulk density, with bulk density treated as an inverse indicator to reflect its negative relationship with soil structural quality. The chemical soil function index (CSFI) was calculated using available Fe and CEC. Rather than including all measured chemical variables, these parameters were selected based on PCA to represent independent, non-redundant indicators of soil chemical fertility and nutrient retention capacity. In addition, the consistency of these variables with statistical significance after false discovery rate (FDR) correction was evaluated to support their relevance (Supplementary Table S11). All parameters were first normalized relative to the deionized water (DI) control according to the following equation:
X n o r m =   X t r e a t m e n t X DI
where X n o r m represents the normalized value of each parameter. For bulk density, inverse normalization was applied to account for its negative relationship with soil structural quality:
B D n o r m =   B D D I B D t r e a t m e n t
The PSFI was then calculated as the arithmetic mean of the normalized soil moisture ( M n o r m ), soil porosity ( P n o r m ), and normalized bulk density ( B D n o r m ):
P S F I =   M n o r m     +   P n o r m     +   B D n o r m     3
Similarly, the CSFI was calculated as the arithmetic mean of normalized available Fe ( F e n o r m ) and cation exchange capacity ( C E C n o r m ):
C S F I =   F e n o r m     +   C E C n o r m     2

2.6. Statistical Analysis

All experiments were conducted using three biological replicates per treatment (n = 3). Data are presented as mean ± standard deviation (SD). Prior to statistical analysis, data were examined for normality and homogeneity of variance. Differences among treatments were analyzed using one-way analysis of variance (ANOVA), and treatment means were compared using Duncan’s multiple range test at a significance level of p ≤ 0.05 using SPSS software (version 22; IBM Corp., Armonk, NY, USA). To provide a more comprehensive evaluation of treatment effects, effect sizes (partial η2) were calculated for each parameter based on ANOVA results. In addition, p-values were adjusted for multiple comparisons using the Benjamini–Hochberg false discovery rate (FDR) method. Confidence intervals (95% CI) were estimated from the model-based marginal means, and the range of confidence intervals across treatments was reported to reflect variability in treatment responses. To improve interpretability across multiple endpoints, seedling vigor index (SVI) and shoot length (SHL), together with root length (RL), were predefined as primary outcome variables reflecting integrated seedling growth performance and structural development, whereas germination-related parameters (GE, GP, and SP) and biomass components (FW and DW) were treated as secondary outcomes. Statistical interpretation prioritized effect sizes (η2) and FDR-adjusted p-values for these primary outcomes.
For multivariate visualization, Morpheus software (https://software.broadinstitute.org/morpheus accessed on 9 December 2025) was used to generate a hierarchical clustering heatmap illustrating the responses of rice seedling growth parameters to cyanobacterial biomass and EPS treatments. The input matrix consisted of treatment groups as rows and measured seedling growth parameters (e.g., seedling vigor index, root and shoot lengths, fresh and dry weights) as columns. Parameter values were normalized as Z-scores, and clustering was performed using Euclidean distance with the average linkage method.

3. Results

3.1. Morphological Characteristics and Molecular Identification of Cyanobacterial Strains

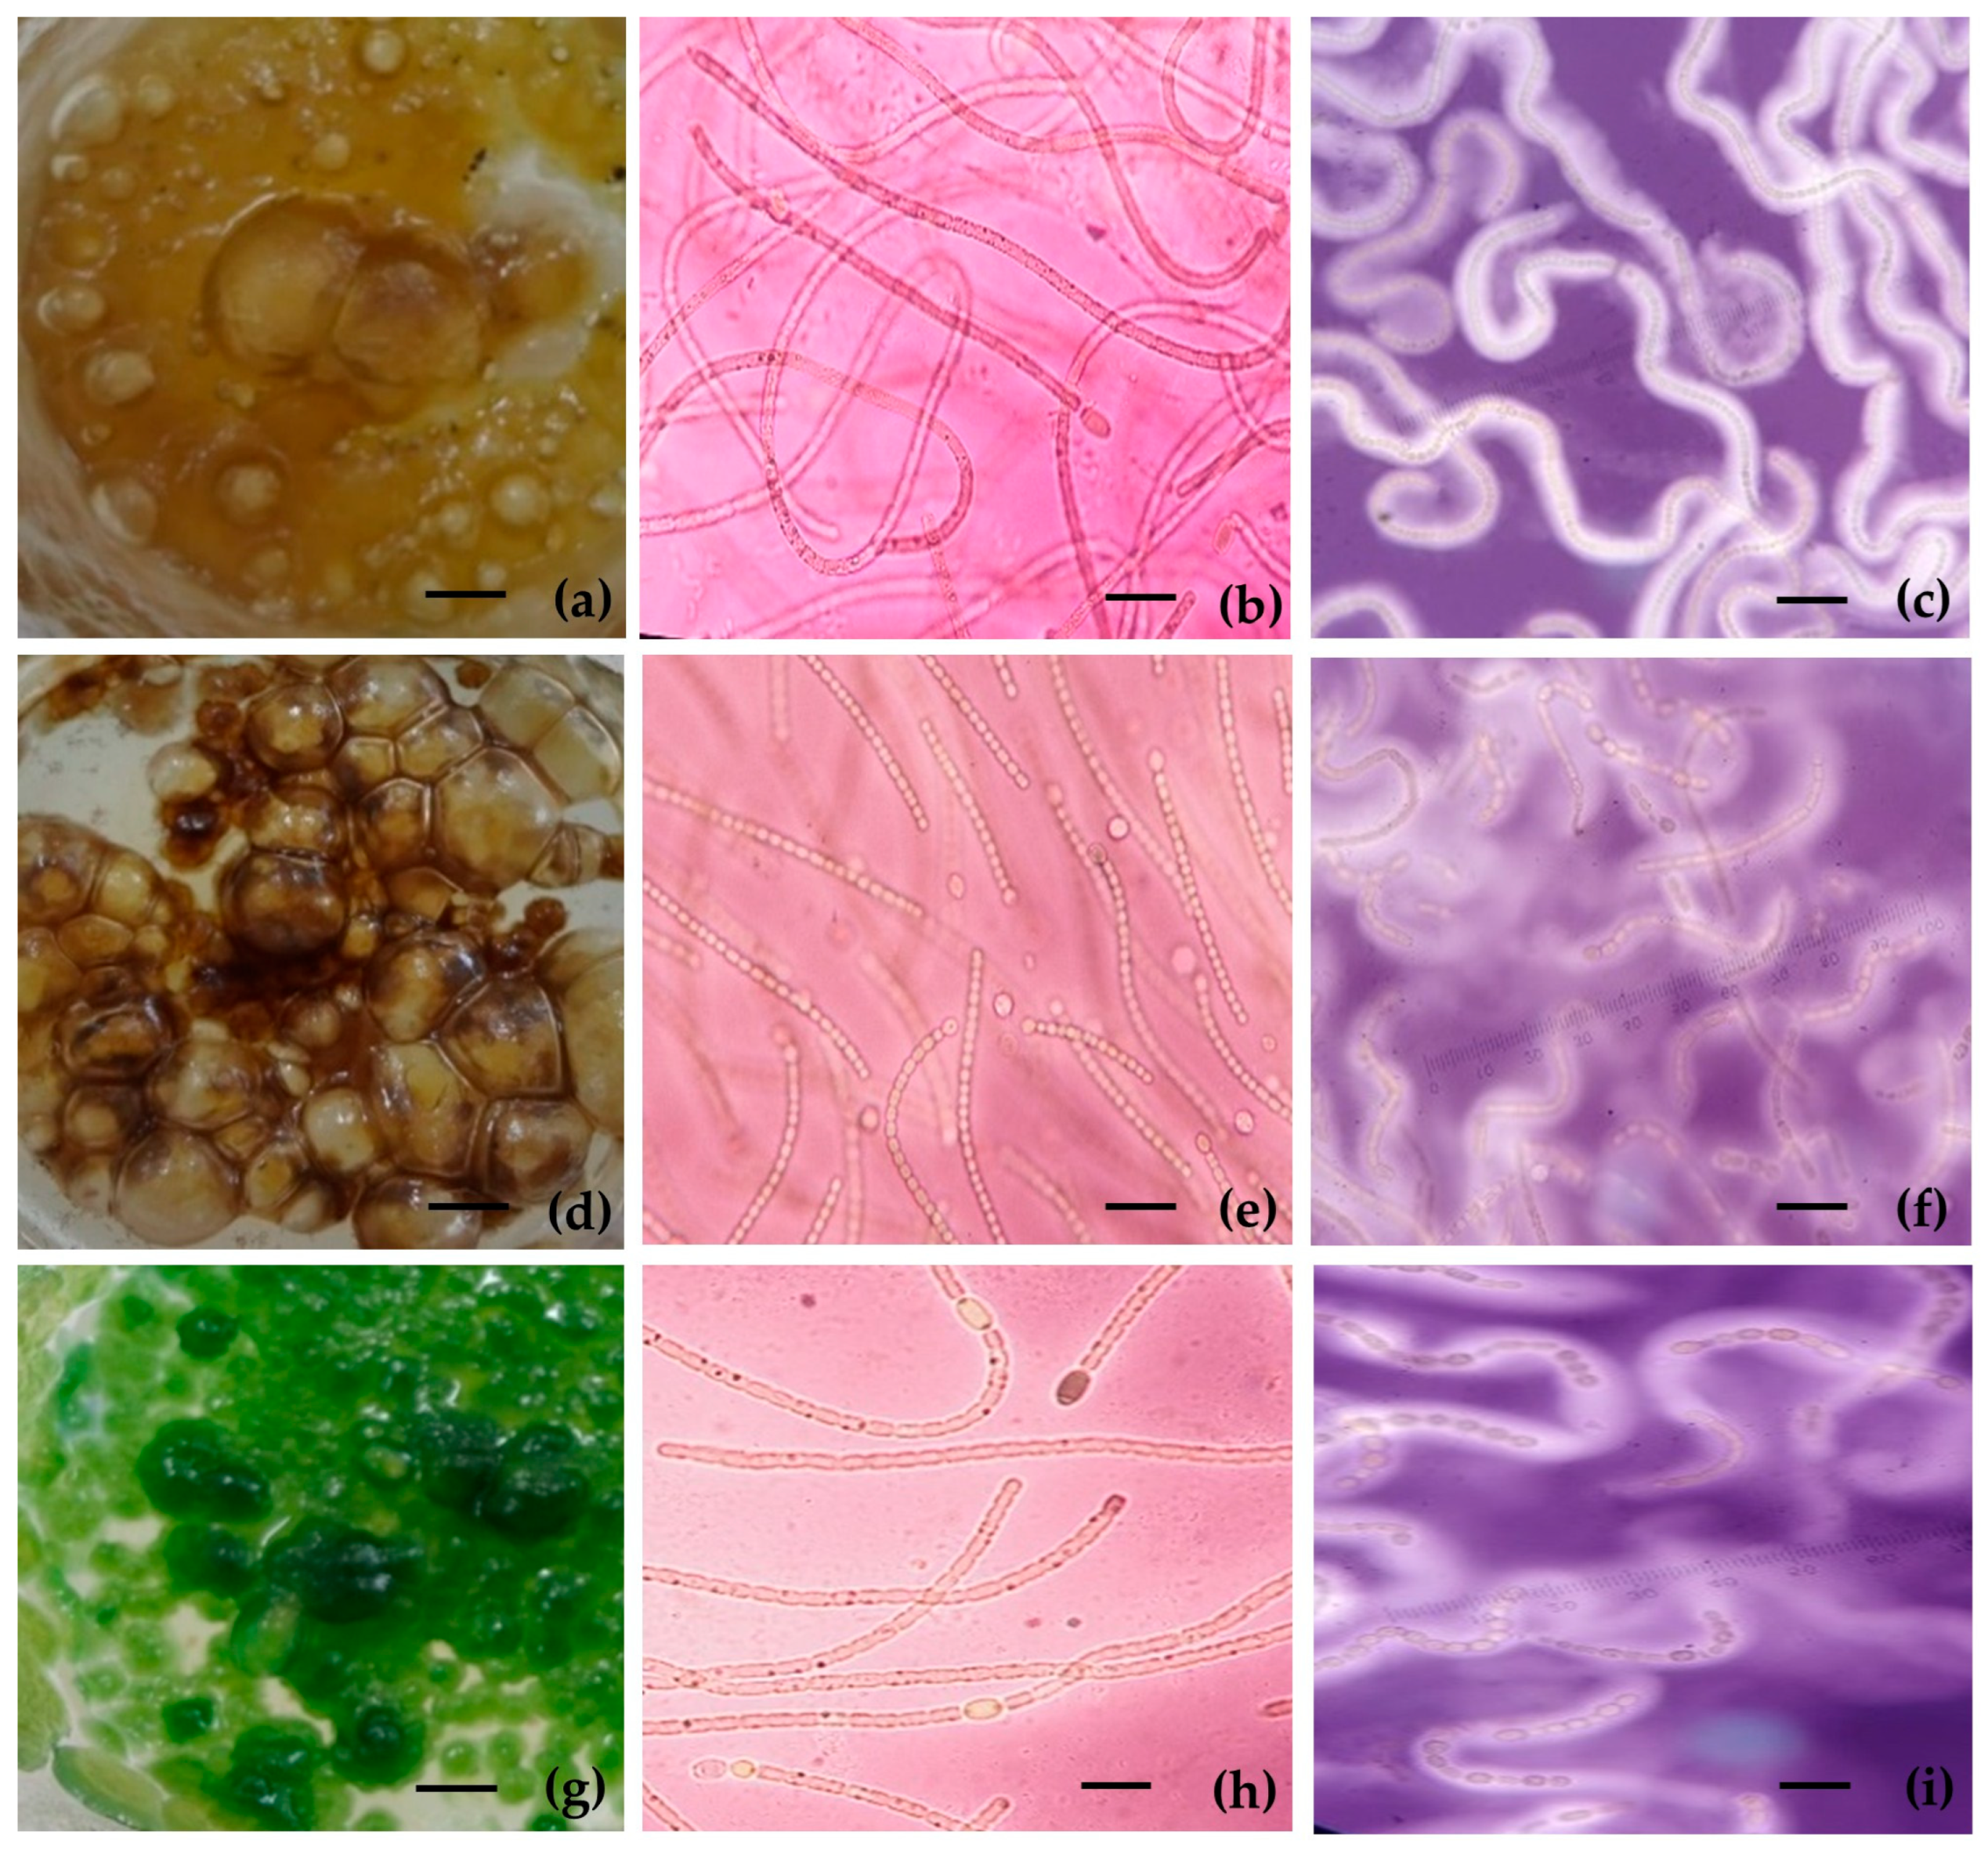
The three indigenous cyanobacterial strains isolated from Phayao Province displayed unique morphological characteristics (Figure 1). Strains UP1 and UP2 (both isolated from forest soil) had similar macroscopic features, forming dark brown, mucilaginous colonies (Figure 1a,d). The brownish pigmentation probably indicated that light-blocking pigments, such as scytonemin, had accumulated in the organism as an adaptation to living on soil. On the other hand, strain UP3 (taken from rice fields) formed distinct fresh-green, gelatinous colonies (Figure 1g), indicating differences in pigmentation and colony texture compared with the forest-derived strains.
Microscopic examination revealed structural differences among the strains. The filaments of strain UP1 were long and convoluted, composed of vegetative cells (3–5 µm width; 7–8 µm length), with oval heterocysts (3 µm) and terminal akinetes (Figure 1b). Strain UP2 had noticeably shorter filaments with slightly larger vegetative cells (4–5 µm width; 7–8 µm length) (Figure 1e). Strain UP3 had tightly packed filaments containing smaller vegetative cells (3 µm width; 5 µm in length) (Figure 1h). Negative staining with nigrosin demonstrated the ability to synthesize extracellular substances. As shown in Figure 1c,f,i, distinct clear zones were observed around the filaments against the dark background, confirming the presence of thick EPS sheaths. These morphological features, particularly the presence of heterocysts and akinetes within filamentous trichomes, confirm that all isolates belong to heterocystous cyanobacteria in the order Nostocales.
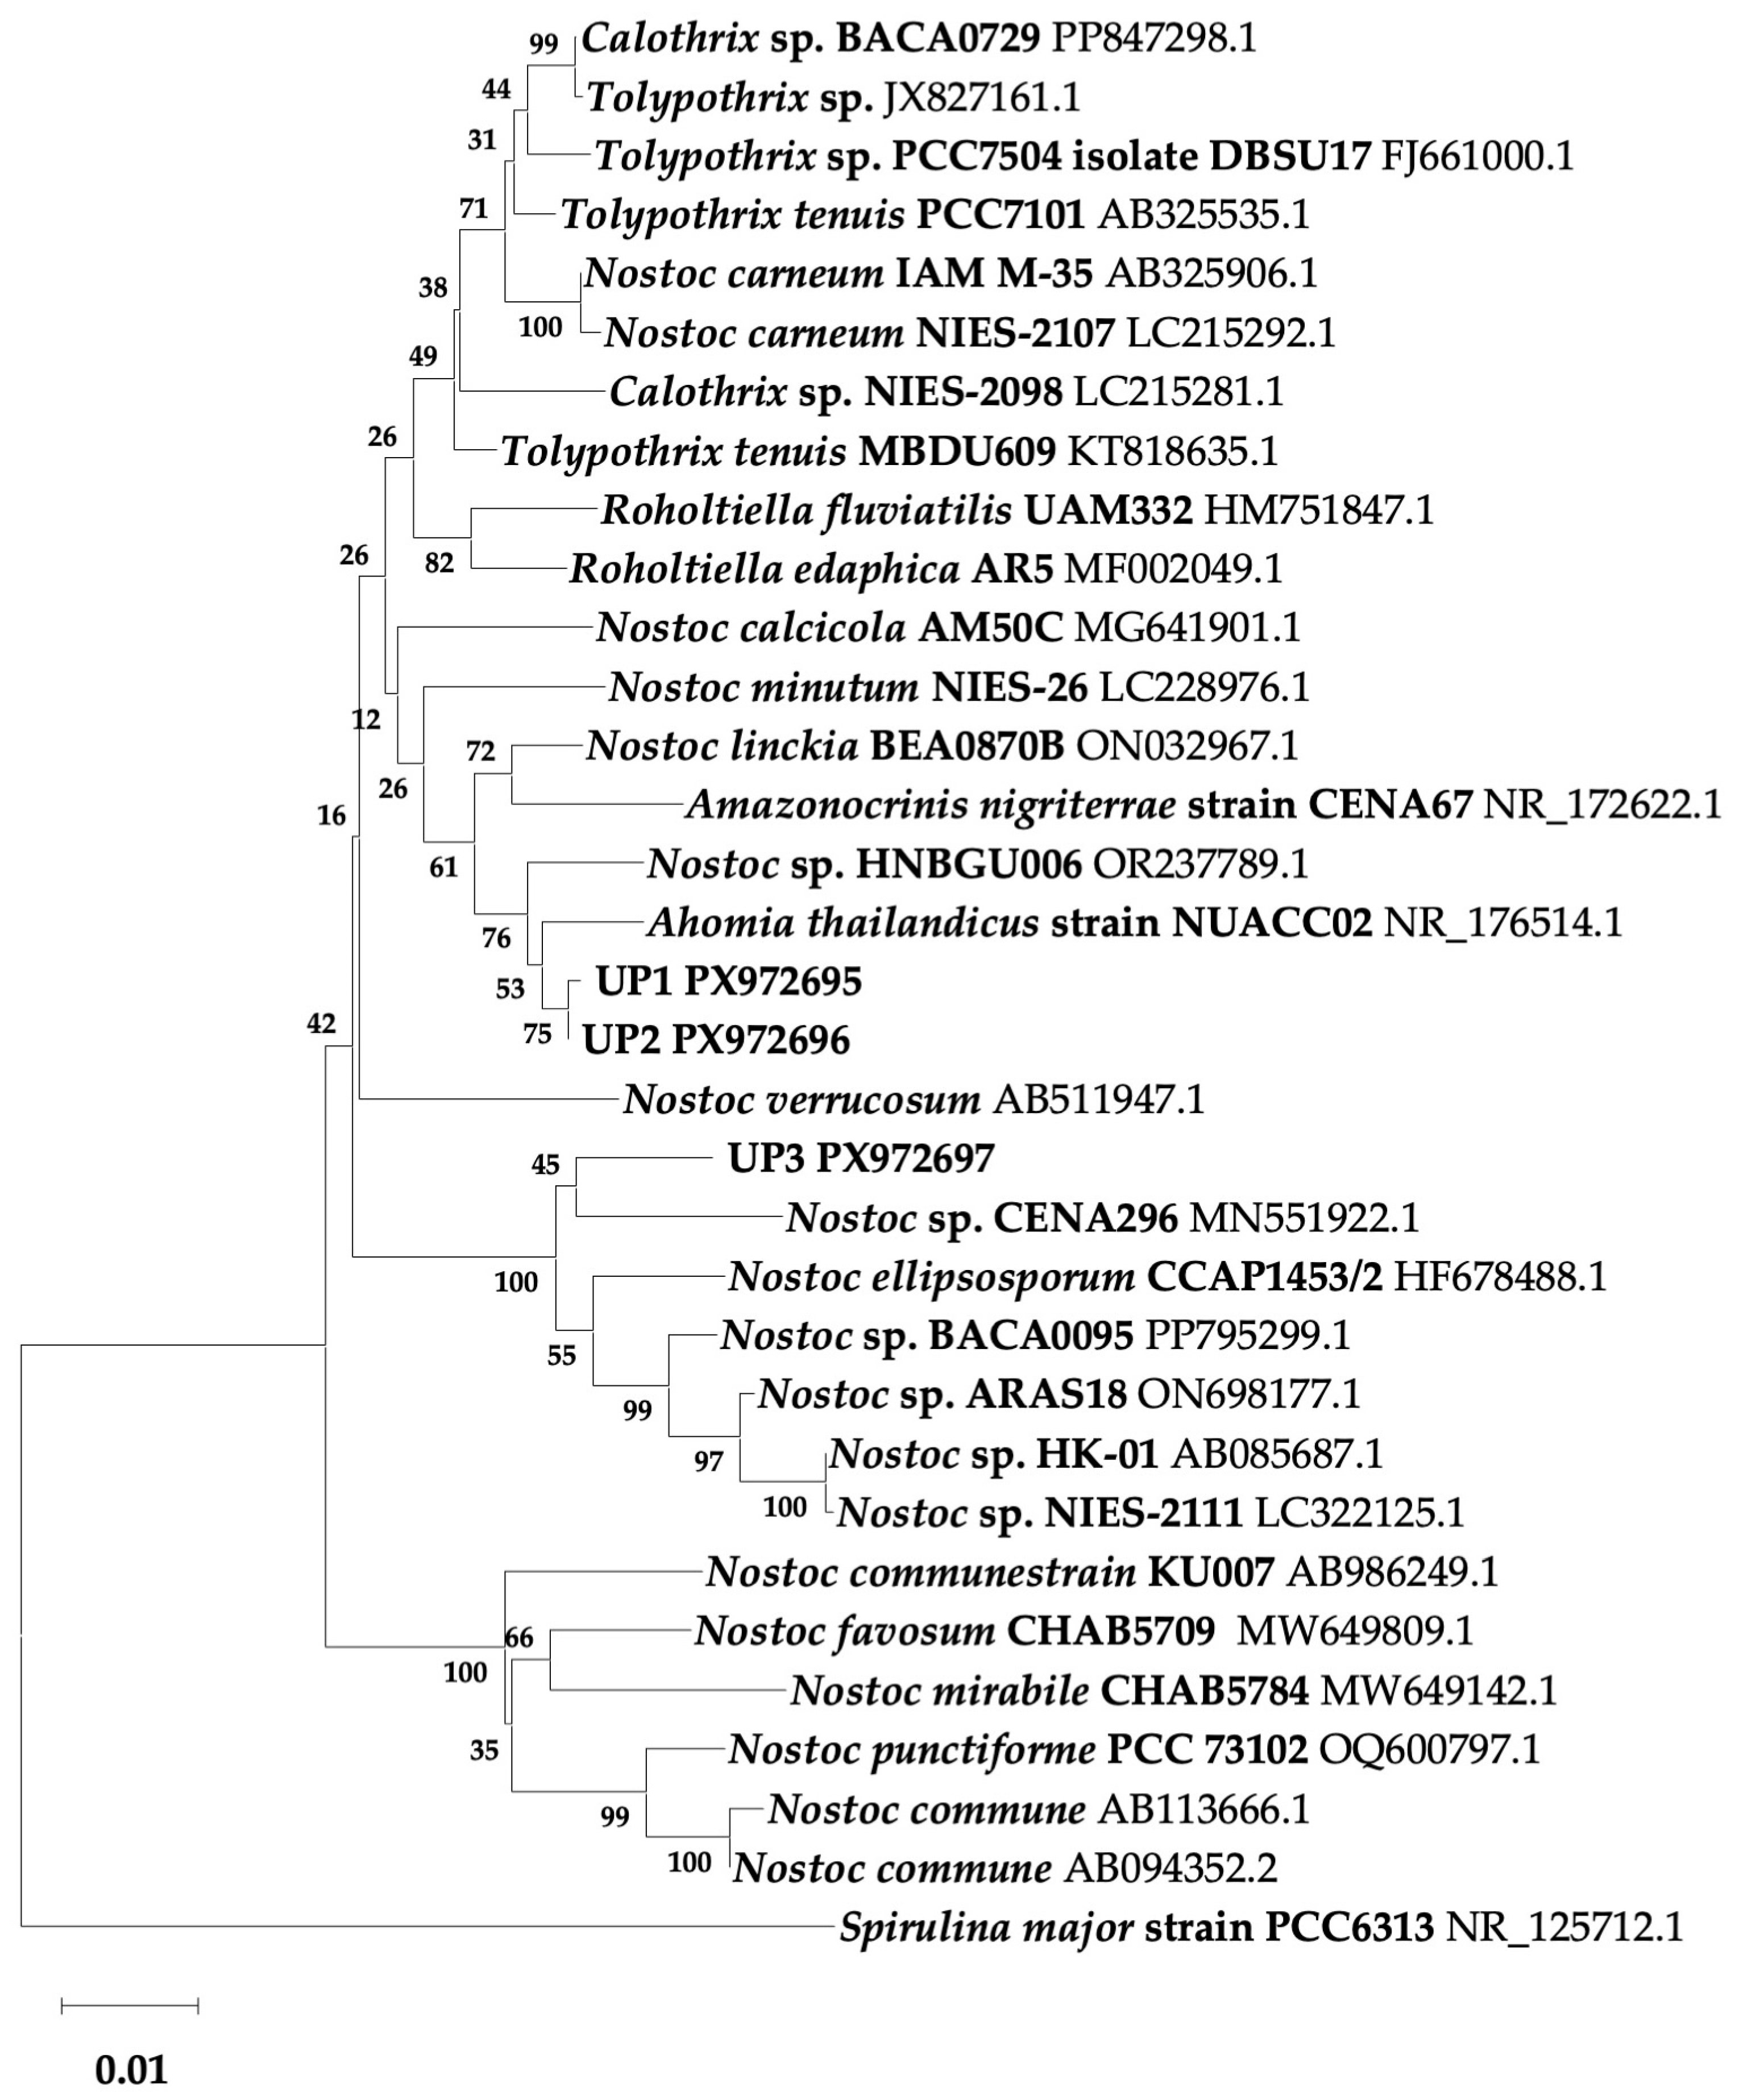
Molecular identification based on partial 16S rRNA gene sequences revealed distinct phylogenetic affiliations among the three isolates. Strains UP1 and UP2 showed the highest sequence similarity (99.04% and 99.09%, respectively) to Ahomia thailandicus in the GenBank database, indicating close phylogenetic affinity with this recently described nostocalean lineage previously classified among Nostoc-like cyanobacteria. In contrast, strain UP3 exhibited 96.97% sequence similarity to Nostoc sp. CENA296, supporting its placement within the genus Nostoc sensu stricto. Phylogenetic analysis further supported these relationships (Figure 2). In the reconstructed tree, strains UP1 and UP2 clustered together within the Ahomia-associated lineage and formed a sister clade closely related to Ahomia thailandicus. In contrast, strain UP3 grouped within the Nostoc lineage and was clearly separated from the Ahomia-associated strains, indicating that the three isolates represent phylogenetically distinct nostocalean lineages. However, because these identifications were based on partial 16S rRNA gene sequences rather than full-length genes or multilocus phylogenetic analyses, species-level assignments were considered tentative. Therefore, strains UP1 and UP2 were interpreted as having phylogenetic affinity with the genus Ahomia, whereas strain UP3 showed affinity with Nostoc lineages.
Because the partial 16S rRNA sequence similarities ranged from approximately 96% to 99%, the isolates could not be confidently assigned to a specific species. To avoid overinterpretation of taxonomic identity, the strains are referred to throughout the manuscript using strain identifiers (UP1–UP3) rather than formal species names. Together, these results indicate that the three isolates represent closely related but phylogenetically distinct nostocalean lineages, providing a phylogenetic basis for comparing their functional traits in subsequent analyses.

3.2. Biomass Accumulation, EPS Production, and Carbohydrate Composition

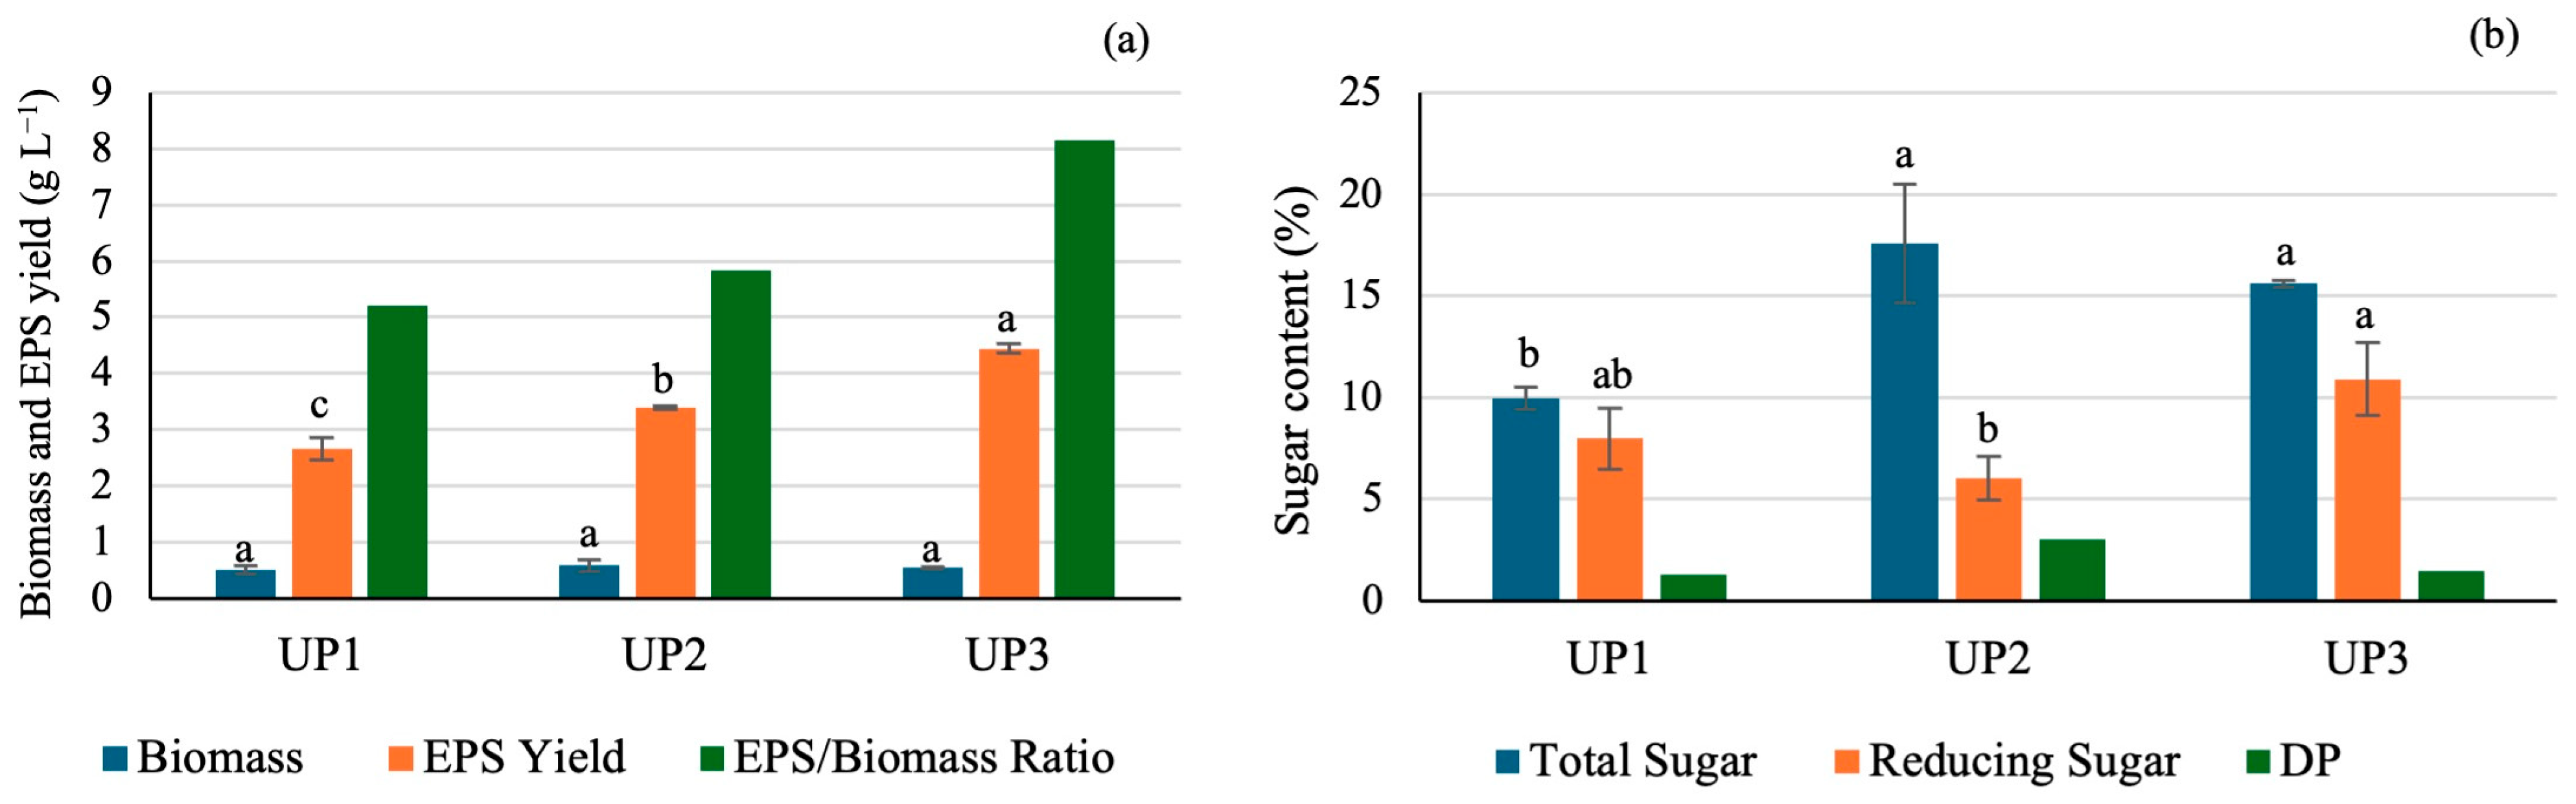
The biomass and EPS production of the three indigenous nostocalean cyanobacterial strains (UP1, UP2 and UP3) are presented in Figure 3a. The analysis did not indicate significant differences (p > 0.05) in the dry biomass weight between the three strains, with values in the range of 0.50 and 0.58 g L−1, suggesting that under the conditions tested, all strains had a similar ability to stimulate cell growth. This consistent growth performance provides a critical baseline, ensuring that the differences in EPS production are due to strain-specific metabolic traits rather than differences in culture adaptation or growth kinetics. In contrast to biomass, EPS production differed significantly between strains. The highest EPS yield was from strain UP3 (4.44 g L−1), followed by strain UP2 (3.39 g L−1) and strain UP1 (2.66 g L−1). The EPS-to-biomass ratio followed the same pattern, with strain UP3 containing a ratio that was clearly higher than that of strain UP2 and strain UP1. Based on these results, although cell growth was comparable between strains, strain UP3 had greater metabolic efficiency in the allocation of carbon resources in EPS biosynthesis rather than in structural cellular components.
Figure 3b illustrates the chemical properties of the extracted EPS, based on its total sugar, reducing sugar content, and DP. The total sugar content was significantly (p ≤ 0.05) higher in strain UP2 (17.61%) and strain UP3 (15.61%) than in strain UP1 (9.99%). On the other hand, the profile of reducing sugars was different, with strain UP3 having the highest percentage of reducing sugars (10.90%), while strain UP2, even though it had a large percentage of total sugars, had much lower levels of reducing sugars (6.04%). The analysis of the DP revealed a unique structural characteristic of strain UP2. EPS from strain UP2 had the highest DP value (3.03), which was nearly double that of strain UP1 and strain UP3.

3.3. Hierarchical Clustering Analysis of Rice Seedling Growth Parameters

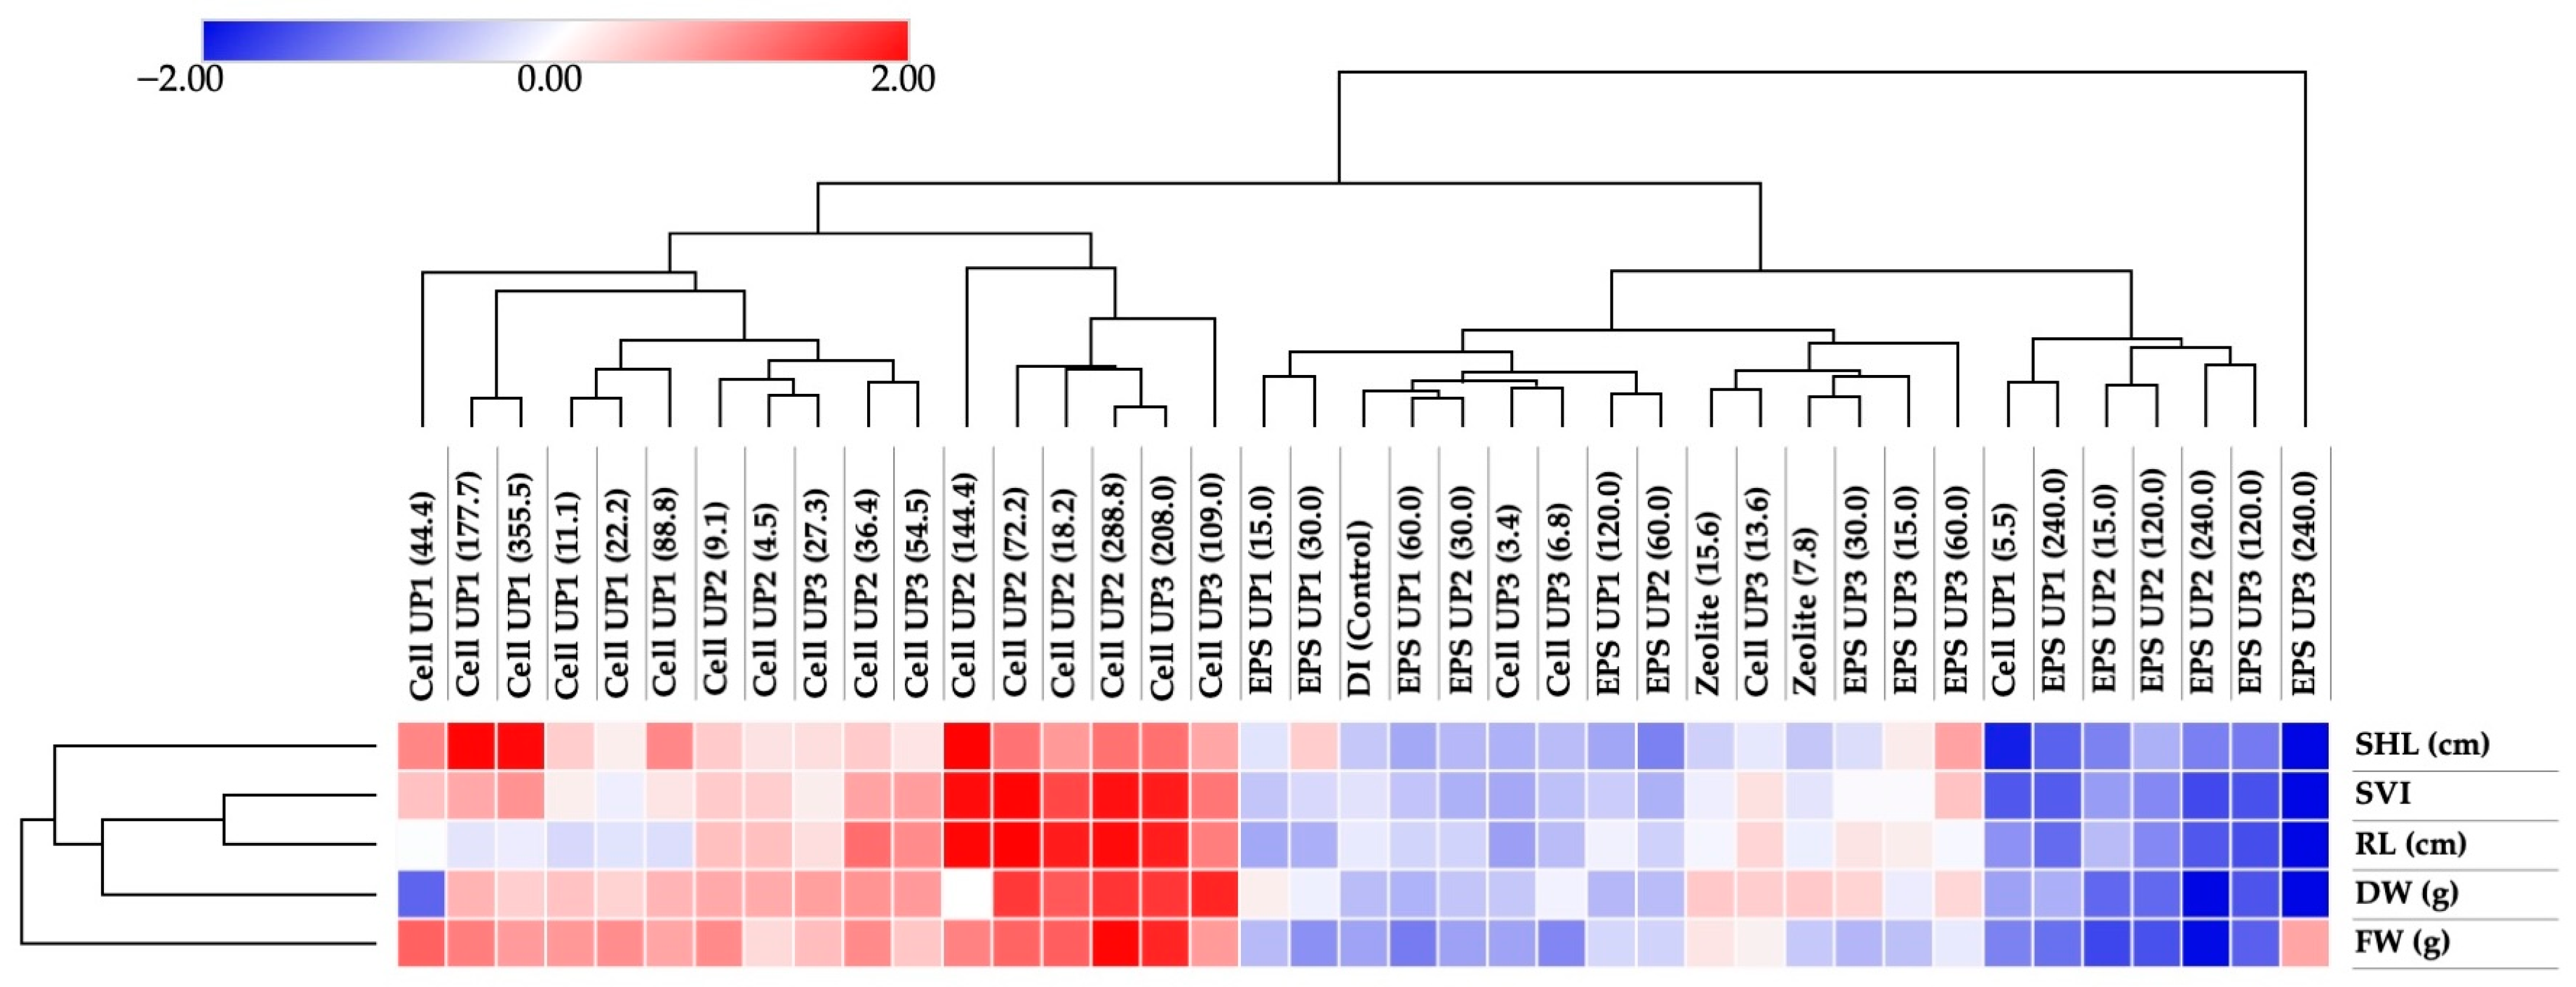
A hierarchical clustering heatmap (Figure 4) showed the effects of different cyanobacterial cell biomass and EPS treatments on the growth of rice seedlings. The analysis demonstrated a two-dimensional grouping structure, showing how the physiological parameters and treatment effectiveness were related. The dendrogram illustrated that fresh weight (FW) differed from the other growth parameters on the vertical axis. Dry weight (DW) clustered closely with elongation-related traits (SHL, RL, and SVI), whereas FW formed a separate group. This pattern indicates that treatments influenced fresh biomass (reflecting tissue hydration and water content) differently from dry matter accumulation and structural elongation. In the dendrogram, the treatments were separated into two main groups based on their bioactivity profiles on the horizontal axis. The first major group, characterized by intense red zones (positive Z-scores), was constructed of treatments that substantially promoted growth. This cluster was predominantly occupied by fresh cell biomass treatments, particularly from strain UP2. Figure 4 demonstrates that strain UP2 cells consistently had the highest positive values for all the related parameters. Supplementary Table S5 shows that strain UP2 at 144.4 g L−1 and 288.8 g L−1 had the high SVI values of 1136.60 and 1128.04, respectively, supporting the observation that this strain did much better than the control (664.67) and other strains. This strong performance of strain UP2 was further supported by statistical analyses, which showed consistently larger effect sizes (η2) and significant FDR-adjusted p-values across multiple growth parameters compared with strain UP1 (Supplementary Tables S4 and S6).
On the other hand, the second major treatment cluster consisted of blue zones (negative Z-scores), indicating growth inhibition or values that were lower than the mean. This group mostly had EPS treatments at high concentrations (for example, 120–240 mg L−1) for all strains, indicating a dose-dependent inhibitory effect. The heatmap illustrated that as the concentration of EPS increased, the treatments were progressively separated from the control group, with darker blue colors. For example, at the highest concentration (240 mg L−1), EPS from strain UP3 reduced root length down to 1.11 cm (Supplementary Table S7).
In the transition zone of the dendrogram, lower concentrations of EPS (15 mg L−1) from strain UP3 clustered closer to the control, exhibiting growth parameters that were comparable to or slightly superior to the control (SVI 709.04), in contrast to EPS from UP1 and UP2 (Supplementary Tables S3 and S5). In addition to the clustering patterns, statistical comparisons further indicated that strain UP3 also exhibited stronger and more consistent responses than UP1, as reflected by larger effect sizes and retained significance after FDR correction across several parameters (Supplementary Tables S4 and S8).
Based on this comprehensive clustering analysis, strain UP2 was selected as a representative candidate based on observed response patterns for the fresh cell biomass approach, while EPS from strain UP3 was selected as the representative for the EPS-based approach in the subsequent 21-day rice growth experiment and for the evaluation of their impact on soil improvement. This selection was therefore supported by both clustering patterns and statistical evidence, which consistently demonstrated that strains UP2 and UP3 exhibited stronger and more robust treatment responses than strain UP1.

3.4. Efficacy of Cyanobacterial Cell Biomass and EPS on Rice Growth Under Pot Culture Conditions

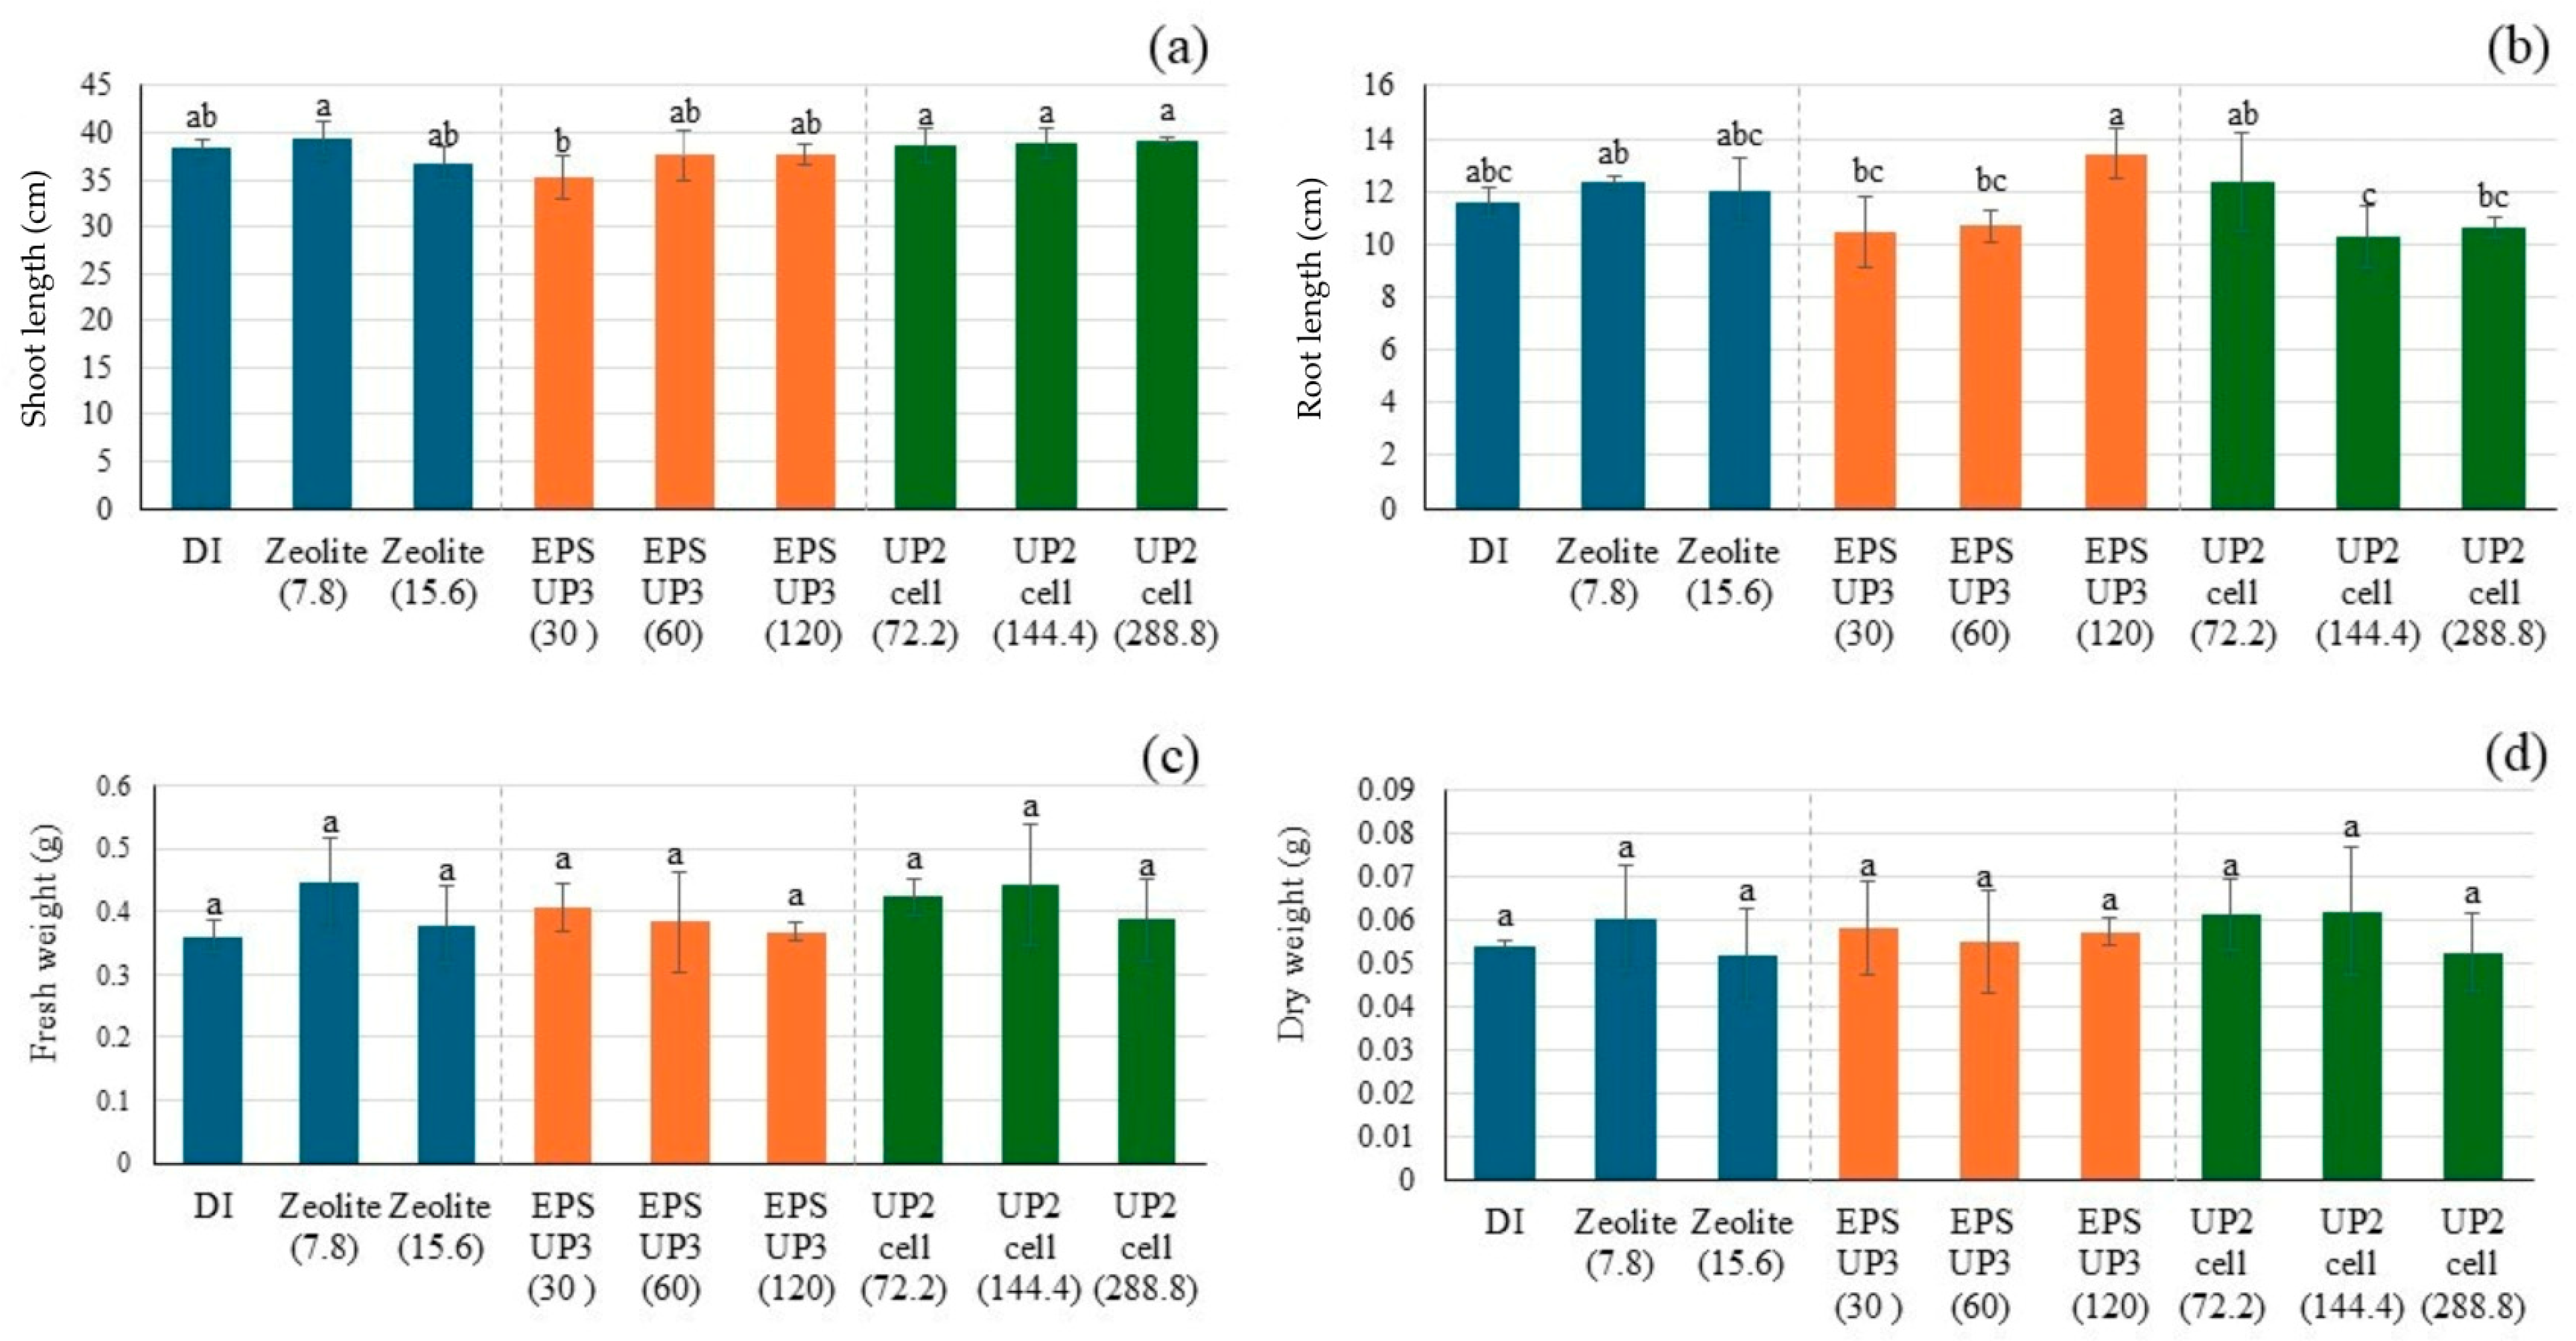
The 21-day pot experiment showed that the selected cyanobacterial cell biomass and EPS exerted distinct impacts on the physical characteristics of rice seedlings (Figure 5). Notably, although biomass treatments were applied at relatively high fresh-weight levels, the corresponding dry-weight equivalents remained substantially lower due to the high moisture content of the biomass (96–97%), as detailed in Supplementary Table S2. Shoot length reached its maximum (39.12 cm) at the highest cell concentration (288.8 g kg−1); however, this increase was not statistically different from that of most other treatments and controls. Similarly, the biomass treatment at 144.4 g kg−1 also had the highest values for fresh weight (0.4437 g) and dry weight (0.0621 g); however, no treatment was significantly different from the control group. In contrast, there was a significant divergence in root length, with the EPS treatment at 120 mg kg−1 being associated with increased root length under the tested conditions, reaching a maximum of 13.44 cm. Statistical analysis confirmed a significant treatment effect on root length (F = 3.257, p = 0.018, FDR-adjusted p = 0.029) (Supplementary Table S9). This performance was notably better than most cell concentrations and the positive control (zeolite), suggesting a potential role of the EPS extract in influencing root development.
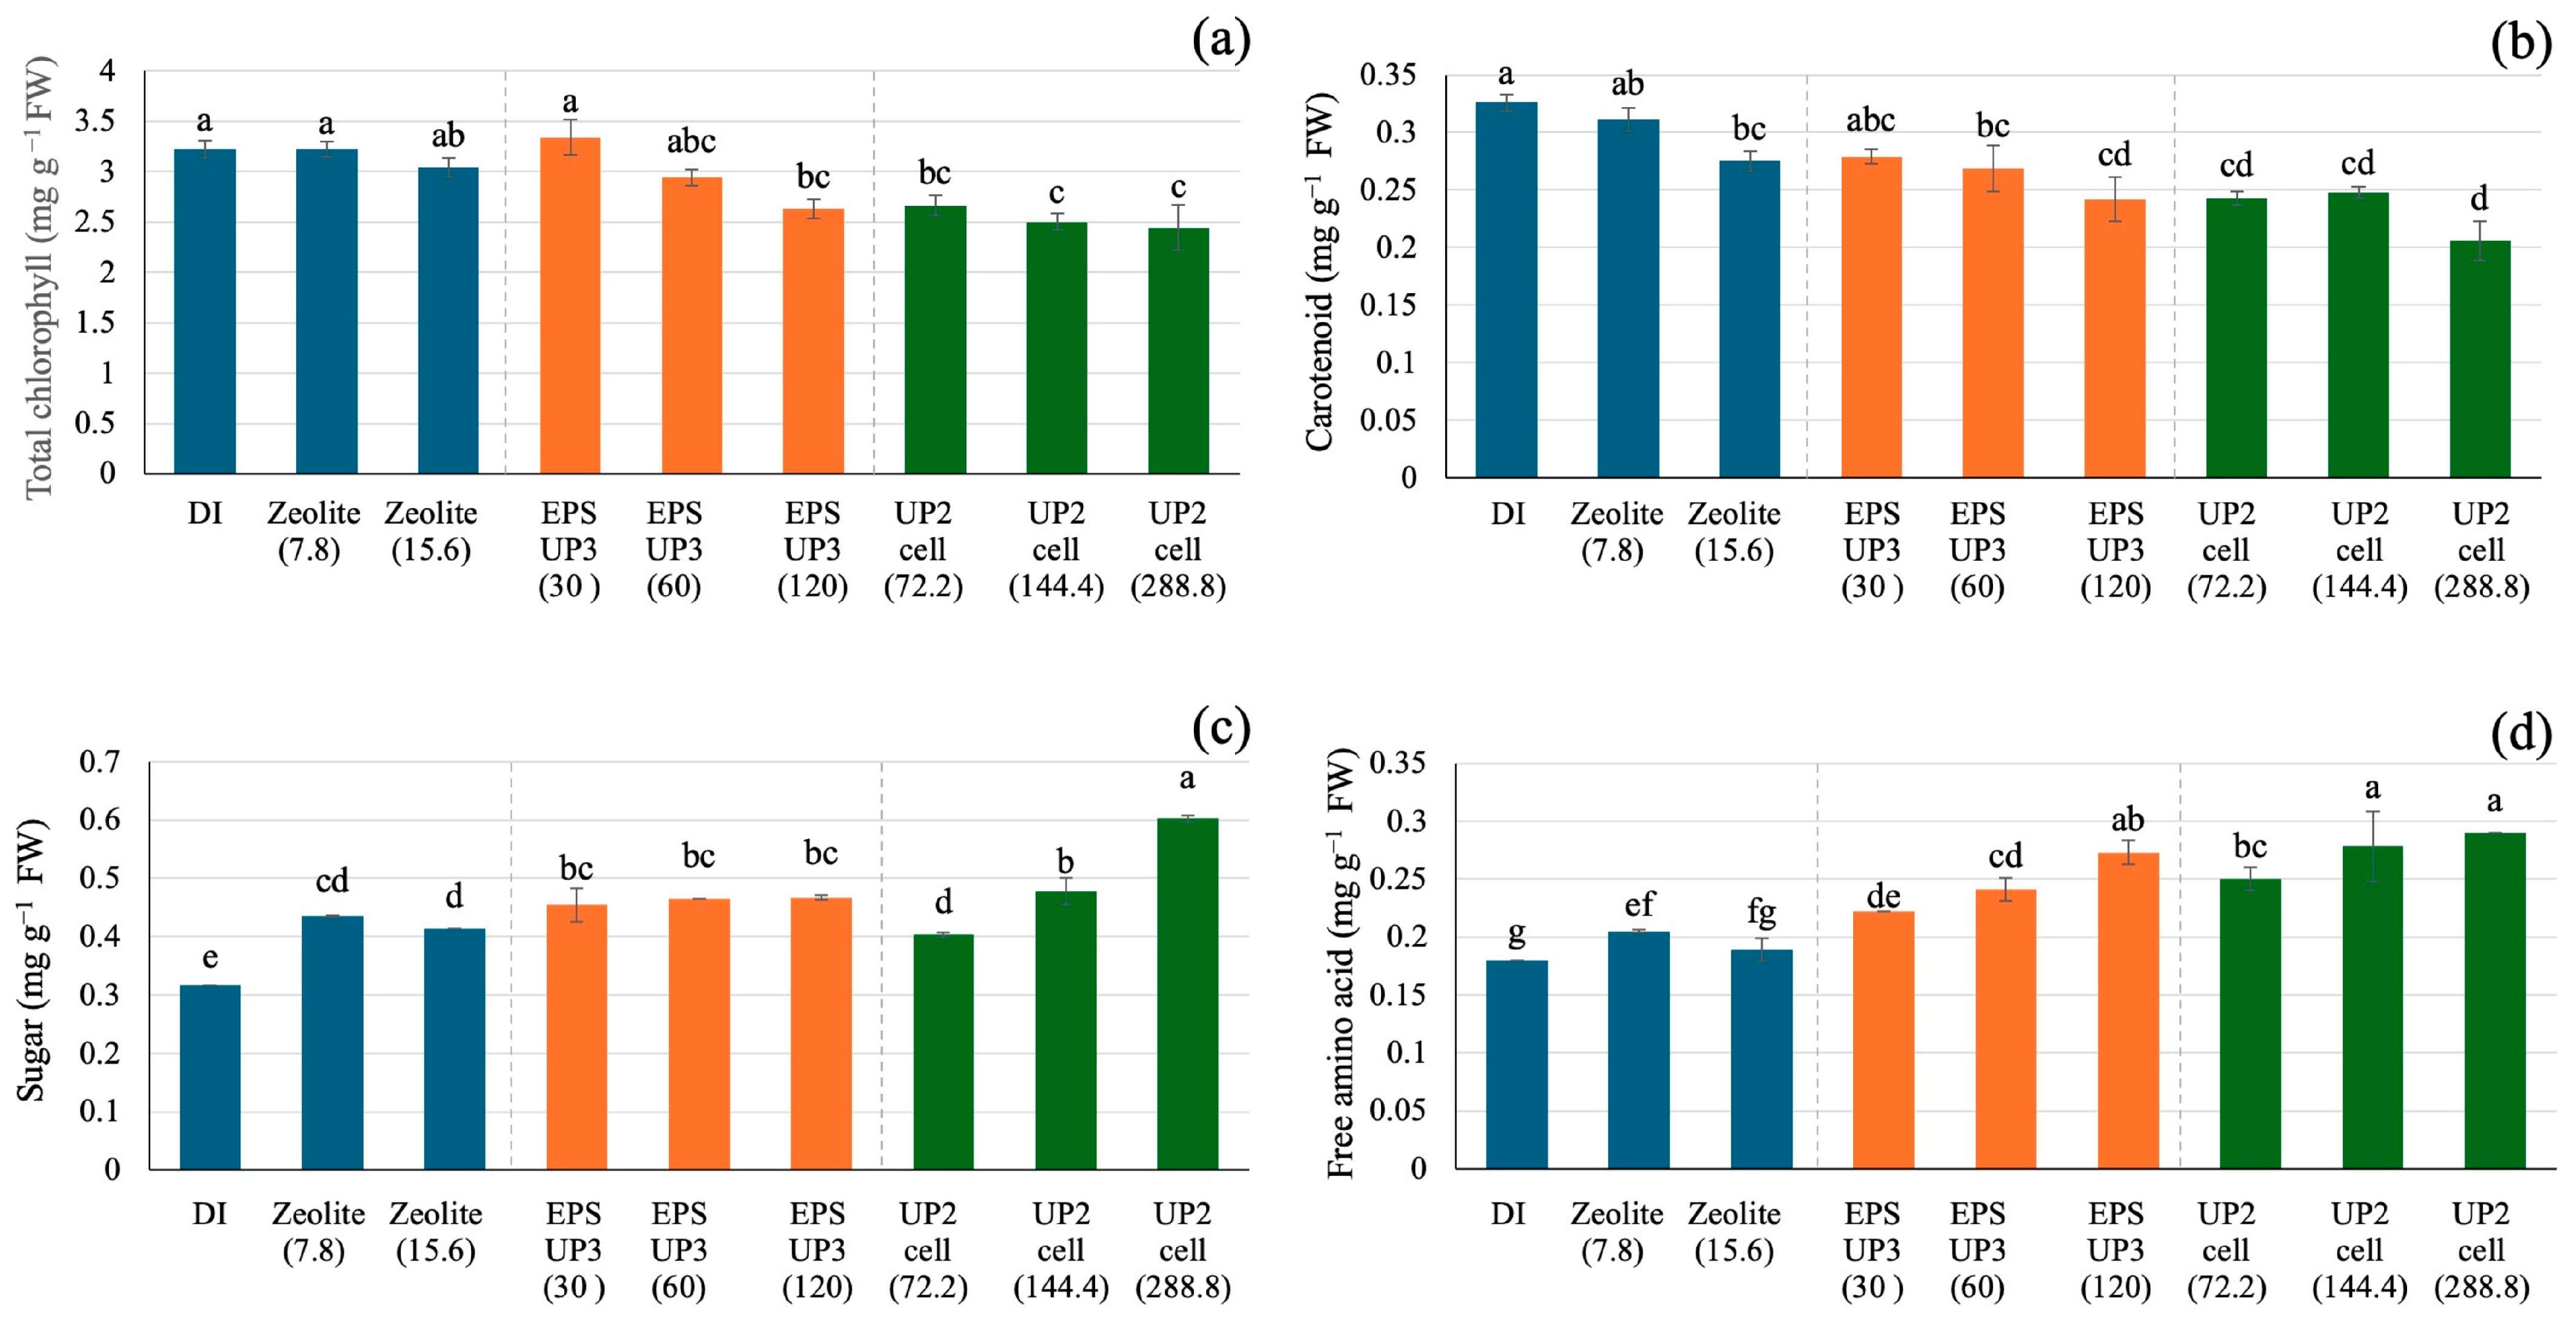
The biochemical analysis of rice seedlings after 21 days in the pot experiment demonstrated that the treatments had substantially varying levels of photosynthetic pigments and primary metabolites (Figure 6). Overall, treatment effects on total chlorophyll, carotenoid, sugar, and free amino acid contents were highly significant (F = 22.820–108.002, p < 0.001, FDR-adjusted p = 0.002), with large effect sizes (η2 = 0.910–0.980) (Supplementary Table S9). The control treatments of DI and zeolite had high total chlorophyll and carotenoid contents that were not significantly different from the EPS treatment from strain UP3 at 30 mg kg−1. In contrast, the cyanobacterial cell biomass treatment at 288.8 g kg−1 had the lowest amounts of both photosynthetic pigments, indicating that the highest cell concentration significantly lowered photosynthetic pigment accumulation. Conversely, the trend for total sugar content followed an inverse pattern, with the highest dose of cell biomass (288.8 g kg−1) having the highest total sugar level, which was much higher than all the other treatments. Likewise, the free amino acid content reached its maximum in the cell biomass treatment at 288.8 g kg−1 (0.290 mg g−1 FW), which was not significantly different from the cell treatment at 144.4 g kg−1 and the highest EPS treatment (120 mg kg−1). The data may reflect a shift in metabolic responses under high biomass application levels, wherein a reduction in photosynthetic pigments was associated with an enhanced accumulation of sugars and amino acids.

3.5. Effects of Cyanobacterial Biomass and EPS on Soil Physical and Chemical Properties

The chemical and physical properties of soil demonstrated varied responses to the application of cell biomass and EPS, summarized in Supplementary Tables S10–S13. The physical parameters of soil were predominantly influenced by cyanobacterial biomass treatments (Supplementary Table S13). In comparison to DI control, soils supplemented with cyanobacterial biomass demonstrated increased soil moisture and porosity and reduced bulk density, while EPS treatments resulted in comparatively smaller changes in these physical parameters. The highest soil moisture and porosity values were observed in soils treated with Cell UP1 and Cell UP3, whereas EPS treatments showed values closer to those of the DI and zeolite controls.
In contrast, several soil chemical properties showed treatment-specific responses (Supplementary Tables S10–S12). Available Fe and exchangeable K varied among treatments, whereas pH, organic matter, and total nitrogen showed relatively minor differences across treatments. The highest available Fe concentrations were observed in soils treated with Cell UP1 and Cell UP3, while EPS treatments showed moderate increases relative to the DI control. Exchangeable K was notably higher in zeolite-treated soil and in treatments involving strain UP3, particularly Cell UP3 and EPS UP3.
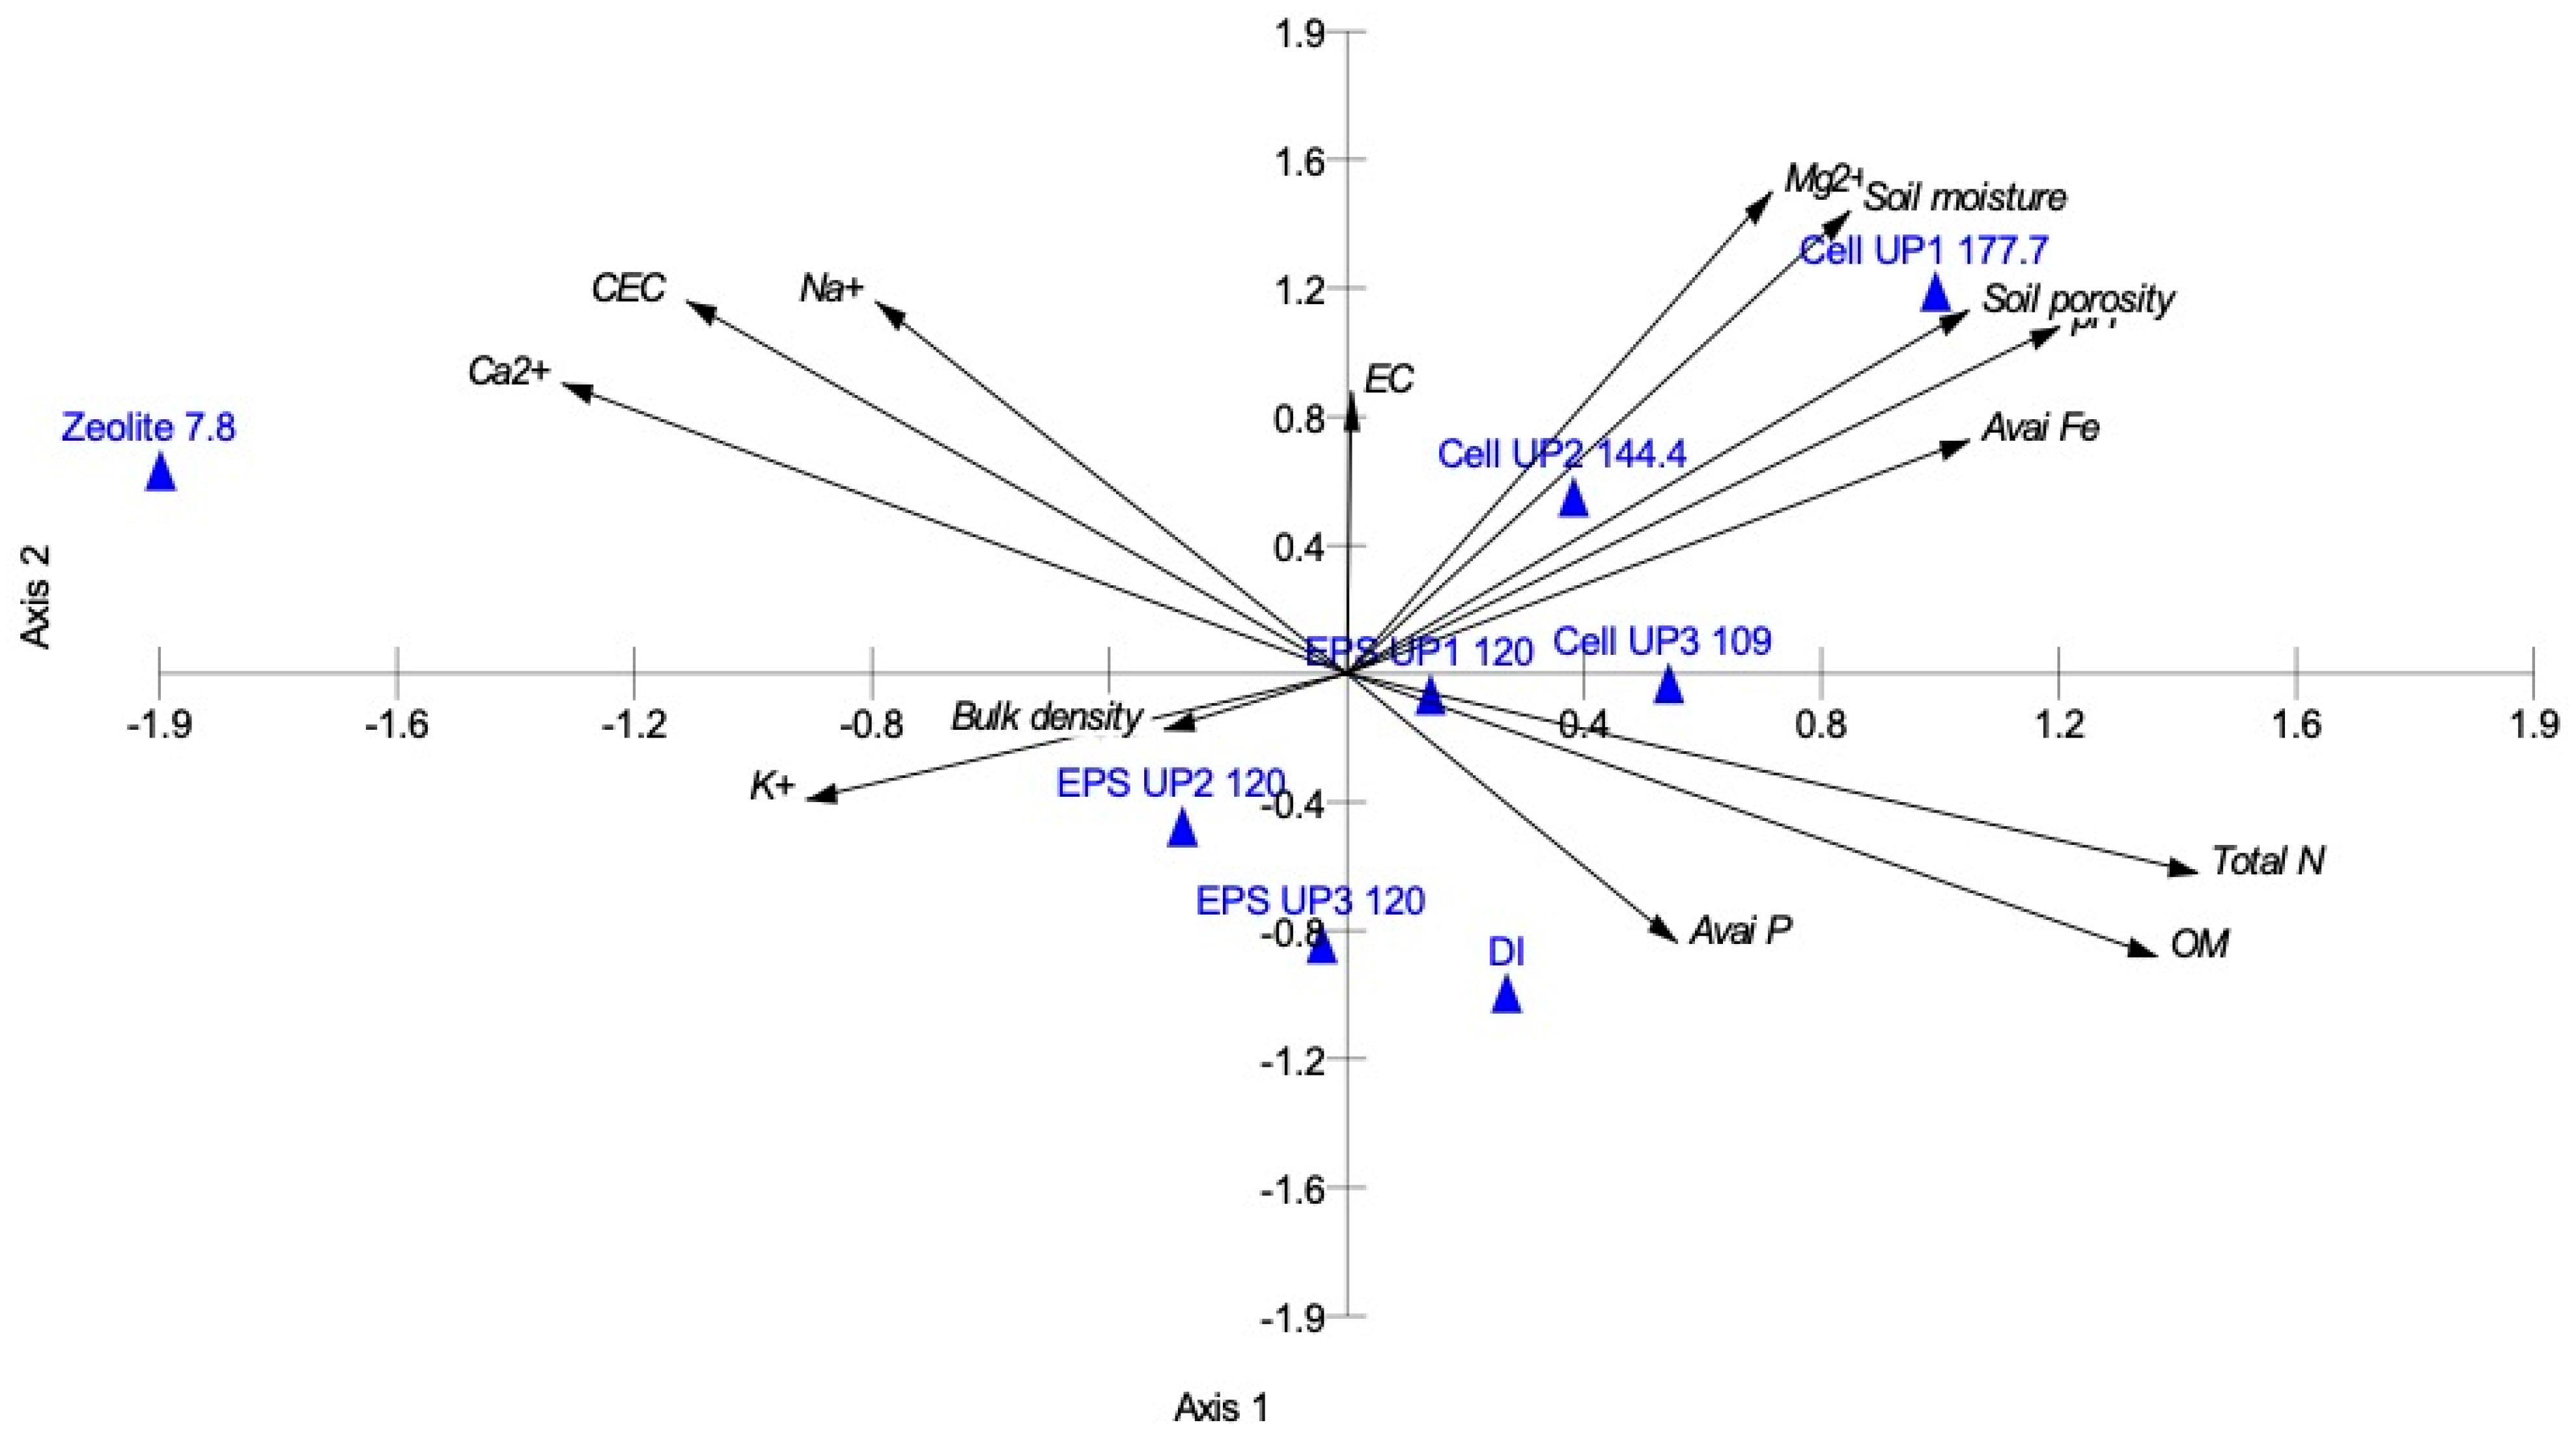
To further examine the relationships among soil variables across treatments, a principal component analysis (PCA) was performed using the measured soil physicochemical parameters (Figure 7). The PCA revealed clear multivariate patterns among treatments. Along the first principal component (Axis 1), biomass-amended soils were generally positioned on the positive side of the axis and were associated with variables related to soil physical properties, including soil moisture and porosity. In contrast, EPS treatments were distributed closer to the negative side of Axis 1 and were more closely associated with variables related to soil chemical properties and nutrient-related parameters. These separation patterns indicate that the contrasting responses between biomass and EPS treatments are already reflected in the measured soil physicochemical variables.
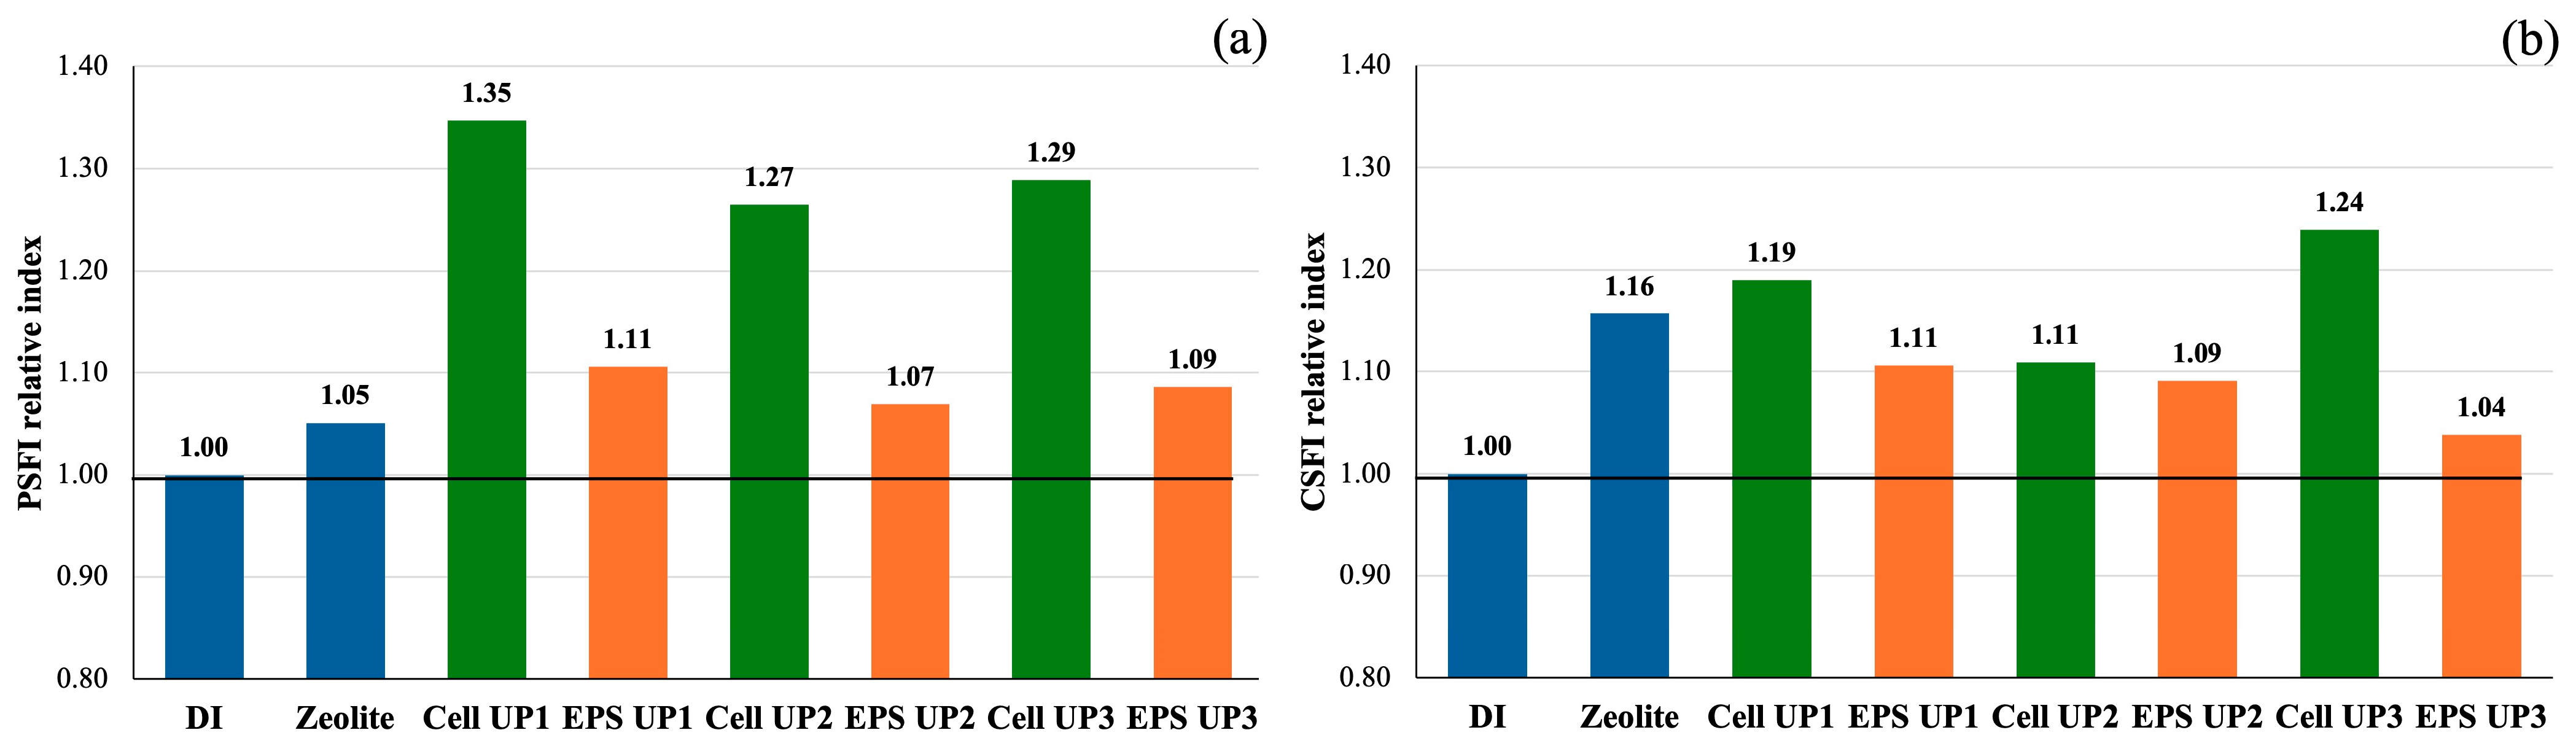
To summarize these functional response patterns, two integrative indices were calculated. The physical soil function index (PSFI) integrated normalized soil moisture, soil porosity, and inverse bulk density into a composite indicator (Figure 8a). PSFI values were consistently higher in biomass-amended soils than in EPS-treated soils and the DI control. Among the biomass treatments, Cell UP1, Cell UP2, and Cell UP3 exhibited PSFI values of 1.35, 1.27, and 1.29, respectively, whereas EPS treatments showed PSFI values ranging from 1.07 to 1.11. Zeolite treatment resulted in a PSFI value close to DI control. The chemical soil function index (CSFI) was calculated from normalized available Fe and CEC (Figure 8b). Among the treatments, Cell UP3 exhibited the highest CSFI value (1.24), followed by Cell UP1 (1.19) and Zeolite (1.16). Intermediate values were observed for Cell UP2 (1.11), PS UP1 (1.11), and PS UP2 (1.09), while PS UP3 showed the lowest CSFI among treated groups (1.04), although still higher than the control.
Overall, the PSFI and CSFI indices summarize the differential functional patterns observed in the soil variables. Biomass amendments tended to show stronger responses in indicators related to soil physical structure, while improvements in soil chemical properties were observed across multiple treatments, including both biomass- and EPS-derived applications, as well as zeolite. Notably, certain biomass treatments (e.g., Cell UP3 and Cell UP1) exhibited particularly strong responses in CSFI, indicating enhanced soil chemical function. These results may provide preliminary indications that cyanobacterial applications could be selected according to specific soil management objectives. However, these observations were derived from an independent soil incubation system and should not be directly interpreted as mechanistic predictors of plant growth responses.

4. Discussion

4.1. Differences Between Cyanobacterial Biomass and EPS and Their Functional Roles

Although the three indigenous nostocalean cyanobacterial strains produced comparable amounts of biomass under the experimental conditions, clear differences were observed in their patterns of carbon allocation toward EPS production and polymer characteristics. In particular, strain UP3 exhibited the highest EPS yield relative to cellular biomass, suggesting that a larger proportion of assimilated carbon was allocated to extracellular secretion rather than to structural cell components. This high EPS production behavior may indicate that strain UP3 preferentially allocates carbon toward extracellular secretion, which is consistent with previous reports suggesting that EPS overproduction serves as an adaptive strategy for resource storage and environmental protection under unbalanced C/N metabolism [32]. In addition to quantitative differences, the strains also differed in the structural properties of their EPS. While strain UP3 was the most efficient EPS producer in terms of yield, EPS extracted from strain UP2 exhibited a higher DP, indicating longer polymer chains and greater molecular complexity. This indicates that EPS quantity and polymerization characteristics represent distinct functional traits among the studied strains. Higher DP values are generally associated with increased molecular weight, viscosity, and structural stability, which may influence polymer–soil particle interactions [33]. Accordingly, differences in EPS polymerization and composition between strain UP3 and strain UP2 may be associated with differing response patterns under the tested conditions, with both strains exhibiting variable relationships with soil chemical and physical properties. The higher DP observed in strain UP2 may reflect structural differences in the polymers [17,34], although these differences were not consistently associated with stronger effects on soil functional indices in this study. Therefore, further structural characterization of the extracted EPS (e.g., monosaccharide composition, FTIR spectra, uronic acid, and protein content) will be necessary in future studies to better understand structure–function relationships.
Notably, despite these functional differences, highly similar morphological features typical of Nostoc-like cyanobacteria were observed among the strains. Based on morphology alone, strains UP1 and UP2 would have been classified as Nostoc. However, the separation of Ahomia from other Nostoc-like taxa based on molecular phylogeny has been recognized only in recent taxonomic revisions, indicating that morphology can obscure underlying genetic and functional divergence [35]. It is therefore suggested that morphological similarity does not necessarily correspond to functional equivalence and that strains with comparable filamentous structures may still differ in physiological traits relevant to agricultural applications. Overall, the functional divergence observed among these nostocalean strains appears to be associated with strain-specific carbon allocation strategies and EPS structural traits rather than taxonomic identity alone.

4.2. Contrasting Effects of Cyanobacterial Biomass and EPS on Rice Growth

The present results demonstrated that fresh cyanobacterial biomass and isolated EPS influenced rice growth through distinct physiological pathways. Application of fresh biomass, particularly from strain UP2, consistently enhanced seedling vigor across multiple growth parameters, indicating a synergistic mode of action. Fresh cyanobacterial biomass may potentially act as a biologically buffered input that could influence rhizosphere processes through the release of organic compounds during biomass decomposition [36]. The sustained availability of potential plant growth–promoting compounds has been reported to stimulate cell division and elongation, while filamentous structures and extracellular matrices may facilitate biofilm formation along the root surface, thereby improving nutrient acquisition efficiency [37]. In contrast, EPS treatments produced more selective and concentration-dependent responses, with their primary effect observed on root elongation rather than on whole-plant biomass accumulation. It should also be noted that most shoot growth and biomass-related parameters showed limited or non-significant responses in the 21-day pot experiment, indicating that the most consistent treatment effect occurred in root elongation during the early seedling stage. The observed increase in root growth may suggest that EPS could play roles beyond serving as a carbon source. Cyanobacterial EPS has been reported to contain bioactive compounds or signaling molecules that may potentially influence cellular processes in the root apical meristem, thereby promoting cell division and elongation [38]. This biological mechanism differs from that of abiotic soil amendments such as zeolite, which enhance plant growth mainly through physicochemical cation exchange without directly affecting plant signaling processes [39]. Enhanced root elongation induced by EPS may therefore provide adaptive advantages during early seedling establishment, particularly under nutrient-limited or physically constrained soil conditions [40].
At higher biomass application rates, rice seedlings exhibited reduced chlorophyll and carotenoid contents, accompanied by increased sugar and free amino acid accumulation. This response pattern may reflect source–sink regulation and feedback inhibition of photosynthesis rather than physiological stress [41]. The decomposition of protein-rich cyanobacterial biomass could release readily available organic carbon into the rhizosphere, which may be assimilated by rice seedlings, allowing partial downregulation of photosynthetic activity and a shift toward mixotrophic carbon acquisition [42]. Simultaneously, the elevated free amino acid content indicated that cyanobacterial biomass may serve as a source of organic nitrogen [43]. The degradation of cyanobacterial proteins into peptides and amino acids could allow direct uptake by rice roots, bypassing the energy-intensive reduction steps required for inorganic nitrogen assimilation [44,45]. In addition to supporting nitrogen nutrition, the accumulation of free amino acids may also contribute to osmotic regulation and stress preparedness [46]. Collectively, these findings may indicate potentially different modes of influence of cyanobacterial biomass and EPS on plant growth under controlled experimental conditions; however, these mechanisms were not directly tested in this study.

4.3. Soil Physical and Chemical Functions Influenced by Cyanobacterial Biomass and EPS

Soil responses to cyanobacterial applications further revealed a clear functional separation between biomass- and EPS-mediated effects. Biomass treatments predominantly improved soil physical properties, including increased moisture retention and porosity and reduced bulk density, which resulted in higher values of the PSFI. These improvements may be related to the combined effects of filamentous biomass and high-molecular-weight polymers acting as biological binding agents that could promote aggregate formation and structural stability [8,17]. Under these conditions, cyanobacterial biomass may contribute to soil conditioning under the experimental conditions. In terms of soil chemical properties, improvements were observed across both biomass and EPS treatments; however, biomass-based applications generally exhibited more pronounced responses. In particular, Cell UP3 and Cell UP1 showed the highest CSFI values, indicating enhanced soil chemical function associated with increased nutrient availability. While EPS matrices may facilitate interactions with cationic nutrients such as Fe and K through their physicochemical properties [35], their effects were comparatively less consistent across treatments.
The comparison with zeolite further emphasized this functional decoupling. Although zeolite exhibited a high abiotic capacity for nutrient retention through lattice-based ion exchange, it functioned primarily as a textural amendment and lacked the biological binding agents required to actively restructure soil aggregates [47]. In contrast, cyanobacterial biomass and EPS provided biologically active matrices capable of simultaneously interacting with soil particles, nutrients, and plant roots. These observations suggest that biomass-based amendments tend to exert stronger overall effects on soil properties, particularly in improving physical structure and, in some cases, chemical function. EPS-based inputs may show more variable or selective responses depending on strain characteristics. These results support a function-oriented perspective in which cyanobacterial applications can be tailored according to targeted soil management objectives.
The present study was conducted under controlled laboratory and greenhouse conditions to compare the functional responses of cyanobacterial biomass and EPS treatments over a relatively short experimental duration (21 days). Under such experimental conditions, soil or plant responses may arise not only from biological activity but also from potential physical or physicochemical effects (e.g., changes in solution viscosity or osmotic conditions). Furthermore, because the soil incubation and plant growth assays were conducted as independent systems, the soil indices (PSFI and CSFI) should be interpreted primarily as indicators of soil functional responses rather than as direct causal drivers of the observed plant growth responses. Moreover, the functional interpretations presented in this study were based primarily on physiological and biochemical responses, while the underlying molecular mechanisms were not directly investigated.
The applicability of these findings to agricultural production requires further evaluation under field conditions. Specifically, the use of a single soil type and the restricted timeframe of the current study limit the immediate generalization of these results across diverse agroecosystems. Cyanobacterial biomass or EPS could potentially be developed as biological soil amendments or bioinoculants to support early rice seedling establishment and improve soil physicochemical properties. However, field applications may be influenced by environmental variability, competition with native microbial communities, and spatial variability in herbicide residues across agricultural soils. Additionally, the specific structural properties of the EPS were not fully characterized in the current study. Future studies should therefore incorporate detailed EPS structural analyses, appropriate artifact controls, and agronomically realistic application rates to validate these findings under actual field conditions.

5. Conclusions

This study provides exploratory evidence of functional variation in indigenous nostocalean cyanobacteria isolated from soils in northern Thailand. Morphological and molecular analyses assigned the isolates to the order Nostocales, with strains affiliated with the genera Ahomia and Nostoc, providing a taxonomic framework for the functional comparisons conducted in this study. The isolates exhibited distinct functional traits, particularly in EPS production capacity, which were associated with different rice seedling responses and soil physicochemical properties. Fresh biomass, especially from the forest-derived strain UP2, was associated with trends toward improved seedling vigor and metabolic activity, whereas EPS from the paddy-field strain UP3 was associated with increased root elongation and early seedling establishment under the tested conditions. Soil analyses indicated treatment-dependent differences in soil physicochemical properties between biomass- and EPS-based treatments under the experimental conditions. Biomass from all strains was consistently associated with improvements in soil physical properties, whereas responses in soil chemical properties were more variable, with relatively stronger effects observed in certain biomass treatments, particularly strains UP3 and UP1. Future studies should focus on field-scale validation, optimization of application strategies, and mechanistic investigations to better understand their roles under agronomic conditions.

Supplementary Materials

The following supporting information can be downloaded at: https://www.mdpi.com/article/10.3390/crops6020040/s1, Supplementary Tables S1–S13. Supplementary Table S1: Equivalent fresh biomass concentrations required to achieve target EPS levels based on measured EPS yield of each cyanobacterial strain; Supplementary Table S2: Strain-specific conversion of fresh biomass concentrations to dry weight equivalents; Supplementary Table S3: Effect of strain UP1 biomass and EPS application on seed germination and seedling growth of rice at laboratory scale for a 7-day period; Supplementary Table S4: Analysis of treatment effects on germination, growth, and biomass parameters in strain UP1; Supplementary Table S5: Effect of strain UP2 biomass and EPS application on seed germination and seedling growth of rice at laboratory scale for a 7-day period; Supplementary Table S6: Analysis of treatment effects on germination, growth, and biomass parameters in strain UP2; Supplementary Table S7: Effect of strain UP3 biomass and EPS application on seed germination and seedling growth of rice at laboratory scale for a 7-day period; Supplementary Table S8: Analysis of treatment effects on germination, growth, and biomass parameters in strain UP3; Supplementary Table S9: Analysis of treatment effects on rice seedling growth, physiological, and biomass parameters in a 21-day pot experiment; Supplementary Table S10: Effect of fresh cell biomass and EPS application on soil chemical properties; Supplementary Table S11: Analysis of treatment effects on soil physicochemical properties; Supplementary Table S12: Effect of fresh cell biomass and EPS application on soil exchangeable cations; Supplementary Table S13: Effect of fresh cell biomass and EPS application on soil physical properties.

Author Contributions

Conceptualization, N.N. and K.I.; methodology, N.N., S.T. and K.I.; formal analysis, N.N., S.T. and K.I.; resources, N.N. and K.I.; validation, S.T.; investigation, N.N., S.T., K.D. and K.P.; data curation, S.T.; writing—original draft preparation, N.N., S.T., N.W., K.D., K.P. and K.I.; writing—review and editing, N.N. and K.I.; visualization, N.N. and K.I.; supervision, N.N. and K.I.; project administration, N.N. and K.I.; funding acquisition, N.N. All authors have read and agreed to the published version of the manuscript.

Funding

This research was funded by the University of Phayao through funding from the National Research Council of Thailand (NRCT). (Grant No. 209495).

Data Availability Statement

The data supporting the findings of this study are available in the Supplementary Materials and from the corresponding author upon reasonable request.

Acknowledgments

The authors gratefully acknowledge the Phayao Rice Seed Center for providing the rice seeds used in this study.

Conflicts of Interest

The authors declare no conflicts of interest.

References

  1. FAO. World Food and Agriculture—Statistical Yearbook 2025; FAO: Rome, Italy, 2025. [Google Scholar] [CrossRef] [Scilit]
  2. Luz, F.; Lustosa Carvalho, M.; Castioni, G.; Bordonal, R.; Cooper, M.; Carvalho, J.; Cherubin, M. Soil structure changes induced by tillage and reduction of machinery traffic on sugarcane—A diversity of assessment scales. Soil Tillage Res. 2022, 223, 105469. [Google Scholar] [CrossRef] [Scilit]
  3. Tansay, S.; Issakul, K.; Ngearnpat, N.; Chunhachart, O.; Thuptimdang, P. Impact of Environmentally relevant concentrations of glyphosate and 2,4-D commercial formulations on Nostoc sp. N1 and Oryza sativa L. rice seedlings. Front. Sustain. Food Syst. 2021, 5, 661634. [Google Scholar] [CrossRef] [Scilit]
  4. Iniesta-Pallarés, M.; Álvarez, C.; Gordillo-Cantón, F.M.; Ramírez-Moncayo, C.; Alves-Martínez, P.; Molina-Heredia, F.P.; Mariscal, V. Sustaining rice production through biofertilization with N2-fixing cyanobacteria. Appl. Sci. 2021, 11, 4628. [Google Scholar] [CrossRef] [Scilit]
  5. Álvarez, C.; Navarro, J.A.; Molina-Heredia, F.P.; Mariscal, V. Endophytic colonization of rice (Oryza sativa L.) by the symbiotic strain Nostoc punctiforme PCC 73102. Mol. Plant-Microbe Interact. 2020, 33, 1040–1045. [Google Scholar] [CrossRef] [Scilit] [PubMed]
  6. Chamizo, S.; Mugnai, G.; Rossi, F.; Certini, G.; De Philippis, R. Cyanobacteria inoculation improves soil stability and fertility on different textured soils: Gaining insights for applicability in soil restoration. Front. Environ. Sci. 2018, 6, 49. [Google Scholar] [CrossRef] [Scilit]
  7. De Silva, G.; Al-Musawi, Z.; Kabato, W.S.; Zhao, J.-B.; Kovács, G.; Kulmány, I.; Molnár, Z. Unveiling the role of edaphic microalgae in soil carbon sequestration: Potential for agricultural inoculants in climate change mitigation. Agriculture 2024, 14, 2065. [Google Scholar] [CrossRef] [Scilit]
  8. Costa, O.Y.A.; Raaijmakers, J.M.; Kuramae, E.E. Microbial extracellular polymeric substances: Ecological function and impact on soil aggregation. Front. Microbiol. 2018, 9, 1636. [Google Scholar] [CrossRef] [Scilit]
  9. Takács, G.; Stirk, W.A.; Gergely, I.; Molnár, Z.; van Staden, J.; Ördög, V. Biostimulating effects of the cyanobacterium Nostoc piscinale on winter wheat in field experiments. S. Afr. J. Bot. 2019, 126, 99–106. [Google Scholar] [CrossRef] [Scilit]
  10. Harahap, R.T.; Azizah, I.R.; Setiawati, M.R.; Herdiyantoro, D.; Simarmata, T. Enhancing upland rice growth and yield with indigenous plant growth-promoting rhizobacteria (PGPR) isolate at N-fertilizers dosage. Agriculture 2023, 13, 1987. [Google Scholar] [CrossRef] [Scilit]
  11. Fadiji, A.E.; Babalola, O.O. Elucidating mechanisms of endophytes used in plant protection and other bioactivities with multifunctional prospects. Front. Bioeng. Biotechnol. 2020, 8, 467. [Google Scholar] [CrossRef] [Scilit]
  12. Santini, G.; Biondi, N.; Rodolfi, L.; Tredici, M.R. Plant biostimulants from cyanobacteria: An emerging strategy to improve yields and sustainability in agriculture. Plants 2021, 10, 643. [Google Scholar] [CrossRef] [Scilit] [PubMed]
  13. Wang, Z.; Fu, X.; Kuramae, E.E. Insight into farming native microbiome by bioinoculant in soil-plant system. Microbiol. Res. 2024, 285, 127776. [Google Scholar] [CrossRef] [Scilit] [PubMed]
  14. Diaz-Rodriguez, A.M.; Parra Cota, F.I.; Cira Chavez, L.A.; Garcia Ortega, L.F.; Estrada Alvarado, M.I.; Santoyo, G.; de Los Santos-Villalobos, S. Microbial inoculants in sustainable agriculture: Advancements, challenges, and future directions. Plants 2025, 14, 191. [Google Scholar] [CrossRef] [Scilit] [PubMed]
  15. Hakkoum, Z.; Minaoui, F.; Tazart, Z.; Chabili, A.; Douma, M.; Mouhri, K.; Loudiki, M. Impact of a soil cyanobacteria consortium-based bioinoculant on tomato growth, yield, and fruit quality. Plants 2025, 14, 2034. [Google Scholar] [CrossRef] [Scilit]
  16. Shahwar, D.; Mushtaq, Z.; Mushtaq, H.; Alqarawi, A.A.; Park, Y.; Alshahrani, T.S.; Faizan, S. Role of microbial inoculants as bio fertilizers for improving crop productivity: A review. Heliyon 2023, 9, e16134. [Google Scholar] [CrossRef] [Scilit]
  17. Chamizo, S.; Adessi, A.; Torzillo, G.; De Philippis, R. Exopolysaccharide features influence growth success in biocrust-forming cyanobacteria, moving from liquid culture to sand microcosms. Front. Microbiol. 2020, 11, 568224. [Google Scholar] [CrossRef] [Scilit]
  18. Roncero-Ramos, B.; Román, J.R.; Gómez-Serrano, C.; Cantón, Y.; Acién, F.G. Production of a biocrust-cyanobacteria strain (Nostoc commune) for large-scale restoration of dryland soils. J. Appl. Phycol. 2019, 31, 2217–2230. [Google Scholar] [CrossRef] [Scilit]
  19. Brull, L.; Huang, Z.; Thomas-Oates, J.; Paulsen, B.; Cohen, E.; Michaelsen, T. Studies of polysaccharides from three edible species of Nostoc (cyanobacteria) with different colony morphologies: Structural characterization and effect on the complement system of polysaccharides from Nostoc commune. J. Phycol. 2000, 36, 871–881. [Google Scholar] [CrossRef] [Scilit]
  20. Liu, Q.; Yao, C.; Sun, Y.; Chen, W.; Tan, H.; Cao, X.; Xue, S.; Yin, H. Production and structural characterization of a new type of polysaccharide from nitrogen-limited Arthrospira platensis cultivated in outdoor industrial-scale open raceway ponds. Biotechnol. Biofuels 2019, 12, 131. [Google Scholar] [CrossRef] [Scilit]
  21. Khatri, D.; Chhetri, S.B.B. Reducing sugar, total phenolic content, and antioxidant potential of Nepalese plants. BioMed Res. Int. 2020, 2020, 7296859. [Google Scholar] [CrossRef] [Scilit]
  22. Banerjee, S.; Singh, A.; Pal, R. A taxonomic investigation on heterocytous cyanobacteria of West Bengal, India. Phytomorphology 2021, 70, 53–70. [Google Scholar]
  23. Soares, F.; Ramos, V.; Trovão, J.; Cardoso, S.M.; Tiago, I.; Portugal, A. Parakomarekiella sesnandensis gen. et sp. nov. (Nostocales, Cyanobacteria) isolated from the old cathedral of Coimbra, Portugal (UNESCO World Heritage Site). Eur. J. Phycol. 2020, 56, 301–315. [Google Scholar] [CrossRef] [Scilit]
  24. Kotabin, N.; Issakul, K.; Pawelzik, E.; Tahara, Y.; Chunhachart, O. Alleviation of cadmium toxicity in rice by γ-polyglutamic acid produced by Bacillus subtilis. Environ. Asia 2017, 10, 63–72. [Google Scholar] [CrossRef]
  25. Chinnasamy, G.P.; Sundareswaran, S. Evaluation of radicle emergence test to predict seed vigor and field emergence in different seed lots of cluster bean (Cyamopsis tetragonoloba L.). Madras Agric. J. 2019, 106, 143–149. [Google Scholar] [CrossRef] [Scilit]
  26. Anantharaman, S.; Padmarajaiah, N.; Al-Tayar, N.G.S.; Shrestha, A.K. Ninhydrin-sodium molybdate chromogenic analytical probe for the assay of amino acids and proteins. Spectrochim. Acta Part A Mol. Biomol. Spectrosc. 2017, 173, 897–903. [Google Scholar] [CrossRef] [Scilit]
  27. Park, J.; Cho, K.H.; Ligaray, M.; Choi, M.J. Organic matter composition of manure and its potential impact on plant growth. Sustainability 2019, 11, 2346. [Google Scholar] [CrossRef] [Scilit]
  28. Le Roux, S.G.; du Plessis, A.; Clarke, C.E. Micro CT-based bulk density measurement method for soils. J. S. Afr. Inst. Civ. Eng. 2019, 61, 2–9. [Google Scholar] [CrossRef] [Scilit]
  29. Liddle, K.; McGonigle, T.; Koiter, A. Microbe biomass in relation to organic carbon and clay in soil. Soil Syst. 2020, 4, 41. [Google Scholar] [CrossRef] [Scilit]
  30. Ramamoorthi, V.; Meena, S. Quantification of soil organic carbon—Comparison of wet oxidation and dry combustion methods. Int. J. Curr. Microbiol. Appl. Sci. 2018, 7, 146–154. [Google Scholar] [CrossRef] [Scilit]
  31. Sinore, T.; Kissi, E.; Aticho, A. The effects of biological soil conservation practices and community perception toward these practices in the Lemo District of Southern Ethiopia. Int. Soil Water Conserv. Res. 2018, 6, 123–130. [Google Scholar] [CrossRef] [Scilit]
  32. Paper, M.; Jung, P.; Koch, M.; Lakatos, M.; Nilges, T.; Brück, T.B. Stripped: Contribution of cyanobacterial extracellular polymeric substances to the adsorption of rare earth elements from aqueous solutions. Front. Bioeng. Biotechnol. 2023, 11, 1299349. [Google Scholar] [CrossRef] [Scilit]
  33. Liu, Z.; Liu, Y.; Ma, X.; Yi, H.; Zhang, L.; Liu, T. Exploration of the key factors influencing the viscosity of exopolysaccharides produced by Streptococcus thermophilus in milk fermentation through comparative studies. Int. J. Biol. Macromol. 2025, 315, 144347. [Google Scholar] [CrossRef] [Scilit] [PubMed]
  34. Laroche, C. Exopolysaccharides from microalgae and cyanobacteria: Diversity of strains, production strategies, and applications. Mar. Drugs 2022, 20, 336. [Google Scholar] [CrossRef] [Scilit] [PubMed]
  35. Tawong, W.; Pongcharoen, P.; Pongpadung, P.; Ponza, S.; Saijuntha, W. Amazonocrinis thailandica sp. nov. (Nostocales, Cyanobacteria), a novel species of the previously monotypic Amazonocrinis genus from Thailand. Algae 2022, 37, 1–14. [Google Scholar] [CrossRef] [Scilit]
  36. Raghavan, P.; Potnis, A.; Rajaram, H. Cyanobacterial biofilms: Perspectives from origin to applications. In Understanding Microbial Biofilms; Academic Press: San Diego, CA, USA, 2023; pp. 23–39. [Google Scholar]
  37. Uniyal, S.; Bhandari, M.; Singh, P.; Singh, R.K.; Tiwari, S.P. Cytokinin biosynthesis in cyanobacteria: Insights for crop improvement. Front. Genet. 2022, 13, 933226. [Google Scholar] [CrossRef] [Scilit]
  38. Gurusaravanan, P.; Vinoth, S.; Satheesh Kumar, M.; Thajuddin, N.; Jayabalan, N. Effect of cyanobacterial extracellular products on high-frequency in vitro induction and elongation of Gossypium hirsutum L. organs through shoot apex explants. J. Genet. Eng. Biotechnol. 2013, 11, 9–16. [Google Scholar] [CrossRef] [Scilit]
  39. Mondal, M.; Biswas, B.; Garai, S.; Sarkar, S.; Banerjee, H.; Brahmachari, K.; Bandyopadhyay, P.K.; Maitra, S.; Brestic, M.; Skalicky, M.; et al. Zeolites enhance soil health, crop productivity and environmental safety. Agronomy 2021, 11, 448. [Google Scholar] [CrossRef] [Scilit]
  40. González-Hourcade, M.; Del Campo, E.M.; Braga, M.R.; Salgado, A.; Casano, L.M. Disentangling the role of extracellular polysaccharides in desiccation tolerance in lichen-forming microalgae. First evidence of sulfated polysaccharides and ancient sulfotransferase genes. Environ. Microbiol. 2020, 22, 3096–3111. [Google Scholar] [CrossRef] [Scilit]
  41. Zhang, S.; Chai, H.; Sun, J.; Zhang, Y.; Lu, Y.; Jiang, D.; Dai, T.; Tian, Z. Regulatory effects of source–sink manipulations on photosynthesis in wheat with different source–sink relationships. Plants 2025, 14, 1456. [Google Scholar] [CrossRef] [Scilit]
  42. Zhang, Z.; Sun, D.; Cheng, K.-W.; Chen, F. Investigation of carbon and energy metabolic mechanism of mixotrophy in Chromochloris zofingiensis. Biotechnol. Biofuels 2021, 14, 36. [Google Scholar] [CrossRef] [Scilit]
  43. Macário, I.P.E.; Veloso, T.; Romão, J.; Gonçalves, F.J.M.; Pereira, J.L.; Duarte, I.F.; Ventura, S.P.M. Metabolic composition of the cyanobacterium Nostoc muscorum as a function of culture time: A 1H NMR metabolomics study. Algal Res. 2022, 66, 102792. [Google Scholar] [CrossRef] [Scilit]
  44. Holz, M.; Lewin, S.; Kolb, S.; Becker, J.N.; Bergmann, J. How to get to the N—A call for interdisciplinary research on organic N utilization pathways by plants. Plant Soil 2025, 508, 955–969. [Google Scholar] [CrossRef] [Scilit]
  45. Tünnermann, L.; Aguetoni Cambui, C.; Franklin, O.; Merkel, P.; Näsholm, T.; Gratz, R. Plant organic nitrogen nutrition: Costs, benefits, and carbon use efficiency. New Phytol. 2025, 245, 1018–1028. [Google Scholar] [CrossRef] [Scilit]
  46. Batista-Silva, W.; Heinemann, B.; Rugen, N.; Nunes-Nesi, A.; Araújo, W.L.; Braun, H.P.; Hildebrandt, T.M. The role of amino acid metabolism during abiotic stress release. Plant Cell Environ. 2019, 42, 1630–1644. [Google Scholar] [CrossRef] [Scilit]
  47. Szatanik-Kloc, A.; Szerement, J.; Adamczuk, A.; Józefaciuk, G. Effect of low zeolite doses on plants and soil physicochemical properties. Materials 2021, 14, 2617. [Google Scholar] [CrossRef] [Scilit]
Figure 1. Morphological characterization of indigenous nostocalean cyanobacterial strains. Columns represent: (Left) colony morphology on BG-11 N-free medium; (Middle) microscopic features showing vegetative cells and heterocysts; and (Right) negative staining with nigrosin demonstrating the presence of EPS sheaths (clear zones) surrounding the filaments. Rows correspond to strain UP1 (ac), strain UP2 (df), and strain UP3 (gi). Scale bars: 1 cm for colony images (a,d,g) and 10 µm for microscopic images (b,c,e,f,h,i).
Crops 06 00040 g001
Figure 2. Phylogenetic relationships of cyanobacterial isolates UP1, UP2, and UP3 inferred from partial 16S rRNA gene sequences using the Neighbor-Joining method with 1000 bootstrap replicates. Bootstrap values are shown at the nodes. Spirulina major strain PCC6313 was used as the outgroup. The scale bar represents nucleotide substitutions per site.
Crops 06 00040 g002
Figure 3. Biomass, EPS production, and carbohydrate characteristics of three indigenous nostocalean cyanobacterial strains. (a) Biomass dry weight, EPS yield, and EPS/biomass ratio; (b) Total sugar, reducing sugar contents, and degree of polymerization (DP). Error bars represent mean ± standard deviation (n = 3). Different lowercase letters above error bars indicate significant differences between strains at p ≤ 0.05 according to Duncan’s multiple range test.
Crops 06 00040 g003
Figure 4. Hierarchical clustering heatmap visualizing the standardized effect (Z-scores) of different cyanobacterial cell and EPS treatments on five key rice seedling growth parameters: shoot length (SHL), seedling vigor index (SVI), fresh weight (FW), root length (RL), and dry weight (DW). The color scale ranges from blue (minimum value) to red (maximum value). Numbers in parentheses indicate the concentration applied: fresh cell biomass and zeolite in grams per liter and EPS in milligrams per liter. The dendrograms represent the hierarchical clustering of treatments and variables based on similarity.
Crops 06 00040 g004
Figure 5. Effects of strain UP2 fresh cell biomass and EPS from strain UP3 on rice seedling growth parameters in a pot culture experiment after 21 days: (a) shoot length; (b) root length; (c) fresh weight; and (d) dry weight. Numbers in parentheses indicate the applied concentrations: zeolite and fresh cell biomass in grams per kilogram, and EPS in milligrams per kilogram. Error bars represent mean ± standard deviation (SD). Different lowercase letters above error bars indicate statistically significant differences according to Duncan’s multiple range test (p ≤ 0.05). DI = distilled water.
Crops 06 00040 g005
Figure 6. Effects of strain UP2 fresh cell biomass and EPS from strain UP3 on the biochemical parameters of rice seedlings in a 21-day pot culture experiment: (a) total chlorophyll; (b) carotenoid content; (c) total sugar content; and (d) free amino acid content. Numbers in parentheses indicate the applied concentrations: zeolite and fresh cell biomass in grams per kilogram and EPS in milligrams per kilogram. Error bars represent mean ± standard deviation (SD). Different lowercase letters above error bars indicate statistically significant differences according to Duncan’s multiple range test (p ≤ 0.05). DI = distilled water.
Crops 06 00040 g006
Figure 7. PCA biplot of soil physicochemical variables under cyanobacterial biomass and EPS treatments. Treatment scores (blue triangles) represent the positions of individual treatments in multivariate space, while arrows indicate the direction and strength of soil variable contributions. DI = distilled water (control); CEC = cation exchange capacity; EPS = extracellular polymeric substances; OM = organic matter; EC = electrical conductivity; Total N = total nitrogen; Avai P = available phosphorus; Avai Fe = available iron; Mg2+ = magnesium ion; K+ = potassium ion; Ca2+ = calcium ion; Na+ = sodium ion.
Crops 06 00040 g007
Figure 8. Functional soil fertility indices following cyanobacterial biomass and EPS applications: (a) Physical soil function index (PSFI), calculated from normalized soil moisture, soil porosity, and inverse bulk density; (b) Chemical soil function index (CSFI), calculated from normalized available Fe and cation exchange capacity (CEC). All index values are expressed relative to the deionized water (DI) control (set to 1.0). The horizontal line represents the control baseline (DI = 1.0).
Crops 06 00040 g008
Disclaimer/Publisher’s Note: The statements, opinions and data contained in all publications are solely those of the individual author(s) and contributor(s) and not of MDPI and/or the editor(s). MDPI and/or the editor(s) disclaim responsibility for any injury to people or property resulting from any ideas, methods, instructions or products referred to in the content.