Article

Grapevine Response to Pyroligneous Acid: Antifungal, Physiological, and Biochemical Impacts

Department of Plant, Food, and Environmental Sciences, Faculty of Agriculture, Dalhousie University, 50 Pictou Road, Truro, NS B2N 5E3, Canada
*
Authors to whom correspondence should be addressed.
Crops 2025, 5(2), 21; https://doi.org/10.3390/crops5020021
Submission received: 24 February 2025 / Revised: 21 March 2025 / Accepted: 31 March 2025 / Published: 10 April 2025

Abstract

:
Botrytis cinerea is a major fungal pathogen causing significant economic losses in grapevines worldwide. To address the environmental concerns associated with overreliance on synthetic fungicides, this study investigated the antifungal efficacy of varying concentrations of pyroligneous acid (PA) (0, 2, and 4%) compared to a commercial fungicide (Switch®) against B. cinerea in grapevines (Vitis vinifera ‘Himrod’), as well as its physiological and biochemical responses. Our preliminary in vitro assays using the poisoned food method showed that PA significantly (p < 0.05) inhibited B. cinerea mycelial growth by approximately 0.70-, and 1-fold, respectively, compared to the 0% PA during the three weeks of observation. The results also demonstrated that the 2% PA and 4% PA treatments, as well as the Switch® application, significantly (p < 0.05) reduced average lesion length by 0.19-, 0.52-, and 0.85-fold, respectively, compared to the untreated plants with Botrytis alone. Both the 4% PA and Switch® significantly (p < 0.05) increased the maximum quantum efficiency of photosystems II (Fv/Fm) and potential photosynthetic capacity (Fv/Fo) by approximately 0.02-fold and 0.1-fold, respectively, compared to the untreated plants with Botrytis alone. The 2 and 4% PA treatments also increased total carotenoids and flavonoids. Further molecular studies are recommended to elucidate the mechanisms underlying the observed physiological and biochemical changes.

1. Introduction

A wide array of pathogenic organisms can inflict devastating diseases on crops, resulting in severe economic losses [1] estimated at 20 to 40% of crop production. These crop losses can reach approximately USD 40 billion per year worldwide [2]. Among these pathogens, fungi represent some of the greatest biotic challenges facing global agriculture [3]. Among these pathogens, Botrytis cinerea is one of the most notable fungi pathogens causing severe economic losses due to its ability to infect and colonize a diverse range of crops [4,5]. The economic impact of B. cinerea is staggering, with estimated annual losses ranging from USD 10 to 100 billion worldwide [6,7]. This pathogen poses a serious threat to the health and productivity of over 1400 plant species, causing a devastating mold disease [8,9]. The pathogen’s host range is extensive, affecting both ornamental and food crops. High-value ornamental flowers such as roses (Rosa rubiginosa) and gerbera (Gerbera jamesonii), as well as economically important fruit and vegetable crops such as tomatoes (Solanum lycopersicum), grapevines, and strawberries (Fragaria × ananassa), are particularly susceptible [10]. B. cinerea’s infection strategy is versatile. It can directly penetrate intact host leaf surfaces like the cuticle or enter through natural openings such as stomata, wounds, and previously infected sites [11]. The fungus thrives in wet and damp conditions, which are necessary for its conidia to germinate and initiate infection [12]. Once established in agricultural fields, B. cinerea becomes particularly challenging to control due to its ability to produce long-lasting sclerotia, which serve as survival structures in adverse conditions [13]. While fungicide application has traditionally been an effective control method, it has raised significant concerns. The environmental impact of these chemicals and the increasing development of fungicide-resistant strains have prompted a search for alternative control strategies [13]. Researchers are exploring various alternatives to reduce or eliminate the use of synthetic chemicals in controlling B. cinerea. One of the promising approaches involves the use of pyroligneous acid (PA), a natural compound with antifungal properties [14].
Pyroligneous acid (PA), also known as wood vinegar, is a crude reddish-brown liquid by-product of pyrolysis of plant biomass under high temperatures and limited oxygen supply [15,16]. During pyrolysis, the organic material is converted into biochar, charcoal, and organic vapor (smoke), which is then condensed to form PA as a by-product [15]. Chemical analysis has shown that PA consists primarily of 80 to 90% of water and more than 200 organic compounds comprising 10 to 20% organic acids, ester, alcohol, phenolic, and alkene [15,17]. Among these organic compounds, acetic acid represents about 1.5% of PA [18], which contributes to its low pH of less than 3, while phenolic compounds contribute to its smoky odor [15,18,19]. The nature and the chemical composition of PA depend on the feedstock, particle size, residence time, temperature, and heating rate [15].
Several studies have demonstrated that PA induces beneficial antimicrobial effects on various plant diseases. For instance, PA has been shown to inhibit the growth of numerous strains of fungi, including Fomitopsis palustris, Trametes versicolor [20], Alternaria mali, Rhizoctonia solani, Sclerotium oryzae, Helminthosporium maydis, Pythium sp., Colletotrichum gloeosporioides, and Choanephora cucurbitarum [15,21,22]. Specifically, PA has potential in controlling B. cinerea [14]. It has been studied in grape fruits [23] and apple fruits [24], with these studies mainly reporting PA inhibition of mycelium growth of B. cinerea using plate assays. However, there is limited research on its application to grapevines specifically for controlling B. cinerea strains in growing leaf tissues. Transitioning from plate-based assays to the use of living plant tissues is indispensable, as it can provide more accurate and ecologically relevant results, especially for understanding how B. cinerea behaves in a more natural environment. This study aims to address this knowledge gap by investigating the effects of PA on B. cinerea in grapevine plants. Furthermore, the research determines appropriate PA application rates and examines the physiological and biochemical responses of grapevines to both B. cinerea infection and PA treatment. By exploring these aspects, this study provides valuable insights into using PA as a potential method for managing B. cinerea infections in grapevine cultivation, contributing to the development of more sustainable disease management strategies in viticulture.

2. Materials and Methods

2.1. Study Area

The experiment was conducted in the Department of Plant, Food, and Environmental Sciences, Faculty of Agriculture, Dalhousie University, Truro, Canada, between February 2023 and June 2024.

2.2. Pyroligneous Acid (PA)

The PA used in this study was produced from white pine (Pinus strobus) biomass using fast pyrolysis technology developed by Proton Power Inc. (Lenoir City, TN, USA). The detailed description of the process and composition of the PA were described well by Ofoe et al. [25]. In brief, the chemical profile of the PA was 2.3 pH, 1.03 g/L salt content, 1.42 g/L total dissolved solid content, 2.05 mS/cm electrical conductivity, and 9.35 °Brix. Chemical analysis revealed high concentrations of bioactive compounds, including 95.81 mg Gallic Acid Equivalent (GAE)/mL of total phenolic, 49.46 μg quercetin/mL of total flavonoids, and a 2,2-Diphenyl-1-picrylhydrazyl (DPPH) radical scavenging activity of 78.5%. Metabolite profiling revealed 156 distinct compounds categorized into organic acids, hexose, carnitine, and derivatives of phospholipids. Additionally, the PA was found to contain 33 different mineral elements [25].

2.3. Origin and Maintenance of Fungal Strain

The B. cinerea isolate DAOMC155189 was obtained from Canadian Collection of Fungal Cultures. The isolate was sub-cultured onto potato dextrose agar (PDA) and incubated at 27 °C for 14 days. The PDA medium was prepared by combining 24g/L potato dextrose broth and 15g/L agar (both from BioShop®, Burlington, ON, Canada) in 1 L distilled water and autoclaved.

2.4. Plant Materials

Thirty-two-week-old grape (Vitis vinifera ‘Himrod’) seedlings were produced from stem cuttings of mother plants obtained from Gray’s Greenhouse in Antigonish, Nova Scotia, Canada. The seedlings were planted in 2.84 L pots filled with Pro-Mix® BX (Premier Tech Horticulture, Québec City, QC, Canada) soilless growing media.
These seedlings were raised under greenhouse conditions with day/night temperatures of 22 °C/15 °C and 70% relative humidity. A 16 h photoperiod was maintained and supplemented by a 600 W HS2000 high-pressure sodium lamp with NAH600.579 ballast (P.L. Light Systems, Beamsville, ON, Canada). Fertigation was performed using compound fertilizer nitrogen–phosphorus–potassium (NPK 20-20-20) Miracle-Gro® (Scotts Canada Ltd., Mississauga, ON, Canada.) and applied following the manufacturer’s recommended application rate of 6 mL/L at 14-day intervals. All plants were watered regularly to field capacity until they were ready for use in the study.

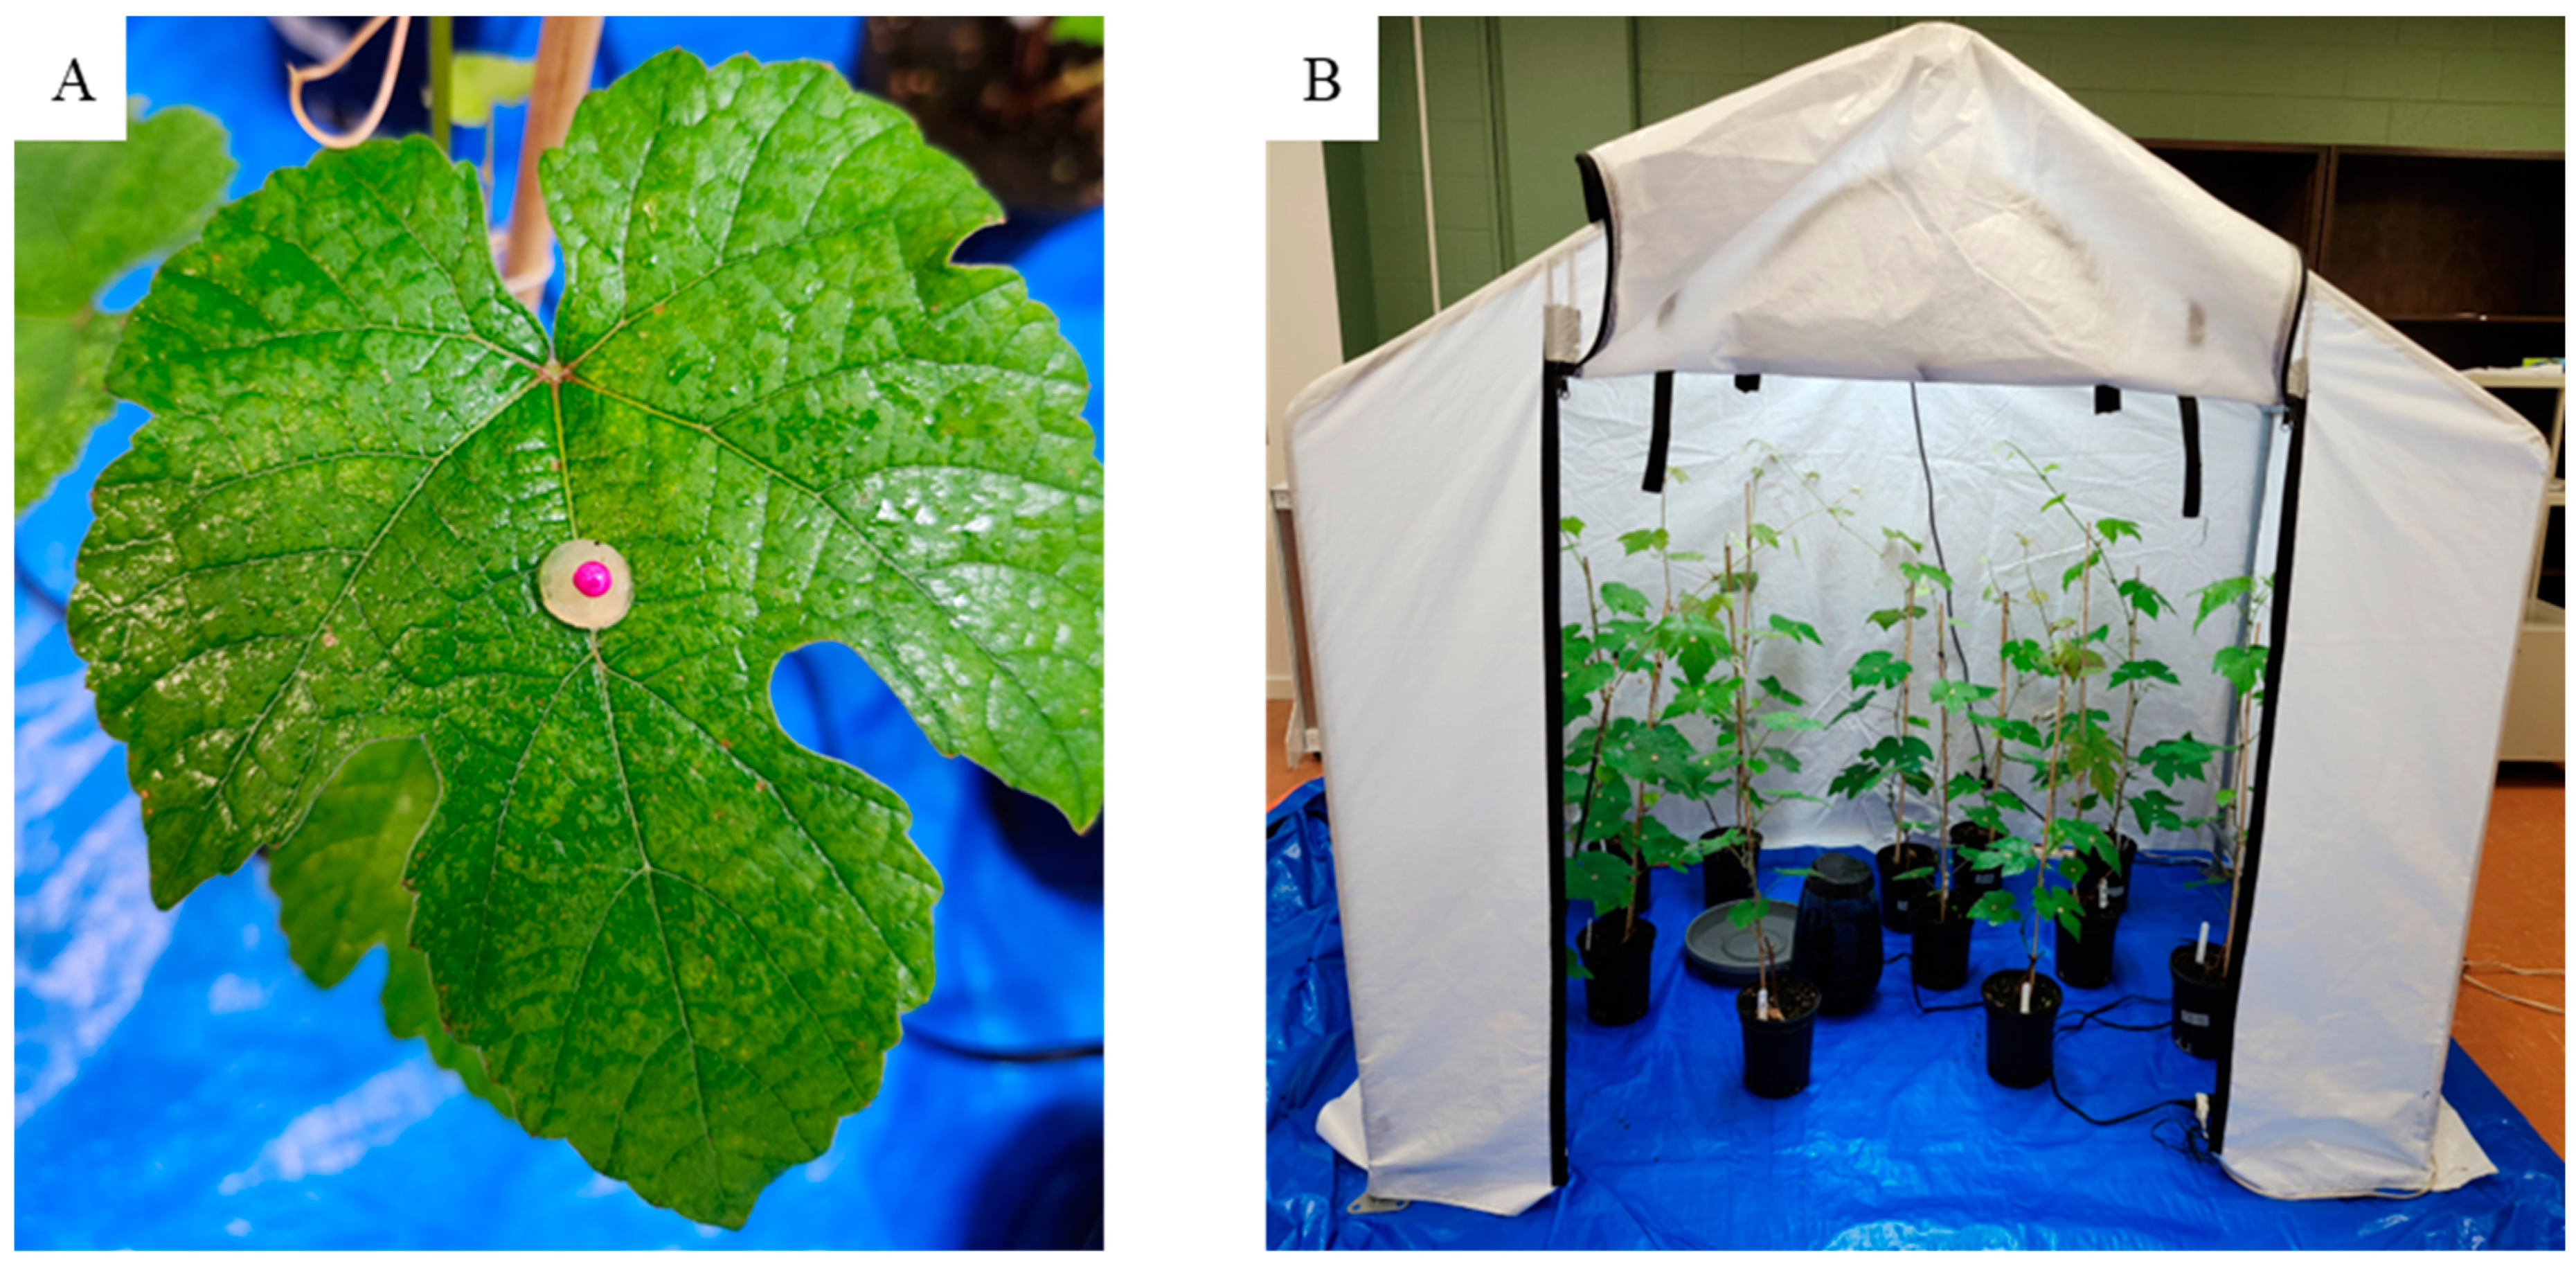
2.5. In Vivo Antifungal Activity Assay

The grape seedlings were treated with PA concentrations of 0%, 2%, and 4%, as well as a commercial fungicide (Switch®) (Syngenta Canada Inc, Guelph, Ontario, Canada) at the manufacturer’s recommended rate. A PDA plug assay was performed following the method of Kirkby et al. [26]. In brief, the treatments were PDA plugs alone (T1), untreated plants with Botrytis alone (T2), 2% PA-treated plants with Botrytis (T3), 4% PA-treated plants with Botrytis (T4), and Switch®-treated plants with Botrytis (T5). Each treatment, including various PA concentrations, the recommended fungicide rate (positive control), and water (negative control), was applied to the plants using a pressure sprayer (China made). Approximately 500 mL of each treatment was sprayed on the leaves from a distance of about 20 to 30 cm while the researchers wore personal protective equipment. The plants were then left for 24 h before inoculation.
The experimental setup included three plants for each treatment. Five leaves per plant were inoculated using either 7 mm PDA plugs (for control) or B. cinerea fungal plugs for the fungal inoculation. The plugs were held in place using sterilized pins (Figure 1A). The entire experiment was conducted in a tent chamber (Figure 1B) under controlled conditions with a 16/8 h photoperiod at 15° to 20 °C.
After 4 days, the progression of the disease was assessed by measuring the length of diseased lesions that had spread beyond the mycelial plugs with a digital Vernier caliper (Mastercraft, ON, Canada). This study was repeated twice.

2.6. Plant Physiological Analysis

Physiological parameters were examined seven days post-inoculation. Leaf greenness was used to estimate chlorophyll content on the five inoculated leaves per plant using a SPAD 502-plus chlorophyll meter (Spectrum Technologies Inc., Aurora, IL, USA). Chlorophyll fluorescence parameters i.e., maximum quantum efficiency (Fv/Fm) and potential photosynthetic capacity of photosystems II (Fv/Fo), were assessed on the same leaves with a Chlorophyll fluorometer(Opti-Sciences, Inc., Hudson, NY, USA). In addition, photosynthetic parameters, including net photosynthetic rate (μmol m−2 s−1), transpiration rate (mol m−2 s−1), intracellular carbon dioxide concentration (μmol mol−1), and stomatal conductance (mol m−2 s−1), were assessed from the same five leaves using an LCi portable photosynthesis system (ADC Bioscientific Ltd., Hoddesdon, UK), following the manufacturer’s protocol.

2.7. Biochemical Analysis

On the seventh day post-inoculation, the inoculated leaves were sampled and immediately frozen in liquid nitrogen. The frozen samples were ground into fine powder and stored in a −80 °C freezer for further biochemical analysis.

2.7.1. Chlorophylls and Carotenoids

Chlorophylls (a and b) and carotenoids were extracted from 0.2 g of leaf tissue using 80% acetone a method described by Linchtenthaler [27] and adopted by Nutsukpo et al. [28], with some modifications. The mixture was vortexed and centrifuged, and the supernatant’s absorbance was measured at 646.8 nm, 663.2 nm, and 470 nm. Chlorophyll concentrations were calculated using specific formulas, while carotenoid content was determined using absorbance at 470 nm. The results were expressed as µg/g fresh weight (FW).

2.7.2. Total Phenolics

Total phenolic content (TPC) was assessed using the Folin–Ciocalteu method described by Ainsworth and Gillespie [29] and adopted by Ofori [30], with slight modifications. Leaf tissue (0.2 g) was homogenized in 95% methanol, incubated for 48 h, and centrifuged. The supernatant was mixed with the Folin–Ciocalteu reagent and sodium carbonate, and absorbance was measured at 765 nm. TPC was quantified using a gallic acid standard curve and expressed as mg gallic acid equivalents (GAE)/g FW.

2.7.3. Total Flavonoid

Flavonoid content was determined by homogenizing 0.2 g of leaf tissue in 95% methanol, followed by centrifugation, a method described by Chang et al. [31] and adopted by Nutsukpo et al. [32], with some modifications. The supernatant was mixed with aluminum chloride, potassium acetate, and distilled water, and absorbance was measured at 415 nm. Flavonoid levels were calculated using a quercetin standard curve and expressed as µg quercetin/g FW.

2.7.4. Total Sugar

Total sugar was quantified using the phenol-sulfuric acid procedure, as described by Dubois et al. [33] and adopted by Negassa et al. [34], with small modifications. Leaf tissue (0.2 g) was extracted with 90% ethanol, incubated at 60 °C, and centrifuged. The supernatant was mixed with phenol and sulfuric acid, and absorbance was measured at 490 nm. Sugar content was determined using a glucose standard curve and expressed as µg glucose/g FW.

2.7.5. Lipid Peroxidation and Hydrogen Peroxide

Lipid peroxidation was measured by quantifying malondialdehyde (MDA) using thiobarbituric acid (TBA). Leaf tissue (0.2 g) was homogenized in trichloroacetic acid (TCA), centrifuged, and mixed with TBA. Absorbance was measured at 532 nm and 600 nm, and MDA concentration was calculated. Hydrogen peroxide (H2O2) levels were determined by homogenizing leaf tissue in TCA, centrifuging, and reacting the supernatant with potassium iodide. Absorbance was measured at 390 nm, and H2O2 levels were quantified using a standard curve [35,36].

2.7.6. Total Protein and Peroxidase Enzyme Activity

Total protein was extracted from 0.2 g of leaf tissue using a phosphate buffer, centrifuged, and mixed with a Bradford reagent. Absorbance was measured at 595 nm, and protein content was calculated using a bovine serum albumin (BSA) standard curve. Peroxidase (POD) activity was determined by reacting crude enzyme extract with pyrogallol and H2O2. Absorbance was measured at 420 nm, and activity was expressed in units based on purpurogallin formation [37,38].

2.8. Data Analysis

Data were analyzed using one-way ANOVA, Tukey’s post hoc test, bivariate correlation, and principal component analysis (PCA) with Minitab version 21 (Minitab, Inc., State College, PA, USA), XLSTAT version 2022.3 (Addinsoft, New York, NY, USA), GraphPad Prism 9.5.0 (GraphPad Software, San Diego, CA, USA), and Microsoft Excel. Significance was set at p ≤ 0.05.

3. Results

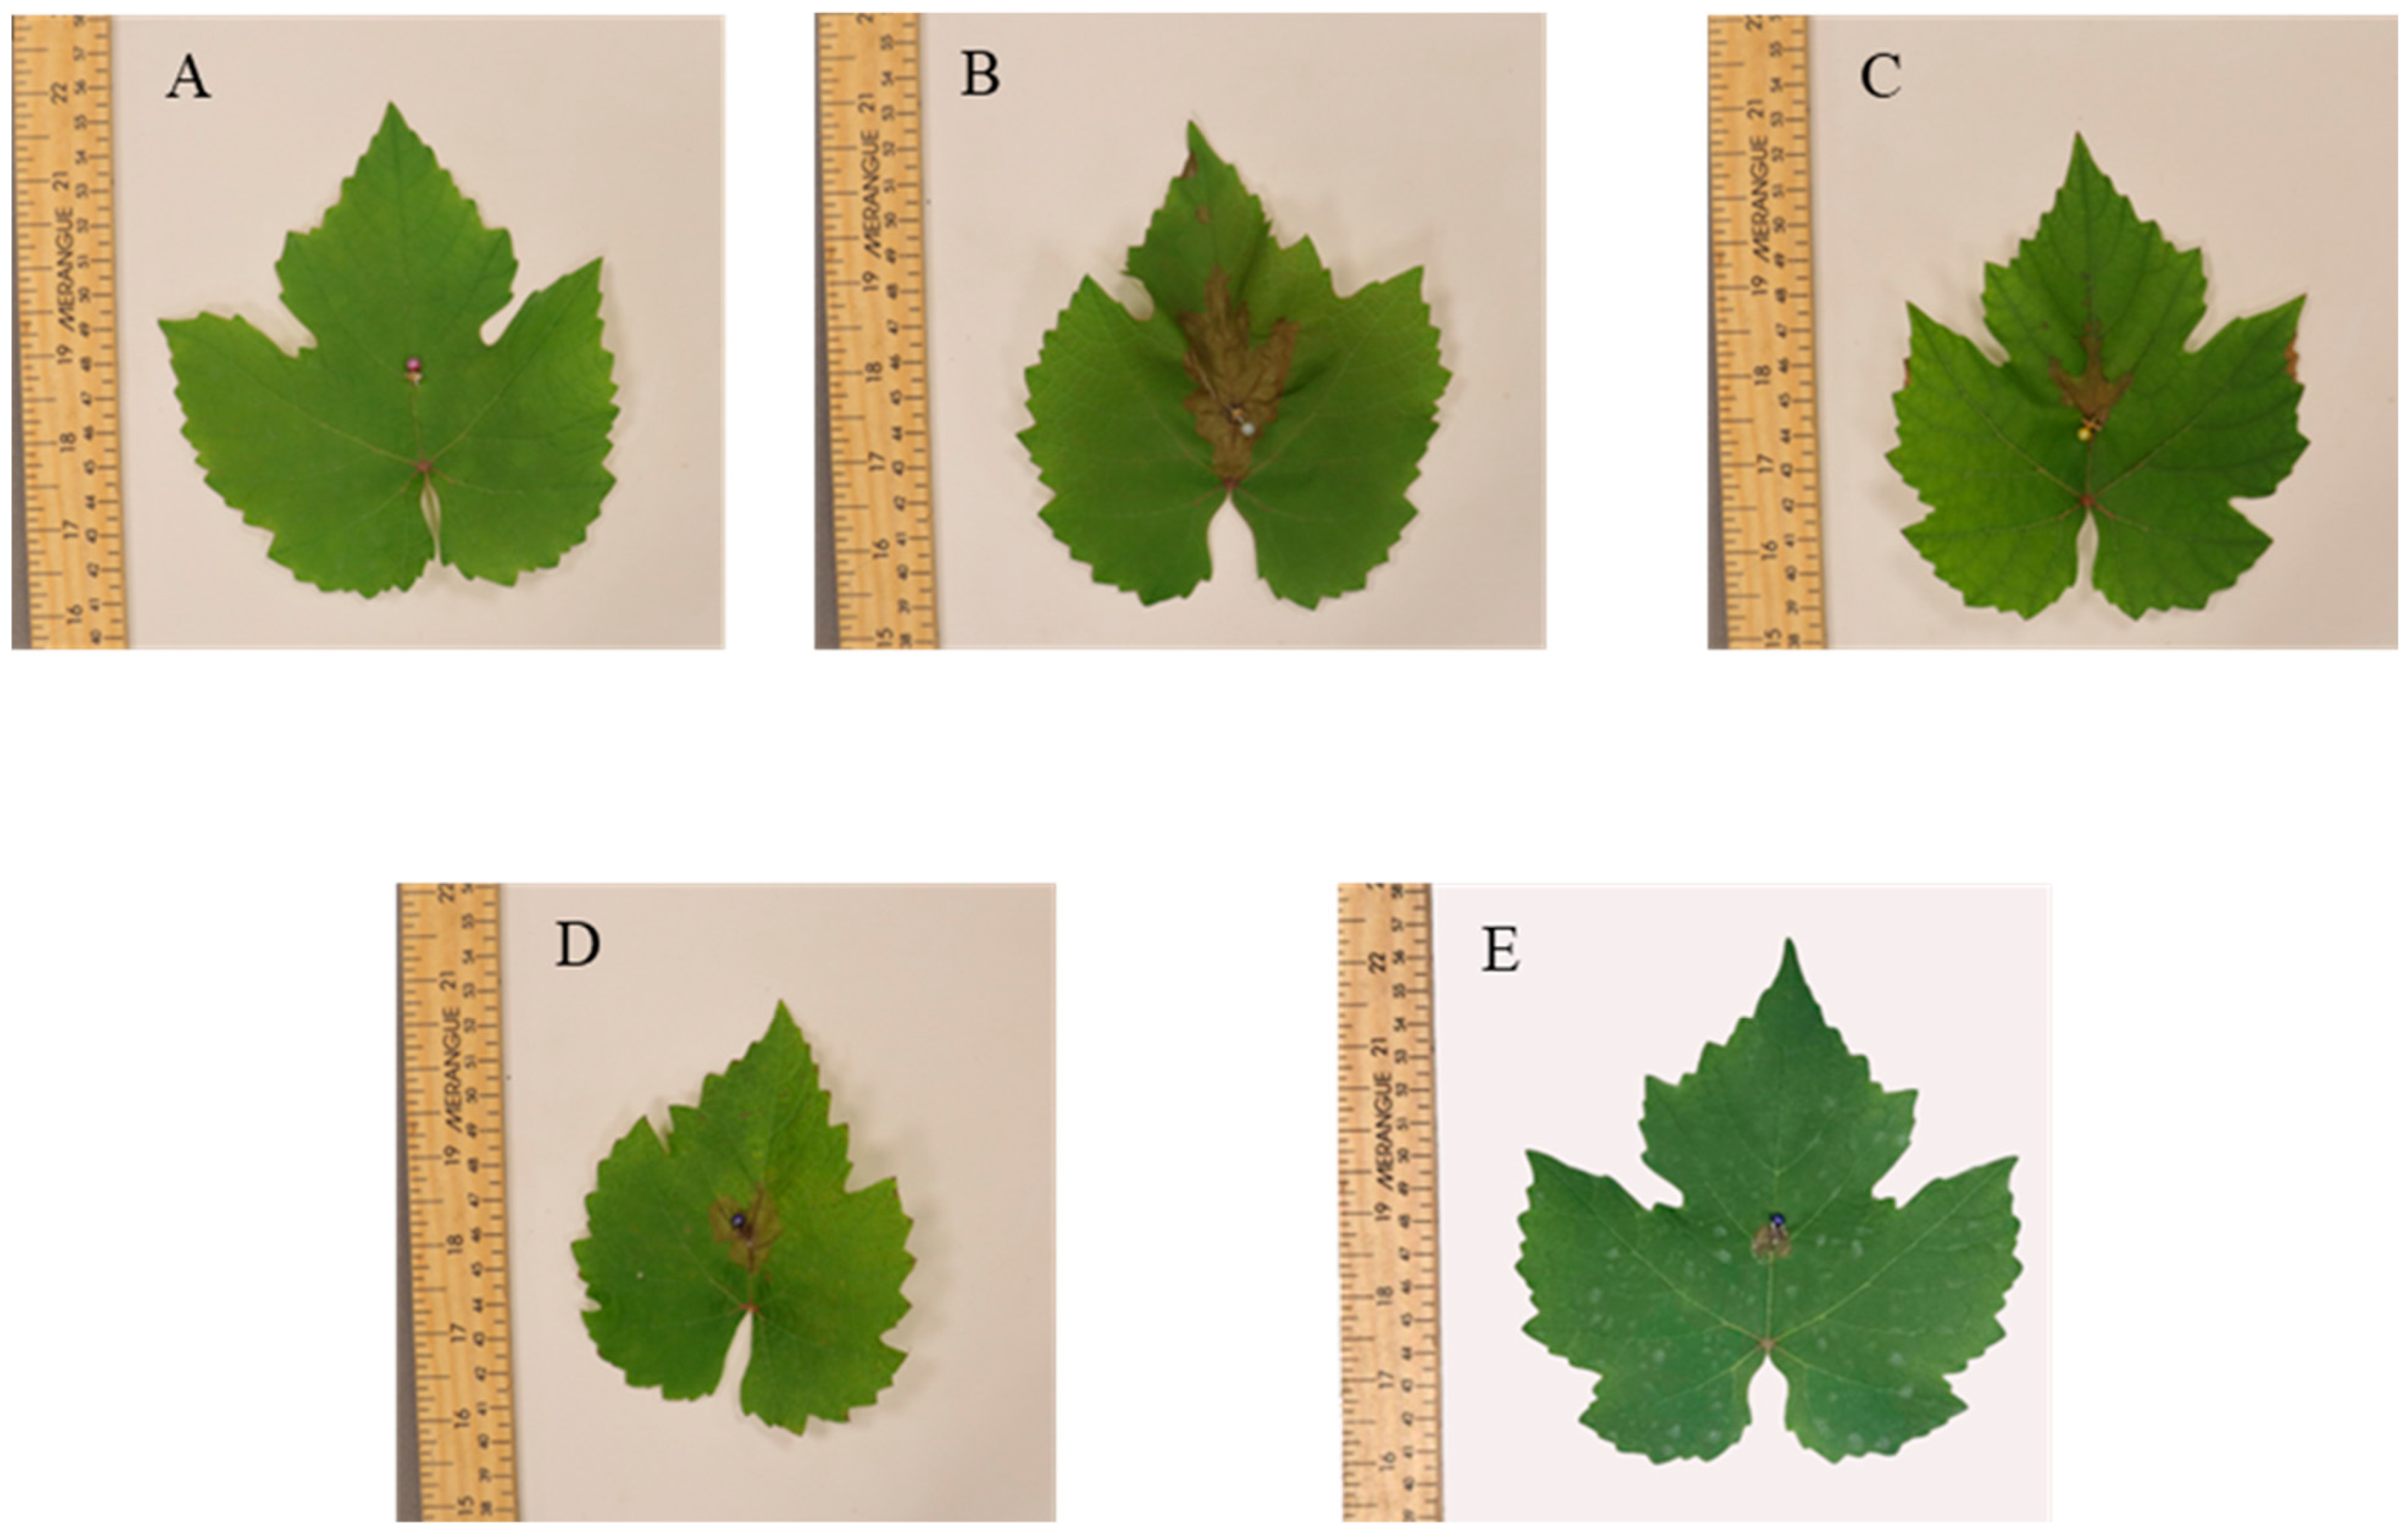
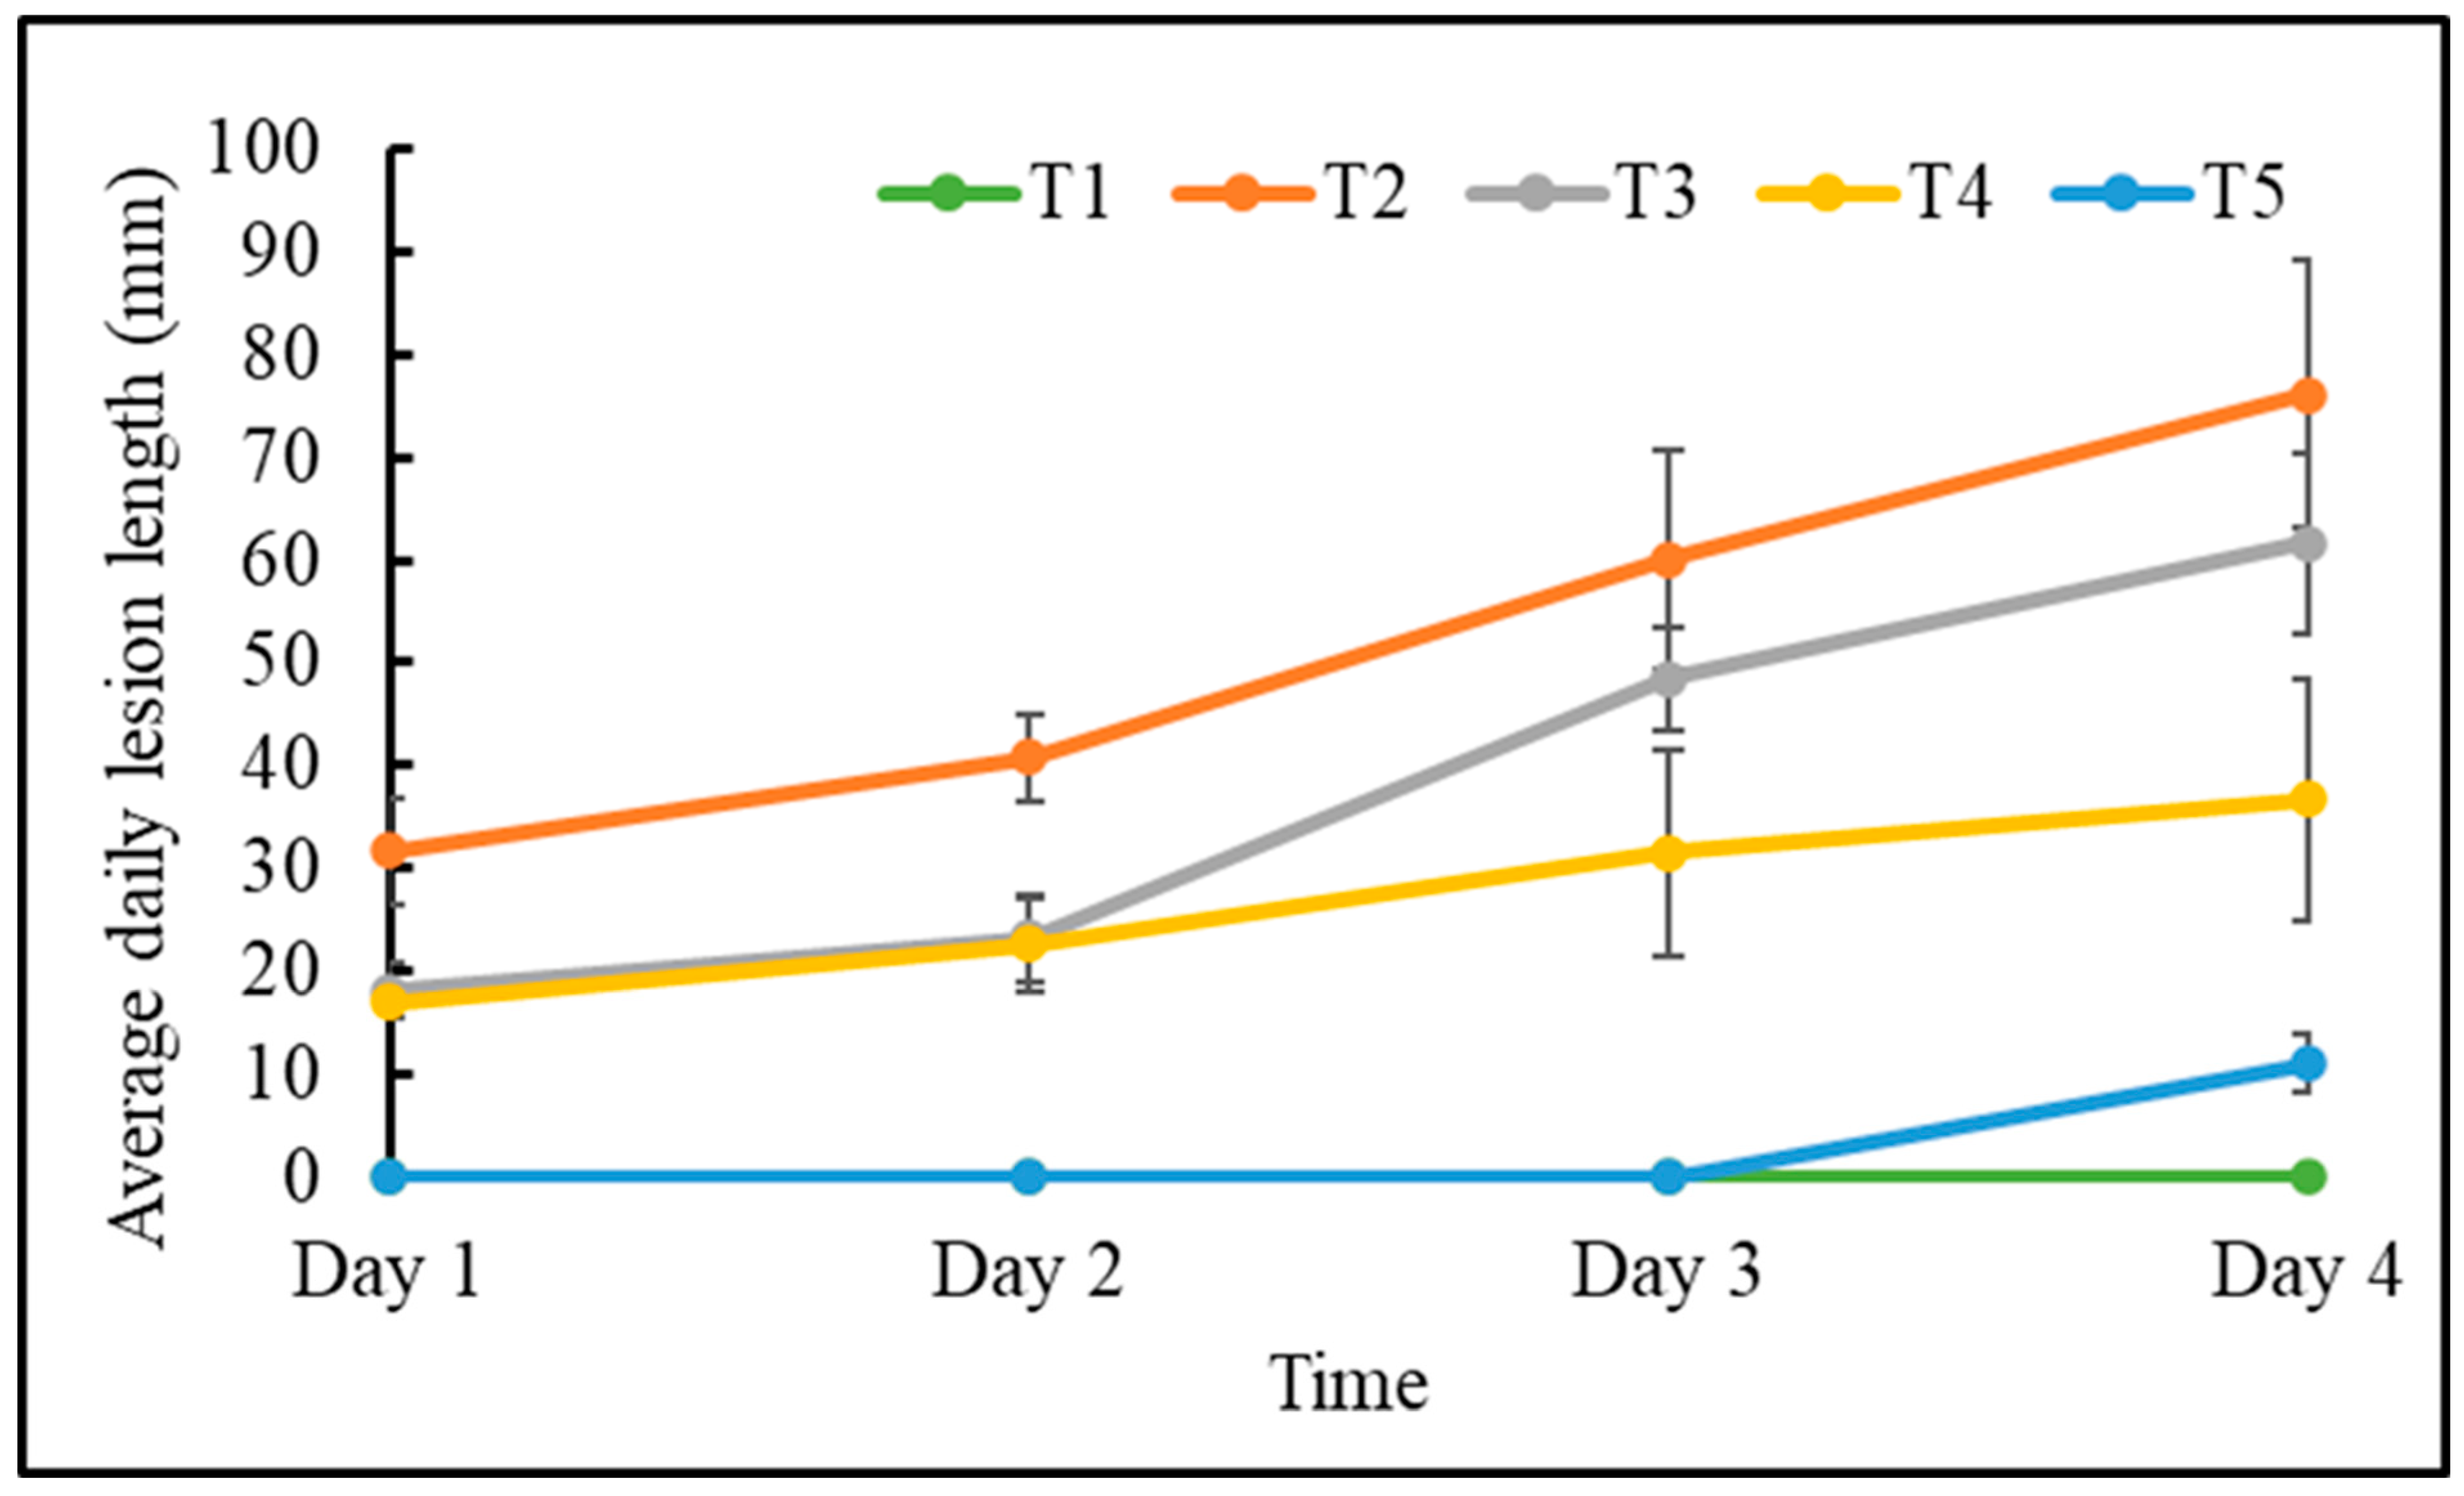
3.1. Botrytis cinerea Necrosis

The leaves of the grape plants did not show necrotic symptoms for the first three days post B. cinerea inoculation. On the fourth day post inoculation (dpi), initial dark-brownish necroses were observed, which increased in size at 5 to 7 dpi (Figure 2).
It was observed that the PDA plugs alone developed no necrotic symptoms (Figure 2A). The 2% and 4% PA-treated plants developed necrotic symptoms, which continued to grow with time (Figure 2C,D), but the symptoms were more severe in Botrytis alone (Figure 2B). The Switch®-treated plants developed very small lesions (Figure 2E).
Figure 3 showed the trend of B. cinerea lesion progression according to the various treatments over time. Here, the impact of PA against the lesion development of B. cinerea compared to the controls was checked on a daily basis.
Botrytis alone showed significantly (p < 0.05) higher average daily lesion length throughout the study, followed by 2% PA, 4% PA, and the Switch®-treated plants. The PDA plugs alone had no lesions throughout the study (Figure 3).

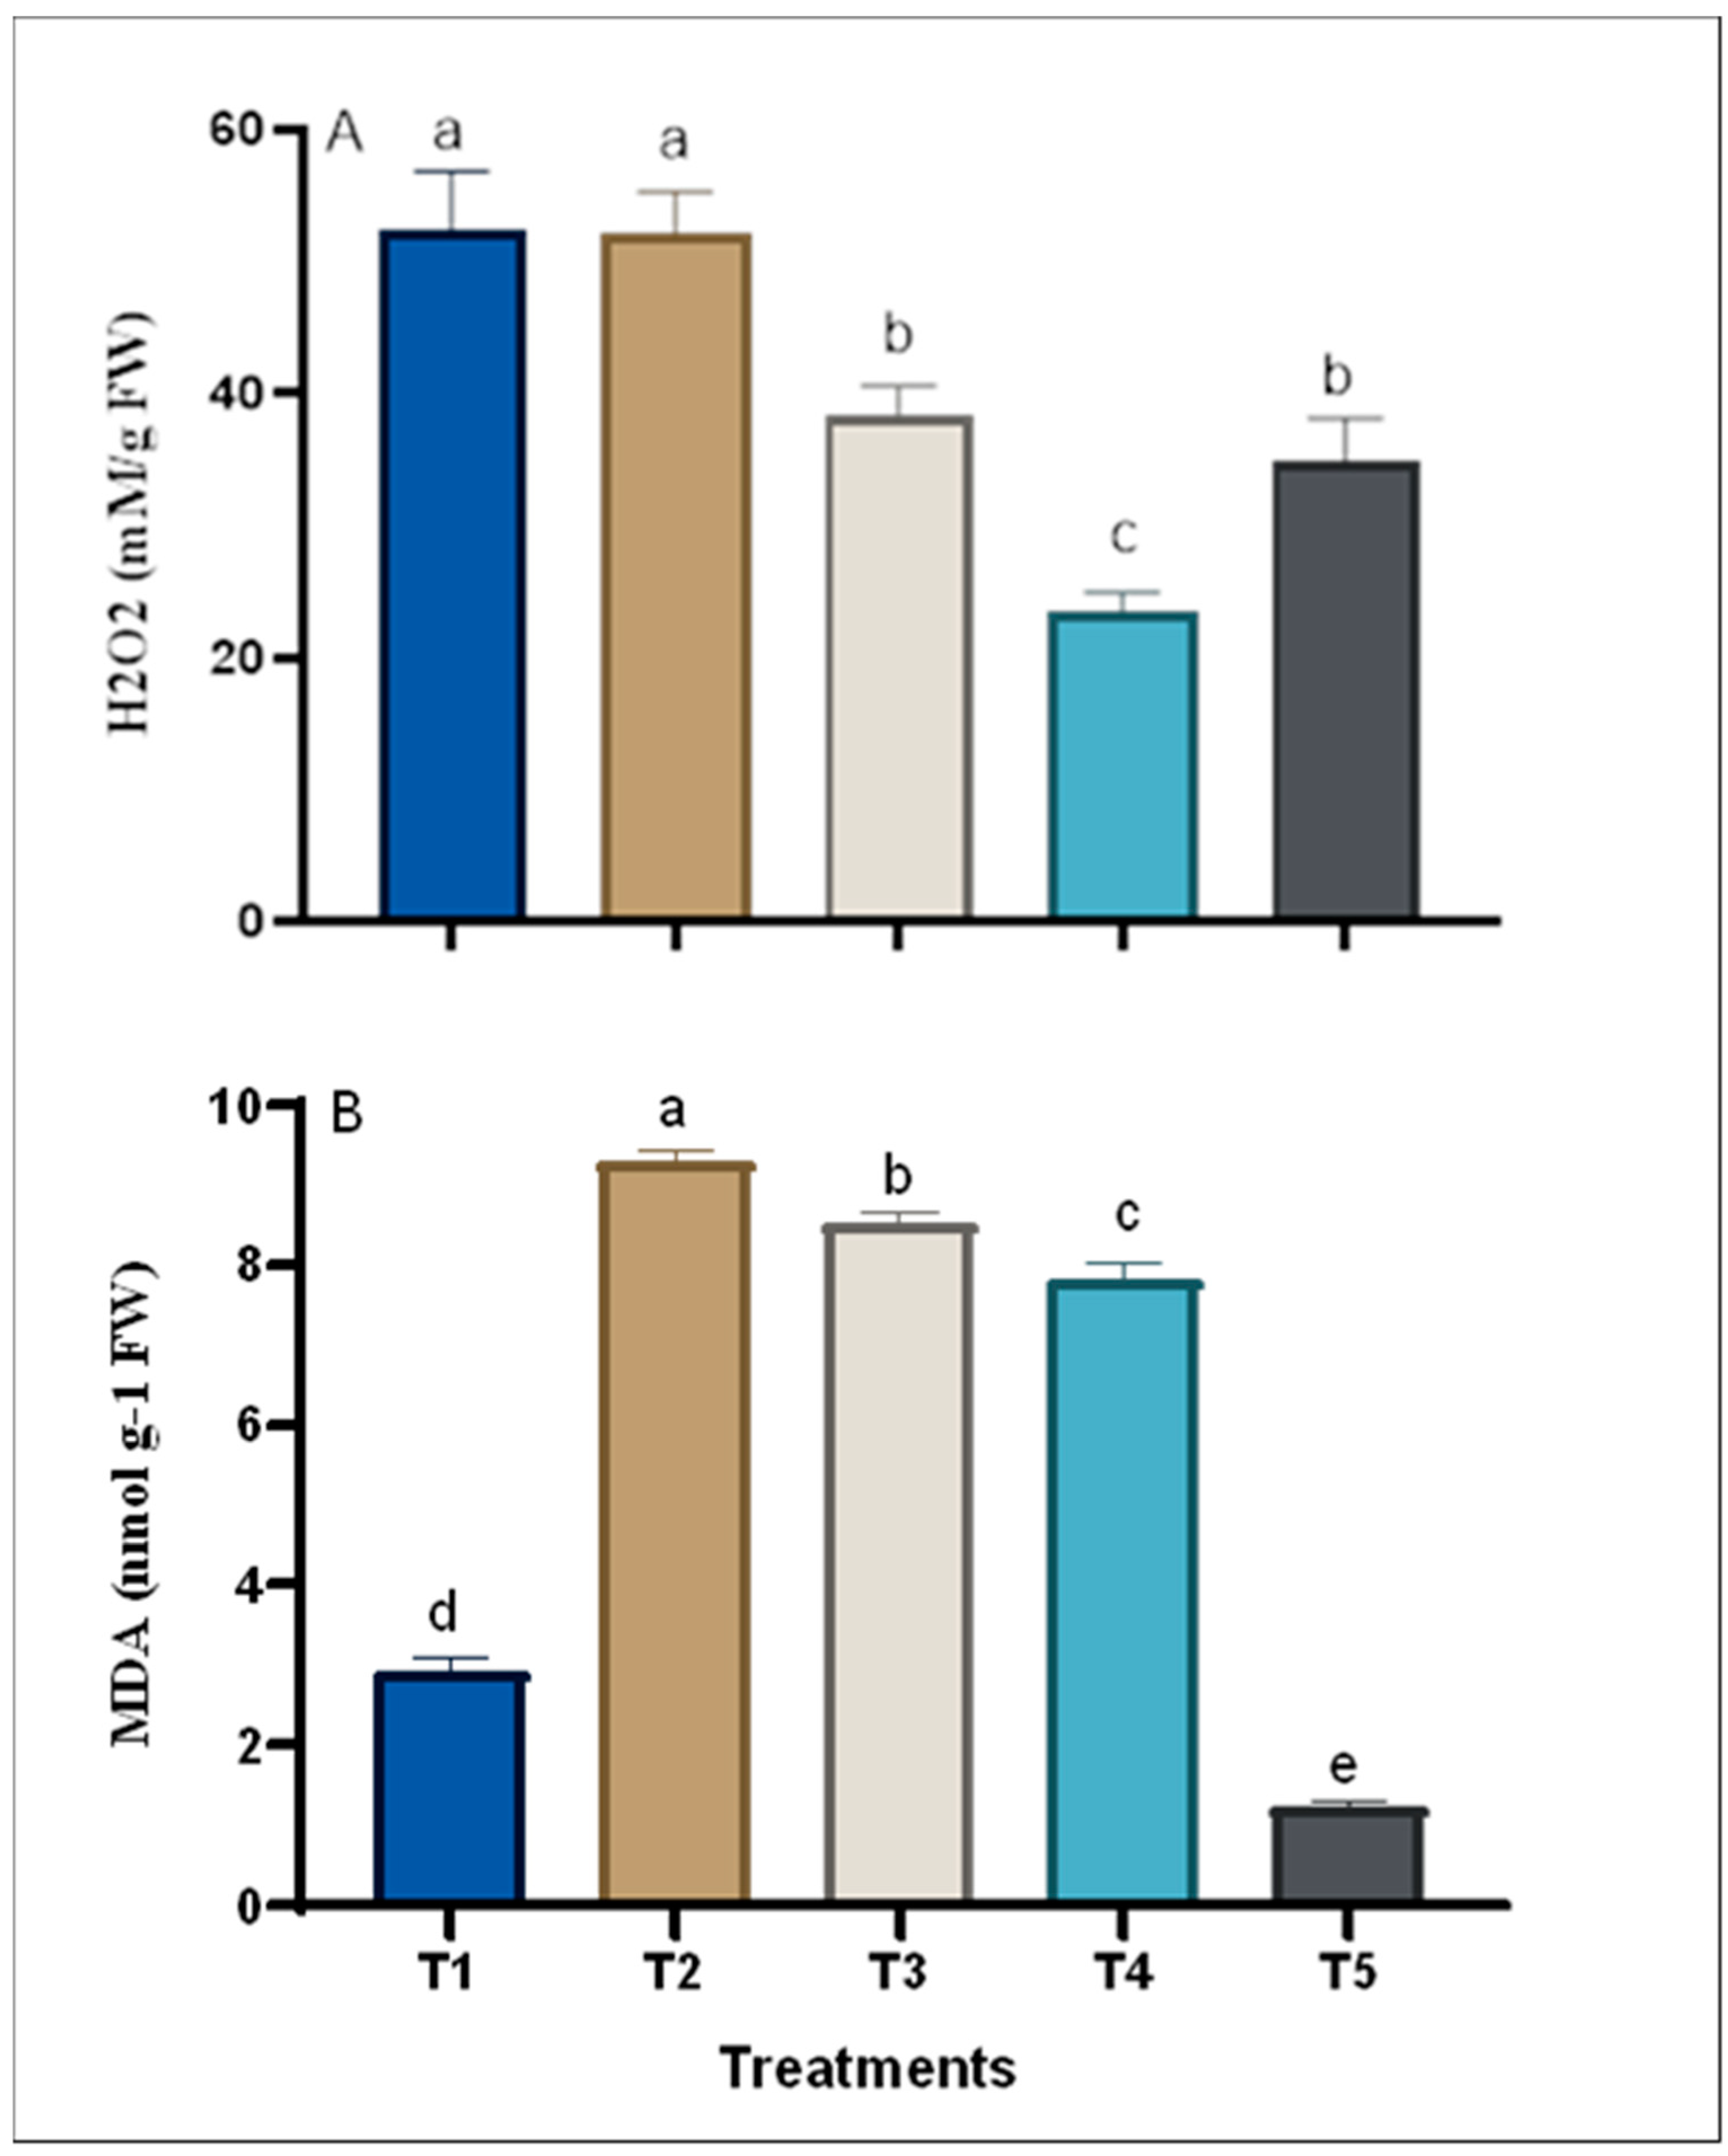
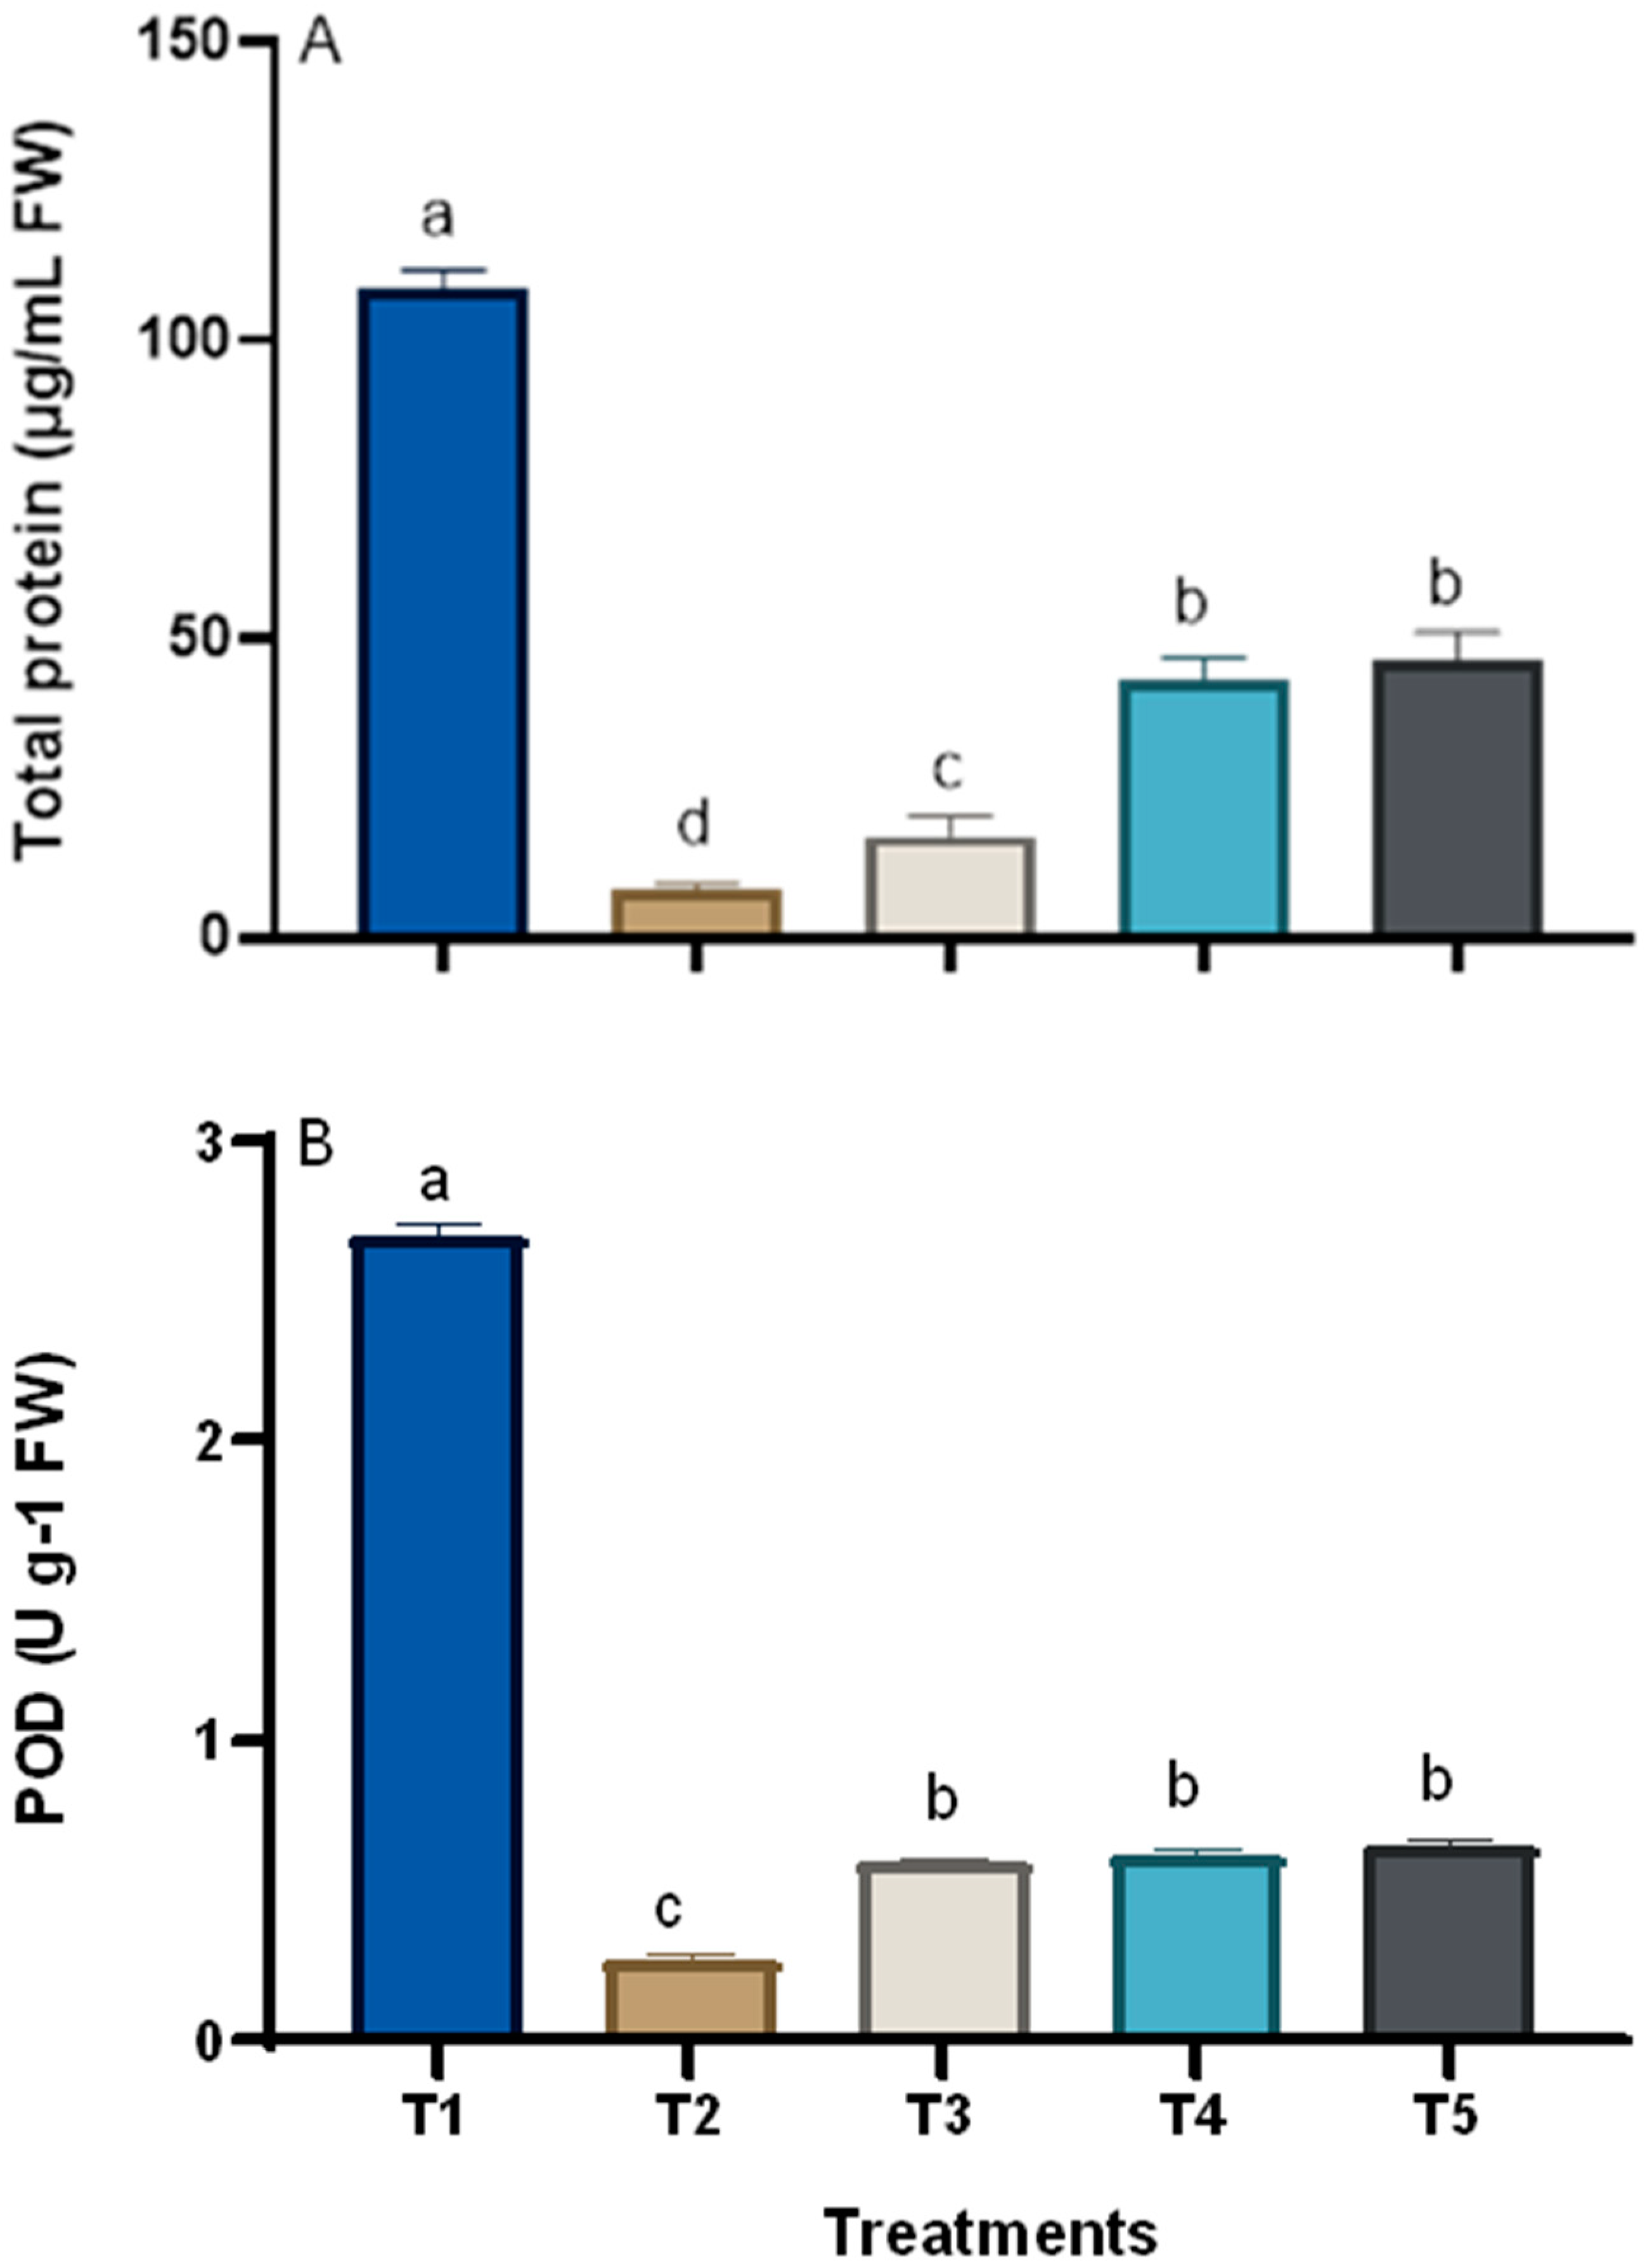
3.2. Physiological Response of Grape Plants to PA Application and B. cinerea Inoculation

To further confirm the response of the grape seedlings to the application of PA and B. cinerea inoculation, we measured the plant physiological parameters. In general, the PDA plugs alone had significantly (p < 0.05) the highest maximum quantum efficiency of photosystems II (PSII) (Fv/Fm), potential photosynthetic capacity (Fv/Fo), photosynthetic rate, transpiration rate, and stomatal conductance (Table 1). It was observed that the 4% PA and Switch® with Botrytis showed a non-significant (p > 0.05) increase in chlorophyll content, while the 2% PA with Botrytis showed a non-significant (p > 0.05) reduction in chlorophyll content of the leaves compared to Botrytis alone (Table 1).
The results also showed that treatments 4% PA and Switch® with Botrytis significantly (p < 0.05) improved maximum quantum efficiency (Fv/Fm) by approximately 0.02-folds each compared to Botrytis alone. The 4% PA and Switch® with Botrytis significantly (p < 0.05) increased potential photosynthetic capacity (Fv/Fo) by approximately 0.09- and 0.12-folds compared to Botrytis alone.

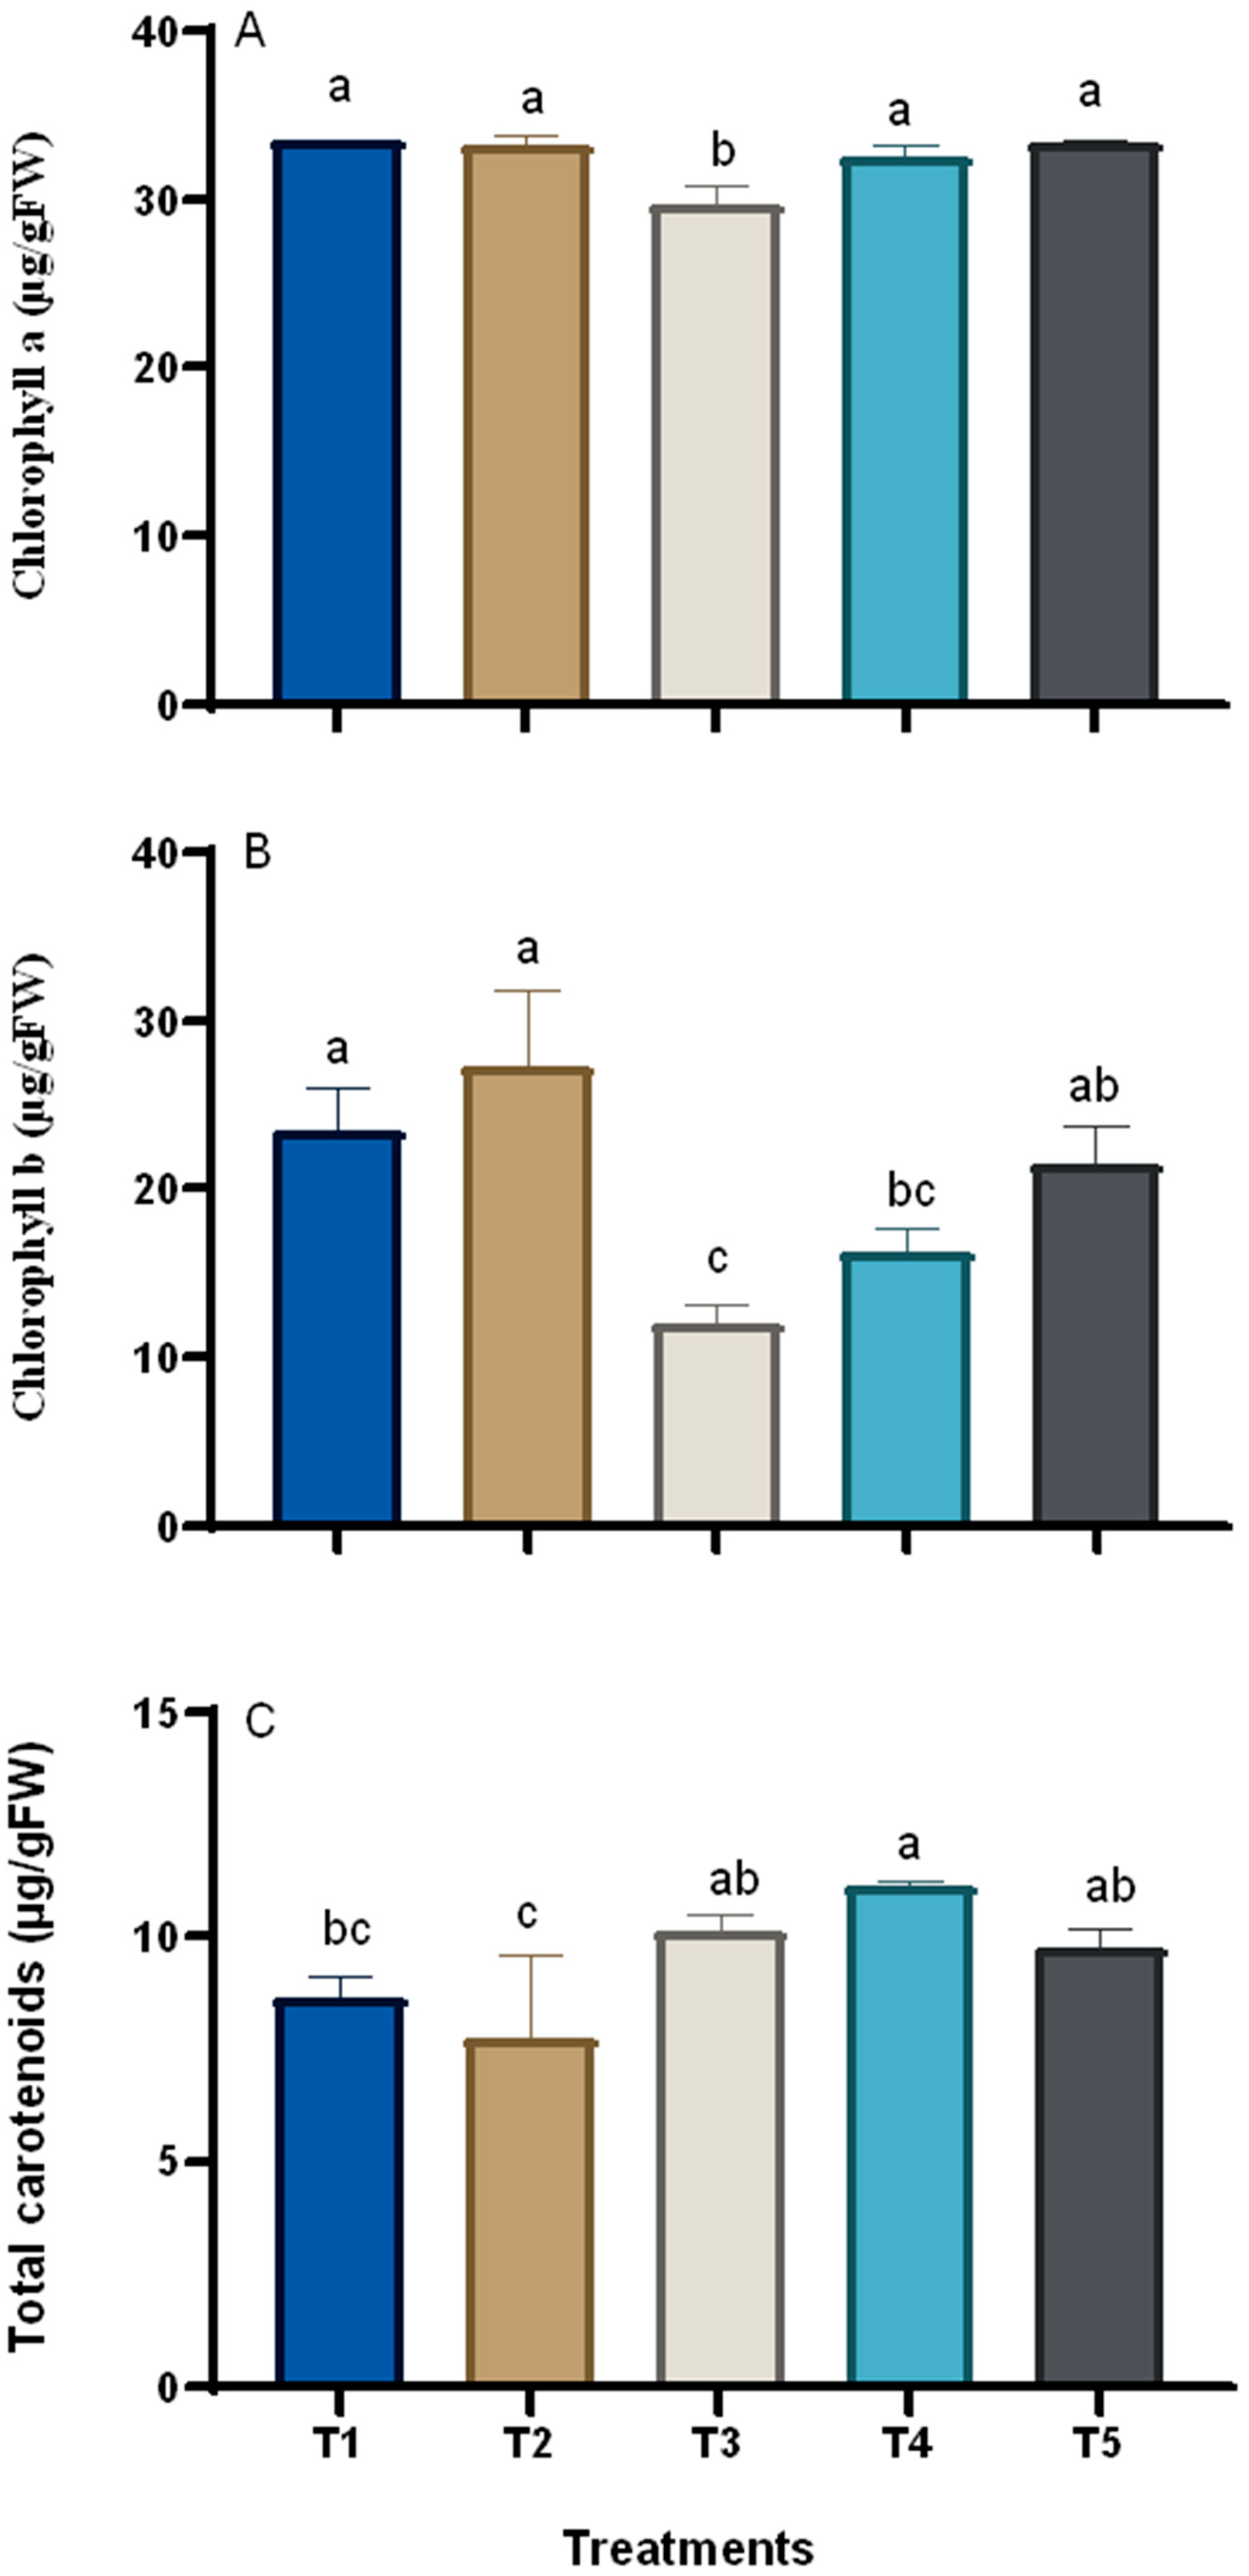
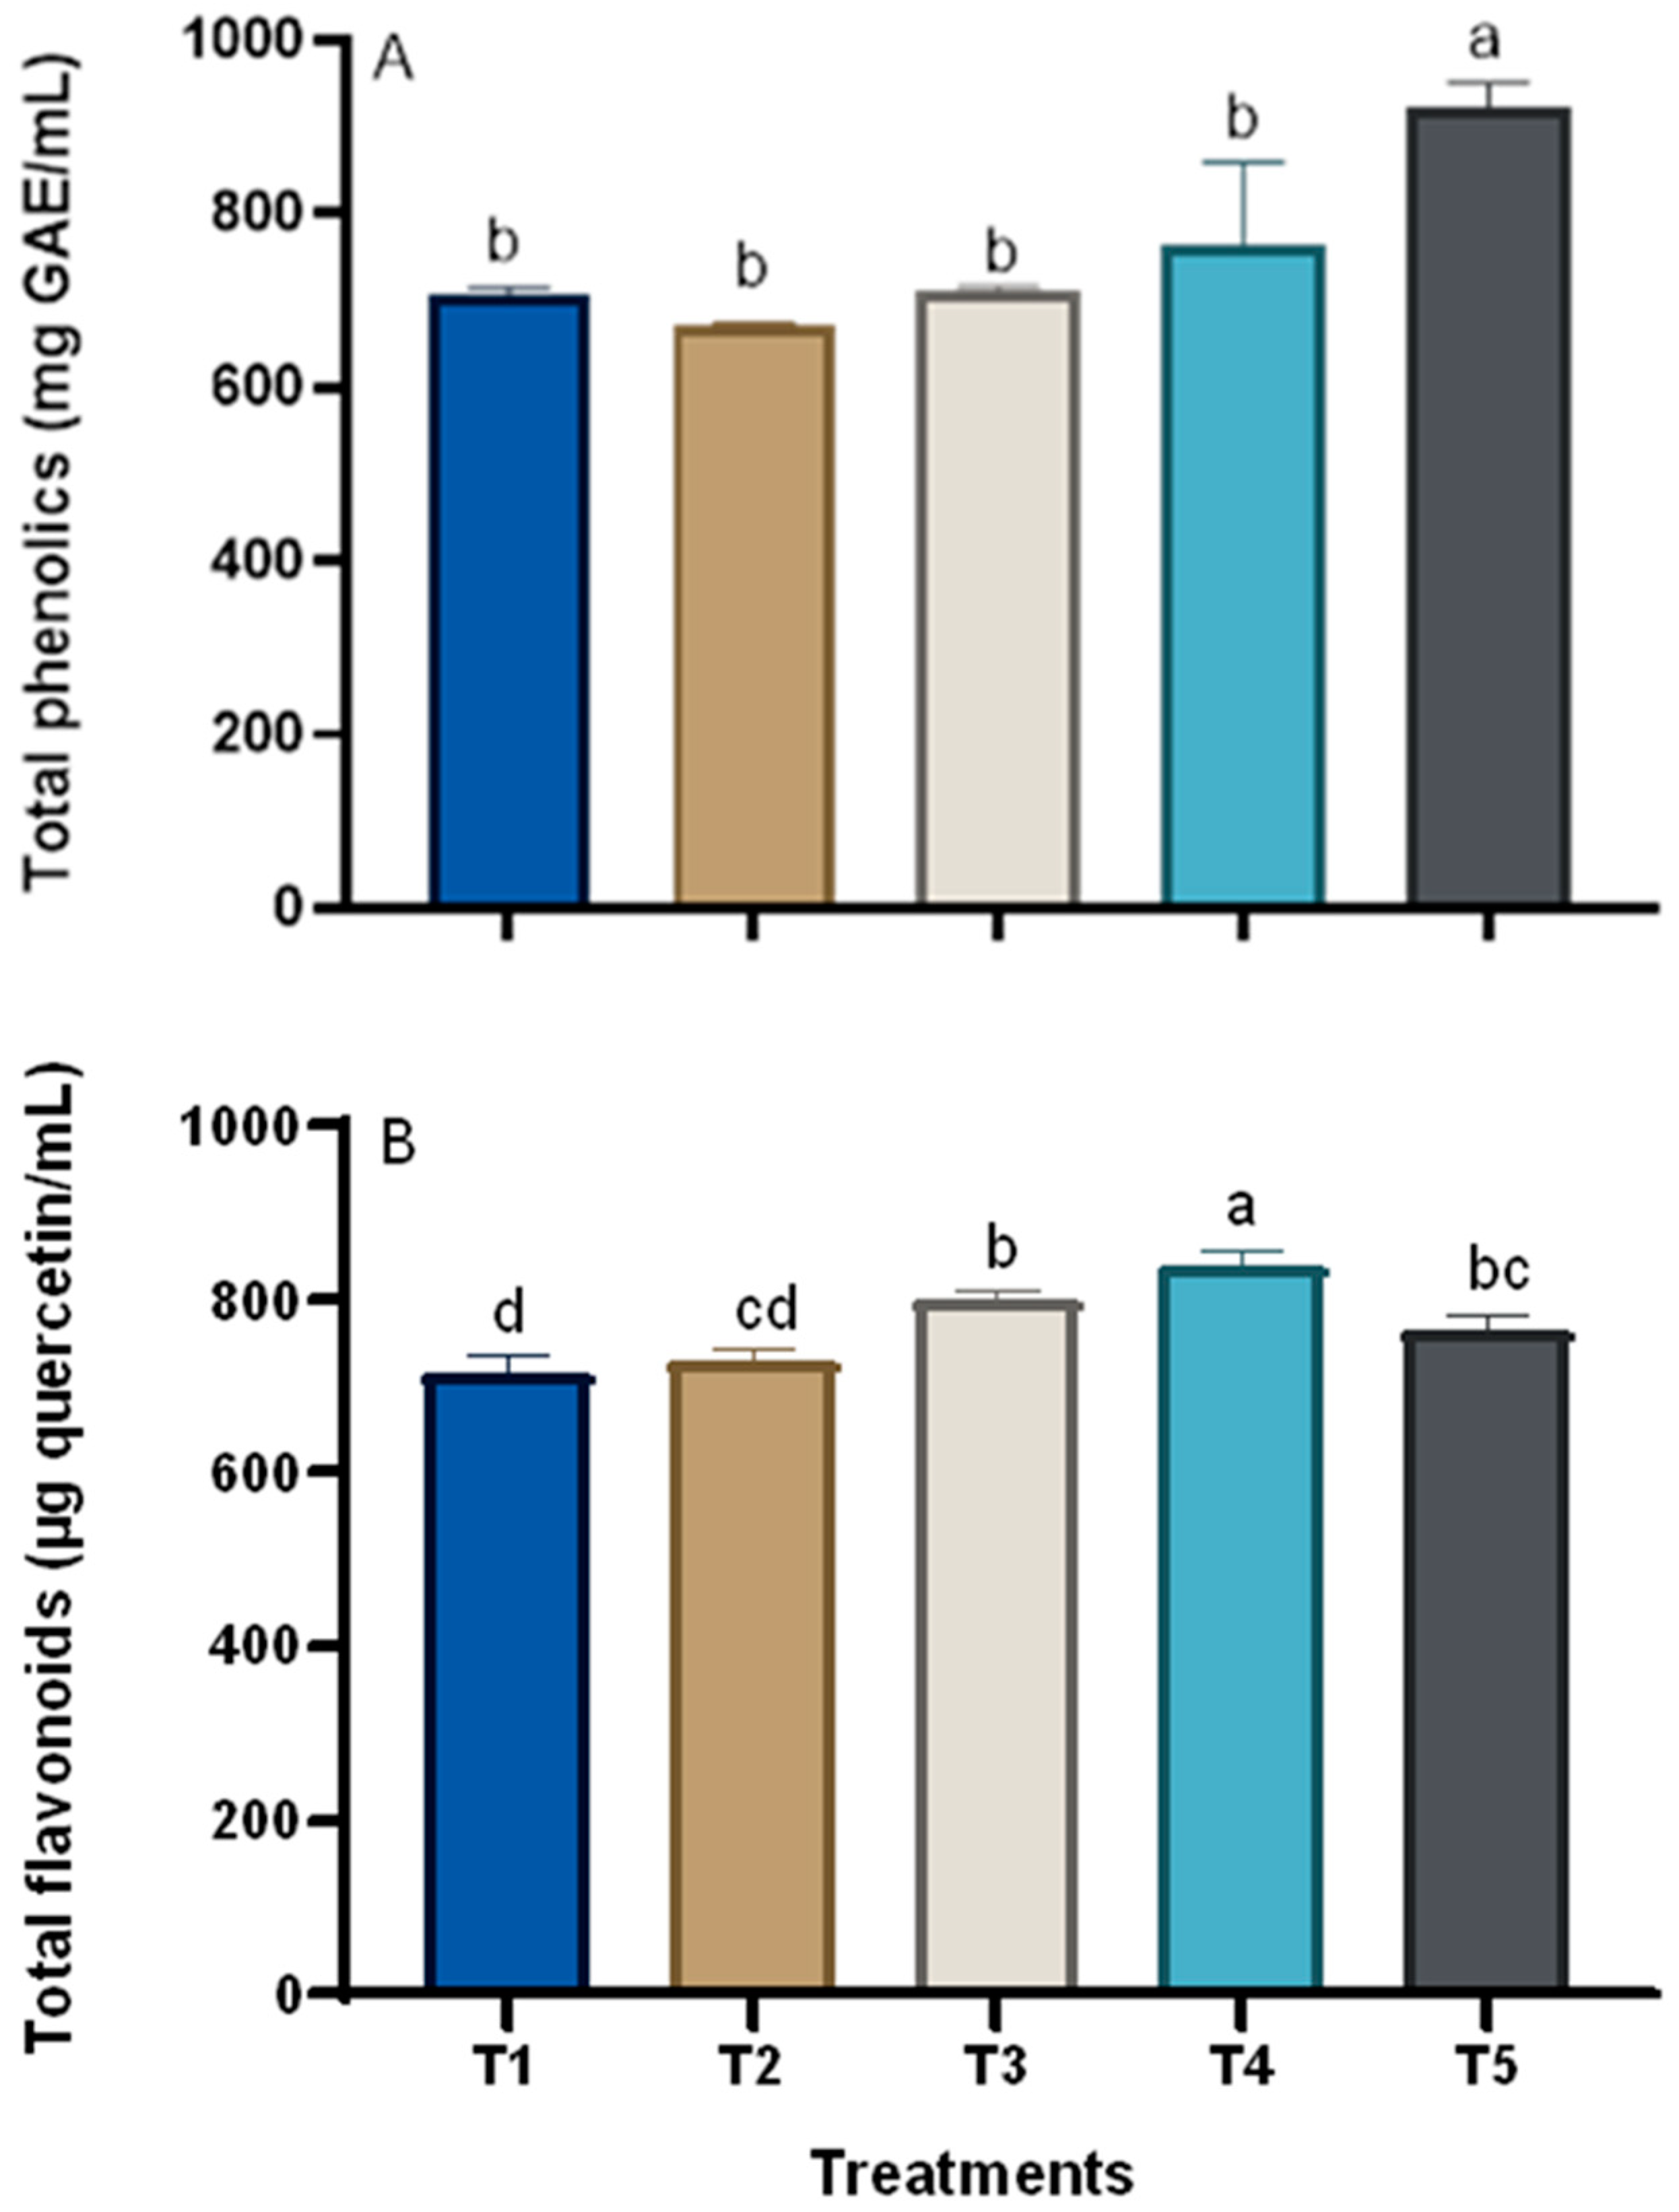
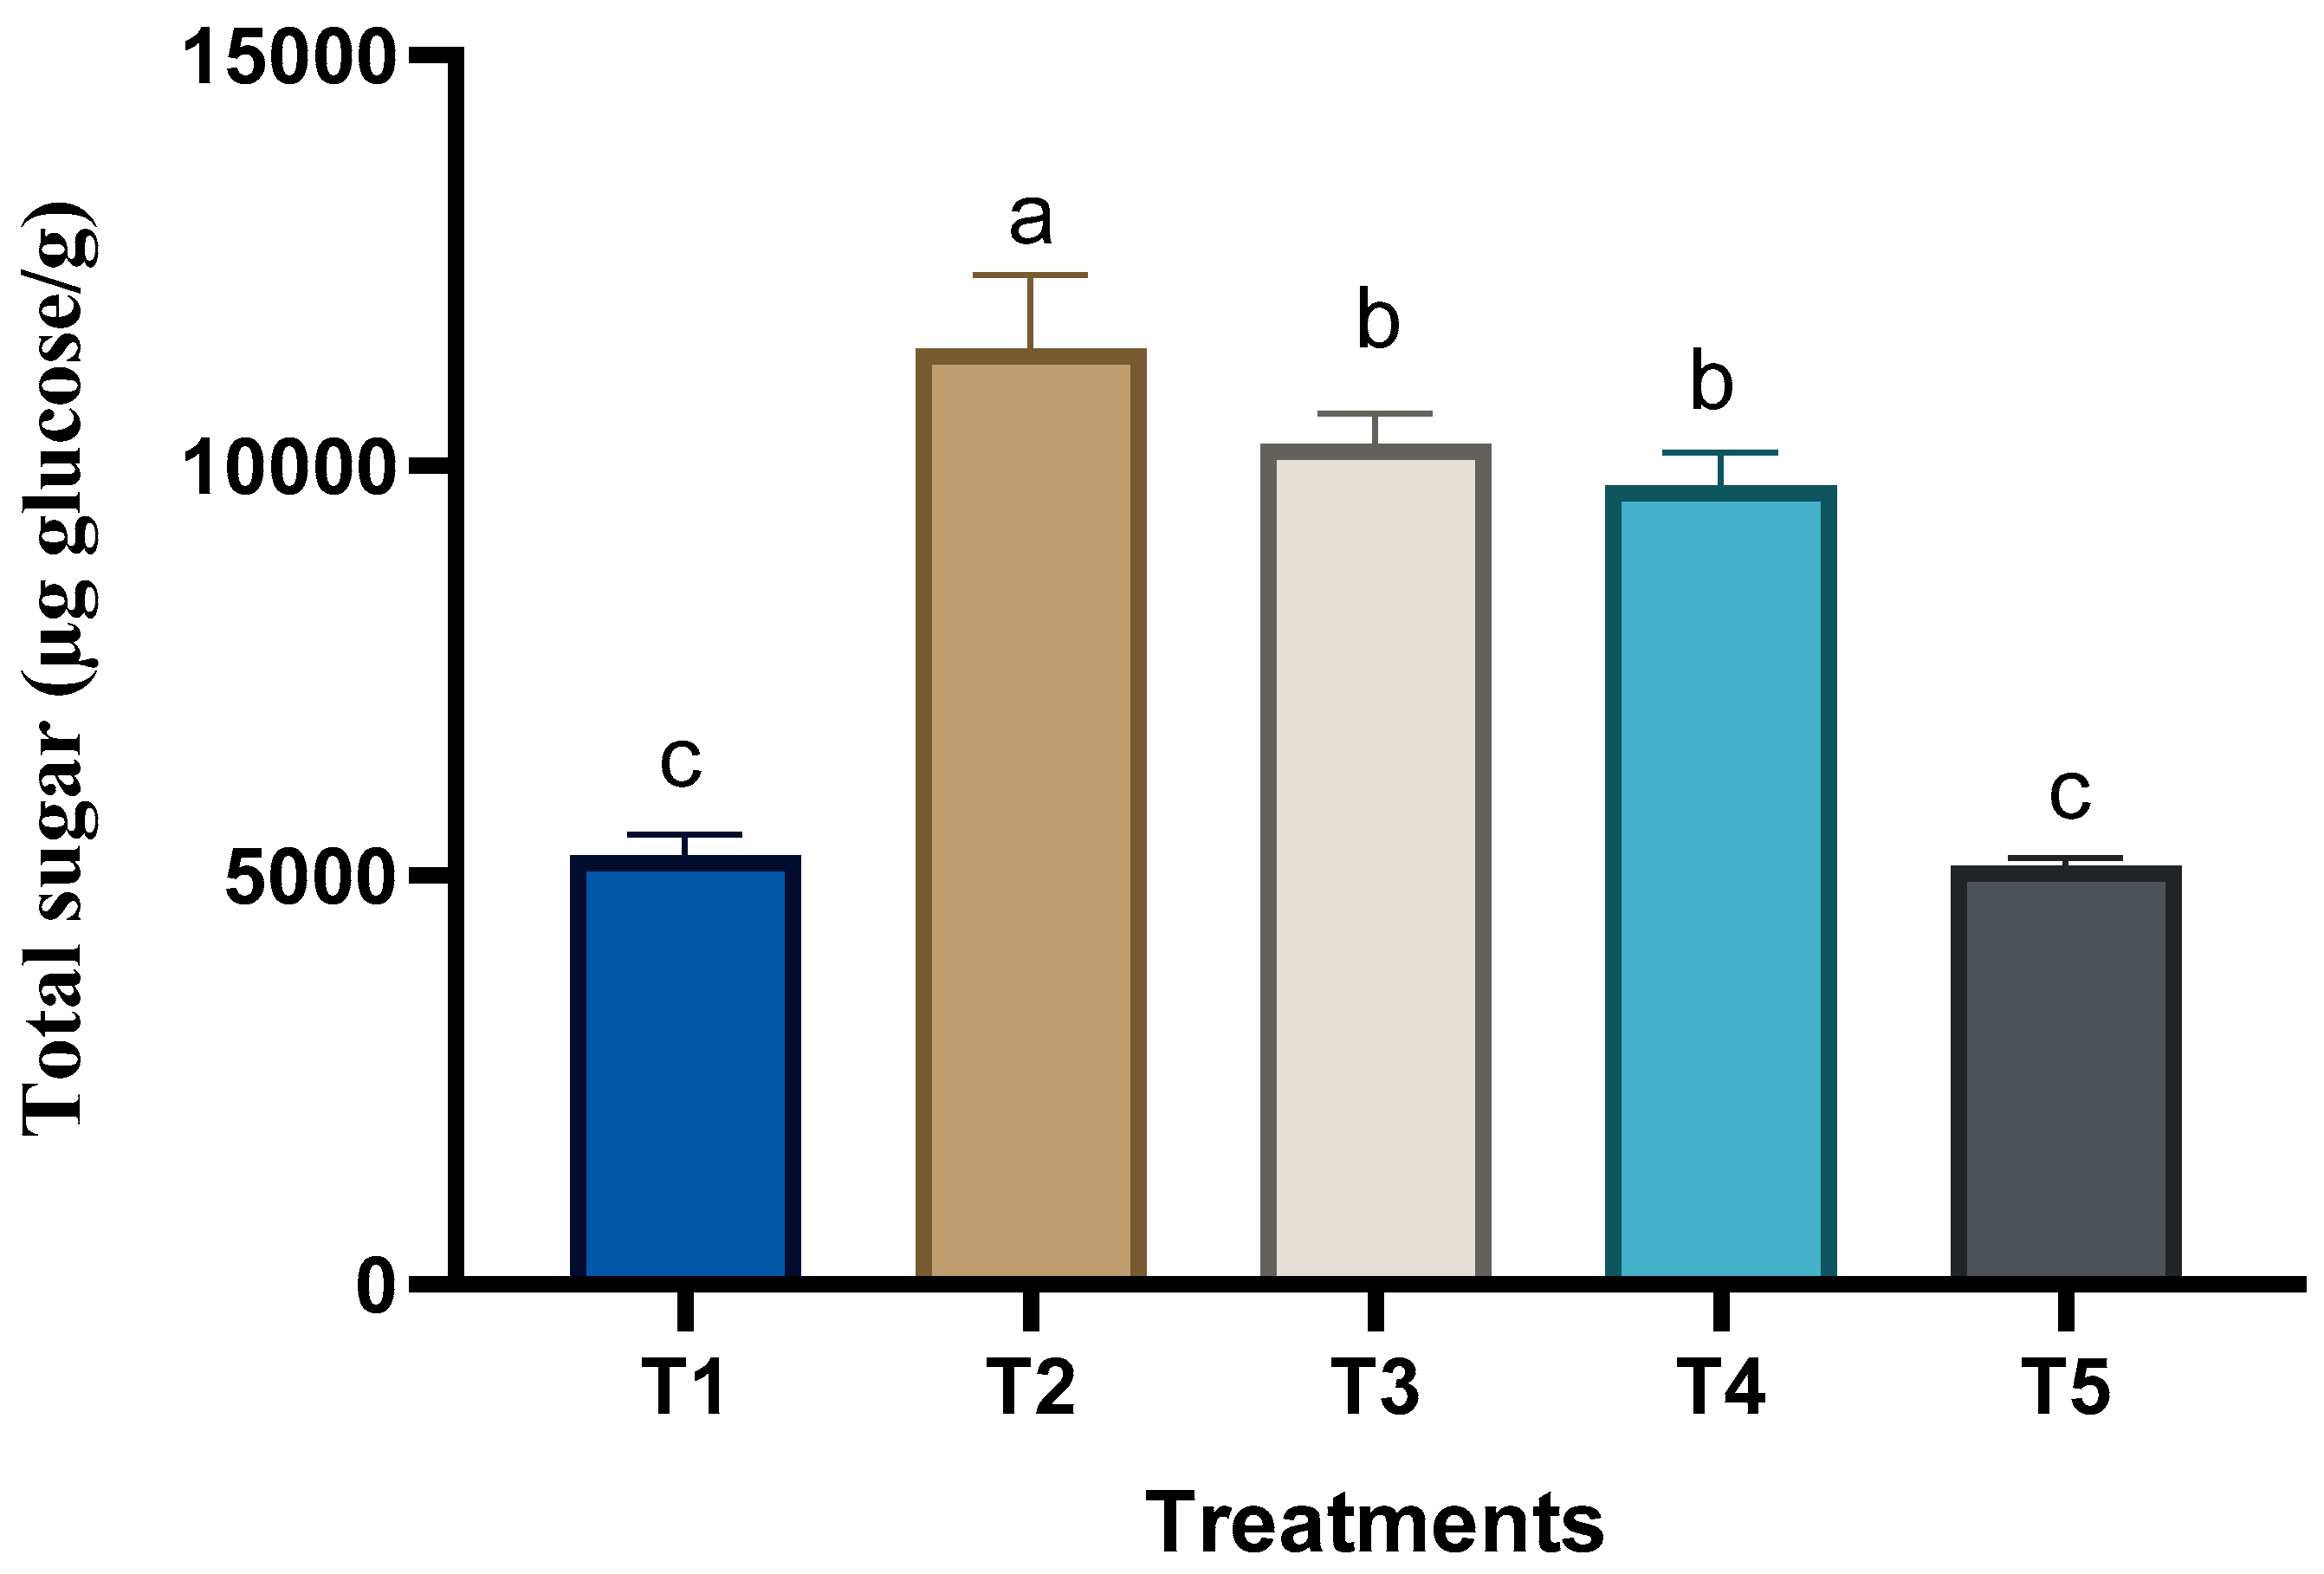
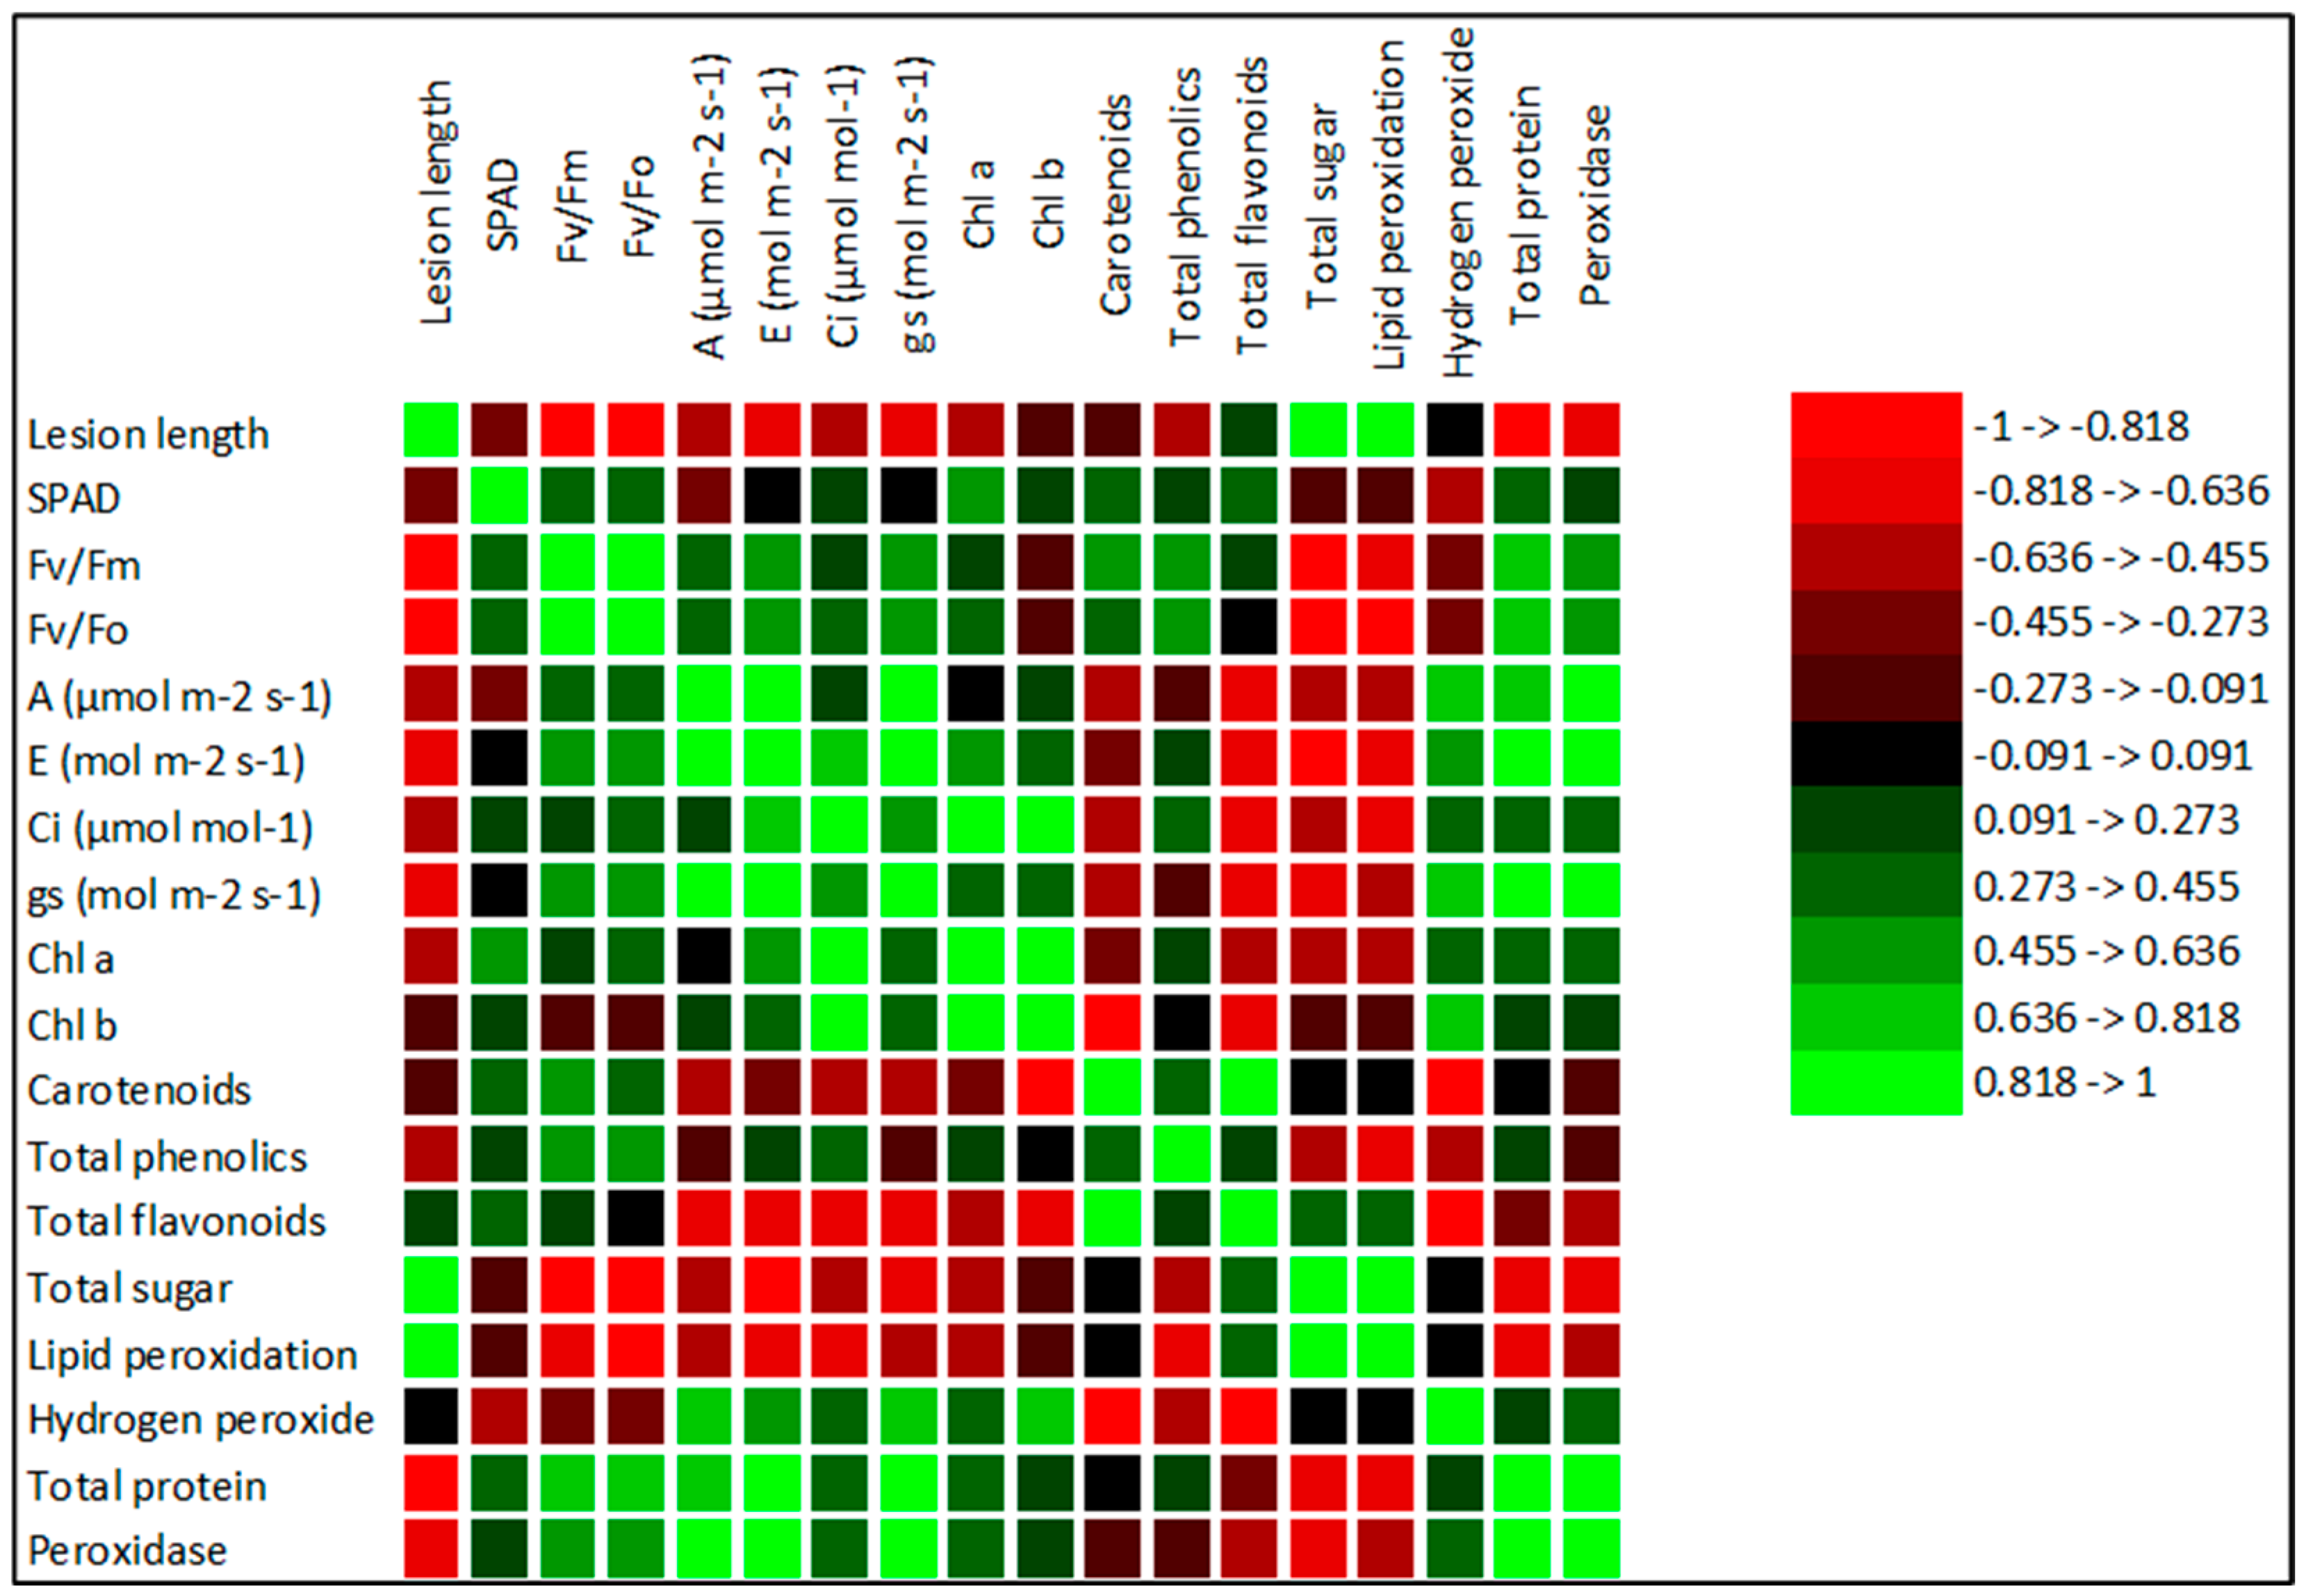
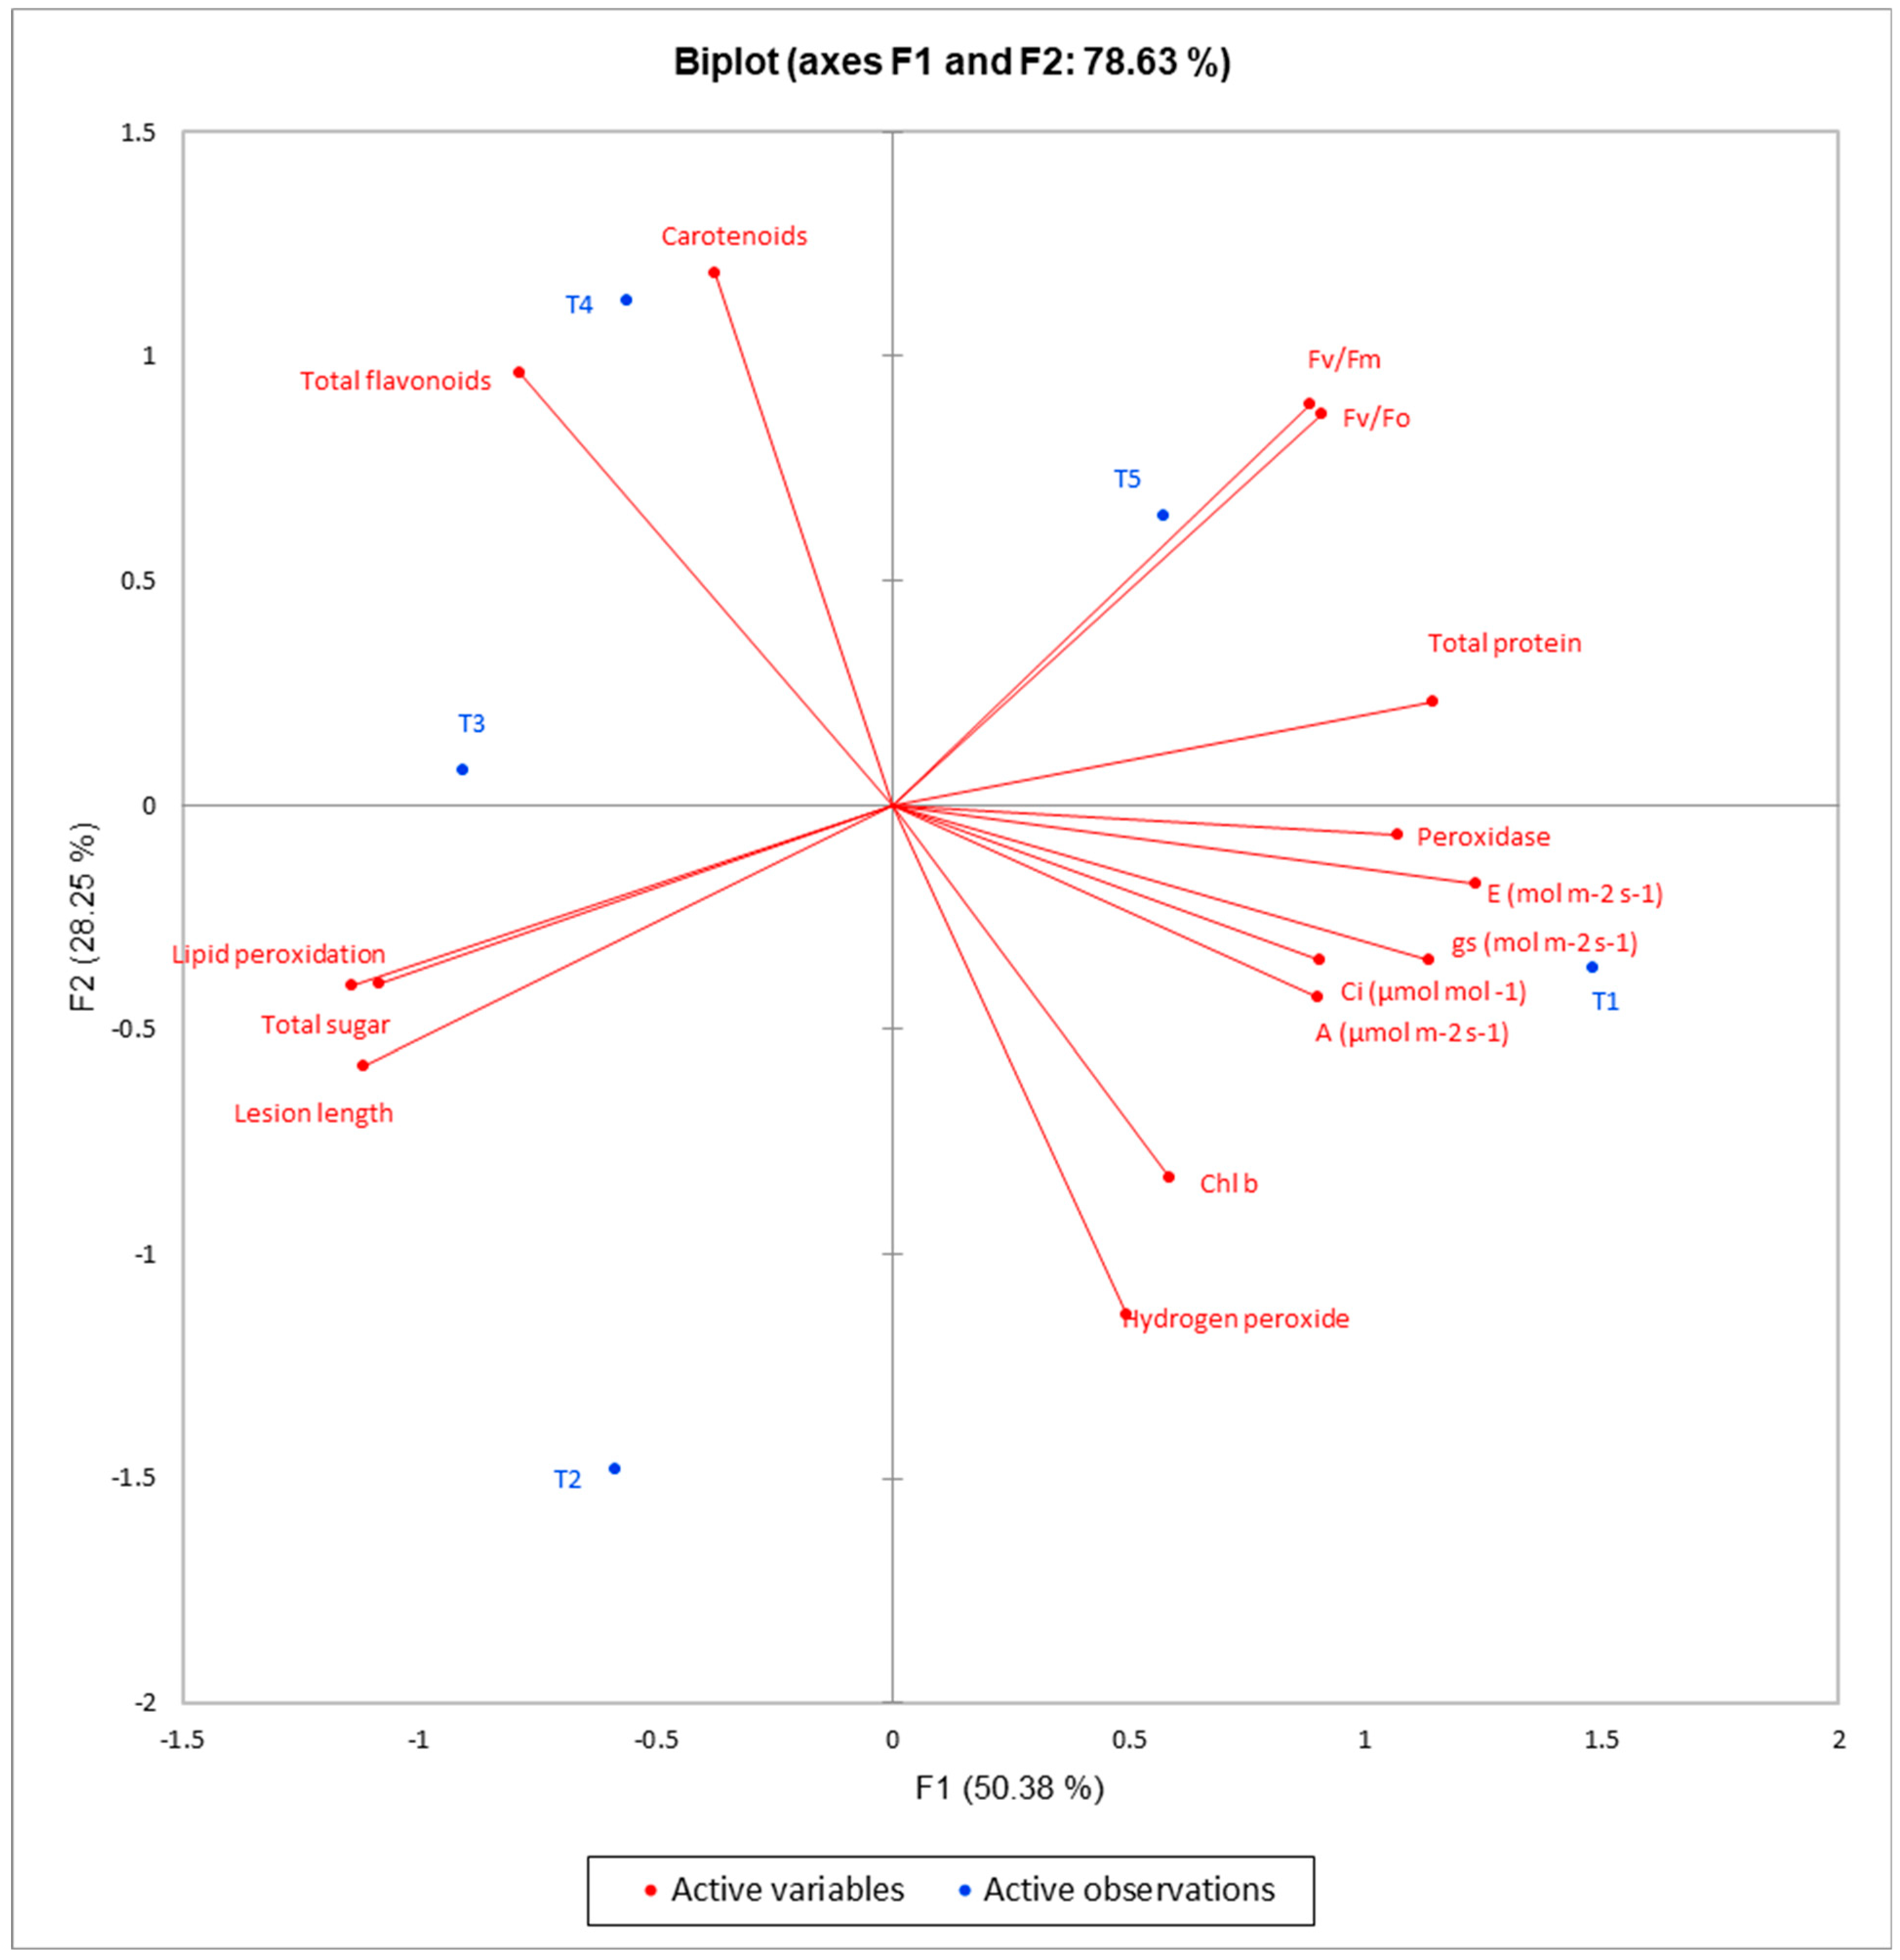
3.3. Changes in the Chemical Composition of Grape Plants in Response to Treatments

The application of PA, Switch®, and B. cinerea inoculation caused significant (p < 0.05) changes in the chemical composition of the grape plants (Figure 4, Figure 5, Figure 6, Figure 7 and Figure 8).
The 2% PA plants with Botrytis showed significant (p < 0.05) reduction in chl a by approximately 0.11-fold compared to Botrytis alone. Similarly, the 4% PA plants with Botrytis showed a non-significant (p > 0.05) reduction in chl a compared to Botrytis alone. The Switch®-treated plants with Botrytis showed a non-significant (p > 0.05) increase in chl a compared to Botrytis alone (Figure 4A). The 2 and 4% PA plants with Botrytis showed significant (p < 0.05) decreases in chl b by approximately 0.56- and 0.41-folds, respectively, compared to Botrytis alone. Switch®-treated plants with Botrytis showed a non-significant (p > 0.05) decrease in chl b compared to Botrytis alone (Figure 4B). The 2% PA-, 4% PA-, and Switch®-treated plants with Botrytis showed significant (p < 0.05) increases in total carotenoids by approximately 0.31-, 0.44-, and 0.26-folds, respectively, compared to Botrytis alone (Figure 4C).
The 2% and 4% PA plants with Botrytis had non-significant (p > 0.05) increases in total phenolics compared to Botrytis alone, while the Switch®-treated plants with Botrytis showed significant (p < 0.05) increases in total phenolics by approximately 0.38-fold compared to Botrytis alone (Figure 5A). Total flavonoids were significantly (p < 0.05) increased by the 2% PA and 4% PA with Botrytis by approximately 0.09- and 0.15-folds, respectively, compared to Botrytis alone. Switch®-treated plants with Botrytis showed a non-significant (p > 0.05) increase in total flavonoids compared to Botrytis alone (Figure 5B).
Total sugar was significantly (p < 0.05) decreased by 2% PA, 4% PA, and Switch® with Botrytis by approximately 0.10-, 0.15-, and 0.55-folds, respectively, compared to Botrytis alone (Figure 6).
The 2% PA with Botrytis showed significant (p < 0.05) decreases in MDA content and hydrogen peroxide by approximately 0.08- and 0.26-folds, respectively, compared to Botrytis alone. The 4% PA plants with Botrytis had significant (p < 0.05) decreases in MDA content and hydrogen peroxide by approximately 0.16- and 0.55-folds, respectively, compared to Botrytis alone. The Switch® plants with Botrytis showed significant (p < 0.05) decreases in MDA content and hydrogen peroxide by approximately 0.87- and 0.33-folds, respectively, compared to Botrytis alone (Figure 7).
The 2% PA plants with Botrytis showed significant (p < 0.05) increases in total protein and peroxidase enzyme activity by approximately 1.16- and 1.25-folds, respectively, compared to Botrytis alone. The 4% PA plants with Botrytis showed significant (p < 0.05) increases in total protein and peroxidase enzyme activity by approximately 4.49- and 1.35-folds, respectively, compared to Botrytis alone. The Switch®-treated plants with Botrytis showed significant (p < 0.05) increases in total protein and peroxidase enzyme activity by approximately 4.93- and 1.46-folds, respectively, compared to Botrytis alone (Figure 8).
The heatmap in Figure 9 shows strong positive correlations between the zone of lesion and total sugar (r = 0.95) and MDA content (r = 0.91). The zone of lesion has weak positive correlations with total flavonoid (r = 0.21) and hydrogen peroxide (r = 0.07). The zone of lesion also has strong negative correlations with maximum quantum efficiency (Fv/Fm) of PS II (r = −0.95), potential photosynthetic capacity (Fv/Fo) (r = −0.96), and total protein (r = −0.89) (Figure 9).
To further assess the relationship between the treatments and the physiological and chemical parameters, a principal component analysis (PCA) was performed (Figure 10). The first and second principal components (PC1 and PC2) accounted for approximately 50% and 28%, respectively, explaining approximately 79% of the total variations in the dataset.
The parameters that were clustered together suggested positive relationships, while parameters that separated suggested a negative relationship. Parameters located at the right-angle suggested no relationship. Parameters assembled with a treatment indicated that the treatment influenced them, while parameters that were distant from a treatment indicated that the treatment did not influence them. The PCA biplot revealed that PDA plugs alone had an influence on photosynthetic rate, transpiration rate, sub-stomatal CO2, stomatal conductance, hydrogen peroxide, total protein, chl b, and peroxidase enzyme activity. Switch®-treated plants with Botrytis influenced Fv/Fm and Fv/Fo. The PA treatments influenced total carotenoids and total flavonoids. In addition, Botrytis alone showed an influence on total sugar, lipid peroxidation, and lesion length (Figure 10).

4. Discussion

The study effectively demonstrates that pyroligneous acid (PA) inhibits Botrytis cinerea growth and reduces its impact on grapevines. It also provides valuable insights into the plant’s physiological and biochemical responses to both the pathogen and PA treatment. This research contributes to our understanding of potential natural fungicides and plant defense mechanisms against B. cinerea, a significant pathogen in viticulture.
Many researchers have identified PA as antibacterial and antifungal agent due to its chemical composition. For instance, Wei et al. [39] tested PA from walnut branches against various plant pathogens, such as Valsa mali, Colletotrichum orbiculare, Phytophthora infestans, Phytophthora capsica, Cochliobolus sativus, and Helminthosporium sativum. They showed that PA inhibited these pathogens. Chen et al. [40] tested PA from Eucommia ulmoides against B. cinerea using the plate method and table grape fruits, and found that PA at dilutions lower than 1:200 can inhibit fungal mycelium growth. Pertile and Frąc [14] used the plate method and found that 1:1600 dilution of PA affected the metabolic profiles of B. cinerea. Liu et al. [24] also used the plate method to examine the antifungal effect of PA from bamboo against B. cinerea in apple fruits. In the present study, PA from white pine inhibited B. cinerea mycelium growth at 2% concentration, as in a preliminary study. These different outcomes can be attributed to the quantity and type of molecules characterizing the PAs used due to the origin of the feedstocks and, possibly, manufacturing conditions such as temperature [15,18]. This preliminary study using the plate method has been reported by a few researchers; hence, our main focus was to investigate the effects of PA on B. cinerea in grapevines.
In the present study, a known fungicide (Switch®) and varying concentrations of PA were tested for efficacy against B. cinerea lesion development in grape seedlings. The most consistent reduction in lesion growth was obtained from Switch®. Switch® is a synthetic fungicide known to control Botrytis [41]. Pyroligneous acid is organic and environmentally friendly, with the ability to control Botrytis, and may be preferable to synthetic fungicides for reducing chemical residues in the environment [26].
This result is particularly promising, as it indicates that pyroligneous acid’s antifungal activity observed in vitro could be translated effectively to real-world applications in living plant tissues. Thus, the differences obtained from the efficacy test present a great opportunity to further examine the physiological and biochemical responses of the grape seedlings challenged with B. cinerea. Plants depend on their internal immune systems to recognize and respond to biotic stimuli [42]. During plants’ disease defenses, the physiological and biochemical conditions of the plants change accordingly [43,44]. In the present study, the stomatal conductance significantly (p < 0.05) influenced CO2 assimilation and transpiration rates. Thus, the lower the CO2 assimilation and transpiration rates, the more the stomatal conductance decreases in response to the treatment. Changes in stomatal conductance can affect the intercellular CO2 concentration, which, in turn, impacts the carboxylation efficiency and overall photosynthetic rate [45], which agrees with our findings in this study. In addition, the reduction in the stomatal conductance may be triggered as stress response in the grape seedlings, leading to stomatal closure as a protective mechanism [46]. Fv/Fm ratios decreased, suggesting damage to the photosynthetic apparatus under stress. This reduction in photosynthetic efficiency is often preceded by a decline in chlorophyll content, especially of PSII [47]. This matches what we found in our study, except that the 4% PA with Botrytis non-significantly (p > 0.05) increased the chlorophyll content of the treated plants. The increase in chlorophyll production by the 4% PA with Botrytis may be a mechanism for protective response. PA may stimulate chlorophyll biosynthesis or protect existing chlorophyll from degradation under stress conditions.
Plants have evolved complex defense mechanisms to respond to pathogen attacks, which often involve alterations in the levels of various metabolites including chlorophylls, carotenoids, phenolics, flavonoids, and sugars [48,49]. In this study, Botrytis alone produced the highest chl a, b, and soluble sugar compared to the other treatments. The reduction in the chlorophylls with the PA and fungicide treatments could be attributed to the ability of these treatments to degrade the chlorophylls in the leaves or inhibiting chlorophyll biosynthesis [50,51,52]. The upregulation of the soluble sugar could be attributed to B. cinerea impairing carbohydrate metabolism [53]. These treatments, on the other hand, significantly (p < 0.05) increased the total carotenoids, phenolics, and flavonoids. These antioxidants helped to scavenge ROS produced during the infection process [48,54].
The change in the MDA amount was consistent with the degree of damage caused by the pathogen in the grape leaves. Based on the results, the lower lipid peroxidation observed in the Switch®-treated plants with B. cinerea fungal plugs was most effective. Malondialdehyde (MDA) is a key byproduct of lipid peroxidation and serves as a widely used biomarker to assess the extent of lipid peroxidation and, by extension, the degree of membrane damage [55]. In this study, the amount of hydrogen peroxide was higher in untreated plants with PDA plugs alone and Botrytis alone. Hydrogen peroxide is, indeed, a potent signaling molecule in plants that plays a crucial role in regulating growth, metabolism, and stress responses [56]. It is produced routinely in both stressed and non-stressed conditions through various mechanisms, primarily via the dismutation of superoxide radicals by superoxide dismutase (SOD) during electron transport in different cellular compartments [57,58,59]. Nurnaeimah et al. [60] reported that hydrogen peroxide can also act as a potent signaling molecule that mediates various physiological and biochemical processes in plants. Hydrogen peroxide in this study had positive correlations with photosynthetic rate, transpiration rate, sub-stomatal CO2, stomatal conductance, chl a and b, total protein, and peroxidase enzyme activity. The total protein and peroxidase enzyme activity were high with untreated plants with PDA plugs alone and were reduced per the level of leaf damage [61]. These biochemical responses could serve as useful markers for the development of B. cinerea-resistant grapevines. The effective application of key metabolite-based markers can facilitate the identification of candidate genes associated with disease resistance. The study provides valuable insights into the biochemical response mechanisms used by grapevines to combat pathogens such as B. cinerea, emphasizing the integration of genomics and metabolomics for the sustainable development of pathogen-resistant cultivars [48,49].

5. Conclusions

The in vitro assays in our preliminary study demonstrated that PA concentrations ranging from 0.25% to 4% effectively inhibited the growth of B. cinerea, with higher concentrations of >2% exhibiting enhanced antifungal activity. These findings were further supported by in vivo assessments, which also revealed that both 2% and 4% PA treatments remarkably decreased the average lesion length on grapevines, with a clear trend showing that greater PA concentrations resulted in shorter lesions. The findings of this study have significant implications for sustainable viticulture practices. The ability of PA to control B. cinerea infection while simultaneously improving plant physiological parameters suggests that it could be an effective tool in integrated pest management strategies. Its natural origin and potential for sustainable production make it an attractive alternative to synthetic fungicides. It addresses concerns about environmental impact and development of resistance against synthetic chemical fungicides under the current dispensation of climate change. Further molecular studies are recommended to elucidate the mechanisms underlying the observed physiological and biochemical changes. The downregulation of chlorophyll content caused by PA also requires further studies to evaluate the impact of PA on Vitis crops in the field.

Author Contributions

E.B.N.: conceptualization, formal analysis, investigation, methodology, validation, writing—original draft, and writing—review and editing. P.A.O.: formal analysis, investigation, methodology, validation, and writing—review and editing. R.O.: formal analysis, investigation, methodology, validation, and writing—review and editing. A.P.K.: formal analysis, investigation, and methodology. S.K.A.: validation and writing—review and editing. C.E.: validation and writing—review and editing. L.A.: conceptualization, funding acquisition, methodology, project administration, resources, supervision, validation, and writing—review and editing. All authors have read and agreed to the published version of the manuscript.

Funding

This work was financially supported by the Research Nova Scotia Corp—Special Initiative Grant #RNS-SIG-2021-1613 and Canada Foundation for Innovation (CFI) grant (No. 37581) to L.A.

Data Availability Statement

The original contributions presented in this study are included in the article. Further inquiries can be directed to the corresponding author.

Acknowledgments

The lead author wishes to thank his laboratory mates for their generous assistance and support. The authors also thank Ottawa Research and Development Centre, Agriculture and Agri-Food Canada for providing us with the fungal cultures and Proton Power Inc. for gifting us with the pyroligneous acid.

Conflicts of Interest

The authors declare that they have no known competing financial interests or personal relationships that could appear to have influenced the work reported in this paper.

References

  1. Fisher, M.C.; Henk, D.A.; Briggs, C.J.; Brownstein, J.S.; Madoff, L.C.; McCraw, S.L.; Gurr, S.J. Emerging fungal threats to animal, plant and ecosystem health. Nature 2012, 484, 186–194. [Google Scholar] [CrossRef] [PubMed]
  2. Bolívar-Anillo, H.J.; Garrido, C.; Collado, I.G. Endophytic microorganisms for biocontrol of the phytopathogenic fungus Botrytis cinerea. Phytochem. Rev. 2020, 19, 721–740. [Google Scholar] [CrossRef]
  3. Rodriguez-Moreno, L.; Ebert, M.K.; Bolton, M.D.; Thomma, B.P.H.J. Tools of the crook- infection strategies of fungal plant pathogens. Plant J. 2018, 93, 664–674. [Google Scholar] [CrossRef] [PubMed]
  4. Shaw, M.W.; Emmanuel, C.J.; Emilda, D.; Terhem, R.B.; Shafia, A.; Tsamaidi, D.; Emblow, M.; van Kan, J.A.L.; Cryptic, A.O. Systemic Botrytis Infections in Symptomless Hosts. Front. Plant Sci. 2016, 7, 625. [Google Scholar] [CrossRef]
  5. Hua, L.; Yong, C.; Zhanquan, Z.; Boqiang, L.; Guozheng, Q.; Shiping, T. Pathogenic mechanisms and control strategies of Botrytis cinerea causing post-harvest decay in fruits and vegetables. Food Qual. Saf. 2018, 2, 111–119. [Google Scholar] [CrossRef]
  6. Abbey, J.A.; Percival, D.; Abbey, L.; Asiedu, S.K.; Prithiviraj, B.; Schilder, A. Biofungicides as alternative to synthetic fungicide control of grey mould (Botrytis cinerea)–prospects and challenges. Biocontrol Sci. Technol. 2019, 29, 241–262. [Google Scholar] [CrossRef]
  7. Cheung, N.; Tian, L.; Liu, X.; Li, X. The destructive fungal pathogen Botrytis cinerea—Insights from genes studied with mutant analysis. Pathogens 2020, 9, 923. [Google Scholar] [CrossRef]
  8. Roca-Couso, R.; Flores-Félix, J.D.; Rivas, R. Mechanisms of action of microbial biocontrol agents against Botrytis cinerea. J. Fungi 2021, 7, 1045. [Google Scholar] [CrossRef]
  9. Fillinger, S.; Elad, Y. Botrytis—The Fungus, the Pathogen and Its Management in Agricultural Systems; Springer International Publishing: Berlin/Heidelberg, Germany, 2015. [Google Scholar] [CrossRef]
  10. You, Y.; Astudillo-Estévez, I.; Essenstam, B.; Qin, S.; van Kan, J.A.L. Leaf resistance to Botrytis cinerea in wild tomato Solanum habrochaites depends on inoculum composition. Front. Plant Sci. 2023, 14, 1156804. [Google Scholar] [CrossRef]
  11. Abuqamar, S.F.; Moustafa, K.; Tran, L.S.P. ‘Omics’ and plant responses to Botrytis cinerea. Front. Plant Sci. 2016, 7, 1658. [Google Scholar] [CrossRef]
  12. Leroch, M.; Kleber, A.; Silva, E.; Coenen, T.; Koppenhöfer, D.; Shmaryahu, A.; Valenzuela, P.D.T.; Hahn, M. Transcriptome profiling of Botrytis cinerea conidial germination reveals upregulation of infection-related genes during the prepenetration stage. Eukaryot. Cell 2013, 12, 614–626. [Google Scholar] [CrossRef] [PubMed]
  13. Orozco-Mosqueda, M.D.C.; Kumar, A.; Fadiji, A.E.; Babalola, O.O.; Puopolo, G.; Santoyo, G. Agroecological Management of the Grey Mould Fungus Botrytis cinerea by Plant Growth-Promoting Bacteria. Plants 2023, 12, 637. [Google Scholar] [CrossRef]
  14. Pertile, G.; Frąc, M. The Antifungal Effect of Pyroligneous Acid on the Phytopathogenic Fungus Botrytis cinerea. Int. J. Mol. Sci. 2023, 24, 3080. [Google Scholar] [CrossRef]
  15. Grewal, A.; Abbey, L.; Gunupuru, L.R. Production, prospects and potential application of pyroligneous acid in agriculture. J. Anal. Appl. Pyrolysis 2018, 135, 152–159. [Google Scholar] [CrossRef]
  16. Zhu, K.; Gu, S.; Liu, J.; Luo, T.; Khan, Z.; Zhang, K.; Hu, L. Wood vinegar as a complex growth regulator promotes the growth, yield, and quality of rapeseed. Agronomy 2021, 11, 510. [Google Scholar] [CrossRef]
  17. Aguirre, J.L.; Baena, J.; Martín, M.T.; Nozal, L.; González, S.; Manjón, J.L.; Peinado, M. Composition, Ageing and Herbicidal Properties of Biomass Pyrolysis. Energies 2020, 13, 2418. [Google Scholar] [CrossRef]
  18. Mathew, S.; Zakaria, Z.A. Pyroligneous acid—The smoky acidic liquid from plant biomass. Appl. Microbiol. Biotechnol. 2015, 99, 611–622. [Google Scholar] [CrossRef]
  19. Medeiros, L.C.D.; Gasparotto, L.H.S. Pyroligneous acid and antibacterial activity: Criticism of a paper by Araújo et al. (2018). J. Appl. Microbiol. 2022, 132, 1768–1770. [Google Scholar] [CrossRef]
  20. Oramahi, H.A.; Yoshimura, T. Antifungal and antitermitic activities of wood vinegar from Vitex pubescens Vahl. J. Wood Sci. 2013, 59, 344–350. [Google Scholar] [CrossRef]
  21. Pimenta, A.S.; Fasciotti, M.; Monteiro, T.V.C.; Lima, K.M.G. Chemical composition of pyroligneous acid obtained from eucalyptus GG100 clone. Molecules 2018, 23, 426. [Google Scholar] [CrossRef]
  22. Oğuz, H.İ.; Oğuz, İ. Research on the Use of Wood Vinegar (Pyrolysis Acid) and Biochar in the Horticultural Production. Recent. Headw. Pomol. 2021, 1, 129–150. [Google Scholar]
  23. Chen, J.; Thilakarathna, W.P.D.W.; Astatkie, T.; Rupasinghe, H.P.V. Optimization of catechin and proanthocyanidin recovery from grape seeds using microwave-assisted extraction. Biomolecules 2020, 10, 243. [Google Scholar] [CrossRef] [PubMed]
  24. Liu, X.; Li, J.; Cui, X.; Ji, D.; Xu, Y.; Chen, T.; Tian, S. Exogenous bamboo pyroligneous acid improves antioxidant capacity and primes defense responses of harvested apple fruit. LWT 2020, 134, 110191. [Google Scholar] [CrossRef]
  25. Ofoe, R.; Gunupuru, L.R.; Abbey, L. Metabolites, elemental profile and chemical activities of Pinus strobus high temperature-derived pyroligneous acid. Chem. Biol. Technol. Agric. 2022, 9, 85. [Google Scholar] [CrossRef]
  26. Kirkby, K.; Roser, S.; Plett, K. Using Detached Industrial Hemp Leaf Inoculation Assays to Screen for Varietal Susceptibility and Product Efficacy on Botrytis cinerea. Plants 2023, 12, 3278. [Google Scholar] [CrossRef]
  27. Lichtenthaler, H.K. Chlorophylls and carotenoids: Pigments of photosynthetic biomembranes. In Methods in Enzymology; Academic Press: Cambridge, MA, USA, 1987. [Google Scholar] [CrossRef]
  28. Eb, N.; Ofoe, R.; Ap, K.; Abbey, L. Plant Growth, Yield, and Biochemical Composition of Solanum macrocarpon and Corchorus olitorius under Varying Temperatures. Open Access J. Agric. Res. 2024, 3, 000172. [Google Scholar] [CrossRef]
  29. Ainsworth, E.A.; Gillespie, K.M. Estimation of total phenolic content and other oxidation substrates in plant tissues using Folin-Ciocalteu reagent. Nat. Protoc. 2007, 2, 875–877. [Google Scholar] [CrossRef]
  30. Ofori, P.A.; Ofoe, R.; Nutsukpo, E.B.; Owusu-Nketia, S.; Kumar, A.P.; Chada, S.; Jiang, Q.; Parks, H.; Basteris, A.; Robinson, J.; et al. Morpho-Physiological and Biochemical Responses of Tomato, Lettuce, Mexican Mint, and Industrial Hemp to Different Temperature Regimes. Open Access J. Agric. Res. 2024, 9, 000378. [Google Scholar] [CrossRef]
  31. Chang, C.C.; Yang, M.H.; Wen, H.M.; Chern, J.C. Estimation of Total Flavonoid Content in Propolis by Two Complementary Colorimetric Methods. J. Food Drug Anal. 2002, 10, 178–182. [Google Scholar]
  32. Nutsukpo, E.B.; Ofoe, R.; Jiang, Q.; Ofori, P.A.; Asiedu, S.K.; Emenike, C.; Lord, A. Pyroligneous Acid Affects Grapevine Growth, Yield, and Chemical Composition of Leaf, Pomace, and Juice. ACS Agric. Sci. Technol. 2024, 4, 1014–1026. [Google Scholar] [CrossRef]
  33. Dubois, M.; Gilles, K.A.; Hamilton, J.K.; Rebers, P.A.; Smith, F. Colorimetric Method for Determination of Sugars and Related Substances. 1956. Available online: https://pubs.acs.org/sharingguidelines (accessed on 10 October 2024).
  34. Negassa, B.; Nebiyu, A.; Garedew, W.; Abbey, L.; Ofoe, R.; Mousavi, N.S.; Nutsukpo, B.; Astatkie, T.; Kuyu, C.G. Evaluation of anchote (Coccinia abyssinica) genotypes and processing methods for mineral and phytochemical composition. J. Agric. Food Res. 2024, 18, 101415. [Google Scholar] [CrossRef]
  35. Hodges, D.M.; DeLong, J.M.; Forney, C.F.; Prange, R.K. Improving the thiobarbituric acid-reactive-substances assay for estimating lipid peroxidation in plant tissues containing anthocyanin and other interfering compounds. Planta 1999, 207, 604–611. [Google Scholar] [CrossRef]
  36. Alexieva, V.; Sergiev, I.; Mapelli, S.; Karanov, E. The effect of drought and ultraviolet radiation on growth and stress markers in pea and wheat. Plant Cell Env. 2001, 24, 1337–1344. [Google Scholar] [CrossRef]
  37. Bradford, M.M. A rapid and sensitive method for the quantitation of microgram quantities of protein utilizing the principle of protein-dye binding. Anal. Biochem. 1976, 72, 248–254. [Google Scholar] [CrossRef] [PubMed]
  38. Chance, B.; Maehly, A.C. Assay of catalases and peroxidases. Methods Enzymol. 1955, 2, 764–775. [Google Scholar]
  39. Wei, Q.; Ma, X.; Dong, J. Preparation, chemical constituents and antimicrobial activity of pyroligneous acids from walnut tree branches. J. Anal. Appl. Pyrolysis 2010, 87, 24–28. [Google Scholar] [CrossRef]
  40. Chen, Y.H.; Li, Y.F.; Wei, H.; Li, X.X.; Zheng, H.T.; Dong, X.Y.; Xu, T.F.; Meng, J.F. Inhibition efficiency of wood vinegar on grey mould of table grapes. Food Biosci. 2020, 38, 100755. [Google Scholar] [CrossRef]
  41. Abbey, J.A. Sustainable Management of Botrytis Blossom Blight in Wild Blueberry (Vaccinium angustifolium Aiton). 2017. Available online: https://dalspace.library.dal.ca/items/97b1302c-00bf-433e-a843-e476c1d148a1 (accessed on 30 March 2025).
  42. Chisholm, S.T.; Coaker, G.; Day, B.; Staskawicz, B.J. Host-microbe interactions: Shaping the evolution of the plant immune response. Cell 2006, 124, 803–814. [Google Scholar] [CrossRef]
  43. Hu, Y.; Zhong, S.; Zhang, M.; Liang, Y.; Gong, G.; Chang, X.; Tan, F.; Yang, H.; Qiu, X.; Luo, L.; et al. Potential role of photosynthesis in the regulation of reactive oxygen species and defence responses to Blumeria graminis f. Sp. tritici in wheat. Int. J. Mol. Sci. 2020, 21, 5767. [Google Scholar] [CrossRef]
  44. Pedrelli, A.; Ricci, G.P.; Panattoni, A.; Nali, C.; Cotrozzi, L. Physiological and Biochemical Responses Induced by Plum Pox Virus and Plum Bark Necrosis Steam Pitting Associated Virus in Tuscany Autochthonous Plum cv. Coscia di Monaca. Plants 2023, 12, 3264. [Google Scholar] [CrossRef]
  45. Lamour, J.; Davidson, K.J.; Ely, K.S.; Le Moguédec, G.; Anderson, J.A.; Li, Q.; Calderón, O.; Koven, C.D.; Wright, S.J.; Walker, A.P.; et al. The effect of the vertical gradients of photosynthetic parameters on the CO2 assimilation and transpiration of a Panamanian tropical forest. New Phytol. 2023, 238, 2345–2362. [Google Scholar] [CrossRef]
  46. Sun, R.; Ma, J.; Sun, X.; Bai, S.; Zheng, L.; Guo, J. Study on a Stomatal Conductance Model of Grape Leaves in Extremely Arid Areas. Sustainability 2023, 15, 8342. [Google Scholar] [CrossRef]
  47. Suárez, J.C.; Vanegas, J.I.; Contreras, A.T.; Anzola, J.A.; Urban, M.O.; Beebe, S.E.; Rao, I.M. Chlorophyll Fluorescence Imaging as a Tool for Evaluating Disease Resistance of Common Bean Lines in the Western Amazon Region of Colombia. Plants 2022, 11, 1371. [Google Scholar] [CrossRef]
  48. Kaur, S.; Samota, M.K.; Choudhary, M.; Choudhary, M.; Pandey, A.K.; Sharma, A.; Thakur, J. How do plants defend themselves against pathogens-Biochemical mechanisms and genetic interventions. Physiol. Mol. Biol. Plants 2022, 28, 485–504. [Google Scholar] [CrossRef]
  49. Al-Khayri, J.M.; Rashmi, R.; Toppo, V.; Chole, P.B.; Banadka, A.; Sudheer, W.N.; Nagella, P.; Shehata, W.F.; Al-Mssallem, M.Q.; Alessa, F.M.; et al. Plant Secondary Metabolites: The Weapons for Biotic Stress Management. Metabolites 2023, 13, 716. [Google Scholar] [CrossRef] [PubMed]
  50. Petit, A.N.; Fontaine, F.; Vatsa, P.; Clément, C.; Vaillant-Gaveau, N. Fungicide impacts on photosynthesis in crop plants. Photosynth. Res. 2012, 111, 315–326. [Google Scholar] [CrossRef] [PubMed]
  51. Moustakas, M.; Sperdouli, I.; Adamakis, I.D.S.; Moustaka, J.; İşgören, S.; Şaş, B. Harnessing the Role of Foliar Applied Salicylic Acid in Decreasing Chlorophyll Content to Reassess Photosystem II Photoprotection in Crop Plants. Int. J. Mol. Sci. 2022, 23, 7038. [Google Scholar] [CrossRef]
  52. Gashi, B.; Buqaj, L.; Vataj, R.; Tuna, M. Chlorophyll biosynthesis suppression, oxidative level and cell cycle arrest caused by Ni, Cr and Pb stress in maize exposed to treated soil from the Ferronikel smelter in Drenas, Kosovo. Plant Stress 2024, 11, 100379. [Google Scholar] [CrossRef]
  53. Llave, C. Dynamic cross-talk between host primary metabolism and viruses during infections in plants. Curr. Opin. Virol. 2016, 19, 50–55. [Google Scholar] [CrossRef]
  54. Pérez-gálvez, A.; Viera, I.; Roca, M. Carotenoids and chlorophylls as antioxidants. Antioxidants 2020, 9, 505. [Google Scholar] [CrossRef]
  55. Ayala, A.; Muñoz, M.F.; Argüelles, S. Lipid peroxidation: Production; metabolism, and signaling mechanisms of malondialdehyde and 4-hydroxy-2-nonenal. Oxid. Med. Cell. Longev. 2014, 2014, 360438. [Google Scholar] [CrossRef] [PubMed]
  56. Černý, M.; Habánová, H.; Berka, M.; Luklová, M.; Brzobohatý, B. Hydrogen peroxide: Its role in plant biology and crosstalk with signalling networks. Int. J. Mol. Sci. 2018, 19, 2812. [Google Scholar] [CrossRef] [PubMed]
  57. Asaeda, T.; Rahman, M.; Liping, X.; Schoelynck, J. Hydrogen Peroxide Variation Patterns as Abiotic Stress Responses of Egeria densa. Front. Plant Sci. 2022, 13, 855477. [Google Scholar] [CrossRef] [PubMed]
  58. Taenzer, L.; Toth, G.; Hansel, C.M. Assessment of hydrogen peroxide as a bioindicator of stress in seaweed aquaculture. Sci. Rep. 2024, 14, 1956. [Google Scholar] [CrossRef]
  59. Anjum, N.A.; Gill, S.S.; Corpas, F.J.; Ortega-Villasante, C.; Hernandez, L.E.; Tuteja, N.; Sofo, A.; Hasanuzzaman, M.; Fujita, M. Editorial: Recent Insights Into the Double Role of Hydrogen Peroxide in Plants. Front. Plant Sci. 2022, 13, 843274. [Google Scholar] [CrossRef]
  60. Nurnaeimah, N.; Mat, N.; Mohd, K.S.; Badaluddin, N.A.; Yusoff, N.; Sajili, M.H.; Mahmud, K.; Adnan, A.F.M.; Khandaker, M.M. The Effects of Hydrogen Peroxide on Plant Growth, Mineral Accumulation, as Well as Biological and Chemical Properties of Ficus deltoidea. Agronomy 2020, 10, 599. [Google Scholar] [CrossRef]
  61. Orange, M.J. Responses of phenological and physiological stages of spring safflower to complementary irrigation. Afr. J. Biotechnol. 2012, 11, 2465–2471. [Google Scholar] [CrossRef]
Figure 1. Inoculation of attached leaves on grape seedlings. (A) Inoculated attached leaf with Botrytis fungal plug secured using a sterilized pin. (B) Setup placed in a tent chamber.
Crops 05 00021 g001
Figure 2. Inhibition of B. cinerea growth as affected by different concentrations of pyroligneous acid using the in vivo antifungal activity method. (A) Untreated plants with PDA plug alone; (B) untreated plants with Botrytis alone; (C) 2% PA-treated plants with Botrytis; (D) 4% PA-treated plants with Botrytis; and (E) Switch®-treated plants with Botrytis.
Crops 05 00021 g002
Figure 3. Average daily lesion length. PDA plugs alone (T1), untreated plants with Botrytis alone (T2), 2% PA-treated plants with Botrytis (T3), 4% PA-treated plants with Botrytis (T4), and Switch® treated plants with Botrytis (T5). Error bars represent standard deviation.
Crops 05 00021 g003
Figure 4. Application of PA, fungicide, and B. cinerea inoculation altered photosynthetic pigments accumulation in the grapevines. (A) chlorophyll a, (B) chlorophyll b, and (C) total carotenoids. PDA plugs alone (T1), untreated plants with Botrytis alone (T2), 2% PA-treated plants with Botrytis (T3), 4% PA-treated plants with Botrytis (T4), and Switch®-treated plants with Botrytis (T5). Values are the means of four replicates. Different letters indicate significant differences (p < 0.05) according to Tukey’s test at α = 0.05. Error bars represent standard deviation.
Crops 05 00021 g004
Figure 5. Application of PA, fungicide, and B. cinerea inoculation altered antioxidant accumulation in the grapevines. (A) total phenolics and (B) total flavonoids. PDA plugs alone (T1), untreated plants with Botrytis alone (T2), 2% PA-treated plants with Botrytis (T3), 4% PA-treated plants with Botrytis (T4), and Switch®-treated plants with Botrytis (T5). Values are the means of four replicates. Different letters indicate significant differences (p < 0.05) according to Tukey’s test at α = 0.05. Error bars represent standard deviation.
Crops 05 00021 g005
Figure 6. Application of PA, fungicide, and B. cinerea inoculation altered osmolyte (sugar) accumulation in the grapevines. PDA plugs alone (T1), untreated plants with Botrytis alone (T2), 2% PA-treated plants with Botrytis (T3), 4% PA-treated plants with Botrytis (T4), and Switch®-treated plants with Botrytis (T5). Values are the means of four replicates. Different letters indicate significant differences (p < 0.05) according to Tukey’s test at α = 0.05. Error bars represent standard deviation.
Crops 05 00021 g006
Figure 7. Application of PA, fungicide, and B. cinerea inoculation altered (A) H202 content and (B) MDA content in the grapevines. PDA plugs alone (T1), untreated plants with Botrytis alone (T2), 2% PA-treated plants with Botrytis (T3), 4% PA-treated plants with Botrytis (T4), and Switch®-treated plants with Botrytis (T5). Values are the means of four replicates. Different letters indicate significant differences (p < 0.05) according to Tukey’s test at α = 0.05. Error bars represent standard deviation.
Crops 05 00021 g007
Figure 8. Application of PA, fungicide, and B. cinerea inoculation altered (A) (I) total protein content and (B) POD content in the grapevines. PDA plugs alone (T1), untreated plants with Botrytis alone (T2), 2% PA-treated plants with Botrytis (T3), 4% PA-treated plants with Botrytis (T4), and Switch®-treated plants with Botrytis (T5). Values are the means of four replicates. Different letters indicate significant differences (p < 0.05) according to Tukey’s test at α = 0.05. Error bars represent standard deviation.
Crops 05 00021 g008
Figure 9. A heatmap showing the response of grape plants to application of PA, fungicide, and B. cinerea inoculation in a correlation matrix of the individual traits observed PDA plugs alone (T1), untreated plants with Botrytis alone (T2), 2% PA-treated plants with Botrytis (T3), 4% PA-treated plants with Botrytis (T4), and Switch®-treated plants with Botrytis (T5). The red color represents a strong negative association, and the green color represents a strong positive association.
Crops 05 00021 g009
Figure 10. A two-dimensional (2-D) principal component analysis (PCA) showing relationships among the applications of PA, fungicide, and B. cinerea inoculations to grape plants. Fv/Fm, maximum quantum efficiency; Fv/Fo, potential photosynthetic capacity; A, photosynthetic rate; E, transpiration rate; Ci, Sub-stomatal CO2; gs, stomatal conductance; chl a, b, chlorophylls a and b. PDA plugs alone (T1), untreated plants with Botrytis alone (T2), 2% PA-treated plants with Botrytis (T3), 4% PA-treated plants with Botrytis (T4), and Switch®-treated plants with Botrytis (T5).
Crops 05 00021 g010
Table 1. Grape seedlings leaf chlorophyll content and photosynthetic parameters as affected by PA application and B. cinerea infection.
TreatmentsSPADFv/FmFv/FoA (μmol m−2 s−1)E (mol m−2 s−1)Ci (μmol mol −1)gs (mol m−2 s−1)
T135.20 ± 3.54a0.798 ± 0.00a3.97 ± 0.06a2.75 ± 1.13a1.90 ± 1.33a395.20 ± 34.50a0.17 ± 0.13a
T234.23 ± 4.25a0.778 ± 0.01b3.52 ± 0.16b1.80 ± 0.87a1.08 ± 0.10a392.60 ± 20.23a0.07 ± 0.01ab
T332.51 ± 2.05a0.787 ± 0.00ab3.71 ± 0.08ab2.12 ± 0.64a1.01 ± 0.35a363.80 ± 28.60a0.06 ± 0.02ab
T437.47 ± 3.16a0.794 ± 0.00a3.87 ± 0.11a1.42 ± 0.27 a0.96 ± 0.19a378.40 ± 18.80a0.05 ± 0.01b
T534.54 ± 0.23a0.797 ± 0.00a3.95 ± 0.29a1.92 ± 0.99a1.42 ± 0.34a397.80 ± 41.80a0.08 ± 0.02ab
p-value0.1680.0010.0010.1870.1530.3700.037
Fv/Fm, maximum quantum efficiency of PSII; Fv/Fo, potential photosynthetic capacity; A, photosynthetic rate; E, transpiration rate; Ci, Sub-stomatal CO2; gs, stomatal conductance. Values are means ± standard deviation of four replicates, and different letters indicate significant (p < 0.05) differences according to Tukey’s honestly significant difference post-test at α = 0.05. PDA plugs alone (T1), untreated plants with Botrytis alone (T2), 2% PA-treated plants with Botrytis (T3), 4% PA-treated plants with Botrytis (T4), and Switch®-treated plants with Botrytis (T5).
Disclaimer/Publisher’s Note: The statements, opinions and data contained in all publications are solely those of the individual author(s) and contributor(s) and not of MDPI and/or the editor(s). MDPI and/or the editor(s) disclaim responsibility for any injury to people or property resulting from any ideas, methods, instructions or products referred to in the content.

