Abstract
Soybeans are the most widely produced oilseed and the fifth most cultivated crop in the world. However, their growth and yield are significantly influenced by weather conditions. In Southern Brazil’s subtropical climate, farmers employ a double-cropping system, planting corn from late winter to early summer, followed by soybeans, which are sown after the corn harvest—typically in January—and harvested in autumn. This study argues that climate change has benefited late-sown soybeans in Rio Grande do Sul and will continue improving their growing conditions. The aim is to identify climate change’s past and future impacts on late-sowing soybean crop yields in this region. We evaluated the effects of climate on soybean yields using the HadGEM2-CC model (CMIP-5) for two scenarios (RCPs 4.5 and 8.5) and for two time periods (mid-and late-century). Additionally, the CSM-CERES-Maize model within DSSAT was also used to simulate corn yields under these climatic conditions. Our climatic analysis indicates an increase in rainfall and temperature, particularly in minimum temperatures, alongside significant rises in both minimum and maximum temperature extremes, and a reduction in frost days. Furthermore, higher atmospheric CO2 levels are projected to enhance net photosynthesis, likely leading to increases in potential yield (Py) with rising CO2 concentrations. Notably, the largest increases in achievable yield (Ay) are anticipated for early sowing dates under the mid- and late-century scenarios of RCP 4.5. Past climate changes have already improved the growth and yield potential of late-sown soybeans in Southern Brazil, a trend expected to continue as climate change further optimizes temperature and rainfall conditions. In conclusion, the late growing season for soybeans is predicted to be extended.
1. Introduction
Human activities have been identified as the main cause of significant climate changes in recent years due to high greenhouse gas emissions, with CO2 being a notable contributor. Consequently, temperature increases of 3 °C to 5 °C are projected by the end of the century, while an increase of 1.5 °C above pre-industrial levels is expected to occur by mid-century [1,2]. A comprehensive understanding of how climate change affects crops is essential for safeguarding food security in the forthcoming years [3,4,5,6].
Soybean, the most widely produced oilseed and the fifth most cultivated crop globally, is particularly sensitive to climate conditions. Its growth and yield are influenced by temperature, photoperiod, and water availability. Optimal conditions for soybean development include minimum temperatures of 18 °C to 20 °C and maximum temperatures of 29 °C to 30 °C [7,8,9,10,11]. Extreme temperatures, whether too hot or too cold, limit growth and diminish crop yields [12,13,14,15,16]. More severe damage occurs at temperatures above 35 °C, particularly during the reproductive phase. The upper threshold for temperature tolerance ranges from 39 °C to 42 °C [17,18,19,20]. Basal temperatures may fluctuate depending on crop genotypes, reflecting the crops’ adaptability to varying environmental conditions [21,22,23].
The crop cycle is primarily regulated by photoperiod, with temperature serving as a moderating factor. Day length controls the progression of developmental stages and coordinates the allocation of assimilates and reproductive success [22,24,25]. Soybean is classified as a short-day (SD) plant, meaning flowering takes place only when the length of the day is shorter than the critical photoperiod [26,27,28,29,30]. Genetic adaptations were made to suit genotypes to light and climate conditions and reduce photoperiod sensitivity during the vegetative stage. The critical photoperiod for most genotypes adapted to Brazilian climate conditions spans between 13 and 14 h [20,31,32,33,34].
Photosynthetically, the soybean is a C3 plant, meaning that it can benefit from high levels of atmospheric CO2 through enhanced photosynthesis and reduced photorespiration. Therefore, an increase in atmospheric CO2 could enhance the photosynthetic rate of C3 plants. However, current atmospheric CO2 concentrations are insufficient to fully saturate the Rubisco enzyme in C3 plants like soybeans. Elevated CO2 concentrations inhibit the Rubisco oxygenase reaction, thereby reducing CO2 loss through photorespiration [35,36,37]. The C3 plants’ yield is expected to rise with the increase in atmospheric CO2 concentration [38,39,40,41,42].
Water constitutes the primary component, and the soybean crop requires between 450 and 800 mm of water. Consequently, rainfall distribution plays a crucial role in achieving high yields. The most vulnerable stages to water shortages include germination–emergence and flowering–grain filling [11,20,43,44,45]. Insufficient water in the early stages leads to poor germination, failed emergence, and seedling death, which can jeopardize the final plant population [46,47]. The peak water demand occurs during the flowering and grain-filling phases. As a result, significant yield losses are likely during grain filling, when grain quantity and weight are determined. A water deficit at flowering primarily leads to flower drop, which decreases the number of viable grains. Insufficient water during the grain-filling stage hampers photosynthesis and the movement of nutrients, reducing both the number and weight of grains [48,49,50]. The crop’s water needs vary with solar radiation and temperature, suggesting that the sowing date affects plant water usage. Additionally, the detrimental effects of water shortages are exacerbated by high temperatures [51,52,53].
Rio Grande do Sul is the southernmost state in Brazil, known for its Cfa Humid Subtropical climate featuring hot summers and four distinct seasons. Summers often see temperatures surpassing 30 °C, while winters bring cold weather with frost. Although rainfall is consistent throughout the year, it varies by season [54]. Traditionally, soybean and corn are primarily summer crops, whereas wheat, oats, canola, and livestock pastures are cultivated during winter. Rio Grande do Sul ranks among Brazil’s top soybean producers, with sowing taking place from October to late December. Over the past decade, the average yield has been 2808 kg/ha [55], which is considered low relative to the soybeans’ potential yield, primarily due to periods of water deficit that lead to significant losses [56,57,58,59].
In recent years, particularly over the last decade, there has been a trend towards earlier corn planting in Rio Grande do Sul. Farmers are increasingly choosing to plant corn in midwinter, primarily in August. Consequently, corn development mainly occurs in spring, with harvest in January. After harvesting the corn, farmers are now sowing soybeans in an effort to implement double-crop systems in response to climate change. However, the late sowing of soybeans can lead to growth outside of the ideal cultivation zone, exposing the plants to shorter photoperiods and lower solar radiation and temperatures. This double-crop approach is predominantly found in the northern and northwestern parts of Rio Grande do Sul, where the highest maximum and minimum temperatures have been recorded [60]. Additionally, the increases in maximum and minimum temperatures over the last century are more pronounced in these regions than in others. Over the past few decades, there has been a noticeable rise in rainfall, minimum temperatures, and a reduction in frost occurrences [61].
Numerous researchers have focused on understanding how climate change affects soybean. Nonetheless, every study examined soybeans planted in their optimal growing season. We argue that past and future climate changes have created favorable conditions for late-sowing soybeans in Rio Grande do Sul and will continue to do so. Therefore, this study seeks to explore the past and future effects of climate change on late-sowing soybean yields in this region. Understanding these impacts can better inform agricultural planning and adaptation strategies to mitigate the effects of climate change and ensure sustainable crop production and food security.
2. Materials and Methods
2.1. Climate Scenarios
The study site is the municipality of São Luiz Gonzaga (–28.355 °N, –54.966 °W), located in the Northwest region of Rio Grande do Sul. São Luiz Gonzaga was selected because it has daily climate data recorded on rainfall , solar radiation , maximum , and minimum temperatures from 1991 to 2020. These data constitute the “BASELINE” scenario. The data were collected from the weather station records available on the National Institute of Meteorology (INMET) website. In addition to the Baseline scenario, this study used past and future scenarios.
In developing future climate scenarios, this study utilized data from the Coupled Model Intercomparison Project (CMIP5) models, given that it was conducted before the release of CMIP6. CMIP5 atmospheric models are simulated under historical scenarios (1850–2005). Therefore, these models must incorporate Representative Concentration Pathway (RCP) scenarios. The available RCPs are (2.5, 4.5, 6.5, and 8.5), simulating scenarios ranging from low to high greenhouse gas emissions [62]. RCPs 4.5 and 8.5 were selected, representing projections of intermediate and increased CO2 emissions, respectively. Utilizing data from the chosen models allowed for the estimation of daily climate variable values until the end of the century.
The Hadley Centre Global Environment Model version 2, known as the Carbon Cycle (HadGEM2-CC) model [63], was chosen for this analysis, offering daily surface data on rainfall, maximum temperature, minimum temperature, and incident solar radiation for the period of 2041 to 2100. The HadGEM2-CC model features a horizontal resolution of 1.25° × 1.25°. The data were segmented into time periods for the mid-century (2041–2070) and the end-of-century (2071–2100), resulting in four distinct future climate scenarios: “RCP 4.5 MID”, “RCP 4.5 END”, “RCP 8.5 MID” and “RCP 8.5 END”. This model was selected for its accurate representation of future Brazilian climatic conditions, as evidenced by its application in various studies [64,65,66].
Data presented by the study of [61] were used in elaborating the “RECENT PAST” scenario. Ref. [61] reviewed 33 empirical studies on the effects of past climate change in Rio Grande do Sul and identified changes of 1.8 °C and −0.3 °C in Summer, 1.4 °C and 0.6 °C in Autumn, 0.6 °C and 0.3 °C in Winter, and 1.5 °C and 0.5 °C in Spring in the minimum and maximum temperature, respectively. In addition, rainfall changed to +48 mm during the Summer, +105 mm in the Autumn, +3 mm in the Winter, and +98 mm in the Spring. The reported changes in and occurred between 1950 and 2010, while, in , they occurred between 1936 and 2000. Such values were added to or subtracted from the daily data collected from the weather station in the Baseline scenario. For the variable, the same values as for the Baseline scenario were used.
A bias correction procedure was implemented to address potential biases due to the HadGEM2-CC model’s coarse resolution when applied at a local scale, a bias correction procedure was implemented. This procedure involved comparing the HadGEM2-CC baseline outputs with the observed INMET data for the period 1991–2020 and applying a linear scaling correction to adjust systematic discrepancies in temperature and precipitation. The corrected outputs were subsequently validated against independent observed records, ensuring an improved representation of local climatic conditions. Similar approaches have been successfully applied in regional climate studies [67,68].
The averages of annual and seasonal climate variables for all scenarios are presented in Supplementary Material Table S1. The yearly climate data were divided into 36 periods. Each month was segmented into three periods with an average of ten days each. The first monthly period starts on the 1st day and goes until the 10th, the second from the 11th to the 20th, and the third from the 21st to the last day of the month. The monthly ten-day intervals are labeled JAN.1, JAN.2, JAN.3, FEB.1, FEB.2, FEB.3, MAR.1, and so on. Consequently, the values presented for climate variables refer to a ten-day average encompassing 30 years of each scenario. In addition to climatic variables, data on climate extremes events were evaluated. Thus, the number of days with frost ( < 3 °C), with hot nights ( > 25 °C), and sweltering days ( > 35 °C) were counted. Again, the values shown refer to the average of ten-day periods over thirty years.
2.2. Crop Modeling
Crop models are advanced computational tools that utilize intricate mathematical equations to simulate the growth and yield of plants. They are divided into two categories: empirical and mechanistic models. Empirical models define the relationships between variables without considering their interrelated processes. In contrast, mechanistic models, or Process-Based Crop Models, seek to elucidate the cause-and-effect dynamics within the different systems and subsystems of the plant [69,70].
The Process-Based Crop Model, now known as crop models, functions as a dynamic simulator for crop growth. It utilizes numerical integration to represent biophysical processes with computer assistance [71]. Per [72], these models encompass equations associated with biophysical processes that estimate crop growth, development, and yield, informed by genetic and edaphoclimatic coefficients. Their popularity has surged due to their capability to efficiently and accurately analyze complex questions. Crop models are commonly employed to explore interactions between climate, soil, and plants, and they are well-equipped to evaluate the effects of climate change on commercially significant crops [70,73,74].
To assess soybean growth and yields across different climatic conditions, the CSM-CROPGRO-Soybean model was employed [75]. This model is integrated within the Decision Support System for Agrotechnology Transfer (DSSAT) platform (v. 4.8). DSSAT models can simulate interactions between calibrated soybean genotypes and various climates, soils, and management practices, utilizing a minimal set of input data [76]. The crop model has shown effectiveness in conducting these simulations, particularly regarding how different climates impact crops [77,78,79,80,81].
The data for the soil module were obtained from the study of [82]. In the municipality of São Luiz Gonzaga, the soil is identified as a typical deep soil (>200 cm) Distroferric Red Latosol, notable for its high clay content (>60%) and low sand content (<10%). As a result, the soil structure for DSSAT entry was set to a depth of 180 cm. Regarding the climate module, daily information about rainfall, solar radiation, and maximum and minimum temperatures is necessary, as previously outlined.
Crop yield was not limited by pests, diseases, weeds, soil chemistry, and management techniques but only by climate variables. Therefore, two treatments were adopted to evaluate the effects of temperature and rainfall on soybean yield separately. Treatment 1 (T1): This considers the interaction among the variables , , , , and CO2 concentration. T1 will be called attainable yield (Ay), representing what the crop’s yield can achieve under rainfed conditions. Treatment 2 (T2): This considers only the interactions between , , , and CO2 concentration. T2 does not consider the effects of rainfall limitation; that is, no water deficit was considered during the crop cycle. T2 is called the potential yield (Py) and represents the crop’s yield that can be achieved under irrigation conditions. Both treatments do not consider any agronomic management restriction. Different concentrations of atmospheric CO2 were included using the “Environmental Modifications” tool in DSSAT for the different scenarios. An atmospheric CO2 concentration of 380 ppm was considered for the Baseline and Recent Past scenarios. For future scenarios, CO2 concentrations of 495, 523, 570, and 800 ppm for RCP 4.5 MID, RCP 4.5 END, RCP 8.5 MID, and RCP 8.5 END, respectively.
2.3. Soybean Data
For the calibration of soybean genotypes, eighteen parameters must be adjusted based on the genetic traits of the selected genotypes. The input data for the soybean genotypes were sourced from the study conducted by the authors of [83]. The parameters and their corresponding values are shown in Table 1. Two soybean genotypes suitable for cultivation in Southern Brazil were selected. The genotypes are named MG6 and MG7, reflecting their maturation group (MG). These two maturation groups encompass most of the genotypes planted in Rio Grande do Sul [20].

Table 1.
Genetic input parameters for CSM-CROPGRO-Soybean for MG6 and MG7 soybean genotypes.
In addition to their maturity grouping, both genotypes were characterized regarding their responses to climatic stresses commonly observed in the region. Genotype MG6 has been reported to exhibit a moderate tolerance to early-season cold and mild drought conditions, which is beneficial for the late-sowing period, while MG7, although having a high yield potential under optimal conditions, tends to be slightly more sensitive to extreme temperature fluctuations and water stress [20,83]. These characteristics were key in selecting these genotypes for the current study, aiming to assess the impacts of climate change on soybean yield under varying climatic scenarios.
The soybean genotype and soil variables were maintained for the modeling, while the climate varied according to the scenarios described in the previous section. The following sowing dates were considered: 21/12, 01/01, 11/01, 21/01, 01/02, and 11/02. In this way, 30 years of data were modeled for each of the six climatic scenarios, in the six sowing dates, for two genotypes, and with two treatments concerning climatic restrictions, totaling 4320 yield results (diagramming 30 × 6 × 6 × 2 × 2). In addition to soybean yield, crop cycle length data were collected. Mean results were submitted to analysis of variance (ANOVA) and compared using Tuckey’s test with a 95% confidence interval.
Secondary data were gathered to expand on the theoretical figures concerning climatic variables and soybean growth. An evapotranspiration (ETm) metric typically represents water consumption. ETm accounts for total water losses to the atmosphere (as water vapor) through soil evaporation and plant respiration [84,85,86]. Data for ETm were sourced from studies conducted by the authors of [87]. During the early development phase, ETm was relatively low, with a minimum leaf area index of approximately ±2.7 mm/day. The highest water demand occurred during the flowering stage, reaching about ±7.5 mm/day. On average, ETm during the soybean cycle was ±6.1 mm/day for crops sown in December in Southern Brazil.
Air temperature influences both the length of the crop cycle and the growth of soybean plants, placing certain limitations at particular stages of development. As a result, six zones were created to demonstrate the impact of temperature on the soybean growing season. The specifications for these temperature zones were derived from empirical research. Table 2 includes information regarding the boundaries of each temperature zone, their connection to soybean development and yield, along with relevant references.
Table 2.
Parameters for the elaboration of temperature zones and their relationship with soybean development and yield.
3. Results
Sowing soybeans earlier leads to higher yields, which decline as planting is delayed across all scenarios assessed. The lowest yields were recorded under historical climatic conditions, while the Baseline scenario showed lower yields compared to all the future scenarios presented. Research suggests that both past and future climate variations are expected to boost the yields of late-sown soybeans in Southern Brazil. Notably, the lowest CO2 emission scenario yielded the highest outputs for the earliest sowing dates. In contrast, the highest yields for the latest sowing dates were found under the high emission scenario, though there is only a slight statistical difference among the future scenarios, as illustrated in Table 3. The potential yield (Py) is higher in the high CO2 emission scenario. Detailed findings regarding soybean cycle length can be found in Supplementary Material Tables S2–S5. The variables analyzed indicate a direct correlation between soybean yield and cycle length.
Table 3.
Soybean yield averages (kg/ha) for two genotypes (MG6 and MG7) in different sowing dates and climatic scenarios (T1 and T2).
The Ay and Py of soybeans rose by as much as 13% and 14%, respectively, when comparing the Recent Past to the Baseline scenario, as shown in Figure 1. The average change across both treatments was 12%. Atmospheric CO2 concentration levels were kept constant in these scenarios, thus excluding the advantages of higher CO2 levels in this analysis.
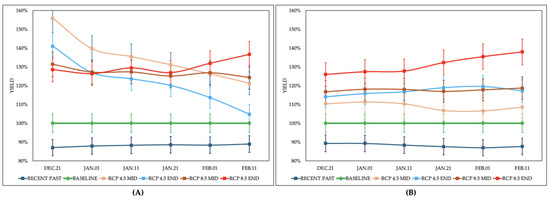
Figure 1.
Soybean yield variation (%) under different climatic scenarios compared to Baseline: (A) T1: Considering variations in rainfall, solar radiation, CO2 concentration, and maximum and minimum temperature (Ay). (B) T2: Considering variations in solar radiation, CO2 concentration, and maximum and minimum temperature (Py). Mean values of two genotypes (MG6 and MG7). Source: Values calculated by the CSM-CROPGRO-Soybean model coupled to the DSSAT platform.
Referring to Ay (Figure 1A), the average increase in future scenarios is expected to reach 28%. The yield for Ay is projected to grow more significantly than that of Py, driven by higher rainfall. Under rainfed conditions, soybean plants are likely to achieve yields closer to their maximum potential. Furthermore, the likelihood of yield losses is predicted to lessen. Early sowing may face higher risks of failure due to water shortages, especially during the flowering phase when water demand peaks. With anticipated increased rainfall, late sowings should experience less vulnerability to water stress. Additionally, water needs will decrease due to cooler temperatures and less solar radiation. The most pronounced yield enhancements for Ay are forecasted to occur during the initial sowing dates in RCP 4.5, for both mid-century and late-century scenarios. In both cases, the smallest yield increments are expected at later dates, with increases ranging from a high of 58% to a low of 5%.
The greatest increase in Py correlated with the rise in CO2 concentration in different future scenarios (Figure 1B). Among these scenarios, the average increment in Py was 19%. The most notable increase was observed in the RCP 8.5 scenario by century’s end, which averaged a 31% rise. Later sowing dates showed even larger increments, reaching up to 40%. The substantial temperature rise in this scenario likely boosted the advantages of later sowings, thereby lengthening the growing season.
The variation in rainfall patterns and amounts helps explain yield differences. As illustrated in Figure 1, the yield variation pertains to the Baseline scenario. It is crucial to understand that yields in this scenario have been greatly affected by insufficient rainfall, particularly during the early sowing periods when reproductive development coincides with drier conditions. Yield constraints from inadequate rain are clearly visible when Ay/Py ratios are examined. For MG7 and MG6 soybeans planted in DEC.21, the Ay was only 59% and 57% of the Py, respectively. In the RCP 4.5 MID and END scenarios, the Ay/Py ratios improve to 82% and 70%, marking the only and highest figures for the DEC.21 planting date. Under RCP 4.5, there are observed increases in the Ay of 58% and 54% for the middle and end of the century, respectively.
The Ay/Py ratio increases when seeding dates are postponed, with the last seeding date in the RCP 4.5 END scenarios showing an increase of up to 94%. This is due to two main reasons. First, the crop’s water requirements are better satisfied, which boosts Ay. Second, there is a significant drop in Py. Research indicates that delaying sowing shortens the crop cycle because of the photoperiod pattern. Moreover, soybeans experience lower solar radiation levels. These elements are critical in reducing the yield potential of late plantings. A shorter cycle means the plant has less time in the field to generate assimilates and dry matter, leading to a diminished Py. Employing soybean genotypes with longer cycles might help prolong the growth cycle and, in turn, improve yield.
The increase in yield was linked to improved temperature conditions throughout the growing season, demonstrated in Figure 2, along with increased rainfall, shown in Figure 3.
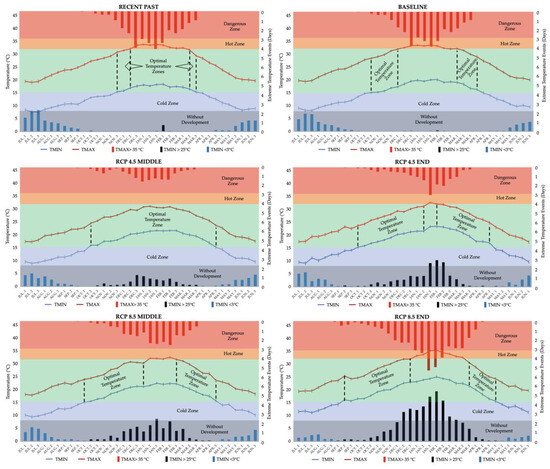
Figure 2.
Average maximum and minimum temperatures (°C) and extreme weather events (number of days of occurrence per period) for 36 periods of the year and their influence on the soybean growing season. Source: Elaborated by the author based on research data.
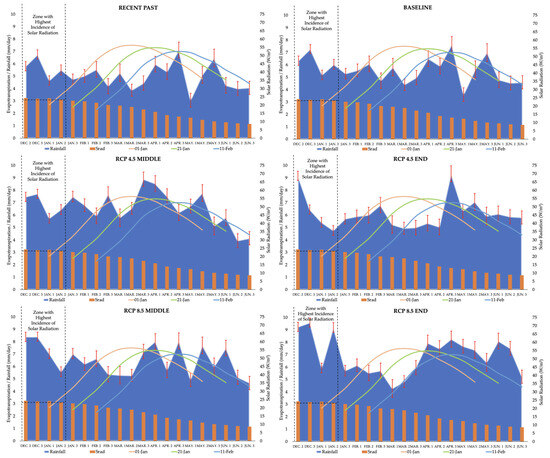
Figure 3.
Mean rainfall (mm/day) and solar radiation (W/m2) for the late soybean growing season. The soybean cycle and water demand (ETm) are demonstrated on four different sowing dates. Source: Elaborated by the author based on research data.
Other researchers’ results confirm the modeling outcomes of this study. Potential soybean yields generally rise with increasing atmospheric CO2 levels. However, earlier sowing dates might suffer damage due to the frequency of climate extremes (Figure 2). Future scenarios predict more frequent maximum temperatures over 35 °C and minimum nighttime temperatures exceeding 25 °C. January and February are identified as the peak months, while December and March are notably vulnerable to these climate extremes.
Future temperature increases, especially the minimum temperature, will elevate the optimum growing zone, particularly for late sowings, as indicated by this study. In this scenario, conditions more favorable for soybean development will emerge in the final third of the growing season. Nevertheless, the rising temperatures will notably affect sowing in the currently optimal period—October to December. During this time, flowering typically occurs from late December to February, coinciding with heightened climatic extremes of high temperatures. Consequently, understanding plant physiology and adapting genotypes and sowing dates will be essential for successful crop yields.
Complementarily, Figure 3 demonstrates that higher rainfall during the critical phases of the soybean cycle helps to offset water deficits, particularly in later sowings, thereby contributing to improved yield outcomes. These data emphasize the critical role of both the sowing date and climate factors in determining soybean yield performance, reinforcing the significance of adapting planting schedules to anticipated climatic changes.
4. Discussion
These findings are noteworthy since we have observed a significant rise in the average soybean yield over the past decades. In the 1980s, the average yield in Rio Grande do Sul was 1446 kg/ha, which is nearly half of the 2808 kg/ha harvested in the last decade [55]. This increase can largely be attributed to improved climatic conditions favorable to soybean growth. Furthermore, advancements in agricultural management practices, the enhancement of soybean genotypes, and the introduction of new technologies contributed to this progress. Recent research has linked climate change to substantial impacts on major crops worldwide. The evidence suggests that climate variation is responsible for about one-third of the global fluctuations in crop yields over recent decades. In Brazil, climate variability accounts for between 26% and 34% of the variability in soybean yields [98].
It is important to note that the yield increases reported in our study are somewhat higher than those found in a recent global meta-analysis. This discrepancy may arise from differences in model parameterization, including the assumption of optimal nutrient availability and the exclusion of pest and disease pressures, which tend to amplify the projected benefits of improved climatic conditions. Conversely, several field trials in Rio Grande do Sul have reported yield improvements under optimal management practices that are consistent with our projections, suggesting that our model captures key regional responses to climate change [99,100]. Nonetheless, variations in local agronomic practices and environmental conditions may contribute to the differences observed between global meta-analyses and our regional model outcomes.
The Ay data and average yield achieved in Rio Grande do Sul over the past decade provide deeper insights. In the Baseline scenario period (1991–2020), the average soybean yield in Rio Grande do Sul was 2155 kg/ha [55]. This figure is based on nearly all soybeans planted between October and December, which is deemed the optimal period for growth. Late sowings—until 21 January for MG7 and 11 January for MG6—under rainfed conditions (Ay) produced yields that surpassed the state average. However, with adequate water supply (Py), the yields can not only reach the state average during this period but also potentially double for the earliest planting dates.
The average yield of the MG7 genotype exceeded that of MG6 by about 10% to 11% in both Ay and Py conditions. This yield increase is partly due to the extended growth cycle of the MG7 genotype, allowing more time in the field for assimilate and dry matter production, ultimately leading to higher yields. Generally, higher MG genotypes tend to have longer cycles when planted on the same dates. However, delayed sowing results in shorter cycles, regardless of the MG. In delayed plantings, soybeans grow outside their optimal photoperiod, which is impacted by low light conditions (shorter days). As a result, these plants often flower sooner and mature more quickly [101]. It is crucial to understand that crop yield in field conditions is influenced by many factors, not solely the growth cycle.
The study of [102] examined several maturation groups (MGs 4.8 to 7.8) during late sowings (1 January and 22 January) in Rio Grande do Sul. They found a significant reduction in cycle length between the two sowing dates, with genotypes exhibiting higher MGs resulting in longer cycles. The highest yields were recorded on the first sowing date, with MGs 6.7 and 6.3 achieving yields of 3853 and 3802 kg/ha, respectively. For the second sowing date, MG 6.3 was identified as the most productive, yielding 3516 kg/ha. These findings highlight the yield potential associated with these sowing dates. The researchers noted that the soybean crop cycle in 2019 received 521 mm of rain, evenly distributed without any signs of water shortage. The yield reported by the authors of [102] surpasses those from this modeling study under rainfed conditions (Ay). However, the average yield documented in this study covers a span of 30 years, not just a single year. During sowings on 15 January, research by [103] yielded results between 1475 and 2294 kg/ha while testing new genotypes, indicating that soybean yields fell short of the average reported in this study under these conditions. Thus, selecting cultivars suited for late sowing is essential for achieving satisfactory yields.
Most genotypes recommended for cultivation in Rio Grande do Sul under the Agroclimatic Risk Zoning (ZARC) framework belong to MGs 5 and 6. For late planting, soybean genotypes with longer cycles should be considered. Creating genotypes suited for these planting times can lead to increased yields [103,104]. The primary challenge for very long cycle genotypes is the low temperatures experienced at the onset of winter and the risk of frosts. As shown in Figure 2, the likelihood of frost, though low, starts to rise in late April. This risk is expected to diminish as climate change advances. As highlighted in Supplementary Material Table S1, the most considerable increase will be in minimum temperatures, which will provide more favorable conditions for the final stages of grain filling.
Numerous studies have demonstrated the positive impacts of higher atmospheric CO2 levels on C3 plants, including soybeans. Findings suggest improvements in photosynthetic assimilation, growth rates, leaf and branch counts, as well as overall biomass and yield [105,106,107,108,109,110,111,112,113]. While increased CO2 enhances carbon assimilation and soybean growth, the projected gains may be constrained by nutrient availability and the incidence of pests and diseases. Plant responses to elevated CO2 depend on the adequate supply of nutrients like nitrogen, phosphorus, and potassium, which were not considered in the modeling. Additionally, changes in climate and CO2 levels may alter pest and pathogen dynamics, potentially offsetting the expected benefits. Therefore, these factors should be considered when interpreting the impacts of CO2 on soybean yield.
However, yield advantages are projected to continue increasing, at least until CO2 concentrations approach 1000 ppm [114]. Typically, evaluations utilize chamber experiments that regulate CO2 levels. For instance, the authors of [115] found that soybeans experienced a 150% rise in photosynthetic rates during the reproductive phase when comparing CO2 levels of 330 and 660 ppm, leading to a 44% boost in grain weight. A meta-analysis conducted by the authors of [116] of empirical studies with CO2 ranges from 450 to 1250 ppm, averaging 689 ppm, revealed increases of 39% in CO2 assimilation, 59% in photosynthetic rates, 37% in dry matter weight, and 24% in grain yield.
High temperatures adversely affect soybean plants in various ways. A key concern is the decrease in net photosynthesis. At extreme temperatures, the respiratory rate of plants increases significantly, leading to a reduction in Pn [8,17,90,117,118]. Moreover, high temperatures are associated with intensified solar radiation. This increase in solar radiation during the day promotes a higher gross fixation rate, which helps offset Pn losses [23,119]. Nevertheless, excessively high nighttime temperatures do not provide this balancing effect, resulting in direct declines in Pn. Elevated nighttime respiration rates have been frequently connected to crop yield losses. Extended periods of high nighttime temperatures can shorten the crop cycle and worsen losses [119,120]. During the reproductive stage, elevated nighttime temperatures are linked to decreased grain weight [121,122].
Beyond the impact on net photosynthesis, severe damage can arise at very high temperatures (>35 °C). The reproductive phase is more susceptible to heat stress than the vegetative phase. In the vegetative stage, harm is linked to diminished plant growth and a reduced leaf and branch production rate, as indicated by the Leaf area index (LAI) [23,119,123,124,125,126].
High temperatures during the reproductive stage lead to fewer pods and grains, reduced grain weight, and lower yield. These consequences stem from pollen infeasibility, flower abortion, decreased assimilation rates, and shortened growth periods [118,127,128]. The effects of heat stress and tolerance vary across plant growth stages, with thermal tolerance being higher in the vegetative stage compared to the reproductive stage [18,129,130].
Our research corresponds with the observations made by [83]. On average, soybean yields under rainfed conditions rise by 16% in Brazil’s leading production areas. Notably, the largest yield growth is anticipated in the Southern region, where increases have surpassed 60%. This is corroborated by studies [131,132,133,134], which reported positive variations exceeding 50%. In contrast, the studies of [39,135,136] observed smaller yield improvements in the Southern region, with some yields remaining stable and others increasing by about 25%. Research conducted by [137] investigated the potential for soybean yield reduction in future scenarios, which differs from our results. However, they overlooked the direct impact of increased atmospheric CO2 levels on plant growth. Still, they observed yield increases across all projected scenarios.
The challenge of limited solar radiation availability is complex. Late sowing times, marked by lower photoperiods, reduced solar radiation, and cooler temperatures, lead to stunted vegetative growth, fewer branches, and a lower LAI. A reduced LAI limits the capture of whatever minimal solar radiation is present, decreasing both assimilate production and overall yields during the flowering and grain-filling stages [18,138,139].
Alongside the advantages of elevated atmospheric CO2 levels for soybean growth previously discussed, it is crucial to recognize that rising CO2 concentrations necessitate improved water efficiency in soybeans as stomatal conductance decreases [116]. Research conducted by [140] indicated a 16% drop in soybean evapotranspiration at a CO2 level of 550 ppm. As a result, soybean crops are anticipated to become more adept at utilizing water, potentially leading to enhanced yields for rainfed crops. This forecasted increase in rainfall in the Southern region of Brazil could help reduce crop losses stemming from inadequate rainfall. At present, rainfall patterns are the main limiting factor for rainfed crops in Southern Brazil [141].
5. Conclusions
The climatic data reveal a rise in rainfall and temperatures, especially in the minimum temperatures in Southern Brazil. Historical climate shifts have led to more favorable conditions for late-sown soybean growth and yield for this area. This trend is anticipated to continue throughout this century, based on climate change models. Climate change is expected to enhance temperature and humidity conditions for late-sown soybeans at the projected levels. As a result, the late growing season is likely to be prolonged. Furthermore, net photosynthesis is expected to increase due to higher atmospheric CO2 levels. Extreme warming is likely to be most pronounced in January and February, coinciding with the vegetative stage of late-sown crops, during which the risk of damage from extreme heat is reduced. Conversely, sowings in the optimal planting window of October to December could face challenges, as flowering is expected to align with heightened climatic extremes characterized by elevated temperatures.
Soybean Py steadily increased alongside rising atmospheric CO2 levels. The most pronounced rise in Ay is expected in the RCP 4.5 scenarios for the earliest sowing dates in the mid-to-late century. A comparable pattern was noted in the growth cycle, where delays in sowing led to yield reductions. The MG7 genotype outperformed MG6 in yields. Generally, cultivars with extended growth cycles yield more in late sowings. However, low temperatures and frost at the cycle’s end can threaten yield. These risks should be mitigated if climate conditions align with future forecasts. It was noted that, during the earliest sowing dates in the Recent Past and under the Baseline scenario, water shortages considerably lowered yield. Future climate scenarios should better accommodate the water needs of crops.
In recent decades, soybeans harvested in Rio Grande do Sul have yielded less than expected, even considering water shortages during early planting. However, yields could potentially double if optimal water conditions are met, which are anticipated to become more frequent in the future. This indicates that, with effective management, farmers can still achieve good soybean yields from late plantings. It is essential to comprehend the climate–plant interactions, and selecting the right soybean varieties and sowing dates will be crucial for maximizing yield potential. Nonetheless, further field studies are needed to better understand how genotypes interact with the environment in late sowings. Future research should also evaluate the effects of climate extremes, especially high temperatures, on soybeans planted within the current ideal growth window of October to December, as data suggest possible crop damage.
Supplementary Materials
The following supporting information can be downloaded at https://www.mdpi.com/article/10.3390/crops5020020/s1, Table S1: Averages of annual and seasonal climate variables for different climate scenarios in São Luiz Gonzaga—RS; Table S2: Dates of flowering (FL), physiological maturity (PM), harvest maturity (HM), and their maximum (max.) and minimum (min.) variations for soybean in different climate scenarios. Simulations limited by Tmax, Tmin, Srad, and CO2 (T2/Py) for the MG7 genotype.; Table S3: Dates of flowering (FL), physiological maturity (PM), harvest maturity (HM), and their maximum (max.) and minimum (min.) variations for soybean in different climate scenarios. Simulations limited by Rain, Tmax, Tmin, Srad, and CO2 (T1/Ay), for the MG7 genotype.; Table S4: Dates of flowering (FL), physiological maturity (PM), harvest maturity (HM), and their maximum (max.) and minimum (min.) variations for soybean in different climate scenarios. Simulations limited by Tmax, Tmin, Srad, and CO2 (T2/Py) for the MG6 genotype.; and Table S5: Dates of flowering (FL), physiological maturity (PM), harvest maturity (HM), and their maximum (max.) and minimum (min.) variations for soybean in different climate scenarios. Simulations limited by Rain, Tmax, Tmin, Srad, and CO2 (T1/Ay), for the MG6 genotype.
Author Contributions
Conceptualization, T.B. and E.T.; methodology, T.B. and E.T.; validation, T.B. and E.T.; formal analysis, T.B. and E.T.; investigation, T.B. and E.T.; resources, T.B. and E.T.; data curation, T.B.; writing—original draft preparation, T.B.; writing—review and editing, T.B. and E.T.; visualization, T.B. and E.T.; supervision, E.T.; funding acquisition, E.T. All authors have read and agreed to the published version of the manuscript.
Funding
This work was funded by the National Council for Scientific and Technological Development under Grant Number 302517/2022-7 and Coordination of Higher Education Personnel Improvement—CAPES fellowship grant 88887.614573/2021. The APC was funded by National Council for Scientific and Technological Development.
Data Availability Statement
The raw data supporting the conclusions of this article will be made available by the authors upon request.
Conflicts of Interest
The authors declare no conflicts of interest.
Abbreviations
The following abbreviations are used in this manuscript:
| ANOVA | Analysis of variance |
| ATP | Adenosine triphosphate |
| Ay | Achievable yield |
| CC | Carbon cycle |
| CERES | Crop Environment Resource Synthesis |
| Cfa | Humid subtropical climate |
| CMIP | Coupled Model Intercomparison Project |
| CO2 | Carbon dioxide |
| CROPGRO | Crop growth model |
| CSDL | Critical short-day length |
| CSM | Crop simulation model |
| DSSAT | Decision Support System for Agrotechnology Transfer |
| EMFL | Time between plant emergence and flower appearance |
| END | End of century |
| ETm | Evapotranspiration metric |
| FLLF | Time between first flower and end of leaf expansion |
| FLSD | Time between first flower and first seed |
| FLSH | Time between first flower and first pod |
| HadGEM2 | Hadley Centre Global Environment Model |
| INMET | National Institute of Meteorology |
| LAI | Leaf area index |
| LFMAX | Maximum leaf photosynthesis |
| MG | Maturation group |
| MID | Middle of century |
| Pn | Net photosynthesis |
| PODUR | Time required for the cultivar to reach the final pod load under optimal conditions |
| PPSEN | The slope of the relative response of development to photoperiod |
| Py | Potential yield |
| Rain | Rainfall |
| RCP | Representative Concentration Pathway |
| SD | Short day |
| SDLIP | Fraction oil in seeds (g(oil)/g(seed)) |
| SDPDV | Average seed per pod under standard growing conditions |
| SDPM | Time between first seed and physiological maturity |
| SDPRO | Fraction protein in seeds (g(protein)/g(seed)) |
| SFDUR | Seed filling duration for pod cohort |
| SIZLF | Maximum size of full leaf (three leaflets) |
| SLAVR | Specific leaf area |
| Srad | Solar radiation |
| THRSH | Threshing percentage, the maximum seed ratio (seed + shell) at maturity |
| Tmax | Maximum temperature |
| Tmin | Minimum temperature |
| W | Watts |
| WTPSD | Maximum weight per seed |
| XFRT | Maximum fraction of daily growth that is portioned to seed and shell |
| ZARC | Agroclimatic Risk Zoning |
References
- Werndl, C. On Defining Climate and Climate Change. Br. J. Philos. Sci. 2016, 67, 337–364. [Google Scholar] [CrossRef]
- IPCC. Global Warming of 1.5 °C: An IPCC Special Report on the Impacts of Global Warming of 1.5 °C Above Pre-Industrial Levels and Related Global Greenhouse Gas Emission Pathways, in the Context of Strengthening the Global Response to the Threat of Climate Change; Masson-Delmotte, V., Zhai, P., Pörtner, H.-O., Roberts, D., Skea, J., Shukla, P.R., Pirani, A., Moufouma-Okia, W., Péan, C., Pidcock, R., Eds.; Intergovernmental Panel on Climate Change (IPCC): Geneva, Switzerland, 2018. [Google Scholar]
- Lobell, D.B.; Bänziger, M.; Magorokosho, C.; Vivek, B. Nonlinear Heat Effects on African Maize as Evidenced by Historical Yield Trials. Nat. Clim. Change 2011, 1, 42–45. [Google Scholar] [CrossRef]
- Olesen, J.E.; Trnka, M.; Kersebaum, K.C.; Skjelvåg, A.O.; Seguin, B.; Peltonen-Sainio, P.; Rossi, F.; Kozyra, J.; Micale, F. Impacts and Adaptation of European Crop Production Systems to Climate Change. Eur. J. Agron. 2011, 34, 96–112. [Google Scholar] [CrossRef]
- Wheeler, T.; von Braun, J. Climate Change Impacts on Global Food Security. Science 1979 2013, 341, 508–513. [Google Scholar] [CrossRef]
- Osborne, T.M.; Wheeler, T.R. Evidence for a Climate Signal in Trends of Global Crop Yield Variability over the Past 50 Years. Environ. Res. Lett. 2013, 8, 024001. [Google Scholar] [CrossRef]
- Sionit, N.; Strain, B.R.; Flint, E.P. Interaction of Temperature and CO2 Enrichment on Soybean: Photosynthesis and Seed Yield. Can. J. Plant Sci. 1987, 67, 629–636. [Google Scholar] [CrossRef]
- Zhang, L.; Zhu, L.; Yu, M.; Zhong, M. Warming Decreases Photosynthates and Yield of Soybean [Glycine max (L.) Merrill] in the North China Plain. Crop J. 2016, 4, 139–146. [Google Scholar] [CrossRef]
- Zhao, C.; Liu, B.; Piao, S.; Wang, X.; Lobell, D.B.; Huang, Y.; Huang, M.; Yao, Y.; Bassu, S.; Ciais, P.; et al. Temperature Increase Reduces Global Yields of Major Crops in Four Independent Estimates. Proc. Natl. Acad. Sci. USA 2017, 114, 9326–9331. [Google Scholar] [CrossRef]
- Farias, J.R.B.; Neumaier, N.; Nepomuceno, A.L. Soja. In Agrometeorologia dos Cultivos: O Fator Meteorológico na Produção Agrícola; Monteiro, J.E.B.A., Ed.; INMET: Brasilia, Brazil, 2009; Volume 1, pp. 263–277. [Google Scholar]
- Farias, J.R.B.; Nepomuceno, A.L.; Neumaier, N. Ecofisiologia Da Soja. Circ. Técnica 2007, 48, 1–9. [Google Scholar]
- Heino, M.; Kinnunen, P.; Anderson, W.; Ray, D.K.; Puma, M.J.; Varis, O.; Siebert, S.; Kummu, M. Increased Probability of Hot and Dry Weather Extremes during the Growing Season Threatens Global Crop Yields. Sci. Rep. 2023, 13, 3583. [Google Scholar] [CrossRef]
- Luo, Q. Temperature Thresholds and Crop Production: A Review. Clim. Change 2011, 109, 583–598. [Google Scholar] [CrossRef]
- Hossain, Z.; Khatoon, A.; Komatsu, S. Soybean Proteomics for Unraveling Abiotic Stress Response Mechanism. J. Proteome Res. 2013, 12, 4670–4684. [Google Scholar] [CrossRef] [PubMed]
- Siebert, S.; Webber, H.; Rezaei, E.E. Weather Impacts on Crop Yields—Searching for Simple Answers to a Complex Problem. Environ. Res. Lett. 2017, 12, 081001. [Google Scholar] [CrossRef]
- Schauberger, B.; Archontoulis, S.; Arneth, A.; Balkovic, J.; Ciais, P.; Deryng, D.; Elliott, J.; Folberth, C.; Khabarov, N.; Müller, C.; et al. Consistent Negative Response of US Crops to High Temperatures in Observations and Crop Models. Nat. Commun. 2017, 8, 13931. [Google Scholar] [CrossRef]
- Gibson, L.R.; Mullen, R.E. Influence of Day and Night Temperature on Soybean Seed Yield. Crop Sci. 1996, 36, 98–104. [Google Scholar] [CrossRef]
- Setiyono, T.D.; Weiss, A.; Specht, J.; Bastidas, A.M.; Cassman, K.G.; Dobermann, A. Understanding and Modeling the Effect of Temperature and Daylength on Soybean Phenology under High-Yield Conditions. Field Crops Res. 2007, 100, 257–271. [Google Scholar] [CrossRef]
- Hatfield, J.L.; Boote, K.J.; Kimball, B.A.; Ziska, L.H.; Izaurralde, R.C.; Ort, D.; Thomson, A.M.; Wolfe, D. Climate Impacts on Agriculture: Implications for Crop Production. Agron. J. 2011, 103, 351–370. [Google Scholar] [CrossRef]
- Sentelhas, P.C.; Battisti, R. Clima e Produtividade da Soja: Efeitos Nas Produtividades Potencial, Atingível e Real; Boletim de Pesquisa: Rondonópolis, Brazil, 2015. [Google Scholar]
- Boote, K.J. Improving Soybean Cultivars for Adaptation to Climate Change and Climate Variability. In Crop Adaptation to Climate Change; Wiley: Hoboken, NJ, USA, 2011; pp. 370–395. [Google Scholar]
- Wu, T.; Li, J.; Wu, C.; Sun, S.; Mao, T.; Jiang, B.; Hou, W.; Han, T. Analysis of the Independent- and Interactive-Photo-Thermal Effects on Soybean Flowering. J. Integr. Agric. 2015, 14, 622–632. [Google Scholar] [CrossRef]
- Choi, D.-H.; Ban, H.-Y.; Seo, B.-S.; Lee, K.-J.; Lee, B.-W. Phenology and Seed Yield Performance of Determinate Soybean Cultivars Grown at Elevated Temperatures in a Temperate Region. PLoS ONE 2016, 11, e0165977. [Google Scholar] [CrossRef]
- Zhang, L.; Wang, R.; Hesketh, J.D. Effects of Photoperiod on Growth and Development of Soybean Floral Bud in Different Maturity. Agron. J. 2001, 93, 944–948. [Google Scholar] [CrossRef]
- Kantolic, A.G.; Slafer, G.A. Development and Seed Number in Indeterminate Soybean as Affected by Timing and Duration of Exposure to Long Photoperiods after Flowering. Ann. Bot. 2007, 99, 925–933. [Google Scholar] [CrossRef] [PubMed]
- Mathew, J.P.; Herbert, S.J.; Zhang, S.; Rautenkranz, A.A.F.; Litchfield, G.V. Differential Response of Soybean Yield Components to the Timing of Light Enrichment. Agron. J. 2000, 92, 1156–1161. [Google Scholar] [CrossRef]
- Watanabe, S.; Harada, K.; Abe, J. Genetic and Molecular Bases of Photoperiod Responses of Flowering in Soybean. Breed. Sci. 2012, 61, 531–543. [Google Scholar] [CrossRef] [PubMed]
- Xu, M.; Yamagishi, N.; Zhao, C.; Takeshima, R.; Kasai, M.; Watanabe, S.; Kanazawa, A.; Yoshikawa, N.; Liu, B.; Yamada, T.; et al. The Soybean-Specific Maturity Gene E1 Family of Floral Repressors Controls Night-Break Responses through Down-Regulation of Flowering Locus T Orthologs. Plant Physiol. 2015, 168, 1735–1746. [Google Scholar] [CrossRef]
- Mao, T.; Li, J.; Wen, Z.; Wu, T.; Wu, C.; Sun, S.; Jiang, B.; Hou, W.; Li, W.; Song, Q.; et al. Association Mapping of Loci Controlling Genetic and Environmental Interaction of Soybean Flowering Time under Various Photo-Thermal Conditions. BMC Genom. 2017, 18, 415. [Google Scholar] [CrossRef]
- Yang, W.; Wu, T.; Zhang, X.; Song, W.; Xu, C.; Sun, S.; Hou, W.; Jiang, B.; Han, T.; Wu, C. Critical Photoperiod Measurement of Soybean Genotypes in Different Maturity Groups. Crop Sci. 2019, 59, 2055–2061. [Google Scholar] [CrossRef]
- Câmara, G.M.S.; Sediyama, T.; Dourado-Neto, D.; Bernardes, M.S. Influence of Photoperiod and Air Temperature on the Growth, Flowering and Maturation of Soybean (Glycine max (L.) Merrill). Sci. Agric. 1997, 54, 149–154. [Google Scholar] [CrossRef]
- Rodrigues, O.; Didonet, A.D.; Lhamby, J.C.B.; Bertagnolli, P.F.; da Luz, J.S. Resposta Quantitativa Do Florescimento Da Soja à Temperatura e Ao Fotoperíodo. Pesqui. Agrop. Bras. 2001, 36, 431–437. [Google Scholar] [CrossRef]
- Fietz, C.R.; Rangel, M.A.S. Época de Semeadura Da Soja Para a Região de Dourados-MS, Com Base Na Deficiência Hídrica e No Fotoperíodo. Eng. Agríc. 2008, 28, 666–672. [Google Scholar] [CrossRef]
- Lin, X.; Liu, B.; Weller, J.L.; Abe, J.; Kong, F. Molecular Mechanisms for the Photoperiodic Regulation of Flowering in Soybean. J. Integr. Plant Biol. 2021, 63, 981–994. [Google Scholar] [CrossRef]
- Sharkey, T.D. Evaluating the Role of Rubisco Regulation in Photosynthesis of C3 Plants. Philos. Trans. R. Soc. London B Biol. Sci. 1989, 323, 435–448. [Google Scholar] [CrossRef]
- Parry, M.A.J.; Madgwick, P.J.; Carvalho, J.F.C.; Andralojc, P.J. Prospects for Increasing Photosynthesis by Overcoming the Limitations of Rubisco. J. Agric. Sci. 2007, 145, 31–43. [Google Scholar] [CrossRef]
- Qu, Y.; Mueller-Cajar, O.; Yamori, W. Improving Plant Heat Tolerance through Modification of Rubisco Activase in C3 Plants to Secure Crop Yield and Food Security in a Future Warming World. J. Exp. Bot. 2023, 74, 591–599. [Google Scholar] [CrossRef] [PubMed]
- Reddy, A.R.; Rasineni, G.K.; Raghavendra, A.S. The Impact of Global Elevated CO2 Concentration on Photosynthesis and Plant Productivity. Curr. Sci. 2010, 99, 46–57. [Google Scholar]
- Pires, G.F.; Abrahão, G.M.; Brumatti, L.M.; Oliveira, L.J.C.; Costa, M.H.; Liddicoat, S.; Kato, E.; Ladle, R.J. Increased Climate Risk in Brazilian Double Cropping Agriculture Systems: Implications for Land Use in Northern Brazil. Agric. Meteorol. 2016, 228–229, 286–298. [Google Scholar] [CrossRef]
- Engineer, C.B.; Hashimoto-Sugimoto, M.; Negi, J.; Israelsson-Nordström, M.; Azoulay-Shemer, T.; Rappel, W.-J.; Iba, K.; Schroeder, J.I. CO2 Sensing and CO2 Regulation of Stomatal Conductance: Advances and Open Questions. Trends Plant Sci. 2016, 21, 16–30. [Google Scholar] [CrossRef]
- Hampf, A.C.; Stella, T.; Berg-Mohnicke, M.; Kawohl, T.; Kilian, M.; Nendel, C. Future Yields of Double-Cropping Systems in the Southern Amazon, Brazil, under Climate Change and Technological Development. Agric. Syst. 2020, 177, 102707. [Google Scholar] [CrossRef]
- Han, Y.; Wang, J.; Zhang, Y.; Wang, S. Effects of Regulated Deficit Irrigation and Elevated CO2 Concentration on the Photosynthetic Parameters and Stomatal Morphology of Two Maize Cultivars. J. Plant Growth Regul. 2023, 42, 2884–2892. [Google Scholar] [CrossRef]
- Eck, H.V.; Mathers, A.C.; Musick, J.T. Plant Water Stress at Various Growth Stages and Growth and Yield of Soybeans. Field Crops Res. 1987, 17, 1–16. [Google Scholar] [CrossRef]
- Di Mauro, G.; Borrás, L.; Rugeroni, P.; Rotundo, J.L. Exploring Soybean Management Options for Environments with Contrasting Water Availability. J. Agron. Crop Sci. 2019, 205, 274–282. [Google Scholar] [CrossRef]
- Wang, X.; Wu, Z.; Zhou, Q.; Wang, X.; Song, S.; Dong, S. Physiological Response of Soybean Plants to Water Deficit. Front. Plant Sci. 2022, 12, 809692. [Google Scholar] [CrossRef]
- Haffez, Y.; Iqbal, S.; Jabben, K.; Shahzad, S.; Jahan, S.; Rasul, F. Effect of Biochar Application on Seed Germination and Seedling Growth of Glicine max (L.) Merr. under Drought Stress. Pak. J. Bot. 2017, 49, 7–13. [Google Scholar]
- Lamichhane, J.R.; Constantin, J.; Schoving, C.; Maury, P.; Debaeke, P.; Aubertot, J.-N.; Dürr, C. Analysis of Soybean Germination, Emergence, and Prediction of a Possible Northward Establishment of the Crop under Climate Change. Eur. J. Agron. 2020, 113, 125972. [Google Scholar] [CrossRef]
- De Souza, P.I.; Egli, D.B.; Bruening, W.P. Water Stress during Seed Filling and Leaf Senescence in Soybean. Agron. J. 1997, 89, 807–812. [Google Scholar] [CrossRef]
- Sadeghipour, O.; Abbasi, S. Soybean Response to Drought and Seed Inoculation. World Appl. Sci. J. 2012, 17, 55–60. [Google Scholar]
- Du, Y.; Zhao, Q.; Chen, L.; Yao, X.; Xie, F. Effect of Drought Stress at Reproductive Stages on Growth and Nitrogen Metabolism in Soybean. Agronomy 2020, 10, 302. [Google Scholar] [CrossRef]
- Ergo, V.V.; Lascano, R.; Vega, C.R.C.; Parola, R.; Carrera, C.S. Heat and Water Stressed Field-Grown Soybean: A Multivariate Study on the Relationship between Physiological-Biochemical Traits and Yield. Environ. Exp. Bot. 2018, 148, 1–11. [Google Scholar] [CrossRef]
- Jumrani, K.; Bhatia, V.S. Interactive Effect of Temperature and Water Stress on Physiological and Biochemical Processes in Soybean. Physiol. Mol. Biol. Plants 2019, 25, 667–681. [Google Scholar] [CrossRef]
- Vital, R.G.; Müller, C.; Freire, F.B.S.; Silva, F.B.; Batista, P.F.; Fuentes, D.; Rodrigues, A.A.; Moura, L.M.F.; Daloso, D.M.; Silva, A.A.; et al. Metabolic, Physiological and Anatomical Responses of Soybean Plants under Water Deficit and High Temperature Condition. Sci. Rep. 2022, 12, 16467. [Google Scholar] [CrossRef]
- Alvares, C.A.; Stape, J.L.; Sentelhas, P.C.; de Moraes Gonçalves, J.L.; Sparovek, G. Köppen’s Climate Classification Map for Brazil. Meteorol. Z 2013, 22, 711–728. [Google Scholar] [CrossRef]
- CONAB. Séries Históricas das Safras: Soja. Available online: https://www.conab.gov.br/info-agro/safras/serie-historica-das-safras/itemlist/category/911-soja (accessed on 30 March 2025).
- Berlato, M.A.; Fontana, D.C. Variabilidade Interanual Da Precipitação Pluvial e Rendimento Da Soja No Estado Do Rio Grande Do Sul. Rev. Bras. Agrometeorol. 1999, 7, 119–125. [Google Scholar]
- Berlato, M.A.; Farenzena, H.; Fontana, D.C. Associação Entre El Niño Oscilação Sul e a Produtividade Do Milho No Estado Do Rio Grande Do Sul. Pesqui. Agrop. Bras. 2005, 40, 423–432. [Google Scholar] [CrossRef]
- Matzenauer, R.; Radin, B.; Maluf, J.R.T. O Fenômeno ENOS e o Regime de Chuvas No Rio Grande Do Sul. Agrometeoros 2018, 25, 323–331. [Google Scholar] [CrossRef]
- Pilau, F.G.; Marin, F.R.; Grubert, D.A.d.V.; Dalmago, G.A.; Romanelli, T.L. Impact of ENSO-Related Rainfall Variability on Soybean Yield in the State of Rio Grande Do Sul, Brazil. Agrometeoros 2022, 30, e027115. [Google Scholar] [CrossRef]
- Wrege, M.S.; Steinmetz, S.; Reisser Júnior, C.; Almeida, I.R. Ce Atlas Climático da Região Sul do Brasil: Estados do Paraná, Santa Catarina e Rio Grande do Sul, 2nd ed.; Embrapa: Brasilia, Brazil, 2012; Volume 1, ISBN 978-85-7035-013-8.
- Berlato, M.A.; Cordeiro, A.P.A. Sinais de Mudanças Climáticas Globais e Regionais, Projeções Para o Século XXI e as Tendências Observadas No Rio Grande Do Sul: Uma Revisão. Agrometeoros 2018, 25, 273–302. [Google Scholar] [CrossRef]
- Taylor, K.E.; Stouffer, R.J.; Meehl, G.A. An Overview of CMIP5 and the Experiment Design. Bull. Am. Meteorol. Soc. 2012, 93, 485–498. [Google Scholar] [CrossRef]
- Bellouin, N.; Collins, W.J.; Culverwell, I.D.; Halloran, P.R.; Hardiman, S.C.; Hinton, T.J.; Jones, C.D.; McDonald, R.E.; McLaren, A.J.; O’Connor, F.M.; et al. The HadGEM2 Family of Met Office Unified Model Climate Configurations. Geosci. Model. Dev. 2011, 4, 723–757. [Google Scholar] [CrossRef]
- Yin, L.; Fu, R.; Shevliakova, E.; Dickinson, R.E. How Well Can CMIP5 Simulate Precipitation and Its Controlling Processes over Tropical South America? Clim. Dyn. 2013, 41, 3127–3143. [Google Scholar] [CrossRef]
- Dai, A. Increasing Drought under Global Warming in Observations and Models. Nat. Clim. Change 2013, 3, 52–58. [Google Scholar] [CrossRef]
- Monteiro, A.F.M.; Torres, R.R.; Martins, F.B.; Marrafon, V.H.d.A. Climate Change Impacts on Evapotranspiration in Brazil: A Multi-Model Assessment. Theor. Appl. Clim. 2024, 155, 5363–5373. [Google Scholar] [CrossRef]
- Teutschbein, C.; Seibert, J. Bias Correction of Regional Climate Model Simulations for Hydrological Climate-Change Impact Studies: Review and Evaluation of Different Methods. J. Hydrol. 2012, 456–457, 12–29. [Google Scholar] [CrossRef]
- Maraun, D.; Shepherd, T.G.; Widmann, M.; Zappa, G.; Walton, D.; Gutiérrez, J.M.; Hagemann, S.; Richter, I.; Soares, P.M.M.; Hall, A.; et al. Towards Process-Informed Bias Correction of Climate Change Simulations. Nat. Clim. Change 2017, 7, 764–773. [Google Scholar] [CrossRef]
- Dourado-Neto, D.; Teruel, D.A.; Reichardt, K.; Nielsen, D.R.; Frizzone, J.A.; Bacchi, O.O.S. Principles of Crop Modeling and Simulation: I. Uses of Mathematical Models in Agricultural Science. Sci. Agric. 1998, 55, 46–50. [Google Scholar] [CrossRef]
- Wallach, D.; Makowski, D.; Jones, J.W.; Brun, F. Working with Dynamic Crop Models: Methods, Tools and Examples for Agriculture and Environment, 3rd ed.; Elsevier: Amsterdam, The Netherlands, 2019; Volume 1, ISBN 9780128117569. [Google Scholar]
- Sinclair, T.R.; Seligman, N.G. Crop Modeling: From Infancy to Maturity. Agron. J. 1996, 88, 698–704. [Google Scholar] [CrossRef]
- Monteith, J.L. The Quest for Balance in Crop Modeling. Agron. J. 1996, 88, 695–697. [Google Scholar] [CrossRef]
- Acock, B.; Acock, M.C. Potential for Using Long-Term Field Research Data to Develop and Validate Crop Simulators. Agron. J. 1991, 83, 56–61. [Google Scholar] [CrossRef]
- Rosenzweig, C.; Jones, J.W.; Hatfield, J.L.; Ruane, A.C.; Boote, K.J.; Thorburn, P.; Antle, J.M.; Nelson, G.C.; Porter, C.; Janssen, S.; et al. The Agricultural Model Intercomparison and Improvement Project (AgMIP): Protocols and Pilot Studies. Agric. Meteorol. 2013, 170, 166–182. [Google Scholar] [CrossRef]
- Boote, K.J.; Jones, J.W.; Hoogenboom, G. Simulation of Crop Growth: CROPGRO Model. In Agricultural Systems Modeling and Simulation; Peart, R.M., Shoup, W.D., Eds.; CRC Press: Boca Raton, FL, USA, 2018; Volume 1, pp. 651–692. [Google Scholar]
- Jones, J.W.; Hoogenboom, G.; Porter, C.H.; Boote, K.J.; Batchelor, W.D.; Hunt, L.A.; Wilkens, P.W.; Singh, U.; Gijsman, A.J.; Ritchie, J.T. The DSSAT Cropping System Model. Eur. J. Agron. 2003, 18, 235–265. [Google Scholar] [CrossRef]
- Babel, M.S.; Turyatunga, E. Evaluation of Climate Change Impacts and Adaptation Measures for Maize Cultivation in the Western Uganda Agro-Ecological Zone. Theor. Appl. Clim. 2015, 119, 239–254. [Google Scholar] [CrossRef]
- Lin, Y.; Wu, W.; Ge, Q. CERES-Maize Model-based Simulation of Climate Change Impacts on Maize Yields and Potential Adaptive Measures in Heilongjiang Province, China. J. Sci. Food Agric. 2015, 95, 2838–2849. [Google Scholar] [CrossRef]
- Chisanga, C.B.; Phiri, E.; Chinene, V.R.N. Evaluating APSIM-and-DSSAT-CERES-Maize Models under Rainfed Conditions Using Zambian Rainfed Maize Cultivars. Nitrogen 2021, 2, 392–414. [Google Scholar] [CrossRef]
- Jiang, R.; He, W.; He, L.; Yang, J.Y.; Qian, B.; Zhou, W.; He, P. Modelling Adaptation Strategies to Reduce Adverse Impacts of Climate Change on Maize Cropping System in Northeast China. Sci. Rep. 2021, 11, 810. [Google Scholar] [CrossRef]
- Feleke, H.G.; Savage, M.; Tesfaye, K. Calibration and Validation of APSIM–Maize, DSSAT CERES–Maize and AquaCrop Models for Ethiopian Tropical Environments. S. Afr. J. Plant Soil 2021, 38, 36–51. [Google Scholar] [CrossRef]
- Santos, H.G.; Jacomine, P.K.T.; dos Anjos, L.H.C.; de Oliveira, V.Á.; Lumbreras, J.F.; Coelho, M.R.; de Almeida, J.A.; de Araújo Filho, J.C.; de Oliveira, J.B.; Cunha, T.J.F. Sistema Brasileiro de Classificação de Solos, 5th ed.; Embrapa: Brasilia, Brazil, 2018; Volume 1, ISBN 9788570358004. [Google Scholar]
- Figueiredo Moura da Silva, E.H.; Silva Antolin, L.A.; Zanon, A.J.; Soares Andrade, A.; Antunes de Souza, H.; dos Santos Carvalho, K.; Aparecido Vieira, N.; Marin, F.R. Impact Assessment of Soybean Yield and Water Productivity in Brazil Due to Climate Change. Eur. J. Agron. 2021, 129, 126329. [Google Scholar] [CrossRef]
- Doorenbos, J.; Pruitt, W.O. Las Necesidades de Agua de los Cultivos, 1st ed.; FAO: Rome, Italy, 1976; Volume 1, ISBN 9789253001361. [Google Scholar]
- Berlato, M.A.; Molion, L.C.B. Evaporação e Evapotranspiração, 1st ed.; Instituto de Pesquisas Agronômicas–IPAGRO: Porto Alegre, Brazil, 1981; Volume 1. [Google Scholar]
- Fontana, D.C. Determinação Da Evapotranspiração. In Agrometeorologia Aplicada à Irrigação; Bergamaschi, H., Ed.; Editora da UFRGS: Porto Alegre, Brazil, 1992; Volume 1, pp. 48–61. [Google Scholar]
- Berlato, M.A.; Matzenauer, R.; Bermagamaschi, H. Evapotranspiração Máxima Da Soja e Relações Com a Evapotranspiração Calculada Pela Equação de Penman, Evaporação Do Tanque “Classe A” e Radiação Solar Global. Agron. Sulriograndense 1986, 22, 243–259. [Google Scholar]
- Thomas, J.F.; Raper, D., Jr. Morphological Response of Soybeans as Governed by Photoperiod, Temperature, and Age at Treatment. Bot. Gaz. 1977, 138, 321–328. [Google Scholar] [CrossRef]
- Thomas, J.F.; Raper, C.D. Effect of Day and Night Temperatures During Floral Induction on Morphology of Soybeans1. Agron. J. 1978, 70, 893–898. [Google Scholar] [CrossRef]
- Boote, K.J.; Pickering, N.B.; Allen, L.H. Plant Modeling: Advances and Gaps in Our Capability to Predict Future Crop Growth and Yield in Response to Global Climate Change. In Advances in Carbon Dioxide Effects Research; Wiley: Hoboken, NJ, USA, 2015; pp. 179–228. [Google Scholar]
- Hesketh, J.D.; Myhre, D.L.; Willey, C.R. Temperature Control of Time Intervals Between Vegetative and Reproductive Events in Soybeans1. Crop Sci. 1973, 13, 250–254. [Google Scholar] [CrossRef]
- Hume, D.J.; Jackson, A.K.H. Pod Formation in Soybeans at Low Temperatures1. Crop Sci. 1981, 21, 933–937. [Google Scholar] [CrossRef]
- Boote, K.J.; Allen, L.H.; Prasad, P.V.V.; Baker, J.T.; Gesch, R.W.; Snyder, A.M.; Pan, D.; Thomas, J.M.G. Elevated Temperature and CO2 Impacts on Pollination, Reproductive Growth, and Yield of Several Globally Important Crops. J. Agric. Meteorol. 2005, 60, 469–474. [Google Scholar] [CrossRef]
- Salem, M.A.; Kakani, V.G.; Koti, S.; Reddy, K.R. Pollen-Based Screening of Soybean Genotypes for High Temperatures. Crop Sci. 2007, 47, 219–231. [Google Scholar] [CrossRef]
- Pan, D. Soybean Responses to Elevated Temperature and Doubled CO2. Ph.D. Thesis, University of Florida, Gainesville, FL, USA, 1996. [Google Scholar]
- Thomas, J.M.G. Impact of Elevated Temperature and Carbon Dioxide on Development and Composition of Soybean Seed. Ph.D. Thesis, University of Florida, Gainesville, FL, USA, 2001. [Google Scholar]
- Hatfield, J.L.; Dold, C. Climate Change Impacts on Corn Phenology and Productivity. In Corn-Production and Human Health in Changing Climate; Amanullah, Fahad, S., Eds.; InTech: Rijeka, Croatia, 2018. [Google Scholar]
- Ray, D.K.; Gerber, J.S.; MacDonald, G.K.; West, P.C. Climate Variation Explains a Third of Global Crop Yield Variability. Nat. Commun. 2015, 6, 5989. [Google Scholar] [CrossRef] [PubMed]
- Boff de Oliveira, Z.; Eduardo Knies, A. Produtividade de Cultivares de Soja No Ano Agrícola 2020/21 Com e Sem Irrigação Suplementar Em Três Épocas de Semeadura Na Região Central Do RS. Rev. Bras. Eng. Biossistemas 2021, 15, 561–576. [Google Scholar] [CrossRef]
- Oliveira, Z.B.; Spies, V.M.; da Silva, C.E.; Baranzelli, L.F.; Costa, M.d.S.; Rathke, B. Estimativa e Espacialização Da Produtividade Final Da Soja Em Anos de La Niña No Rio Grande Do Sul. Ciência Nat. 2024, 46, e86829. [Google Scholar] [CrossRef]
- Zanon, A.J.; Streck, N.A.; Richter, G.L.; Becker, C.C.; da Rocha, T.S.M.; Cera, J.C.; Winck, J.E.M.; Cardoso, Â.P.; Tagliapietra, E.L.; Weber, P.S. Contribuição Das Ramificações e a Evolução Do Índice de Área Foliar Em Cultivares Modernas de Soja. Bragantia 2015, 74, 279–290. [Google Scholar] [CrossRef]
- Bubans, V.E.; Carvalho, I.R.; Ceolin, C.; Moura, N.B.; Lautenchleger, F.; Conceição, G.M.; Da Silva, J.A.G.; Treter, R.J.R. Relative Maturity Group and Its Relationships with the Non Preferential Sowing Season of Soybean. Agron. Sci. Biotechnol. 2021, 7, 1–14. [Google Scholar] [CrossRef]
- Meier, C.; Meira, D.; Olivoto, T.; Follmann, D.N.; Nardino, M.; Carvalho, I.R.; Ferrari, M.; de Pelegrin, A.J.; Szareski, V.; de Souza, V.Q. Morphological Traits and Yield Components of Second-Crop Soybeans in Rio Grande Do Sul State, Brazil. Aust. J. Basic Appl. Sci. 2016, 10, 81–88. [Google Scholar]
- Follmann, D.N.; Cargnelutti Filho, A.; Queiróz de Souza, V.; Nardino, M.; Carvalho, I.R.; Demari, G.H.; Ferrari, M.; de Pelegrin, A.J.; Szareski, V.J. Relações Lineares Entre Caracteres de Soja Safrinha. Rev. Ciências Agrárias 2017, 40, 213–221. [Google Scholar] [CrossRef]
- Allen, L.H.; Boote, K.J.; Jones, J.W.; Jones, P.H.; Valle, R.R.; Acock, B.; Rogers, H.H.; Dahlman, R.C. Response of Vegetation to Rising Carbon Dioxide: Photosynthesis, Biomass, and Seed Yield of Soybean. Glob. Biogeochem. Cycles 1987, 1, 1–14. [Google Scholar] [CrossRef]
- Teramura, A.H.; Sullivan, J.H.; Ziska, L.H. Interaction of Elevated Ultraviolet-B Radiation and CO2 on Productivity and Photosynthetic Characteristics in Wheat, Rice, and Soybean. Plant Physiol. 1990, 94, 470–475. [Google Scholar] [CrossRef]
- Vu, J.C.V.; Allen, L.H.; Boote, K.J.; Bowes, G. Effects of Elevated CO 2 and Temperature on Photosynthesis and Rubisco in Rice and Soybean. Plant Cell Environ. 1997, 20, 68–76. [Google Scholar] [CrossRef]
- Ziska, L.H. The Impact of Elevated CO2 on Yield Loss from a C3 and C4 Weed in Field-grown Soybean. Glob. Change Biol. 2000, 6, 899–905. [Google Scholar] [CrossRef]
- Bunce, J.A. Use of the Response of Photosynthesis to Oxygen to Estimate Mesophyll Conductance to Carbon Dioxide in Water-stressed Soybean Leaves. Plant Cell Environ. 2009, 32, 875–881. [Google Scholar] [CrossRef]
- Bunce, J.A. Limitations to Soybean Photosynthesis at Elevated Carbon Dioxide in Free-Air Enrichment and Open Top Chamber Systems. Plant Sci. 2014, 226, 131–135. [Google Scholar] [CrossRef]
- Ahmed, M.; Ahmad, S. Carbon Dioxide Enrichment and Crop Productivity. In Agronomic Crops; Springer: Singapore, 2019; pp. 31–46. [Google Scholar]
- Soba, D.; Shu, T.; Runion, G.B.; Prior, S.A.; Fritschi, F.B.; Aranjuelo, I.; Sanz-Saez, A. Effects of Elevated [CO2] on Photosynthesis and Seed Yield Parameters in Two Soybean Genotypes with Contrasting Water Use Efficiency. Environ. Exp. Bot. 2020, 178, 104154. [Google Scholar] [CrossRef]
- Song, Q.; Srinivasan, V.; Long, S.P.; Zhu, X.-G. Decomposition Analysis on Soybean Productivity Increase under Elevated CO2 Using 3-D Canopy Model Reveals Synergestic Effects of CO2 and Light in Photosynthesis. Ann. Bot. 2020, 126, 601–614. [Google Scholar] [CrossRef]
- Drag, D.W.; Slattery, R.; Siebers, M.; DeLucia, E.H.; Ort, D.R.; Bernacchi, C.J. Soybean Photosynthetic and Biomass Responses to Carbon Dioxide Concentrations Ranging from Pre-Industrial to the Distant Future. J. Exp. Bot. 2020, 71, 3690–3700. [Google Scholar] [CrossRef]
- Campbell, W.J.; Allen, L.H.; Bowes, G. Effects of CO2 Concentration on Rubisco Activity, Amount, and Photosynthesis in Soybean Leaves. Plant Physiol. 1988, 88, 1310–1316. [Google Scholar] [CrossRef]
- Ainsworth, E.A.; Davey, P.A.; Bernacchi, C.J.; Dermody, O.C.; Heaton, E.A.; Moore, D.J.; Morgan, P.B.; Naidu, S.L.; Yoo Ra, H.; Zhu, X.; et al. A Meta-analysis of Elevated [CO2] Effects on Soybean (Glycine max) Physiology, Growth and Yield. Glob. Change Biol. 2002, 8, 695–709. [Google Scholar] [CrossRef]
- Jones, R.J.; Quattar, S.; Crookston, R.K. Thermal Environment During Endosperm Cell Division and Grain Filling in Maize: Effects on Kernel Growth and Development in Vitro1. Crop Sci. 1984, 24, 133–137. [Google Scholar] [CrossRef]
- Djanaguiraman, M.; Prasad, P.V.V.; Boyle, D.L.; Schapaugh, W.T. Soybean Pollen Anatomy, Viability and Pod Set under High Temperature Stress. J. Agron. Crop Sci. 2013, 199, 171–177. [Google Scholar] [CrossRef]
- Lin, T.; Okamoto, Y.; Nagasaki, Y.; Shiraiwa, T. The Influence of High Night Temperature on Yield and Physiological Attributes of Soybean Cv. Fukuyutaka. Plant Prod. Sci. 2021, 24, 267–278. [Google Scholar] [CrossRef]
- Yang, L.; Song, W.; Xu, C.; Sapey, E.; Jiang, D.; Wu, C. Effects of High Night Temperature on Soybean Yield and Compositions. Front. Plant Sci. 2023, 14, 1065604. [Google Scholar] [CrossRef] [PubMed]
- Song, W.; Yang, R.; Wu, T.; Wu, C.; Sun, S.; Zhang, S.; Jiang, B.; Tian, S.; Liu, X.; Han, T. Analyzing the Effects of Climate Factors on Soybean Protein, Oil Contents, and Composition by Extensive and High-Density Sampling in China. J. Agric. Food Chem. 2016, 64, 4121–4130. [Google Scholar] [CrossRef]
- Nakagawa, A.C.S.; Ario, N.; Tomita, Y.; Tanaka, S.; Murayama, N.; Mizuta, C.; Iwaya-Inoue, M.; Ishibashi, Y. High Temperature during Soybean Seed Development Differentially Alters Lipid and Protein Metabolism. Plant Prod. Sci. 2020, 23, 504–512. [Google Scholar] [CrossRef]
- Tenorio, F.M.; Specht, J.E.; Arkebauer, T.J.; Eskridge, K.M.; Graef, G.L.; Grassini, P. Co-Ordination between Primordium Formation and Leaf Appearance in Soybean (Glycine max) as Influenced by Temperature. Field Crops Res. 2017, 210, 197–206. [Google Scholar] [CrossRef]
- Kronenberg, L.; Yates, S.; Ghiasi, S.; Roth, L.; Friedli, M.; Ruckle, M.E.; Werner, R.A.; Tschurr, F.; Binggeli, M.; Buchmann, N.; et al. Rethinking Temperature Effects on Leaf Growth, Gene Expression and Metabolism: Diel Variation Matters. Plant Cell Environ. 2021, 44, 2262–2276. [Google Scholar] [CrossRef]
- Burroughs, C.H.; Montes, C.M.; Moller, C.A.; Mitchell, N.G.; Michael, A.M.; Peng, B.; Kimm, H.; Pederson, T.L.; Lipka, A.E.; Bernacchi, C.J.; et al. Reductions in Leaf Area Index, Pod Production, Seed Size, and Harvest Index Drive Yield Loss to High Temperatures in Soybean. J. Exp. Bot. 2023, 74, 1629–1641. [Google Scholar] [CrossRef]
- Allen, L.H.; Zhang, L.; Boote, K.J.; Hauser, B.A. Elevated Temperature Intensity, Timing, and Duration of Exposure Affect Soybean Internode Elongation, Mainstem Node Number, and Pod Number per Plant. Crop J. 2018, 6, 148–161. [Google Scholar] [CrossRef]
- Puteh, A.B.; ThuZar, M.; Mondal, M.M.A.; Abdullah, N.A.P.B.; Halim, M.R.A. Soybean [Glycine max (L.) Merrill] Seed Yield Response to High Temperature Stress during Reproductive Growth Stages. Aust. J. Crop Sci. 2013, 7, 1472–1479. [Google Scholar]
- Tacarindua, C.R.P.; Shiraiwa, T.; Homma, K.; Kumagai, E.; Sameshima, R. The Effects of Increased Temperature on Crop Growth and Yield of Soybean Grown in a Temperature Gradient Chamber. Field Crops Res. 2013, 154, 74–81. [Google Scholar] [CrossRef]
- Siebers, M.H.; Yendrek, C.R.; Drag, D.; Locke, A.M.; Rios Acosta, L.; Leakey, A.D.B.; Ainsworth, E.A.; Bernacchi, C.J.; Ort, D.R. Heat Waves Imposed during Early Pod Development in Soybean (Glycine max) Cause Significant Yield Loss despite a Rapid Recovery from Oxidative Stress. Glob. Change Biol. 2015, 21, 3114–3125. [Google Scholar] [CrossRef] [PubMed]
- Thomey, M.L.; Slattery, R.A.; Köhler, I.H.; Bernacchi, C.J.; Ort, D.R. Yield Response of Field-grown Soybean Exposed to Heat Waves under Current and Elevated [CO2]. Glob. Change Biol. 2019, 25, 4352–4368. [Google Scholar] [CrossRef] [PubMed]
- Travasso, M.I.; Magrin, G.O.; Baethgen, W.E.; Castaño, J.P.; Rodriguez, G.R.; Pires, J.L.; Gimenez, A.; Cunha, G.; Fernandes, M. Adaptation Measures for Maize and Soybean in Southeastern South America; AIACC: Washington, DC, USA, 2006. [Google Scholar]
- Justino, F.; Oliveira, E.C.; Rodrigues, R.d.Á.; Gonçalves, P.H.L.; Souza, P.J.O.P.; Stordal, F.; Marengo, J.; da Silva, T.G.; Delgado, R.C.; Lindemann, D.d.S.; et al. Mean and Interannual Variability of Maize and Soybean in Brazil under Global Warming Conditions. Am. J. Clim. Change 2013, 2, 237–253. [Google Scholar] [CrossRef]
- Cera, J.C.; Streck, N.A.; Fensterseifer, C.A.J.; Ferraz, S.E.T.; Bexaira, K.P.; Silveira, W.B.; Cardoso, Â.P. Soybean Yield in Future Climate Scenarios for the State of Rio Grande Do Sul, Brazil. Pesqui. Agrop. Bras. 2017, 52, 380–392. [Google Scholar] [CrossRef]
- da Silva, V.d.P.R.; Silva, R.A.; Maciel, G.F.; de Souza, E.P.; Braga, C.C.; de Holanda, R.M. Soybean Yield in the Matopiba Region under Climate Changes. Rev. Bras. Eng. Agrícola Ambient. 2020, 24, 8–14. [Google Scholar] [CrossRef]
- Minuzzi, R.B.; Frederico, C.d.A.; da Silva, T.G.F. Estimation of Soybean Agronomic Performance in Climatic Scenarios for Southern Brazil. Rev. Ceres 2017, 64, 567–573. [Google Scholar] [CrossRef][Green Version]
- Battisti, R.; Sentelhas, P.C.; Parker, P.S.; Nendel, C.; Câmara, G.M.D.S.; Farias, J.R.B.; Basso, C.J. Assessment of Crop-Management Strategies to Improve Soybean Resilience to Climate Change in Southern Brazil. Crop Pasture Sci. 2018, 69, 154. [Google Scholar] [CrossRef]
- do Rio, A.; Sentelhas, P.C.; Farias, J.R.B.; Sibaldelli, R.N.R.; Ferreira, R.C. Alternative Sowing Dates as a Mitigation Measure to Reduce Climate Change Impacts on Soybean Yields in Southern Brazil. Int. J. Climatol. 2016, 36, 3664–3672. [Google Scholar] [CrossRef]
- Zanon, A.J.; Streck, N.A.; Grassini, P. Climate and Management Factors Influence Soybean Yield Potential in a Subtropical Environment. Agron. J. 2016, 108, 1447–1454. [Google Scholar] [CrossRef]
- Santachiara, G.; Borrás, L.; Rotundo, J.L. Physiological Processes Leading to Similar Yield in Contrasting Soybean Maturity Groups. Agron. J. 2017, 109, 158–167. [Google Scholar] [CrossRef]
- Bernacchi, C.J.; Kimball, B.A.; Quarles, D.R.; Long, S.P.; Ort, D.R. Decreases in Stomatal Conductance of Soybean under Open-Air Elevation of [CO2] Are Closely Coupled with Decreases in Ecosystem Evapotranspiration. Plant Physiol. 2007, 143, 134–144. [Google Scholar] [CrossRef]
- Battisti, R.; Sentelhas, P.C. Drought Tolerance of Brazilian Soybean Cultivars Simulated by a Simple Agrometeorological Yield Model. Exp. Agric. 2015, 51, 285–298. [Google Scholar] [CrossRef]
Disclaimer/Publisher’s Note: The statements, opinions and data contained in all publications are solely those of the individual author(s) and contributor(s) and not of MDPI and/or the editor(s). MDPI and/or the editor(s) disclaim responsibility for any injury to people or property resulting from any ideas, methods, instructions or products referred to in the content. |
© 2025 by the authors. Licensee MDPI, Basel, Switzerland. This article is an open access article distributed under the terms and conditions of the Creative Commons Attribution (CC BY) license (https://creativecommons.org/licenses/by/4.0/).