Lodging Variability in Sorghum Stalks Is Dependent on the Biomechanical and Chemical Composition of the Stalk Rinds


Abstract
1. Introduction
2. Results and Discussion
2.1. Micro-Biomechanical Bending Tests
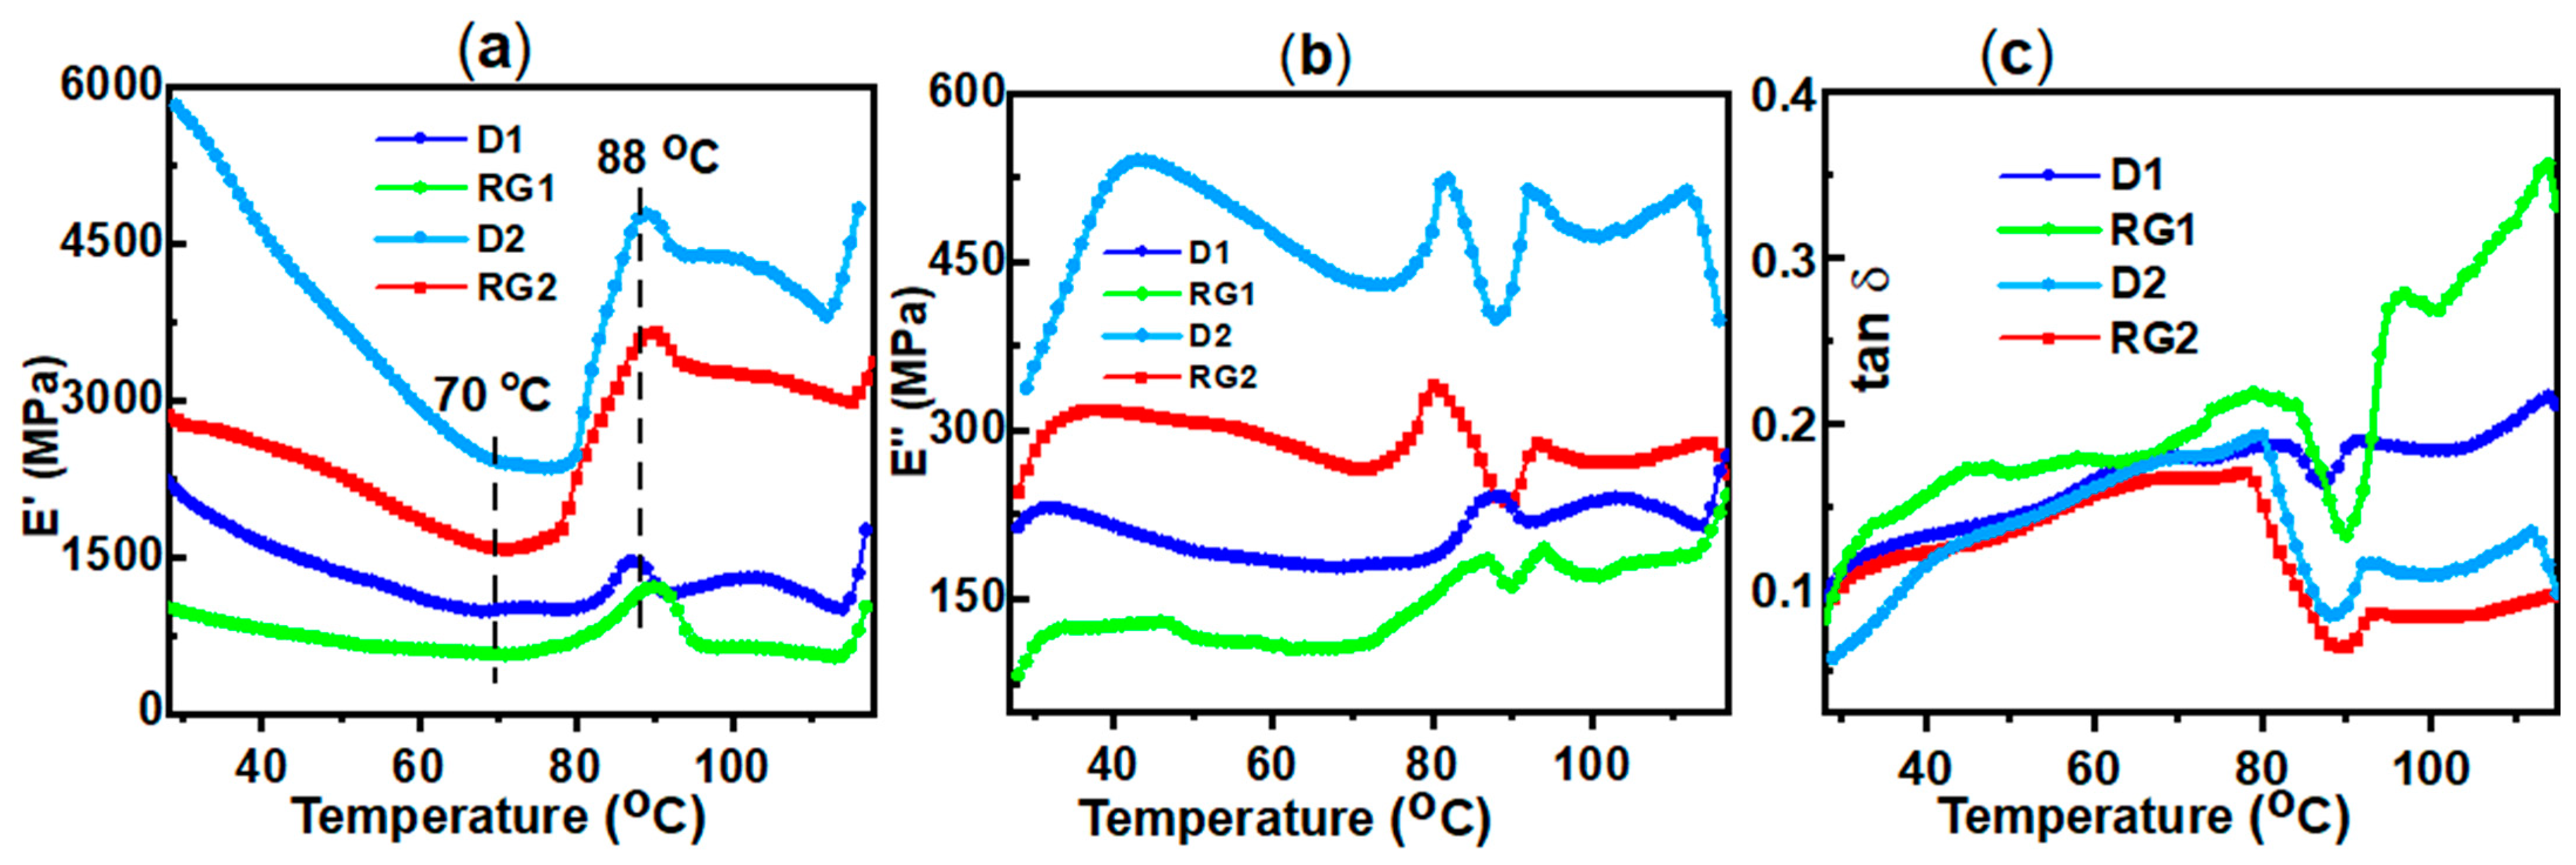
2.2. Viscoelastic Properties
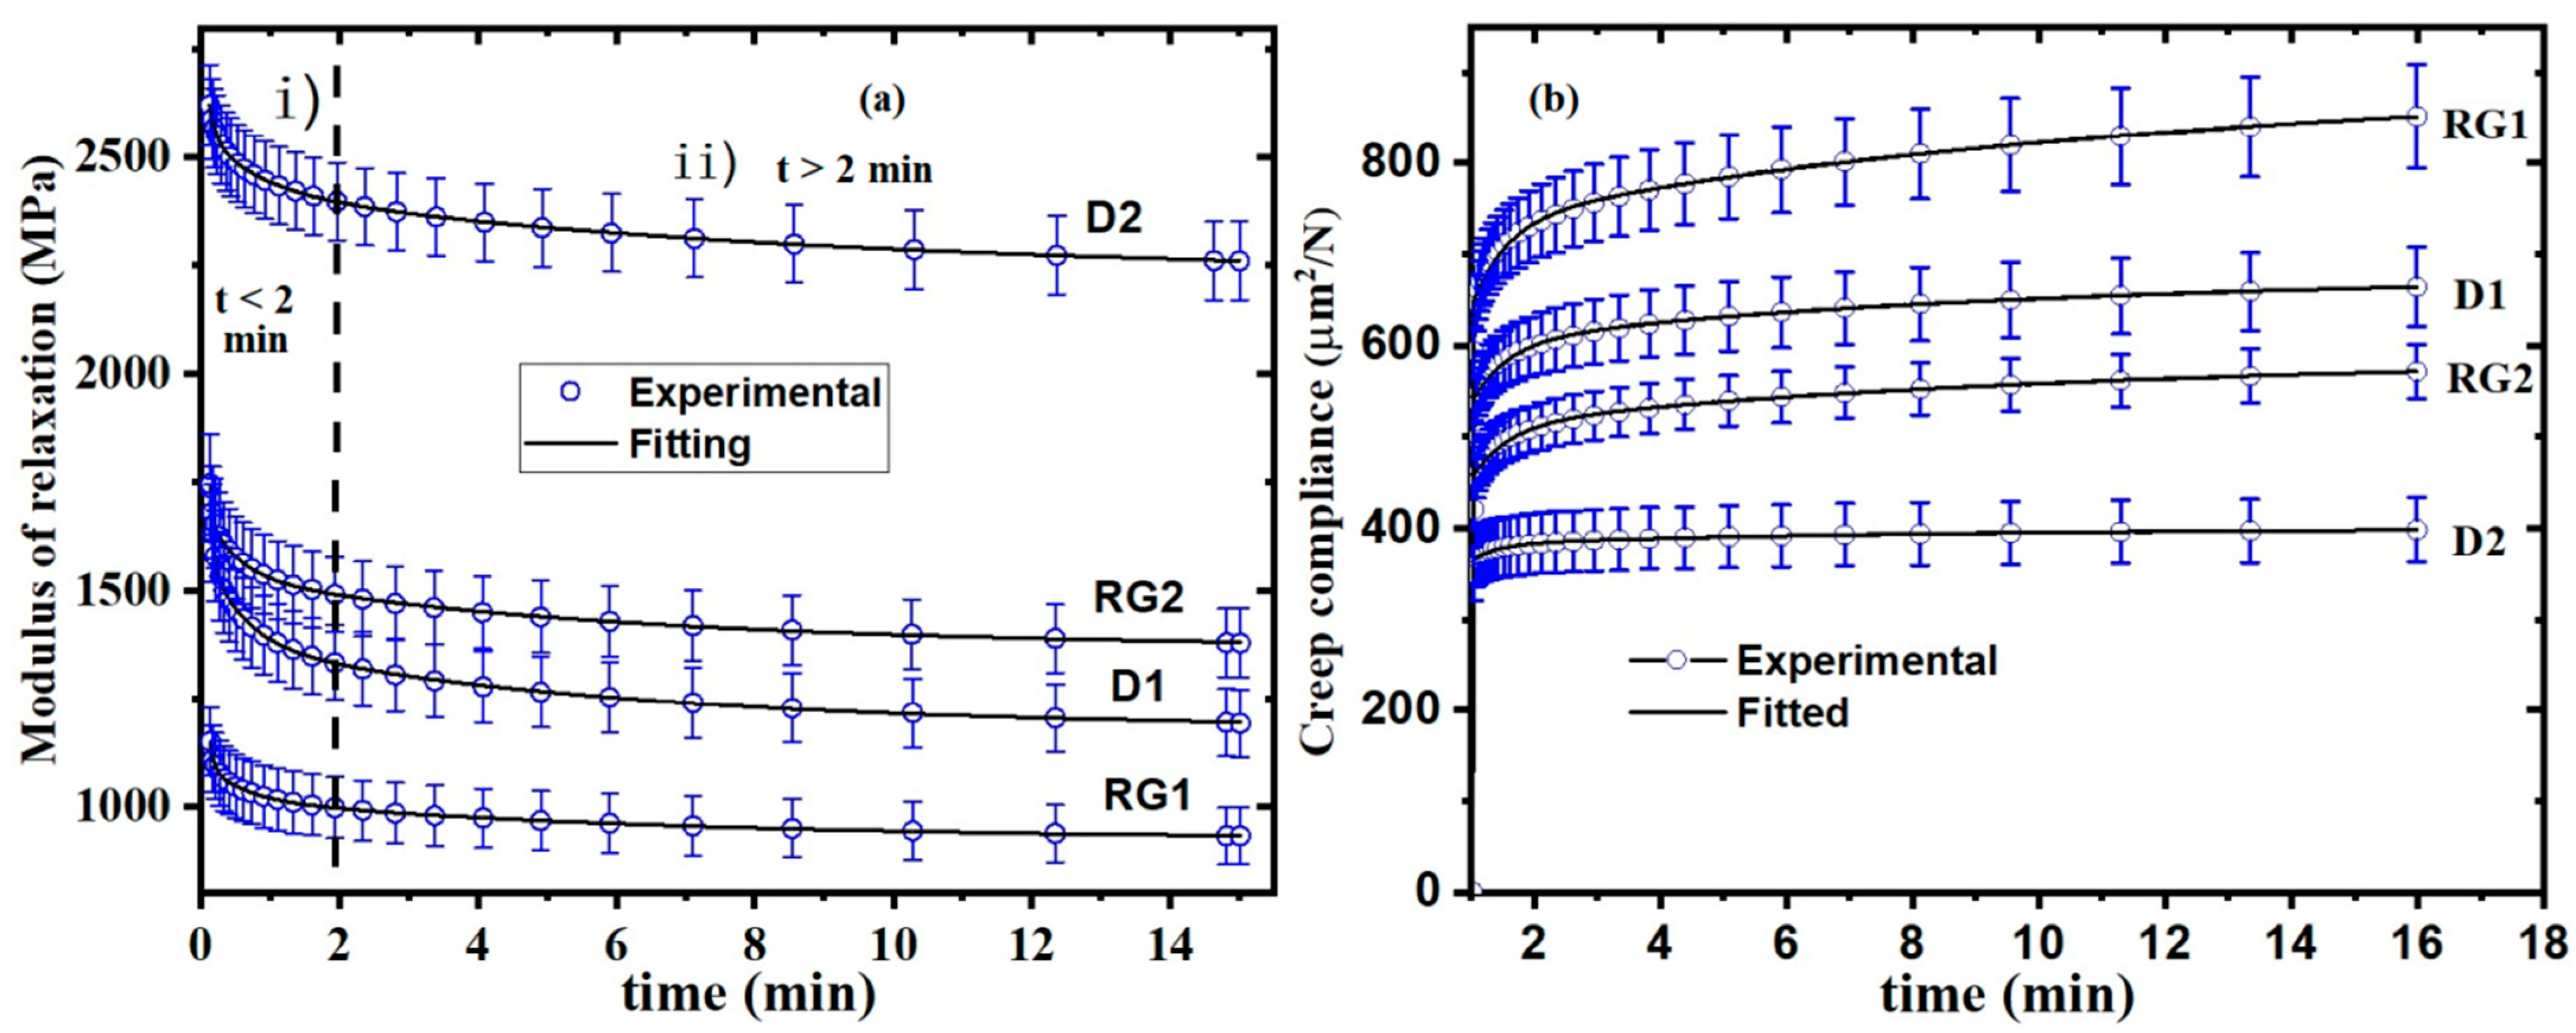
2.3. Stress Relaxation in Stalk Rind
2.4. Creep Behavior of Rinds
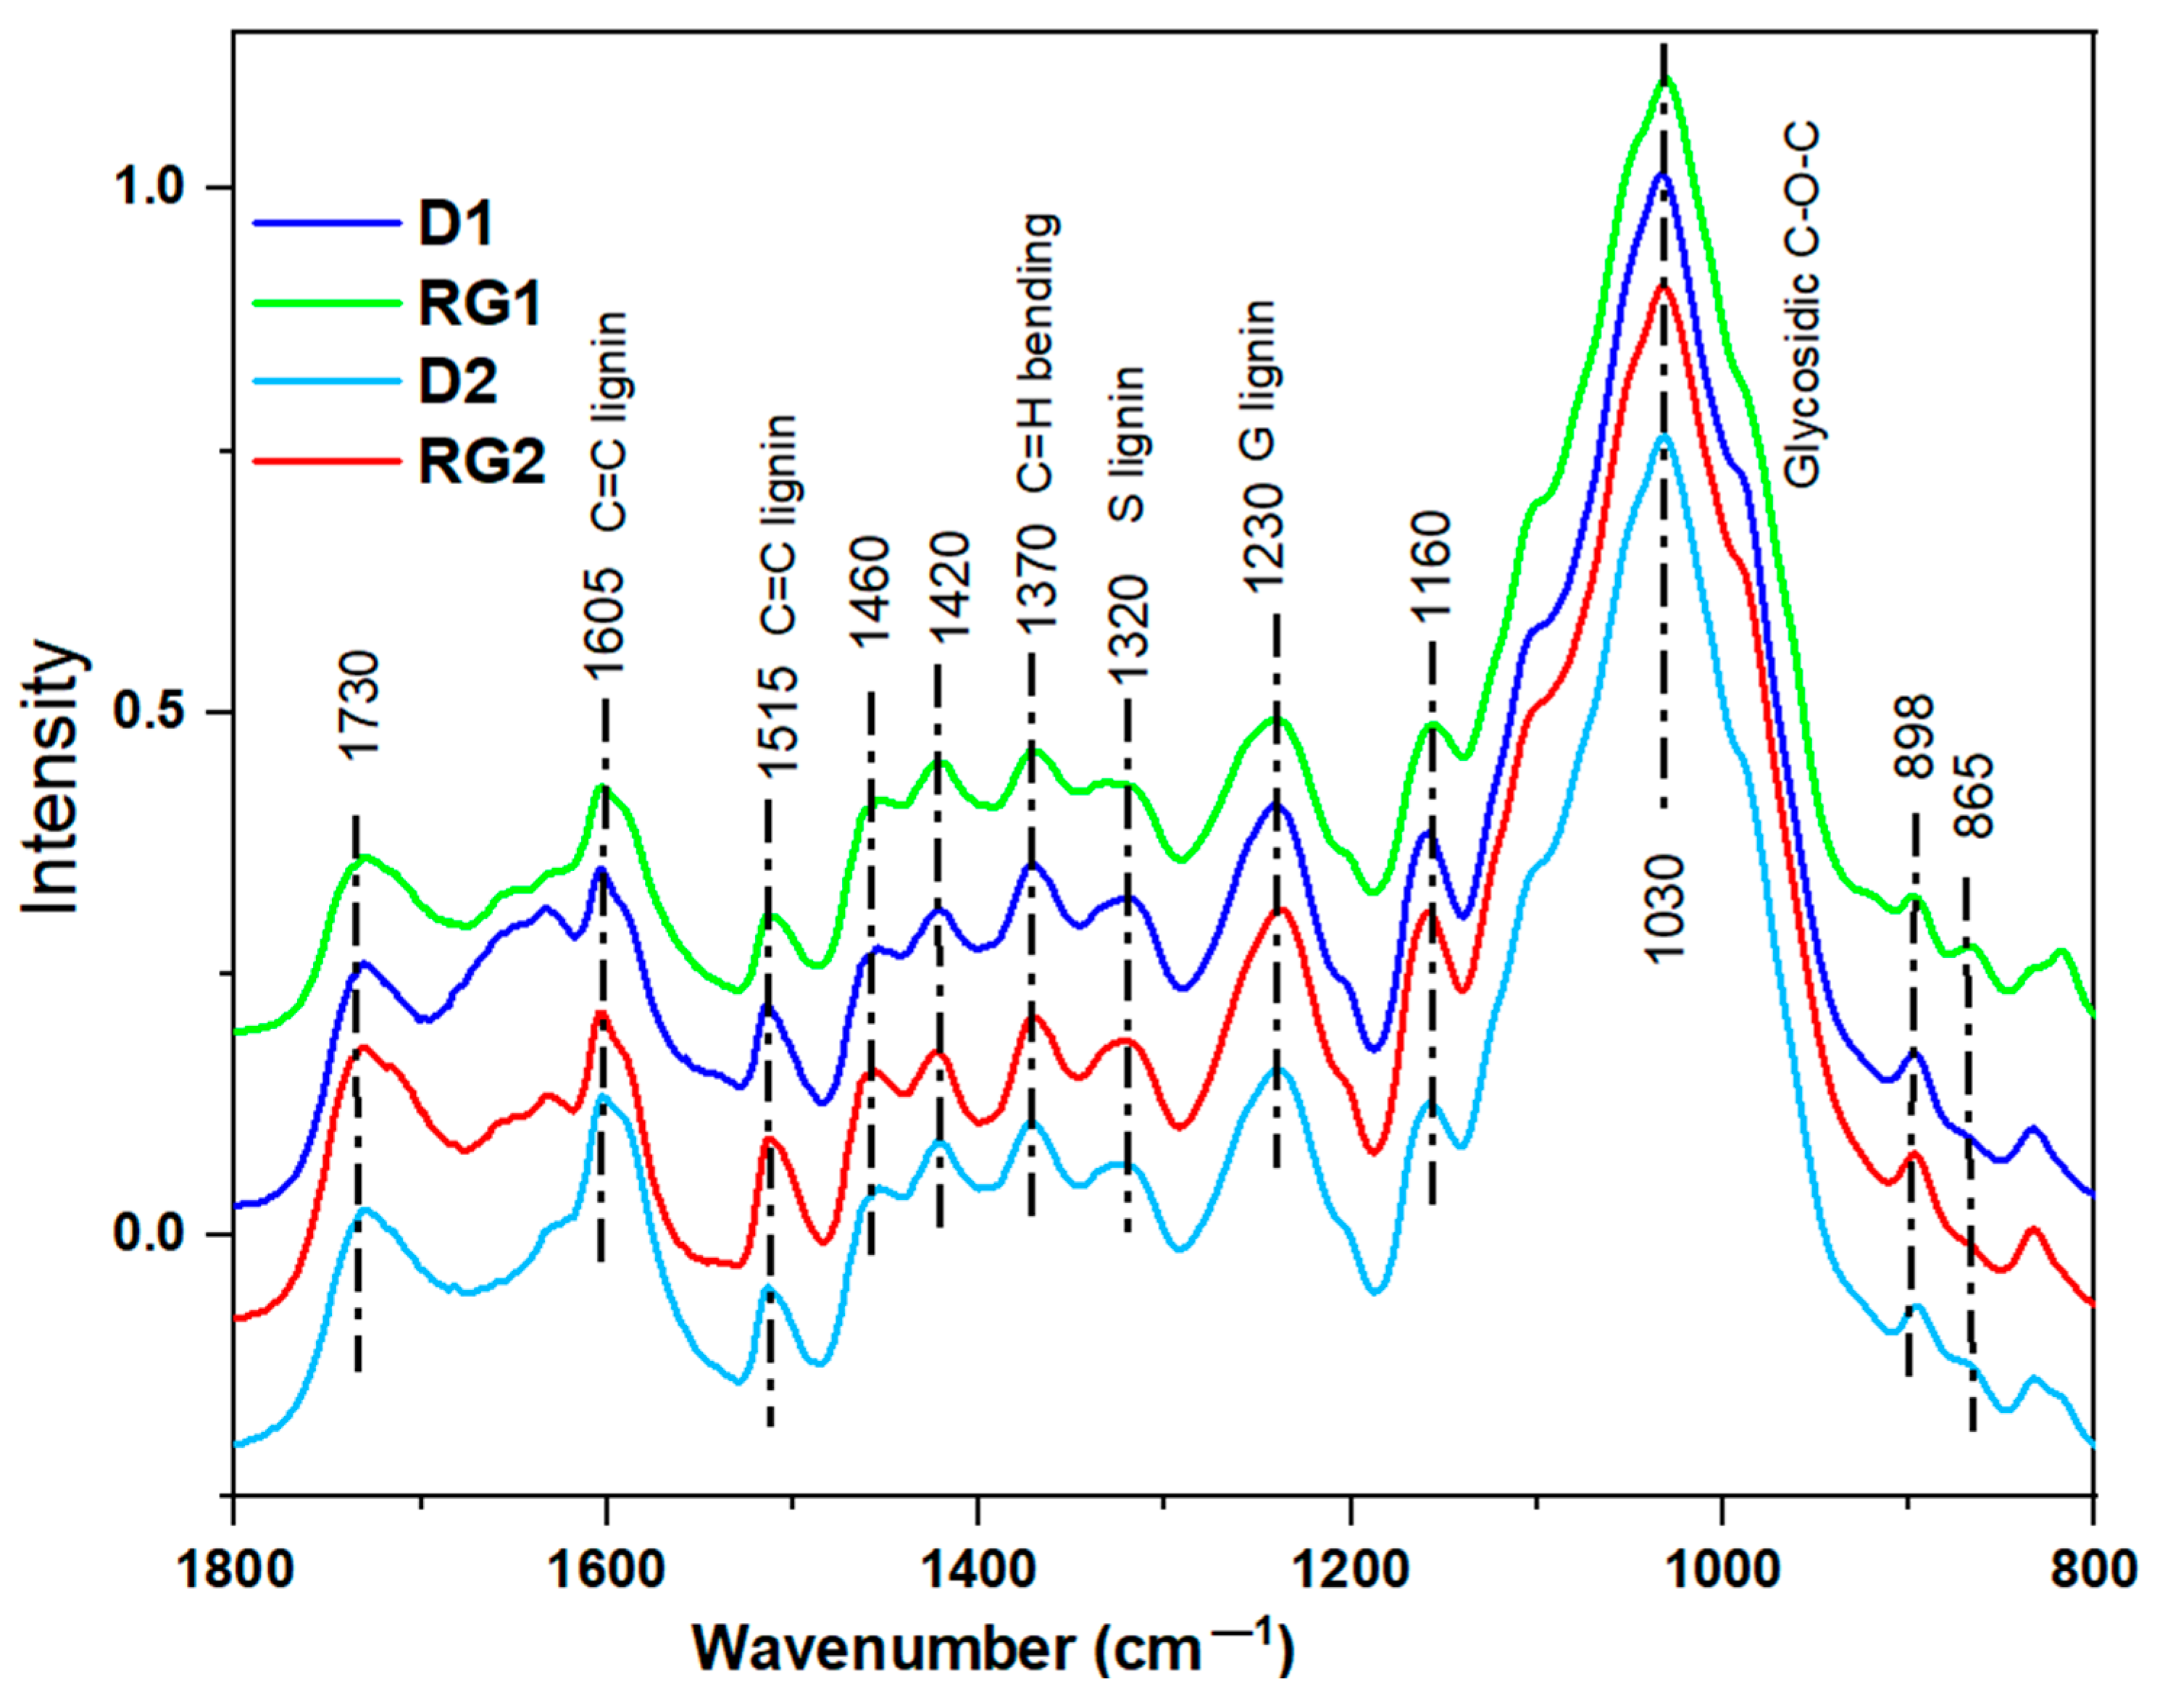
2.5. Compositional Analysis
2.5.1. FTIR Spectral Analysis
2.5.2. Crystallinity and MFA Analysis
2.5.3. Py-GCMS and DFRC Analysis
2.5.4. Lignin and Carbohydrate Analysis
2.6. Correlations of Chemical Compositions with Flexural Properties
3. Materials and Methods
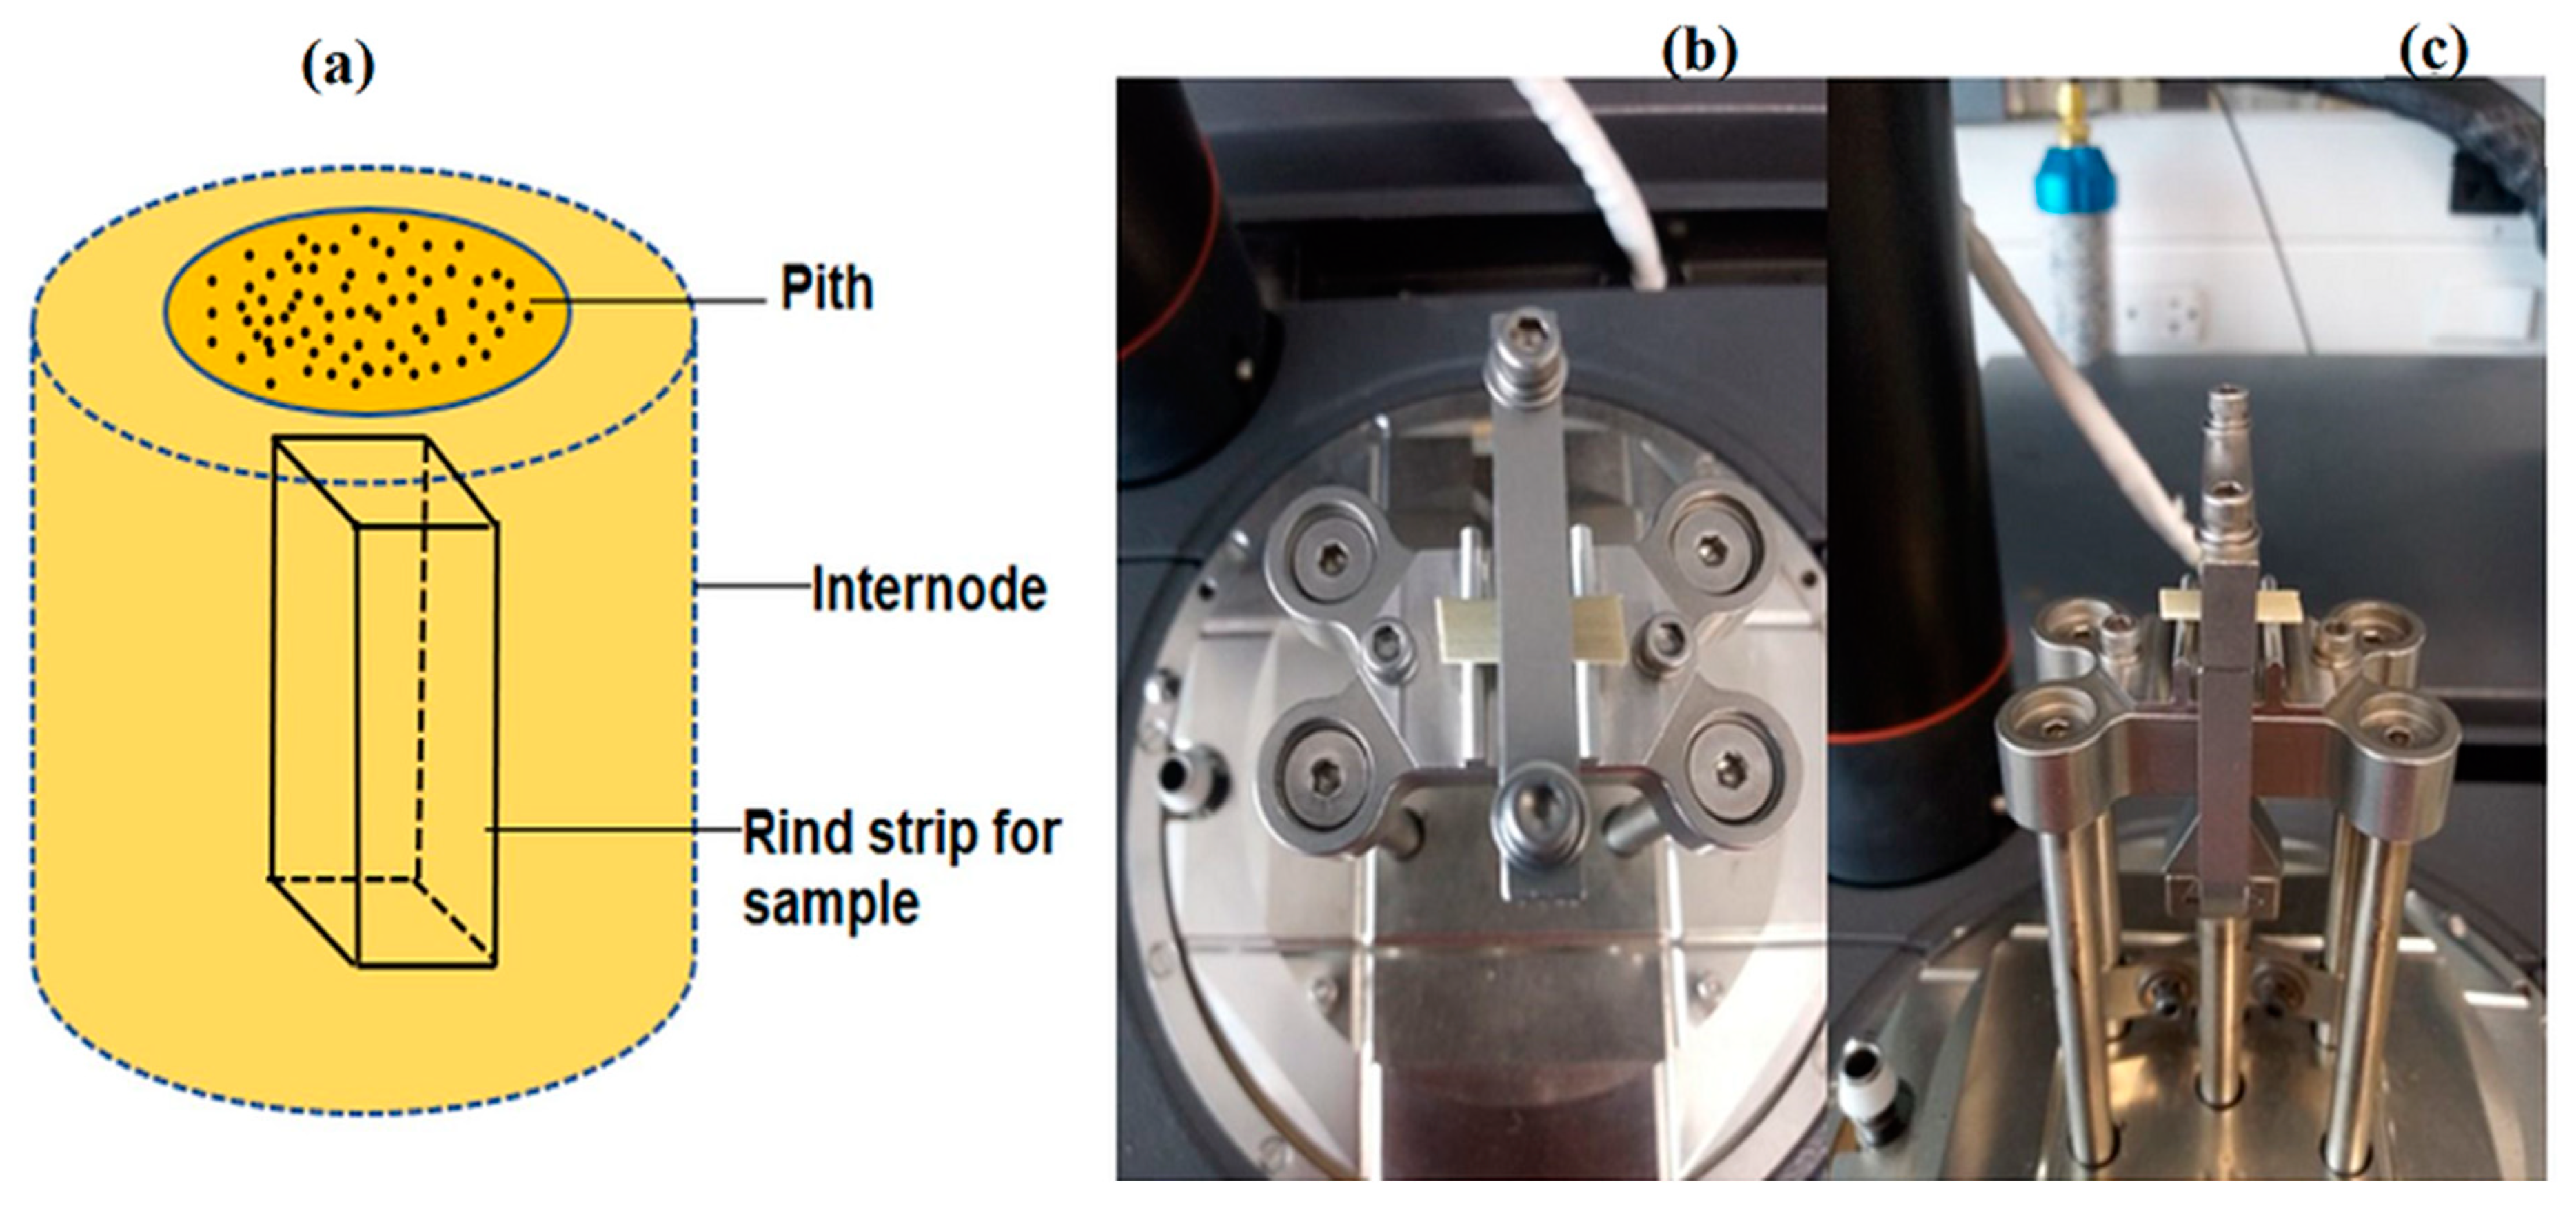
3.1. Plant Material
3.2. Mechanical and Viscoelastic Properties
3.2.1. Micro-Biomechanical Bending Tests
3.2.2. Viscoelastic Properties Response to Relative Humidity
3.2.3. Stress Relaxation
3.2.4. Creep Behavior
3.2.5. Viscoelastic Properties Response to Temperature
3.3. Compositional Analysis
3.3.1. Fourier-Transform Infrared (FTIR) Spectroscopy
3.3.2. Lignin and Carbohydrate Analysis
3.3.3. Microfibril Angle by XRD
3.3.4. Analytical Py-GCMS Analysis
3.3.5. Derivatization Followed by Reductive Cleavage (DFRC)
3.3.6. Statistical Analysis
4. Conclusions
Supplementary Materials
Author Contributions
Funding
Data Availability Statement
Acknowledgments
Conflicts of Interest
References
- Gomez, F.; Mullet, J.; Muliana, A.; Niklas, K.; Rooney, W. The genetic architecture of biomechanical traits in sorghum. Crop Sci. 2020, 60, 82–99. [Google Scholar] [CrossRef]
- Wu, W.; Ma, B. A new method for assessing plant lodging and the impact of management options on lodging in canola crop production. Sci. Rep. 2016, 6, 31890. [Google Scholar] [CrossRef]
- Shah, L.; Yahya, M.; Shah, A.; Nadeem, M.; Ali, A.; Wang, J.; Riaz, W.; Rehman, S.; Wu, W.; Khan, M.; et al. Improving Lodging Resistance: Using Wheat and Rice as Classical Examples. Int. J. Mol. Sci. 2019, 20, 4211. [Google Scholar] [CrossRef] [PubMed]
- Shah, N.; Tanveer, M.; Rehman, A.; Anjum, S.; Iqbal, J.; Ahmad, R. Lodging stress in cereal—Effects and management: An overview. Environ. Sci. Pollut. Res. 2017, 24, 5222–5237. [Google Scholar] [CrossRef] [PubMed]
- Hu, H.; Liu, W.; Fu, Z.; Homann, L.; Technow, F.; Wang, H.; Song, C.; Li, S.; Melchinger, A.; Chen, S. QTL mapping of stalk bending strength in a recombinant inbred line maize population. Theor. Appl. Genet. 2013, 126, 2257–2266. [Google Scholar] [CrossRef]
- Brulé, V.; Rafsanjani, A.; Pasini, D.; Western, T. Hierarchies of plant stiffness. Plant Sci. 2016, 250, 79–96. [Google Scholar] [CrossRef]
- Speck, T.; Burgert, I. Plant Stems: Functional Design and Mechanics. Annu. Rev. Mater. Res. 2011, 41, 169–193. [Google Scholar] [CrossRef]
- Bayable, M.; Tsunekawa, A.; Haregeweyn, N.; Ishii, T.; Alemayehu, G.; Tsubo, M.; Adgo, E.; Tassew, A.; Tsuji, W.; Asaregew, F.; et al. Biomechanical Properties and Agro-Morphological Traits for Improved Lodging Resistance in Ethiopian Teff (Eragrostis tef (Zucc.) Trottor) Accessions. Agronomy 2020, 10, 1012. [Google Scholar] [CrossRef]
- Khobra, R.; Sareen, S.; Meena, B.; Kumar, A.; Tiwari, V.; Singh, G. Exploring the traits for lodging tolerance in wheat genotypes: A review. Physiol. Mol. Biol. Plants 2019, 25, 589–600. [Google Scholar] [CrossRef]
- Shah, N.; Tanveer, M.; Abbas, A.; Yildirim, M.; Shah, A.; Ahmad, I.; Wang, Z.; Sun, W.; Song, Y. Combating Dual Challenges in Maize Under High Planting Density: Stem Lodging and Kernel Abortion. Front. Plant Sci. 2021, 12, 699085. [Google Scholar] [CrossRef]
- Kong, E.; Liu, D.; Guo, X.; Yang, W.; Sun, J.; Li, X.; Zhan, K.; Cui, D.; Lin, J.; Zhang, A. Anatomical and chemical characteristics associated with lodging resistance in wheat. Crop J. 2013, 1, 43–49. [Google Scholar] [CrossRef]
- Kokubo, A.; Kuraishi, S.; Sakurai, N. Culm Strength of Barley Correlation Among Maximum Bending Stress, Cell Wall Dimensions, and Cellulose Content. Plant Physiol. 1989, 91, 876–882. [Google Scholar] [CrossRef] [PubMed]
- Zhong, R.; Ye, Z. Secondary Cell Walls: Biosynthesis, Patterned Deposition and Transcriptional Regulation. Plant Cell Physiol. 2015, 56, 195–214. [Google Scholar] [CrossRef] [PubMed]
- Shah, D.; Reynolds, T.; Ramage, M. The strength of plants: Theory and experimental methods to measure the mechanical properties of stems. J. Exp. Bot. 2017, 68, 4497–4516. [Google Scholar] [CrossRef] [PubMed]
- Yang, S.; Xie, L.; Zheng, S.; Li, J.; Yuan, J. Effects of Nitrogen Rate and Transplanting Density on Physical and Chemical Characteristics and Lodging Resistance of Culms in Hybrid Rice. Acta Agron. Sin. 2009, 35, 93–103. [Google Scholar] [CrossRef]
- Luyckx, M.; Hausman, J.; Lutts, S.; Guerriero, G. Silicon and plants: Current knowledge and technological perspectives. Front. Plant Sci. 2017, 8, 411. [Google Scholar] [CrossRef]
- Lee, S.; Zargar, O.; Reiser, C.; Li, Q.; Muliana, A.; Finlayson, S.; Gomez, F.; Pharr, M. Time-dependent mechanical behavior of sweet sorghum stems. J. Mech. Behav. Biomed. Mater. 2020, 106, 103731. [Google Scholar] [CrossRef]
- Gomez, E.; Muliana, A.; Niklas, K.; Rooney, W. Identifying Morphological and Mechanical Traits Associated with Stem Lodging in Bioenergy Sorghum (Sorghum bicolor). Bioenergy Res. 2017, 10, 635–647. [Google Scholar] [CrossRef]
- Cosgrove, J.; Jarvis, C. Comparative structure and biomechanics of plant primary and secondary cell walls. Front. Plant Sci. 2012, 3, 204. [Google Scholar] [CrossRef]
- Wu, W.; Ma, B. The mechanical roles of the clasping leaf sheath in cereals: Two case studies from oat and wheat plants. J. Agron. Crop Sci. 2020, 206, 118–129. [Google Scholar] [CrossRef]
- Zuber, M.; Colbert, T.; Darrah, L. Effect of Recurrent Selection for Crushing Strength on Several Stalk Components in Maize. Crop Sci. 1980, 20, 711–717. [Google Scholar] [CrossRef]
- Peiffer, J.; Flint-Garcia, S.; De Leon, N.; McMullen, M.; Kaeppler, S.; Buckler, E. The Genetic Architecture of Maize Stalk Strength. PLoS ONE 2013, 8, e67066. [Google Scholar] [CrossRef]
- Arzola-Villegas, X.; Lakes, R.; Plaza, N.; Jakes, J. Wood Moisture-Induced Swelling at the Cellular Scale—Ab Intra. Forests 2019, 10, 996. [Google Scholar] [CrossRef]
- Lyu, J.; Peng, H.; Cao, J.; Jiang, J.; Zhao, R.; Gao, Y. Application of dynamic mechanical analysis in wood science research. J. For. Eng. 2018, 3, 1–11. [Google Scholar]
- Chen, H.; Zhao, N.; Fu, N.; Li, D.; Wang, J.; Chen, D. Mechanical Properties of Hulless Barley Stem with Different Moisture Contents. Int. J. Food Eng. 2019, 15, 20180033. [Google Scholar] [CrossRef]
- Erndwein, L.; Cook, D.; Robertson, D.; Sparks, E. Field-based mechanical phenotyping of cereal crops to assess lodging resistance. Appl. Plant Sci. 2020, 8, e11382. [Google Scholar] [CrossRef]
- Winandy, J.; Rowell, R. The Chemistry of Wood Strength. In The Chemistry of Solid Wood, 1st ed.; Rowell, R., Ed.; American Chemical Society: Washington, DC, USA, 1984; pp. 211–255. [Google Scholar]
- Stubbs, C.; Oduntan, Y.; Keep, T.; Noble, S.; Robertson, D. The effect of plant weight on estimations of stalk lodging resistance. Plant Methods 2020, 16, 28. [Google Scholar] [CrossRef] [PubMed]
- Martin-Nelson, N.; Sutherland, B.; Yancey, M.; Liao, C.; Stubbs, C.; Cook, D. Axial variation in flexural stiffness of plant stem segments: Measurement methods and the influence of measurement uncertainty. Plant Methods 2021, 17, 101. [Google Scholar] [CrossRef]
- Ookawa, T.; Yasuda, K.; Kato, H.; Sakai, M.; Seto, M.; Sunaga, K.; Motobayashi, T.; Tojo, S.; Hirasawa, T. Biomass production and lodging resistance in “Leaf Star”, a new long-culm rice forage cultivar. J. Plant Prod. Sci. 2009, 13, 58–66. [Google Scholar] [CrossRef]
- Li, M.; Yan, G.; Bhalla, A.; Maldonado-Pereira, L.; Russell, P.; Ding, S.; Mullet, J.; Hodge, D. Physical fractionation of sweet sorghum and forage/energy sorghum for optimal processing in a biorefinery. Ind. Crops Prod. 2018, 124, 607–616. [Google Scholar] [CrossRef]
- Gomez, F.; Muliana, A.; Rooney, W. Predicting Stem Strength in Diverse Bioenergy Sorghum Genotypes. Crop Sci. 2018, 58, 739–751. [Google Scholar] [CrossRef]
- Wright, C.; Pryfogle, P.; Stevens, N.; Steffler, E.; Hess, J.; Ulrich, T. Biomechanics of Wheat/Barley Straw and Corn Stover. Appl. Biochem. Biotechnol. 2005, 121–124, 5–20. [Google Scholar] [CrossRef]
- Robertson, D.; Lee, S.; Julias, M.; Cook, D. Maize Stalk Lodging: Flexural Stiffness Predicts Strength. Crop Sci. 2016, 56, 1711–1718. [Google Scholar] [CrossRef]
- Zhang, L.; Yang, Z.; Zhang, Q.; Guo, H. Tensile properties of maize stalk rind. BioResources 2016, 11, 6151–6161. [Google Scholar] [CrossRef]
- Xu, Y.; Li, J.; Xin, Z.; Bean, S.; Tilley, M.; Wang, D. Water-soluble sugars of pedigreed sorghum mutant stalks and their recovery after pretreatment. Appl. Sci. 2020, 10, 5472. [Google Scholar] [CrossRef]
- Sekhon, R.; Joyner, C.; Ackerman, A.; McMahan, C.; Cook, D.; Robertson, D. Stalk Bending Strength is Strongly Associated with Maize Stalk Lodging Incidence Across Multiple Environments. Field Crops Res. 2020, 249, 107737. [Google Scholar] [CrossRef]
- Esechie, H.; Maranville, J.; Ross, W. Relationship of Stalk Morphology and Chemical Composition to Lodging Resistance in Sorghum. Crop Sci. 1977, 17, 609–612. [Google Scholar] [CrossRef]
- Hansen, S.; Ray, P.; Karlsson, A.; Jorgensen, B.; Borkhardt, B.; Petersen, B.; Ulvskov, P. Mechanical Properties of Plant Cell Walls Probed by Relaxation Spectra. Plant Physiol. 2011, 155, 246–258. [Google Scholar] [CrossRef]
- Zhan, T.; Jiang, J.; Lu, J.; Peng, H. Dynamic viscoelastic properties of Chinese fir under cyclical relative humidity variation. J. Wood Sci. 2015, 61, 465–473. [Google Scholar] [CrossRef]
- Czibula, C.; Seidlhofer, T.; Ganser, C.; Hirn, U.; Teichert, C. Longitudinal and transverse low frequency viscoelastic characterization of wood pulp fibers at different relative humidity. Materialia 2021, 16, 101094. [Google Scholar] [CrossRef]
- Jakes, J. Mechanism for Diffusion through Secondary Cell Walls in Lignocellulosic Biomass. J. Phys. Chem. B 2019, 123, 4333–4339. [Google Scholar] [CrossRef] [PubMed]
- Zauscher, S.; Caulfield, D.; Nissan, A. The influence of water on the elastic modulus of paper. Part I: Extension of the H-bond theory. Tappi J. 1996, 79, 178–182. [Google Scholar]
- Meng, Y.; Xia, Y.; Young, T.; Cai, Z.; Wang, S. Viscoelasticity of wood cell walls with different moisture content as measured by nanoindentation. RSC Adv. 2015, 5, 47538–47547. [Google Scholar] [CrossRef]
- Birkinshaw, C.; Buggy, M.; Henn, G. Dynamic mechanical analysis of wood. J. Mater. Sci. Lett. 1986, 5, 898–900. [Google Scholar] [CrossRef]
- Kaboorani, A.; Blanchet, P. Determining the linear viscoelastic region of sugar maple wood by dynamic mechanical analysis. BioResources 2014, 9, 4392–4409. [Google Scholar] [CrossRef]
- Zhang, T.; Bai, S.; Zhang, Y.; Thibaut, B. Viscoelastic properties of wood materials characterized by nanoindentation experiments. Wood Sci. Technol. 2012, 46, 1003–1016. [Google Scholar] [CrossRef][Green Version]
- Kong, L.; Zhao, Z.; He, Z.; Yi, S. Effects of steaming treatment on crystallinity and glass transition temperature of Eucalyptuses grandis × E. urophylla. Results Phys. 2017, 7, 914–919. [Google Scholar] [CrossRef]
- Wan, G.; Frazier, T.; Jorgensen, J.; Zhao, B.; Frazier, C. Rheology of transgenic switchgrass reveals practical aspects of biomass processing. Biotechnol. Biofuels 2018, 11, 57. [Google Scholar] [CrossRef]
- Cristea, M.; Ionita, D.; Iftime, M. Dynamic Mechanical Analysis Investigations of PLA-Based Renewable Materials: How Are They Useful? Materials 2020, 13, 5302. [Google Scholar] [CrossRef]
- Horvath, B.; Peralta, P.; Frazier, C.; Peszlen, I. Thermal softening of transgenic aspen. BioResources 2011, 6, 2125–2134. [Google Scholar] [CrossRef]
- Stelte, W.; Clemons, C.; Holm, J.; Ahrenfeldt, J.; Henriksen, U.; Sanadi, A. Thermal transitions of the amorphous polymers in wheat straw. Ind. Crops Prod. 2011, 34, 1053–1056. [Google Scholar] [CrossRef]
- Olsson, A.; Salmén, L. The effect of lignin composition on the viscoelastic properties of wood. Nord. Pulp Paper Res. J. 1997, 12, 140–144. [Google Scholar] [CrossRef]
- Chowdhury, S.; Frazier, E. Thermorheological complexity and fragility in plasticized lignocellulose. Biomacromolecules 2013, 14, 1166–1173. [Google Scholar] [CrossRef]
- Börcsök, Z.; Pásztory, Z. The role of lignin in wood working processes using elevated temperatures: An abbreviated literature survey. Eur. J. Wood Prod. 2020, 79, 511–526. [Google Scholar] [CrossRef]
- Chowdhury, S.; Fabiyi, J.; Frazier, E. Advancing the dynamic mechanical analysis of biomass: Comparison of tensile-torsion and compressive-torsion wood DMA. Holzforschung 2010, 64, 747–756. [Google Scholar] [CrossRef]
- Harris, P.; Stone, B. Chemistry and Molecular Organization of Plant Cell Walls. In Biomass Recalcitrance: Deconstructing the Plant Cell Wall for Bioenergy, 1st ed.; Himme, M., Ed.; Blackwell: Chichester, UK, 2009; pp. 61–93. [Google Scholar]
- Roland, J.; Reis, D.; Vian, B.; Roy, S. The helicoidal plant cell wall as a performing cellulose-based composite. Mol. Biol. Cell. 1989, 67, 209–220. [Google Scholar] [CrossRef]
- Hayot, C.; Forouzesh, E.; Goel, A.; Avramova, Z.; Turner, J. Viscoelastic properties of cell walls of single living plant cells determined by dynamic nanoindentation. J. Exp. Bot. 2012, 63, 2525–2540. [Google Scholar] [CrossRef]
- Chen, L.; Liao, N.; Xing, L.; Han, L. Description of Wheat Straw Relaxation Behavior Based on a Fractional-Order Constitutive Model. Agron. J. 2013, 105, 134–142. [Google Scholar] [CrossRef]
- Hu, J.J.; Lei, T.-Z.; Xu, G.-Y.; Shen, S.-Q.; Liu, J.-W. Experimental study of stress relaxation in the process of cold molding with straw. BioResources 2009, 4, 1158–1167. [Google Scholar] [CrossRef]
- Liu, L.; Yu, W.; Jin, H. Modeling the stress-relaxation behavior of wool fibers. J. Appl. Polym. Sci. 2008, 110, 2078–2084. [Google Scholar] [CrossRef]
- Tweedie, C.; Van Vliet, K. Contact creep compliance of viscoelastic materials via nanoindentation. J. Mater. Res. 2006, 21, 1576–1589. [Google Scholar] [CrossRef]
- Zhu, Y.; Fu, N.; Li, D.; Wang, L.; Chen, X. Physical and Viscoelastic Properties of Different Moisture Content Highland Barley Kernels. Int. J. Food Eng. 2017, 13, 20170186. [Google Scholar] [CrossRef]
- Findely, W.N.; Lai, J.S.; Onaran, K. Nonlinear Creep at Constant Stress and Relaxation at Constant Strain. In Creep and Relaxation of Nonlinear Viscoelastic Materials; Findley, W.N., Lai, J.S., Onaran, K., Eds.; North-Holland: New York, NY, USA, 1976; pp. 176–219. [Google Scholar]
- Ornaghi, H.; Almeida, J.; Monticeli, F.; Neves, R. Stress relaxation, creep, and recovery of carbon fiber non-crimp fabric composites. Compos. Part C 2020, 3, 100051. [Google Scholar] [CrossRef]
- Siviour, C.; Jordan, J. High Strain Rate Mechanics of Polymers: A Review. J. Dyn. Behav. Mater. 2016, 2, 15–32. [Google Scholar] [CrossRef]
- Roylance, D. Engineering Viscoelasticity; Massachusetts Institute of Technology: Cambridge, MA, USA, 2001; Available online: https://web.mit.edu/course/3/3.11/www/modules/visco.pdf (accessed on 10 October 2023).
- Poletto, M.; Zattera, A.; Santana, R. Structural differences between wood species: Evidence from chemical composition, FTIR spectroscopy, and thermogravimetric analysis. J. Appl. Polym. Sci. 2012, 126, E337–E344. [Google Scholar] [CrossRef]
- Acquah, G.; Via, B.; Fasina, O.; Eckhardt, L. Rapid Quantitative Analysis of Forest Biomass Using Fourier Transform Infrared Spectroscopy and Partial Least Squares Regression. J. Anal. Methods Chem. J. 2016, 2016, 1839598. [Google Scholar] [CrossRef] [PubMed]
- Faix, O. Classification of Lignins from Different Botanical Origins by FT-IR Spectroscopy. Holzforschung 1991, 45, 21–28. [Google Scholar] [CrossRef]
- Isogai, A.; Usuda, M. Crystallinity Indexes of Cellulosic Materials. Sen’i Gakkaishi 1990, 46, 324–329. [Google Scholar] [CrossRef]
- Segal, L.; Creely, J.J.; Martin, A.E.; Conrad, C.M. An empirical method for estimating the degree of crystallinity of native cellulose using the X-ray diffractometer. Text. Res. J. 1959, 29, 786–794. [Google Scholar] [CrossRef]
- Park, S.; Baker, J.; Himmel, M.; Parilla, P.; Johnson, D. Cellulose crystallinity index: Measurement techniques and their impact on interpreting cellulase performance. Biotechnol. Biofuels 2010, 3, 10. [Google Scholar] [CrossRef]
- Zhao, C.; Shao, Q.; Ma, Z.; Li, B.; Zhao, X. Physical and chemical characterizations of corn stalk resulting from hydrogen peroxide presoaking prior to ammonia fiber expansion pretreatment. Ind. Crops Prod. 2016, 83, 86–93. [Google Scholar] [CrossRef]
- Vandenbrink, J.; Hilten, R.; Das, K.; Paterson, A.; Feltus, F. Analysis of crystallinity index and hydrolysis rates in the bioenergy crop Sorghum bicolor. Bioenergy Res. 2012, 5, 387–397. [Google Scholar] [CrossRef]
- Reddy, N.; Yang, Y. Structure and properties of natural cellulose fibers obtained from sorghum leaves and stems. J. Agric. Food Chem. 2007, 55, 5569–5574. [Google Scholar] [CrossRef]
- French, A.; Santiago Cintrón, M. Cellulose polymorphy, crystallite size, and the Segal Crystallinity Index. Cellulose 2013, 20, 583–588. [Google Scholar] [CrossRef]
- Parameswaran, N.; Liese, W. On the fine structure of bamboo fibres. Wood Sci. Technol. 1976, 10, 231–246. [Google Scholar] [CrossRef]
- de Souza, M.; Lima, T.; Soares, D. Application of X-ray diffraction to assess the microfibril angle of green and dry Eucalyptus grandis wood. Trees 2022, 36, 191–197. [Google Scholar] [CrossRef]
- Dungani, R.; Karina, M.; Subyakto, S.A.; Hermawan, D.; Hadiyane, A. Agricultural waste fibers towards sustainability and advanced utilization: A review. Asian J. Plant Sci. 2016, 15, 42–55. [Google Scholar] [CrossRef]
- Venkateshwaran, N.; Elayaperumal, A.; Sathiya, G. Prediction of tensile properties of hybrid-natural fiber composites. Compos. Part B Eng. 2012, 43, 793–796. [Google Scholar] [CrossRef]
- Driemeier, C.; Santos, D.; Buckeridge, S. Cellulose crystals in fibrovascular bundles of sugarcane culms: Orientation, size, distortion, and variability. Cellulose 2012, 19, 1507–1515. [Google Scholar] [CrossRef]
- Tabet, T.; Aziz, F. Cellulose Microfibril Angle in Wood and Its Dynamic Mechanical Significance. In Cellulose—Fundamental Aspects; De Ven, T., Godbout, L., Eds.; IntechOpen: London, UK, 2013; pp. 113–142. [Google Scholar] [CrossRef]
- Barnett, J.; Bonham, V. Cellulose microfibril angle in the cell wall of wood fibres. Biol. Rev. Camb. Philos. Soc. 2004, 79, 461–472. [Google Scholar] [CrossRef]
- Kang, X.; Kirui, A.; Dickwella, C.; Mentink-Vigier, F.; Cosgrove, J.; Wang, T. Lignin-polysaccharide interactions in plant secondary cell walls revealed by solid-state NMR. Nat. Commun. 2019, 10, 347. [Google Scholar] [CrossRef]
- Stubbs, C.; Larson, R.; Cook, D. Maize stalk stiffness and strength are primarily determined by morphological factors. Sci. Rep. 2022, 12, 720. [Google Scholar] [CrossRef] [PubMed]
- Gibson, J. The hierarchical structure and mechanics of plant materials. J. R. Soc. Interface 2012, 9, 2749–2766. [Google Scholar] [CrossRef] [PubMed]
- Rosado, M.; Bausch, F.; Rencoret, J.; Marques, G.; Gutiérrez, A.; Rosenau, T.; Potthast, A.; del Río, J. Differences in the content, composition and structure of the lignins from rind and pith of papyrus (Cyperus papyrus L.) culms. Ind. Crops Prod. 2021, 174, 114226. [Google Scholar] [CrossRef]
- Sequeiros, A.; Labidi, J. Characterization and determination of the S/G ratio via Py-GC/MS of agricultural and industrial residues. Ind. Crops Prod. 2017, 97, 469–476. [Google Scholar] [CrossRef]
- Torri, C.; Adamiano, A.; Fabbri, D.; Lindfors, C.; Monti, A.; Oasmaa, A. Comparative analysis of pyrolysate from herbaceous and woody energy crops by Py-GC with atomic emission and mass spectrometric detection. J. Anal. Appl. Pyrolysis 2010, 88, 175–180. [Google Scholar] [CrossRef]
- Liu, Q.; Luo, L.; Zheng, L. Lignins: Biosynthesis and Biological Functions in Plants. Int. J. Mol. Sci. 2018, 19, 335. [Google Scholar] [CrossRef]
- Mengistie, E.; Alayat, A.; Sotoudehnia, F.; Bokros, N.; DeBolt, S.; McDonald, A.G. Evaluation of Cell Wall Chemistry of della and Its Mutant Sweet Sorghum Stalks. J. Agric. Food Chem. 2022, 70, 1689–1703. [Google Scholar] [CrossRef]
- Li, X.; Chen, W.; Zhao, Y.; Xiang, Y.; Jiang, H.; Zhu, S.; Cheng, B. Downregulation of caffeoyl-CoA O-methyltransferase (CCoAOMT) by RNA interference leads to reduced lignin production in maize straw. Genet. Mol. Biol. 2013, 36, 540–546. [Google Scholar] [CrossRef]
- Achyuthan, K.; Achyuthan, A.; Adams, P.; Dirk, S.; Harper, J.; Simmons, B.; Singh, A. Supramolecular Self-Assembled Chaos: Polyphenolic Lignin’s Barrier to Cost-Effective Lignocellulosic Biofuels. Molecules 2010, 15, 8641–8688. [Google Scholar] [CrossRef]
- Verma, S.; Dwivedi, U. Lignin genetic engineering for improvement of wood quality: Applications in paper and textile industries, fodder and bioenergy production. S. Afr. J. Bot. 2014, 91, 107–125. [Google Scholar] [CrossRef]
- Ziebell, A.; Gracom, K.; Katahira, R.; Chen, F.; Pu, Y.; Ragauskas, A.; Dixon, R.; Davis, M. Increase in 4-coumaryl alcohol units during lignification in alfalfa (Medicago sativa) alters the extractability and molecular weight of lignin. J. Biol. Chem. 2010, 285, 38961–38968. [Google Scholar] [CrossRef] [PubMed]
- Cesarino, I.; Araújo, P.; Domingues, P.; Mazzafera, P. An overview of lignin metabolism and its effect on biomass recalcitrance. Braz. J. Bot. 2012, 35, 303–311. [Google Scholar] [CrossRef]
- Ferrer, J.; Austin, M.; Stewart, C.; Noel, J. Structure and function of enzymes involved in the biosynthesis of phenylpropanoids. Plant Physiol. Biochem. 2008, 46, 356–370. [Google Scholar] [CrossRef] [PubMed]
- Hu, D.; Liu, X.; She, H.; Gao, Z.; Ruan, R.; Wu, D.; Yi, Z. The lignin synthesis related genes and lodging resistance of Fagopyrum esculentum. Biol. Plant. 2016, 61, 138–146. [Google Scholar] [CrossRef]
- Wei, L.; Jian, H.; Lu, K.; Yin, N.; Wang, J.; Duan, X.; Li, W.; Liu, L.; Xu, X.; Wang, R.; et al. Genetic and transcriptomic analyses of lignin- and lodging-related traits in Brassica napus. Theor. Appl. Genet. 2017, 130, 1961–1973. [Google Scholar] [CrossRef] [PubMed]
- Li, F.; Zhang, M.; Guo, K.; Hu, Z.; Zhang, R.; Feng, Y.; Yi, X.; Zou, W.; Wang, L.; Wu, C.; et al. High-level hemicellulosic arabinose predominately affects lignocellulose crystallinity for genetically enhancing both plant lodging resistance and biomass enzymatic digestibility in rice mutants. Plant Biotechnol. J. 2015, 13, 514–525. [Google Scholar] [CrossRef]
- Luo, Y.; Ni, J.; Pang, D.; Jin, M.; Chen, J.; Kong, X.; Li, W.; Chang, Y.; Li, Y.; Wang, Z. Regulation of lignin composition by nitrogen rate and density and its relationship with stem mechanical strength of wheat. Field Crops Res. 2019, 241, 107572. [Google Scholar] [CrossRef]
- Rencoret, J.; Gutiérrez, A.; Nieto, L.; Jiménez-Barbero, J.; Faulds, C.; Kim, H.; Ralph, J.; Martínez, Á.; del Río, J. Lignin Composition and Structure in Young versus Adult Eucalyptus globulus Plants. Plant Physiol. 2011, 155, 667–682. [Google Scholar] [CrossRef]
- Li, M.; Pu, Y.; Ragauskas, J. Current understanding of the correlation of lignin structure with biomass recalcitrance. Front. Chem. 2016, 4, 45. [Google Scholar] [CrossRef]
- Manga-Robles, A.; Santiago, R.; Malvar, R.; Moreno-González, V.; Fornalé, S.; López, I.; Centeno, M.; Acebes, J.; Álvarez, J.; Caparros-Ruiz, D.; et al. Elucidating compositional factors of maize cell walls contributing to stalk strength and lodging resistance. Plant Sci. 2021, 307, 110882. [Google Scholar] [CrossRef] [PubMed]
- Del Río, C.; Rencoret, J.; Prinsen, P.; Martínez, T.; Ralph, J.; Gutiérrez, A. Structural characterization of wheat straw lignin as revealed by analytical pyrolysis, 2D-NMR, and reductive cleavage methods. J. Agric. Food Chem. 2012, 60, 5922–5935. [Google Scholar] [CrossRef] [PubMed]
- Huang, J.; Liu, W.; Zhou, F.; Peng, Y. Effect of multiscale structural parameters on the mechanical properties of rice stems. J. Mech. Behav. Biomed. Mater. 2018, 82, 239–247. [Google Scholar] [CrossRef] [PubMed]
- Rivera-Burgos, L.; Volenec, J.; Ejeta, G. Biomass and Bioenergy Potential of Brown Midrib Sweet Sorghum Germplasm. Front. Plant Sci. 2019, 10, 1142. [Google Scholar] [CrossRef]
- Genet, M.; Stokes, A.; Salin, F.; Mickovski, S.; Fourcaud, T.; Dumail, J.; Van Beek, R. The Influence of Cellulose Content on Tensile Strength in Tree Roots. Plant Soil. 2005, 278, 1–9. [Google Scholar] [CrossRef]
- Sánchez-Echeverri, L.; Aita, G.; Robert, D.; Rodriguez, M. Correlation between chemical compounds and mechanical response in culms of two different ages of Guadua angustifolia Kunth. Madera Bosques 2014, 20, 87–94. [Google Scholar] [CrossRef]
- Chen, G.; Shi, Y.; Yin, P.; Wang, L.; Shi, H.; Peng, L.; Ni, L.; Cai, T. Relationship between Lignin Metabolism and Lodging Resistance in Wheat. Acta Agron. Sin. 2011, 37, 1616–1622. [Google Scholar] [CrossRef]
- Wu, L.; Zhang, W.; Ding, Y.; Zhang, J.; Cambula, E.; Weng, F.; Liu, Z.; Ding, C.; Tang, S.; Chen, L.; et al. Shading contributes to the reduction of stem mechanical strength by decreasing cell wall synthesis in japonica rice (Oryza sativa L.). Front. Plant Sci. 2017, 8, 881. [Google Scholar] [CrossRef]
- Peng, D.; Chen, X.; Yin, Y.; Lu, K.; Yang, W.; Tang, Y.; Wang, Z. Lodging resistance of winter wheat (Triticum aestivum L.): Lignin accumulation and its related enzymes activities due to the application of paclobutrazol or gibberellin acid. Field Crops Res. 2014, 157, 1–7. [Google Scholar] [CrossRef]
- Turner, S.; Somerville, C. Collapsed xylem phenotype of Arabidopsis identifies mutants deficient in cellulose deposition in the secondary cell wall. Plant Cell 1997, 9, 689–701. [Google Scholar] [CrossRef]
- Hondroyianni, P.D.; Gagianas, A.; Tsatsarelis, K. Corn stalk traits related to lodging resistance in two soils of differing salinity. Maydica 2000, 45, 125–133. [Google Scholar]
- Kaack, K.; Schwarz, K.; Brander, P. Variation in morphology, anatomy and chemistry of stems of Miscanthus genotypes differing in mechanical properties. Ind. Crops Prod. 2003, 17, 131–142. [Google Scholar] [CrossRef]
- Okuno, A.; Hirano, K.; Asano, K.; Takase, W.; Masuda, R.; Morinaka, Y.; Ueguchi-Tanaka, M.; Kitano, H.; Matsuoka, M. New Approach to Increasing Rice Lodging Resistance and Biomass Yield Through the Use of High Gibberellin Producing Varieties. PLoS ONE 2014, 9, e86870. [Google Scholar] [CrossRef] [PubMed]
- Wei, F. Effects of Nitrogenous Fertilizer Application Model on Culm Lodging Resistance in Winter Wheat. Acta Agron. Sin. 2008, 34, 1080–1085. [Google Scholar] [CrossRef]
- Voelker, S.; Lachenbruch, B.; Meinzer, F.; Strauss, S. Reduced wood stiffness and strength, and altered stem form, in young antisense 4CL transgenic poplars with reduced lignin contents. New Phytol. 2011, 189, 1096–1109. [Google Scholar] [CrossRef] [PubMed]
- Zhang, Y.; Wang, Y.; Ye, D.; Wang, W.; Qiu, X.; Duan, L.; Li, Z.; Zhang, M. Ethephon Improved Stalk Strength of Maize (Zea Mays L.) Mainly through Altering Internode Morphological Traits to Modulate Mechanical Properties under Field Conditions. Agronomy 2019, 9, 186. [Google Scholar] [CrossRef]
- Liu, S.; Huang, Y.; Xu, H.; Zhao, M.; Xu, Q.; Li, F. Genetic enhancement of lodging resistance in rice due to the key cell wall polymer lignin, which affects stem characteristics. Breed Sci. 2018, 68, 508–515. [Google Scholar] [CrossRef]
- Petti, C.; Harman-Ware, A.E.; Tateno, M.; Kushwaha, R.; Shearer, A.; Downie, A.B.; Crocker, M.; DeBolt, S. Sorghum mutant RGdisplays antithetic leaf shoot lignin accumulation resulting in improved stem saccharification properties. Biotechnol. Biofuels 2013, 6, 146. [Google Scholar] [CrossRef]
- Xu, Q.; Engquist, B. A mathematical model for fitting and predicting relaxation modulus and simulating viscoelastic responses. Proc. R. Soc. 2018, 474, 2213. [Google Scholar] [CrossRef]
- Simsiriwong, J.; Sullivan, R.; Hilton, H. Viscoelastic creep compliance using prony series and spectrum function approach. In Challenges in Mechanics of Time-Dependent Materials and Processes in Conventional and Multifunctional Materials; Antoun, B., Qi, H., Hall, R., Tandon, G., Lu, H., Lu, C., Eds.; Springer: New York, NY, USA, 2013; Volume 2, pp. 149–160. [Google Scholar]
- Schöning, J.G. Absorptiometric determination of acid-soluble lignin in semichemical bisulfite pulps and in some woods and plants. Sven. Papperstidning-Nord. Cellul. 1965, 68, 607–613. [Google Scholar]
- Yamamoto, H.; Okuyama, T.; Yoshida, M. Method of determining the mean microfibril angle of wood over a wide range by the improved Cave’s method. J. Jpn. Wood Res. Soc. 1993, 39, 375–381. [Google Scholar]
- Cave, D. Theory of X-ray measurement of microfibril angle in wood. Wood Sci. Technol. 1997, 31, 143–152. [Google Scholar] [CrossRef]
- Rekha, B.; Nagarajaganesh, B. X-ray Diffraction: An Efficient Method to Determine Microfibrillar Angle of Dry and Matured Cellulosic Fibers. J. Nat. Fibers 2020, 19, 3689–3696. [Google Scholar] [CrossRef]
- Faix, O.; Meier, D.; Fortmann, I. Thermal degradation products of wood. Holz Als Roh-Und Werkstoff 1990, 48, 351–354. [Google Scholar] [CrossRef]
- Meier, D.; Faix, O. Pyrolysis-Gas Chromatography-Mass Spectrometry. In Methods in Lignin Chemistry; Lin, S., Dence, C., Eds.; Springer Series in Wood Science; Springer: Berlin/Heidelberg, Germany, 1992; pp. 177–199. [Google Scholar]
- Lu, F.; Ralph, J. Derivatization Followed by Reductive Cleavage (DFRC Method), a New Method for Lignin Analysis: Protocol for Analysis of DFRC Monomers. J. Agric. Food Chem. 1997, 45, 2590–2592. [Google Scholar] [CrossRef]
- Lu, F.; Ralph, J. The DFRC Method for Lignin Analysis. 2. Monomers from Isolated Lignins. J. Agric. Food Chem. 1998, 46, 547–552. [Google Scholar] [CrossRef] [PubMed]


| Sample | E″ | tanδ | tanδmaximum | |||
|---|---|---|---|---|---|---|
| Tg1 (°C) | Tg2 (°C) | Tg1 (°C) | Tg2 (°C) | tanδmax1 | tanδmax2 | |
| D2 | 82 | 92 | 80 | 92 | 0.192 | 0.115 |
| RG2 | 80 | 93 | 78 | 93 | 0.170 | 0.086 |
| D1 | 88 | - | 83 | 91 | 0.186 | 0.188 |
| RG1 | 87 | 94 | 79 | 97 | 0.218 | 0.280 |
| Sample | E∞ (MPa) | E1 (MPa) | τ1 (min) | E2 (MPa) | τ2 (min) | E3 (MPa) | τ3 (min) | E0 (MPa) | R2 |
|---|---|---|---|---|---|---|---|---|---|
| D1 | 1180 ± 21 | 421 ± 57 | 0.054 ± 0.003 | 205.1 ± 2.1 | 0.52 ± 0.04 | 206.7 ± 4.7 | 5.6 ± 0.4 | 2013 ± 15 | 99.96 |
| RG1 | 923 ± 19 | 225 ± 12 | 0.054 ± 0.004 | 91.8 ± 3.9 | 0.52 ± 0.04 | 96.5 ± 1.7 | 6.2 ± 0.4 | 1336 ± 16 | 99.96 |
| D2 | 2231 ± 66 | 291 ± 16 | 0.103 ± 0.006 | 133.2 ± 4.2 | 0.76 ± 0.06 | 198.7 ± 2.4 | 7.9 ± 0.5 | 2854 ± 9 | 99.98 |
| RG2 | 1368 ± 14 | 567 ± 25 | 0.033 ± 0.004 | 168.6 ± 7.7 | 0.46 ± 0.04 | 168.4 ± 3.6 | 5.7 ± 0.4 | 2271 ± 20 | 99.93 |
| Sample | C0 (µm2/N) | C1 (µm2/N) | τ1 (min) | C2 (µm2/N) | τ2 (min) | R2 |
|---|---|---|---|---|---|---|
| D1 | 356 ± 9 | 80.2 ± 2.3 | 8.9 ± 0.0 | 240 ± 1 | 0.7 ± 0.0 | 99.96 |
| RG1 | 372 ± 10 | 170 ± 6 | 11.9 ± 0.0 | 353 ± 2 | 0.69 ± 0.0 | 99.97 |
| D2 | 296 ± 8 | 74.7 ± 1.2 | 0.61 ± 0.4 | 19.3 ± 1.2 | 7.9 ± 0.02 | 99.97 |
| RG2 | 307 ± 5 | 210 ± 5 | 0.7 ± 0.0 | 80.5 ± 0.4 | 9.6 ± 0.5 | 99.98 |
| Sample | CI (%) | L (nm) |
|---|---|---|
| D2 | 43.2 ± 0.4 | 3.1 ± 0.2 |
| RG2 | 38.2 ± 0.5 | 3.2 ± 0.1 |
| D1 | 36.6 ± 0.4 | 3.3 ± 0.1 |
| RG1 | 36.6 ± 0.2 | 3.1 ± 0.3 |
| FM | H | G | S | S/G | |
|---|---|---|---|---|---|
| FS | 0.96 *** | −0.68 * | 0.67 * | 0.62 | −0.17 |
| FM | −0.72 * | 0.73 * | 0.66 | −0.20 | |
| H | −0.99 ** | −0.94 *** | 0.16 | ||
| G | 0.89 ** | −0.28 | |||
| S | 0.19 |
| Rind Sample | H (mmol/g Lignin) | G (mmol/g Lignin) | S (mmol/g Lignin) | S/G | H/G/S | Total Yield (mmol/g Lignin) |
|---|---|---|---|---|---|---|
| D2 | 0.39 ± 0.04 | 2.68 ± 0.06 | 1.18 ± 0.04 | 0.44 | 9/63/28 | 4.25 |
| RG2 | 0.37 ± 0.02 | 2.25 ± 0.02 | 0.81 ± 0.05 | 0.36 | 11/65/24 | 3.44 |
| D1 | 0.23 ± 0.04 | 1.44 ± 0.01 | 0.34 ± 0.04 | 0.24 | 12/71/17 | 2.00 |
| RG1 | 0.24 ± 0.02 | 1.26 ± 0.02 | 0.36 ± 0.04 | 0.29 | 13/68/19 | 1.87 |
| FM | KL | ASL | TL | Glucan/Cellulose | Hemicellulose | |
|---|---|---|---|---|---|---|
| FS | 0.96 *** | 0.88 *** | −0.78 *** | 0.86 *** | 0.70 *** | −0.35 |
| FM | 0.82 *** | −0.70 *** | 0.81 ** | 0.68 *** | −0.25 | |
| KL | −0.76 ** | 0.99 *** | 0.67 *** | −0.30 | ||
| ASL | −0.69 *** | −0.48 ** | 0.57 | |||
| TL | 0.68 *** | −0.22 | ||||
| Cellulose | −0.62 |
Disclaimer/Publisher’s Note: The statements, opinions and data contained in all publications are solely those of the individual author(s) and contributor(s) and not of MDPI and/or the editor(s). MDPI and/or the editor(s) disclaim responsibility for any injury to people or property resulting from any ideas, methods, instructions or products referred to in the content. |
© 2024 by the authors. Licensee MDPI, Basel, Switzerland. This article is an open access article distributed under the terms and conditions of the Creative Commons Attribution (CC BY) license (https://creativecommons.org/licenses/by/4.0/).
Share and Cite
Mengistie, E.; Bokros, N.; DeBolt, S.; McDonald, A.G. Lodging Variability in Sorghum Stalks Is Dependent on the Biomechanical and Chemical Composition of the Stalk Rinds. Crops 2024, 4, 3-26. https://doi.org/10.3390/crops4010002
Mengistie E, Bokros N, DeBolt S, McDonald AG. Lodging Variability in Sorghum Stalks Is Dependent on the Biomechanical and Chemical Composition of the Stalk Rinds. Crops. 2024; 4(1):3-26. https://doi.org/10.3390/crops4010002
Chicago/Turabian StyleMengistie, Endalkachew, Norbert Bokros, Seth DeBolt, and Armando G. McDonald. 2024. "Lodging Variability in Sorghum Stalks Is Dependent on the Biomechanical and Chemical Composition of the Stalk Rinds" Crops 4, no. 1: 3-26. https://doi.org/10.3390/crops4010002
APA StyleMengistie, E., Bokros, N., DeBolt, S., & McDonald, A. G. (2024). Lodging Variability in Sorghum Stalks Is Dependent on the Biomechanical and Chemical Composition of the Stalk Rinds. Crops, 4(1), 3-26. https://doi.org/10.3390/crops4010002