Article

Predicting Soil Carbon Sequestration and Harvestable C-Biomass of Rice and Wheat by DNDC Model

by
Muhammad Shaukat
1,
Aaron Kinyu Hoshide
2,3,*,
Sher Muhammad
1,
Irshad Ahmad Arshad
4,
Muhammad Mushtaq
5 and
Daniel Carneiro de Abreu
3,6
1
Department of Agricultural Sciences, Faculty of Sciences, Allama Iqbal Open University, Islamabad 44000, Pakistan
2
College of Natural Sciences, Forestry and Agriculture, The University of Maine, Orono, ME 04469, USA
3
AgriSciences, Universidade Federal de Mato Grosso, Campus Sinop, Caixa Postal 729, Sinop 78550-970, MT, Brazil
4
Department of Statistics, Faculty of Sciences, Allama Iqbal Open University, Islamabad 44000, Pakistan
5
Office of Research, Innovation and Commercialization (ORIC), Allama Iqbal Open University, Islamabad 44000, Pakistan
6
Institute of Agricultural and Environmental Sciences, Universidade Federal de Mato Grosso, Campus Sinop, Caixa Postal 729, Sinop 78550-970, MT, Brazil
*
Author to whom correspondence should be addressed.
Crops 2023, 3(3), 220-240; https://doi.org/10.3390/crops3030021
Submission received: 30 April 2023 / Revised: 6 July 2023 / Accepted: 21 July 2023 / Published: 30 August 2023
(This article belongs to the Special Issue Advances in Protected Cropping Technology)

Abstract

:
Several biogeochemical models have been applied to understand the potential effects of management practices on soil organic carbon (SOC) sequestration, crop growth, and yield. In this study, the denitrification and decomposition (DNDC) model was used to simulate soil SOC dynamics and harvested C-biomass in rice–wheat rotation under organic/inorganic fertilization with conventional tillage (CT) and reduced tillage (RT). Before calibration, DNDC underpredicted harvestable grain C-biomass of rice where percent difference (PD) varied from 29.22% to 42.14%, and over-simulated grain C-biomass of wheat where PD was −55.01% with 50% nitrogen–phosphorus–potassium (NPK) and 50% animal manure applied under the CT treatment. However, after calibration by adjusting default values of soil and crop parameters, DNDC simulated harvestable grain C-biomass of both crops very close to observed values (e.g., average PD ranged from −2.81% to −6.17%). DNDC also predicted the effects of nutrient management practices on grain C-biomass of rice/wheat under CT/RT using d-index (0.76 to 0.96) and the calculated root mean squared error (RMSE of 165.36 to 494.18 kg C ha−1). DNDC simulated SOC trends for rice–wheat using measured values of several statistical indices. Regression analysis between modeled and observed SOC dynamics was significant with R2 ranging from 0.35 to 0.46 (p < 0.01), and intercept ranging from 0.30 to 1.34 (p < 0.65). DNDC demonstrated that combined inorganic and organic fertilization may result in higher C-biomass and more SOC sequestration in rice–wheat systems.

1. Introduction

In Pakistan, the farming community has a single goal which is to harvest maximum crop yields in order to feed an increasing population. To achieve this goal, nitrogen fertilizers are intensively applied to increase crop yields [1], resulting in severe environmental problems [2]. Environmental degradation is associated with serious threats of climate change and climate variability because fertilized croplands act as major sources or sinks of greenhouse gases (GHGs) such as carbon dioxide (CO2), nitrous oxide (N2O), and methane (CH4). Furthermore, agricultural fields are also responsible for key nitrogen (N) pollutants such as ammonia (NH3), nitric oxide (NO), and nitrate (NO3−2) that can contaminate watersheds adjacent to these crop fields [3]. In addition to N-fertilization, other crop production practices such as tillage, irrigation, and crop residue management can significantly influence greenhouse gas (GHG) fluxes and hydrological N losses. For an agricultural system, the net CO2 efflux from soil can be conceptualized as an opposite change in soil organic carbon (SOC) where there is a negative change in SOC (-∆SOC). This C fraction is resistant to microbial decomposition and hence could remain in a stable form in the soil for a period of time greater than a decade. This C fraction is referred to as a potential source of atmospheric CO2 at -∆SOC and a sink when ∆SOC is positive. The role of SOC as a sink or source is controlled by temperature and precipitation [4].
SOC is a key factor in controlling soil productivity, soil water holding potential, and nutrient retainability, and is an indicator of land degradation [5]. The improvement in SOC is very essential for Pakistani soils, as these soils have intrinsically low levels of organic matter (OM). Crop management strategies, which lead to a significant increase in SOC, can be promoted to offset CO2 efflux from the soil. It is worth mentioning that carbon sequestration in agricultural lands can play a pivotal role in reducing CO2 emissions, mitigating global warming, and improving the soil’s basic characteristics such as biological, physical, and chemical properties [6].
Long-term sustainability in agriculture depends on the ability to adopt appropriate farming strategies that may slow or reverse the detrimental impacts of intensive tillage on the physical and chemical properties of the soil [7]. Furthermore, the decline in crop productivity has been linked with losses of soil organic matter, nutrients, soil aggregates, and stability of soil particles [8]. Among management practices, the sole use of mineral nutrients [9] has been considered the major soil organic carbon (SOC) reducing factor in rainfed agriculture, which has resulted in the decline of soil fertility [8] and the productivity of agricultural systems. Intensive tillage and inversion of the soil profile promote loss of SOC via the breakdown of crop residues [10]. Animal manure and crop residue management [11,12] have been proposed as the most suitable practices to improve soil health by enhancing SOC density and infiltration capacity, decreasing soil bulk density, as well as promoting the stability of soil aggregates and SOC [10].
Agricultural systems have a complex nature as they involve the interaction among crops, soil, the atmosphere, and management practices. Understanding these interactions is not an easy task; however, dynamic models are effective tools to integrate the components and processes of whole systems for easy understanding. These models can also be applied to understanding the mechanisms and necessary approaches to predict crop yield, as well as contribute to agricultural policy formulation [13]. Several researchers [14,15,16,17] have published their work to highlight the importance of biogeochemical models in simulating SOC dynamics in response to different management strategies. These process-based models include Roth-C, CENTURY, LPJ-DGVM, GEFSOC, AMG, and CEVSA which have been used to examine the potential effects of management practices within agricultural systems [18]. But these models are only good at predicting soil processes.
The denitrification and decomposition (DNDC) model is a process-based model which has the potential to simulate carbon (C) and nitrogen (N) cycling, including trace gas emissions, global warming potential (GWP) of major greenhouse gases (CO2, CH4, and N2O), soil carbon sequestration, crop growth, water use efficiency, and N leaching in agroecosystems [19]. The DNDC model also has the capability to simulate soils, crops, and environmental processes, and can integrate a multitude of factors to simulate at both a site-scale as well as at a regional level [20,21,22]. Additionally, the DNDC model can predict C/N balance, C sequestration potential of soils, and GWP of GHG emissions at regional or national scales [19,23].
To the best of our knowledge, there is still no study that has been conducted to simulate SOC dynamics and crop production in response to organic and inorganic fertilization using both conventional and reduced tillage practices in a rice–wheat system in Pakistan. This study was planned with the following objectives: (1) to capture trends in harvestable C-biomass of rice and wheat using the DNDC model under different organo-mineral fertilization and tillage systems, and (2) to model the changes in SOC dynamics under these different organo-mineral fertilization and tillage systems in soils used for rice–wheat production.

2. Materials and Methods

2.1. Experimental Description

A two-year field study was carried out at the agronomic research station of the University of Agriculture in Faisalabad, Pakistan to study the effects of organic and mineral fertilization on soil organic carbon sequestration and harvestable C-biomass in a rice–wheat rotation. Detailed information about the experimental setup, crop management, measurement methods, and soil analysis is available in Shaukat et al. [24]. Tillage systems during the rice season and the wheat season were the (1) conventional tillage (CT) treatment (two cultivations with a tractor-drawn cultivator along with one rotavator pass followed by planking for rice, and three cultivations along with one rotavator pass followed by planking for wheat) and the (2) reduced tillage (RT) treatment (one cultivation along with one rotavator for both crops). The fertilization management treatments were as follows: (1) control (T1); (2) treatment 2 (T2, NPK) which had recommended doses of mineral nitrogen (N), phosphorus (P), and potassium (K) applied; (3) treatment 3 (T3) with animal manure (M at 20 Mg ha−1) applied at area farmers’ recommended dose; (4) treatment 4 (T4) with 100% of crop residue incorporated that left over from the previous crop(s); (5) treatment 5 (T5; NPKM5/5) with 50% NPK and 50% manure (10 Mg ha−1); (6) treatment 6 (T6; NPKS5/5) with 50% NPK and 50% crop residue; (7) treatment 7 (T7, 0.25NPKM + 0.5S) which had 25% NPK, 25% manure (5 Mg ha−1), and 50% crop residue; and (8) treatment 8 (T8, 0.25NPKS + 0.5M) with 25% NPK, 25% crop residue, and 50% manure (10 Mg ha−1). Tillage treatments were randomly allocated in main plots, and nutrient management treatments were randomized in sub-plots of a split-plot design. Each treatment was replicated three times.
For the RT NPK treatment, the rates of N, P, and K were 140, 80, and 86 kg ha−1, respectively, for rice, and in the case of wheat, these were 120, 80, and 60 kg ha−1, respectively. Similarly, the doses of N, P, and K for the remaining treatments were calculated as per their proportionate application. In this experiment, all P, K, and one-third of N were applied at sowing or transplanting of both crops. Next, one-third of N was applied at the tillering stage for both rice and wheat. The remaining one-third of N was applied during the booting stage for both crops. The nutrient analysis for fertilizers (% N-P-K) was specified for urea (46-0-0), diammonium phosphate (18-46-0), and potassium sulfate (0-0-50).
For the 100% CRI treatment, the aboveground crop stubbles were collected from pre-existing rice grown under RT NPK after harvest. The rice stubbles per unit area were estimated (n = 3) and ranged from 6000 to 7200 kg ha−1. About 6000 kg ha−1 of rice straw was applied. This experiment started with the sowing of wheat, and rice stubbles already collected were cut into 3 cm sections [24] and returned to the field. After the harvest of wheat, wheat stubble yield under the RT NPK treatment (n = 3) was calculated, and this ranged from 5500 to 6500 kg ha−1. An application of 5500 kg wheat straw ha−1 was incorporated into the soil before transplanting rice. Prior to this experiment, soil analyses indicated that the proportions of clay, silt, and sand at 15 cm soil depth were 27%, 54%, and 19%, respectively. Other soil characteristics were bulk density (1.49 g m−3), pH (8.21), organic matter (0.51%), total N content (0.41 g kg−1), total P content (0.44 g kg−1), and total K content (31.11 g kg−1).
Organic materials were also analyzed in the laboratory for their nutrient status. Characteristics of manure were contents (%) of moisture (39.5%), carbon (29.6%), N (0.8%), P (0.21%), and K (0.61%). Similarly, the wheat straw contents (%) were measured for moisture (10.5%), carbon (39.5%), N (1.13%), P (0.40%), and K (2.02%). Rice straw was 15.5% moisture, 41.31% carbon, 0.98% N, 0.18% P, and 1.62% K. In this study, the soil volumetric water contents (%) were also determined at 60 and 120 days after sowing or transplanting of wheat and rice during both years. These measurements were taken at a depth of 10 cm in each replicate of treatments using TDR-100 time-domain reflectometer probes (Field scout TDR-100 system, Spectrum Technologies, Inc. Aurora, IL, USA).

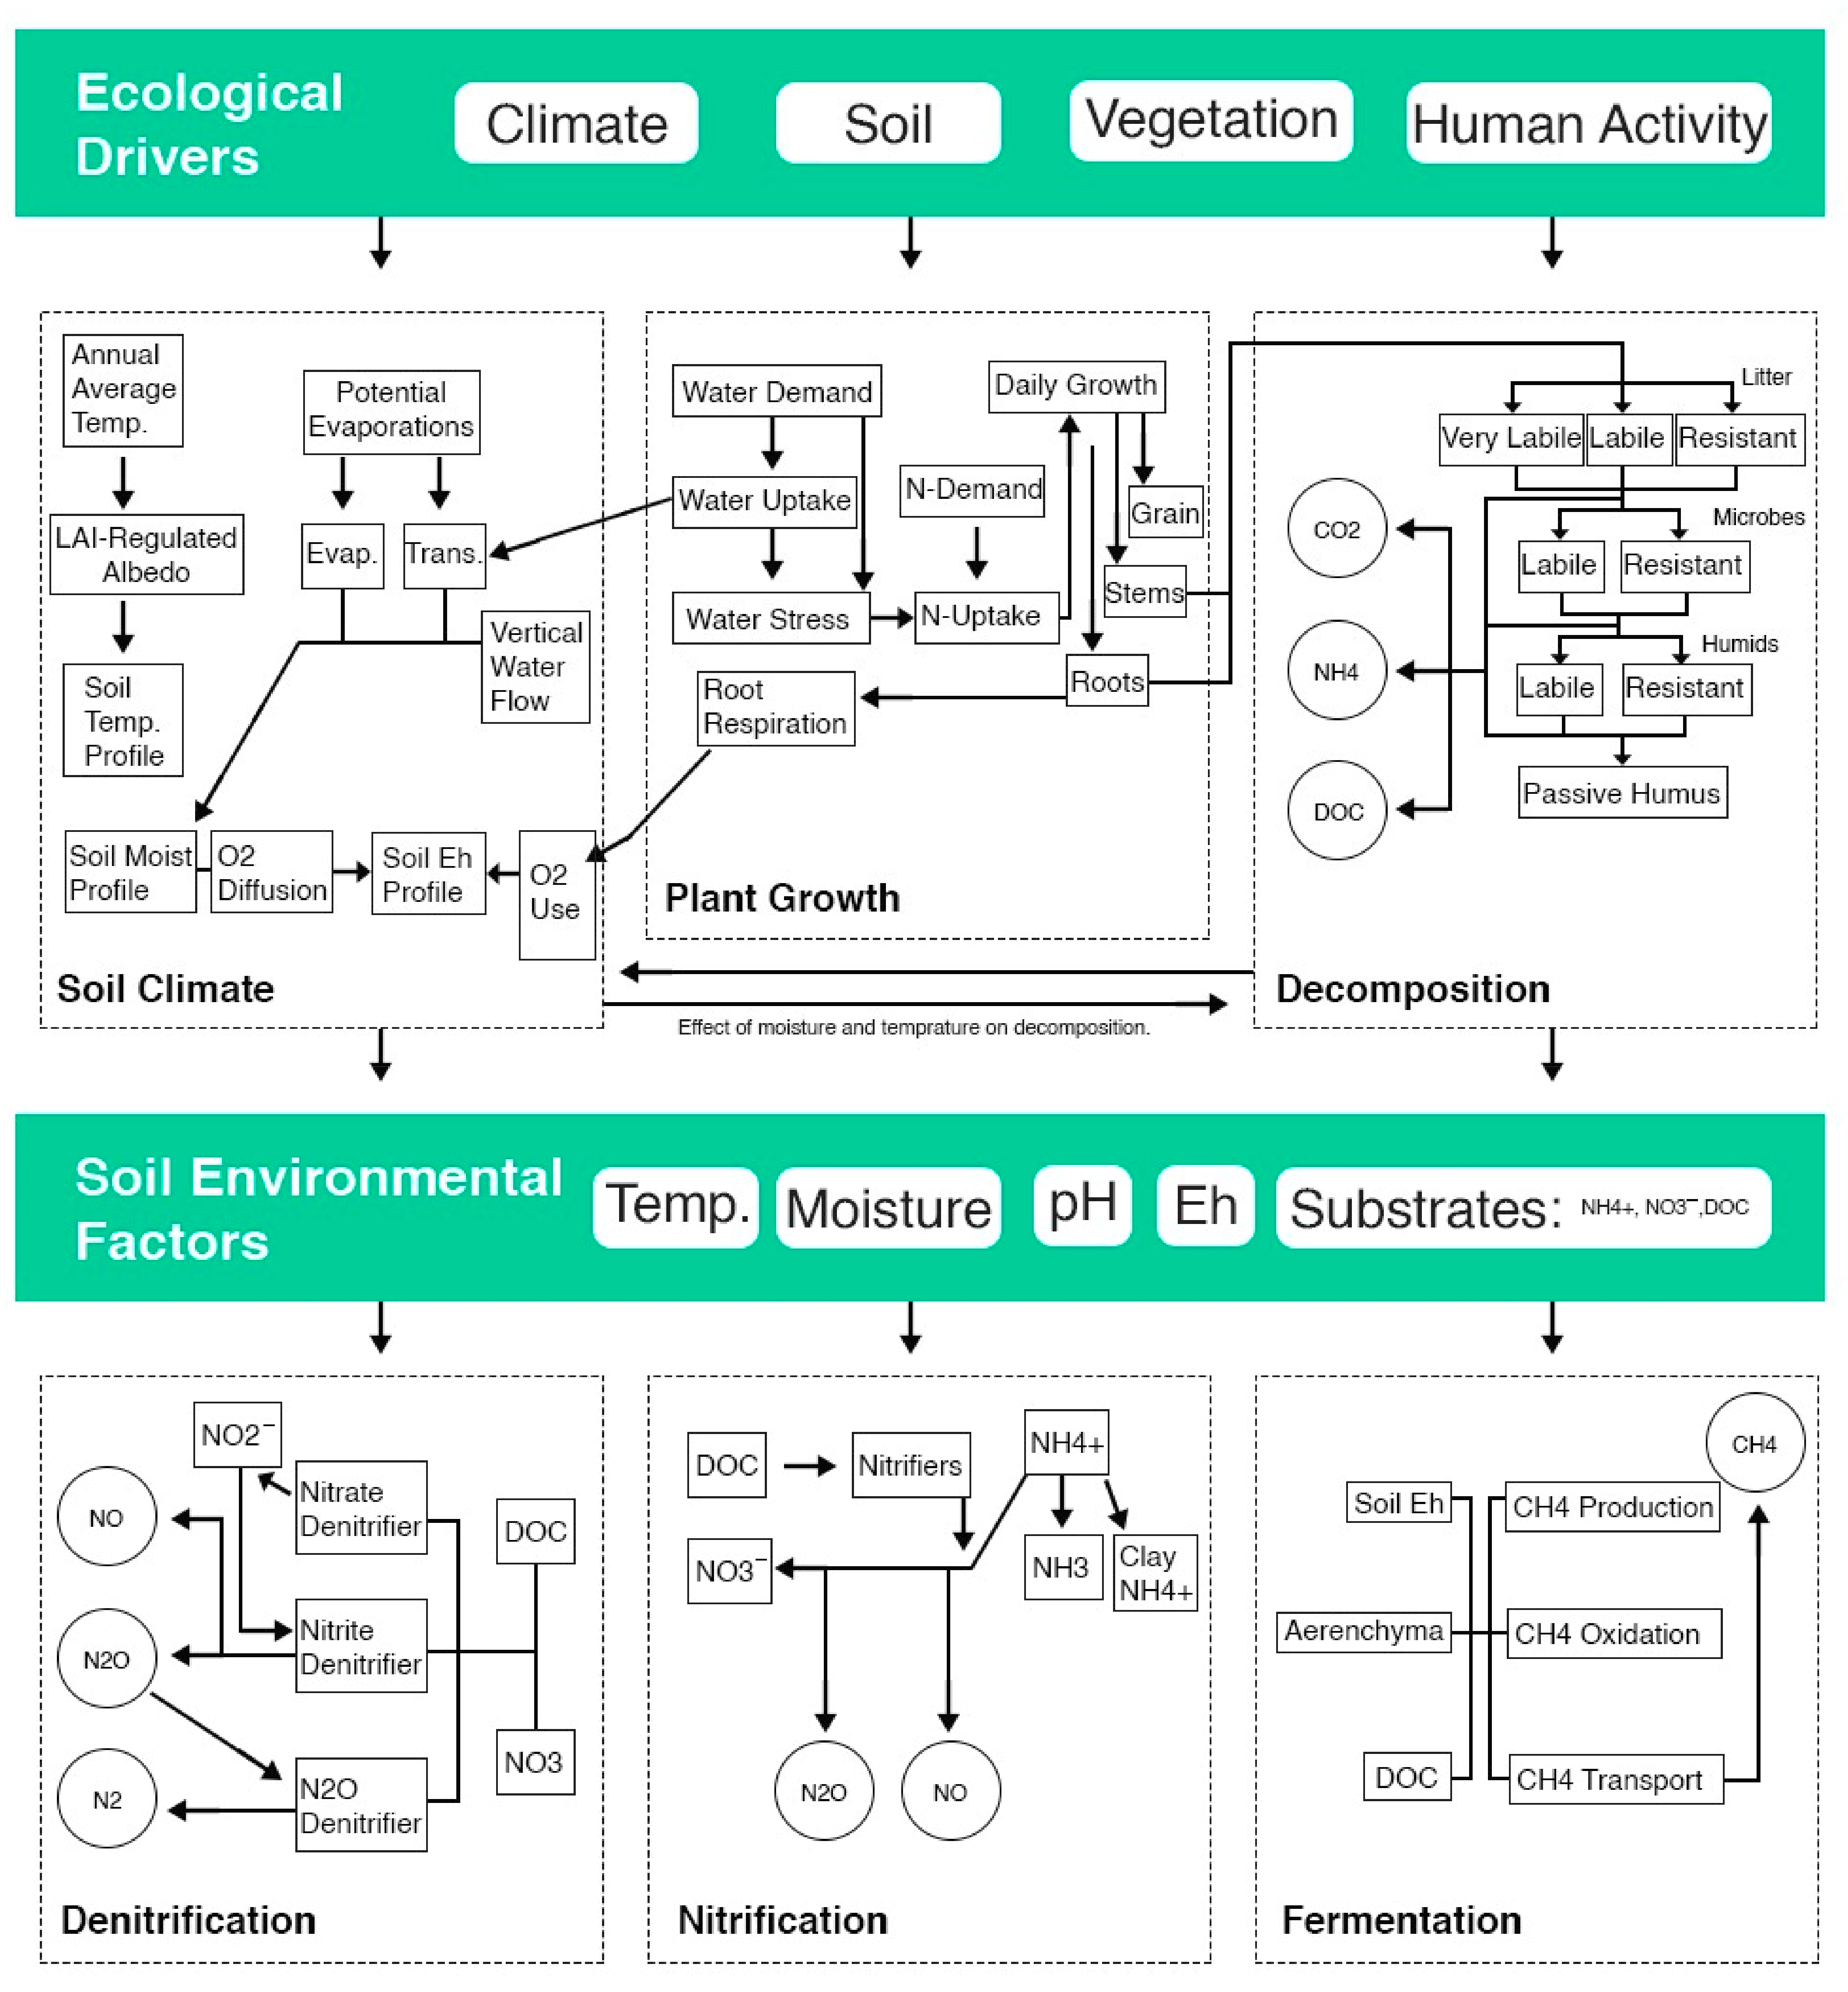
2.2. DNDC Model Setup

The DNDC model (version 9.5 downloaded from http://www.dndc.sr.unh.edu/, accessed on 15 February 2022) [25] was calibrated to capture the soil organic carbon dynamics as a function of weather, soil, crop growth, and management inputs. DNDC is a good tool to simulate C and N cycling in agroecosystems because it has both physio-chemical and biochemical components [9,25,26]. The conceptual framework and flowchart of the DNDC model are summarized in Figure 1.
There are a number of ecological drivers such as climate, soil, vegetation, and human activities that affect the physio-chemical components of agricultural systems (e.g., soil climate, crop growth, and decomposition rate). These physio-chemical components within DNDC are linked with soil environmental attributes including, soil temperature, soil moisture, soil pH, redox potential, and available substrates in the form of ammonium ion (NH4+), nitrate ion (NO3) and dissolved organic carbon. The biochemical components of DNDC include nitrification, fermentation, and denitrification which predict N and C transformation that are mediated by soil microbes and are governed by the aforementioned soil environmental factors [27]. These sub-modules in DNDC control the prediction of CH4, NH3, N2O, dinitrogen (N2), and CO2 emissions from soil–plant systems to the atmosphere. The soil organic carbon patterns are governed by soil environmental variables-(e.g., soil moisture and temperature). The latter variables are linked with ecological drivers (e.g., soil characteristics, climate, vegetation, and management activities).
Figure 1. Conceptual framework of the DNDC model and its components [28].
Crops 03 00021 g001

Input Dataset for DNDC

To gather the necessary data to run the DNDC model, a two-year study was executed, and measurements on crop growth, harvested C-biomass, and soil organic carbon (SOC) were made and applied to calibrate and validate the DNDC model. DNDC’s simulations were carried out using daily climate data (e.g., maximum temperature (Tmax), minimum temperature (Tmin), rainfall, and incident solar energy), edaphic parameters (soil organic C, bulk density, soil texture, clay fraction, pH, field capacity, etc.), as well as agronomic management practices employed at the study site. The DNDC model was run to estimate SOC dynamics, crop growth processes (e.g., leaf area index), leaf plus stem biomass, and harvested grain biomass for each crop.

2.3. DNDC Parameterization

In terms of crop parameters for the wheat crop, the default values from DNDC’s crop library were modified for spring wheat (Table 1). However, crop parameters for rice were adjusted with the measurements recorded at the experimental site under the conventional tillage (CT) NPKM 5/5 treatment. DNDC was calibrated with this best-performing treatment for both wheat and rice.
A spin-up period of 10 years was established in DNDC prior to the main experimental study in order to stabilize the partitioning of the carbon (C) and nitrogen (N) pools, which was used for previously reported studies [22,29]. First, the DNDC model was run with measured soil parameters (e.g., SOC, clay fraction, pH, bulk density, field capacity, and wilting point) and crop parameters (e.g., biomass and its fraction, total degree days) under each treatment. The calibration of DNDC was conducted under the conventional tillage (CT) NPKM 5/5 treatment by changing the values of biomass C/N ratio, total degree days (°C-days), N fixation index (plant N/N from soil), water demand (g H2O/g DM), and optimum temperature (°C; Table 2).

2.4. Model Evaluation Indices

Six statistical indices including mean percent difference (MPD), root mean square error (RMSE), normalized RMSE (nRMSE), mean absolute error (MAE), index of agreement (d), and modeling efficiency (ME) were used for both model calibration and evaluation as well as during model validation. The significance of each index has been documented by Yang et al. 2014 [30] and Li et al. 1997 [20]. Each index assesses only an aspect of the performance of the model. Applying each of the six indices would be useful to quantify the performances of model simulations. The six statistical indices were computed by using the following equations:
MPD = i   = 1 n Oi Pi Oi × 100 / n  
RMSE = i   = 1 n   P i O i 2 n
nRMSE = RMSE O ¯ × 100
MAE = 1   n × i   = 1 n   O i P i  
d = 1 i   = 1 n   ( P i   O i   ) 2 i   = 1 n (   P i O ¯ + O i   O ¯ ) 2
ME = 1 i   = 1 n   ( P i   O i ) 2 i   = 1 n   ( O i O ¯ ) 2
where Pi is the predicted value, Oi is the observed value, n is the number of observed values, and   Oi ¯ is the mean of observed values.

3. Results

3.1. Model Calibration

Before calibration, DNDC performance was tested by simulating harvested C-biomass of rice and wheat under the conventional tillage (CT) NPKM5/5 treatment with default values of soil and crop parameters. Under this treatment, DNDC predicted the harvestable straw C-biomass of wheat with a percent difference (PD) of −3.31% (3144.8 kg ha−1 against 3043.75 kg ha−1 which was observed). However, DNDC over-simulated the harvestable grain C-biomass of wheat with a PD of −55.01%. In the case of rice, DNDC underpredicted both straw and grain yields (e.g., PD ranged from 29.22 to 42.14; Table 3). The DNDC model was calibrated using a parameters adjustment approach. After calibration, DNDC simulated the harvestable straw and grain C biomasses of wheat closely compared to observed values where PD ranged from −2.81% to −6.17%. Similarly, DNDC also closely predicted the aboveground biomass of rice where the percent difference ranged from −6.03% to 19.44% (Table 3).
DNDC captured the periodic changes in leaf expansion in terms of leaf area index (LAI) for both wheat and rice during both years of the experiment. The calibrated treatment’s predicted and observed values of LAI were very close over the growth period of wheat (Figure 2). Similarly, DNDC also predicted the LAI of rice very closely to the observed values of LAI over two growing seasons using the calibrated treatment (Figure 3).

3.2. Model Evaluation

After calibration, the DNDC model was further evaluated with data collected during the first year of the experiment from the remaining nutrient management treatments under both the conventional tillage and the reduced tillage systems. During the evaluation process, the DNDC model simulated the harvestable grain C-biomass of rice with reasonable agreement since the d-index varied between 0.85 and 0.86, and the calculated root mean squared error (RMSE) ranged from 374.98 to 380.69 kg C ha−1. The mean percent difference (MPD) and normalized RMSE (nRMSE) were at −2.62% to −16.99% and 25.39% to 25.87%, respectively. The values of the mean error (ME) were very low, ranging from −0.01 to 0.09 (Table 4). Regarding the straw C-biomass of rice, DNDC’s predictions were in agreement with the field measurements since calculated RMSE ranged from 769.83 to 966.22 kg C ha−1 and d-index at 0.69 to 0.73, MPD and nRMSE were at −17.83% to −28.90% and 26.67% to 31.42%, respectively (Table 4).
DNDC adequately simulated the grain C-biomass of wheat since the d-index varied from 0.76 to 0.77, and the calculated root mean squared error (RMSE) ranged from 499.98 to 510.39 kg C ha−1. Mean percent difference (MPD) and normalized RMSE (nRMSE) were 26.11% to 27.49% and 30.75% to 31.87%, respectively. The mean error (ME) values were very low, ranging from −0.05 to −0.08 (Table 4). For straw C-biomass of wheat, DNDC estimates were in agreement with observed values since the calculated RMSE ranged from 657.44 to 747.15 kg C ha−1, the d-index was 0.65 to 0.74, and MPD and nRMSE ranged from 27.16% to 33.32% and 29.16% to 33.32%, respectively (Table 4).

3.3. Validation of DNDC

It is necessary that a calibrated and evaluated model must be validated with an independent dataset to assess the accuracy of a model’s predictions by using adjusted model parameters during the calibration process. Therefore, the DNDC model was further validated with second-year data for all treatments. Results show that DNDC predicted the harvestable grain C-biomass of rice well since the d-index varied from 0.76 to 0.84, calculated RMSE ranged from 360.62 to 494.18 kg C ha−1, and MPD and nRMSE were −20.62% to −31.05% and 22.96% to 31.26%, respectively (Table 5).
In terms of the harvestable straw C-biomass of rice, the DNDC model simulations were in agreement as the calculated RMSE varied from 849.65 to 1144.48 kg C ha−1 and the d-index ranged from 0.63 to 0.69, while MPD and nRMSE were −20.82% to −32.79% and 26.75% to 34.35%, respectively (Table 5). The DNDC model also modeled the harvestable grain C-biomass of wheat well since the d-index varied from 0.92 to 0.96, the calculated RMSE ranged from 165.36 to 242.33 kg C ha−1, and MPD and nRMSE were at −2.88% to −3.99% and 8.47% to 12.02%, respectively. The ME value was considerably high, which ranged from 0.75 to 0.87 (Table 5). Furthermore, the modeled straw C-biomass was in agreement with observed values as the calculated RMSE ranged from 212.14 to 230.85 kg C ha−1 and the d-index was 0.95 to 0.96, while −1.71% < MPD < 2.21%, and 7.09% < nRMSE < 7.76% (Table 5). The simulated SOC contents were comparable to measured values, as indicated by several statistical indices (−0.75 < ME < 0.42; 0.68 g kg−1 < RMSE < 1.06 g kg−1; 0.70 < d < 0.87; 10.94% < nRMSE < 16.26%; 4.82% < MPD < 5.77%; and 0.31 < MAE < 0.34 (Table 5).

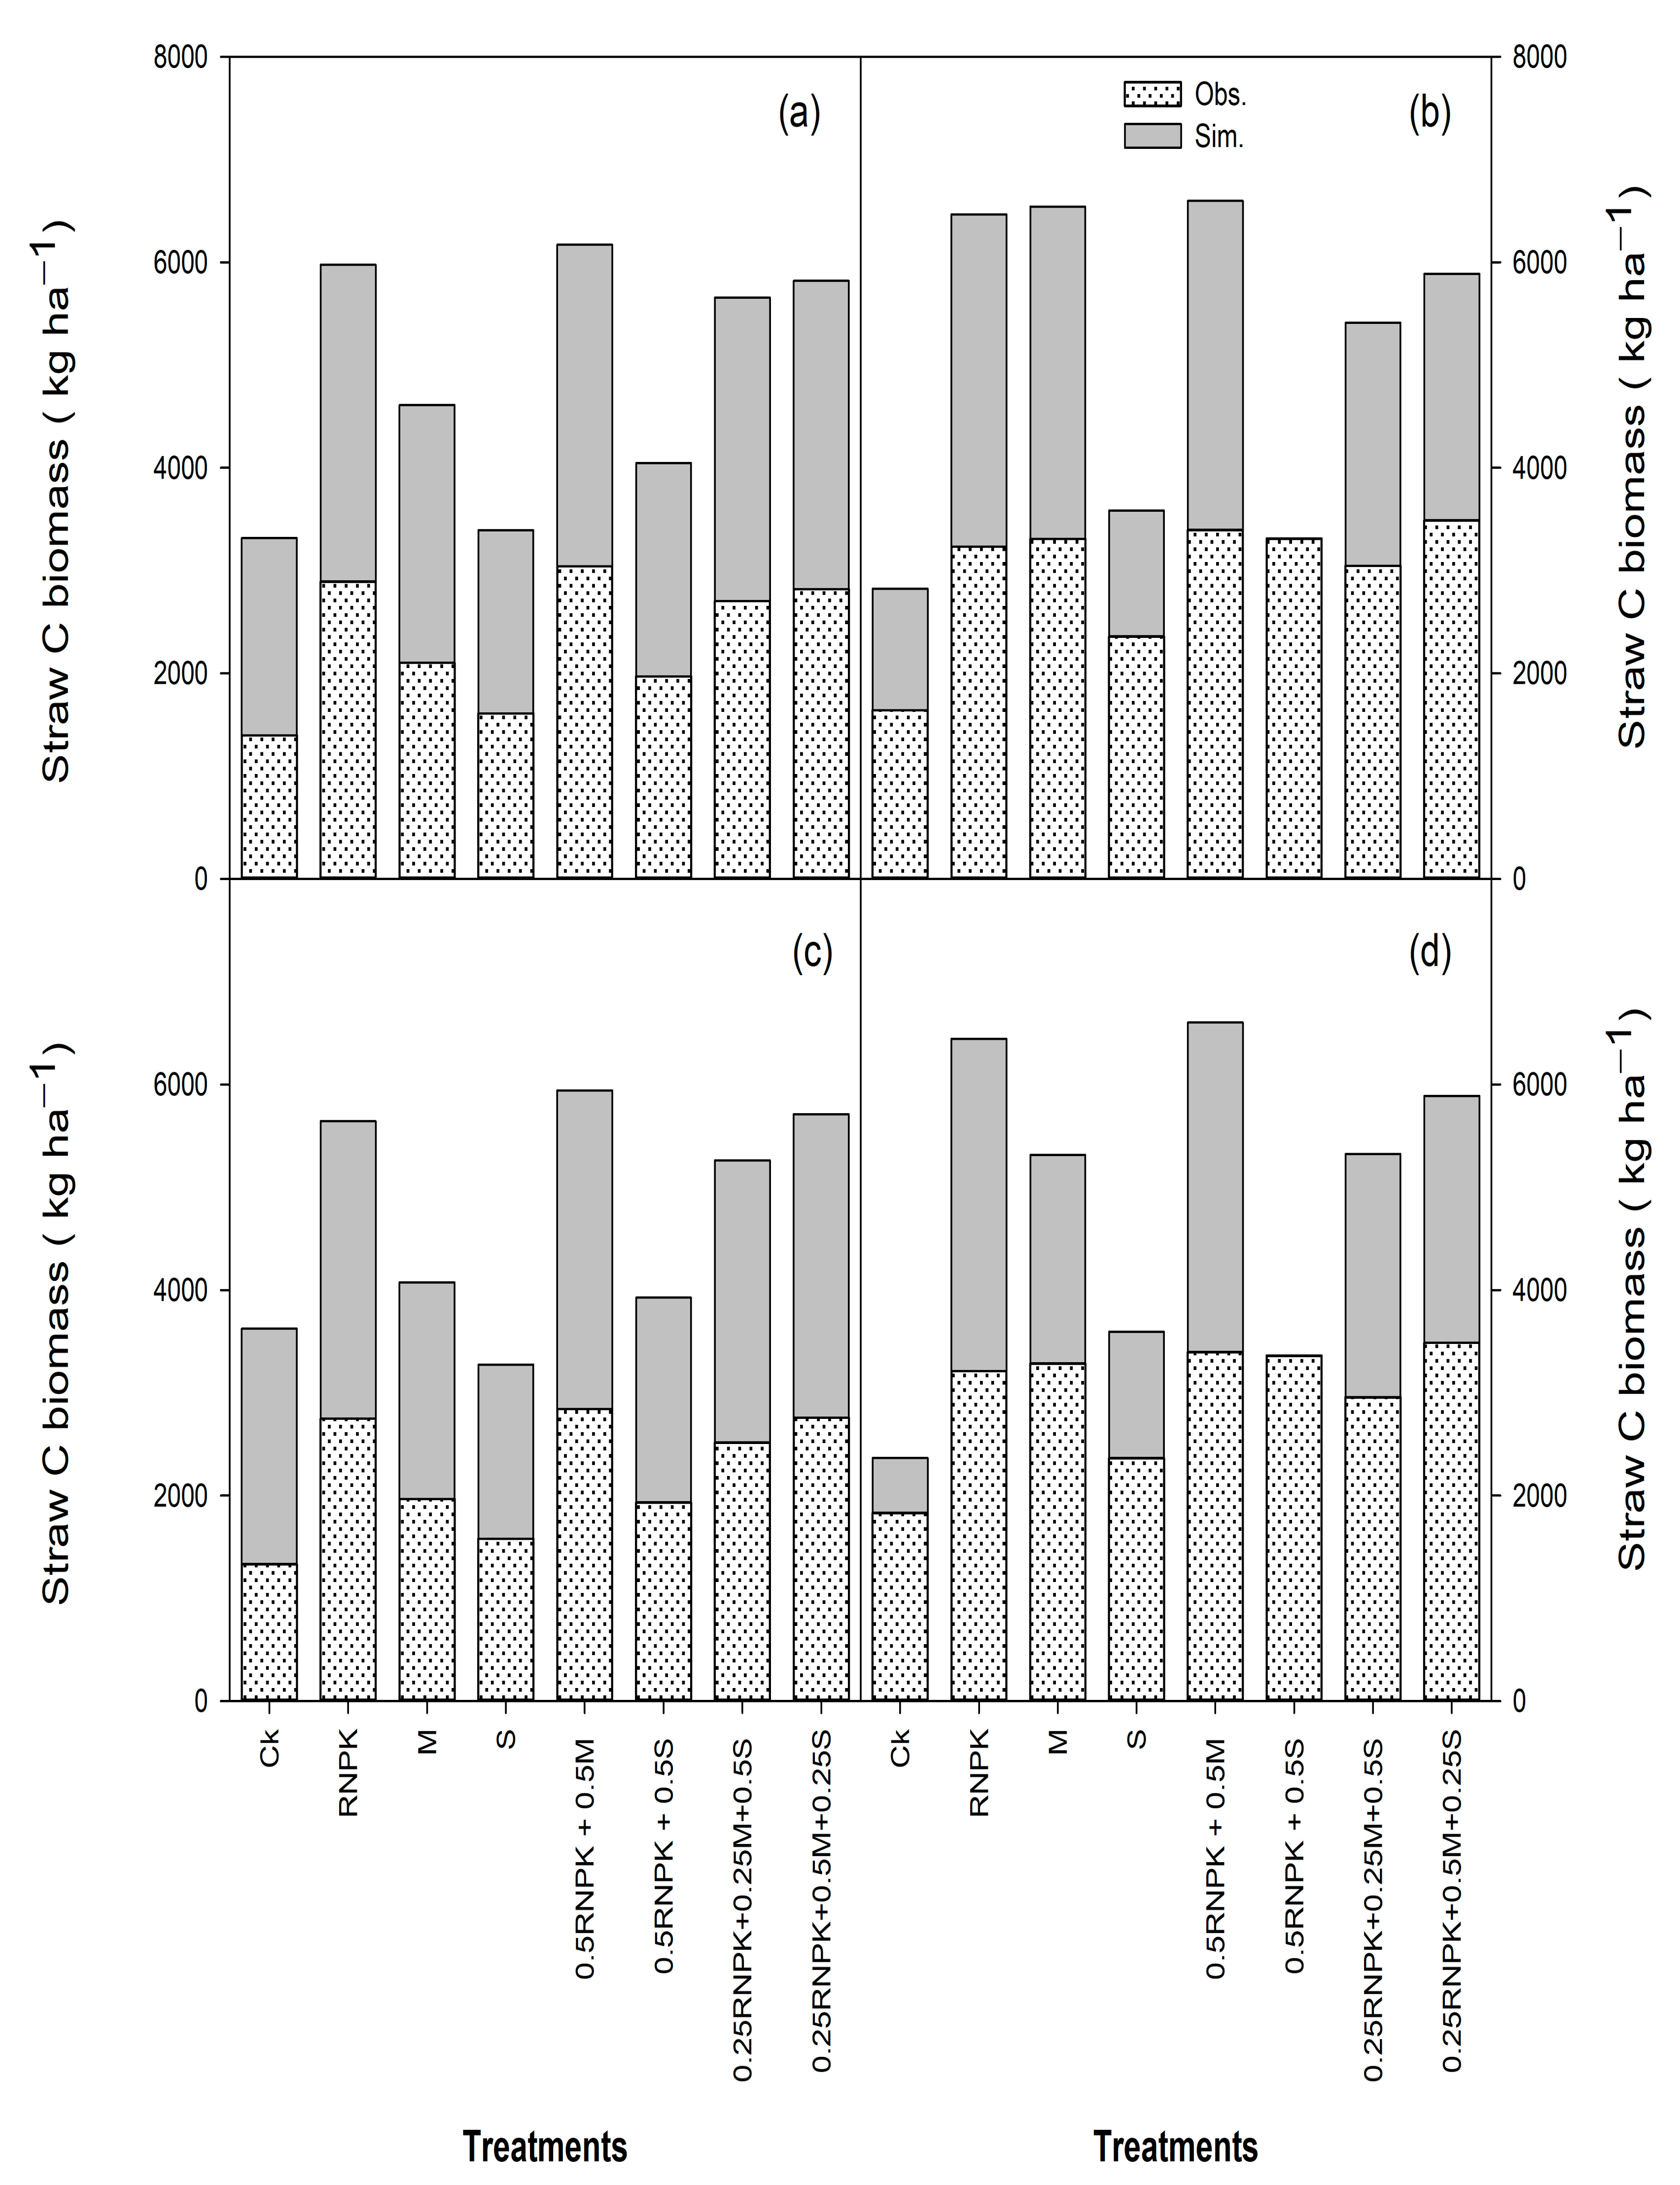
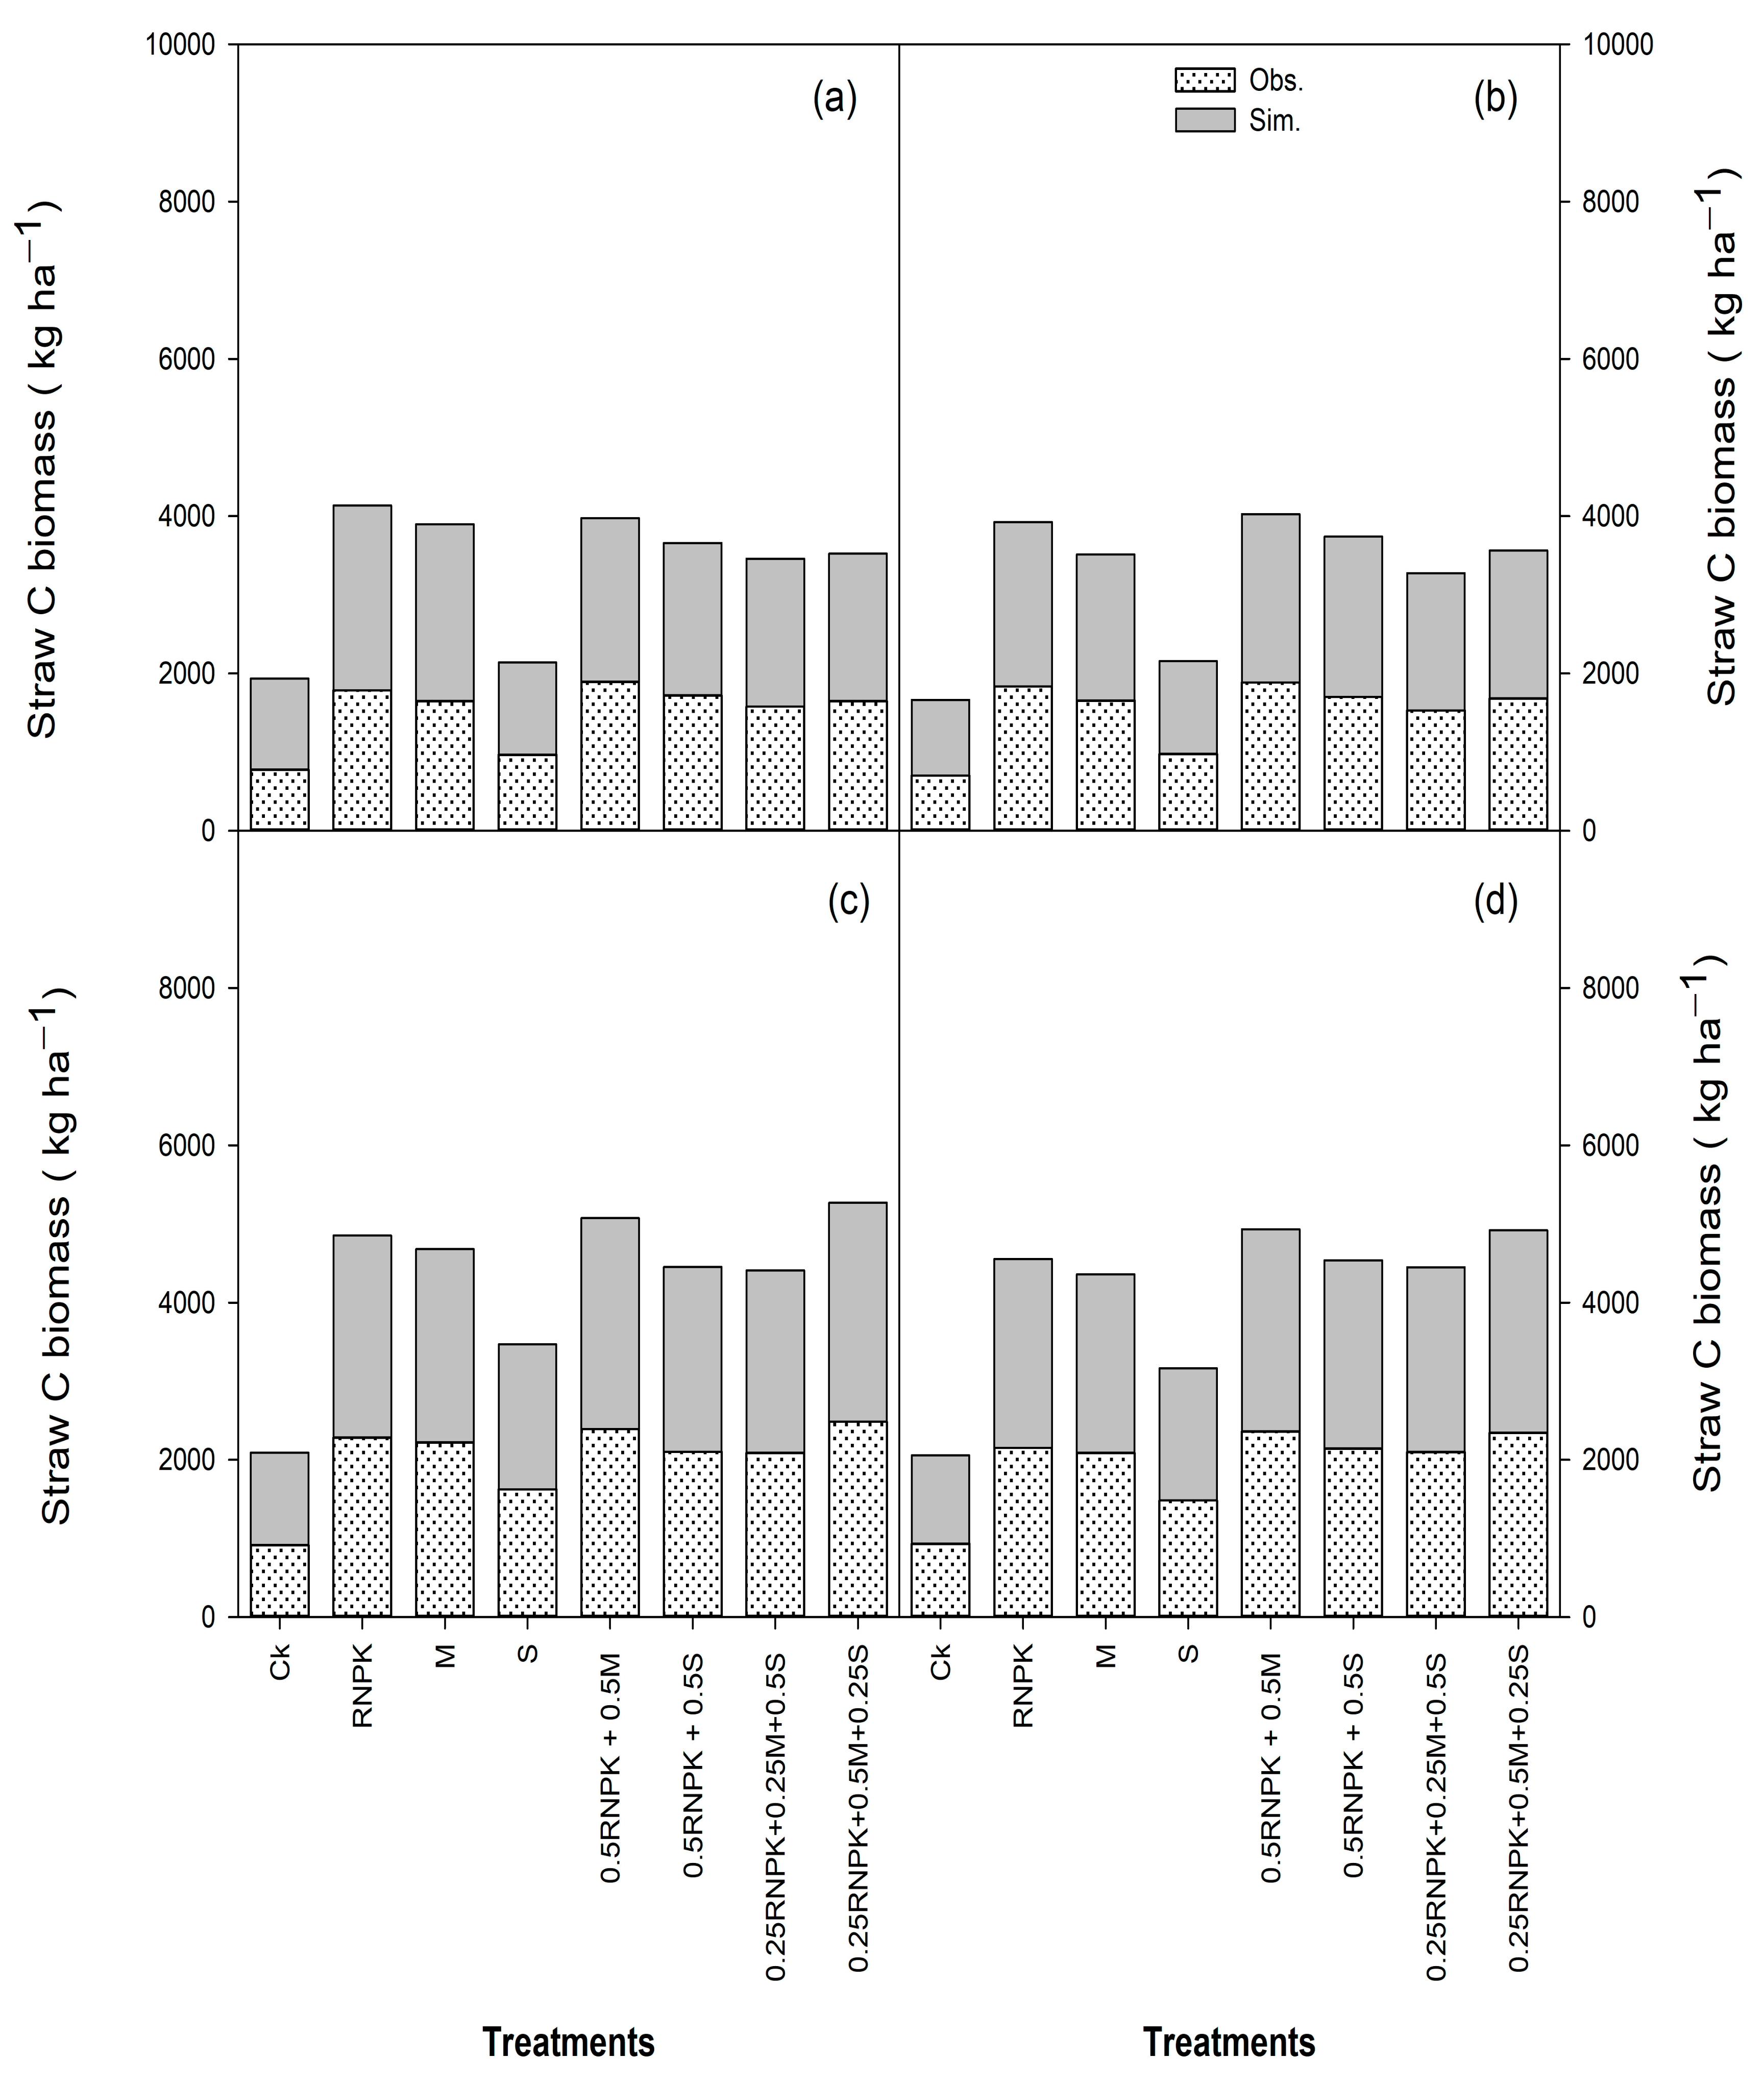
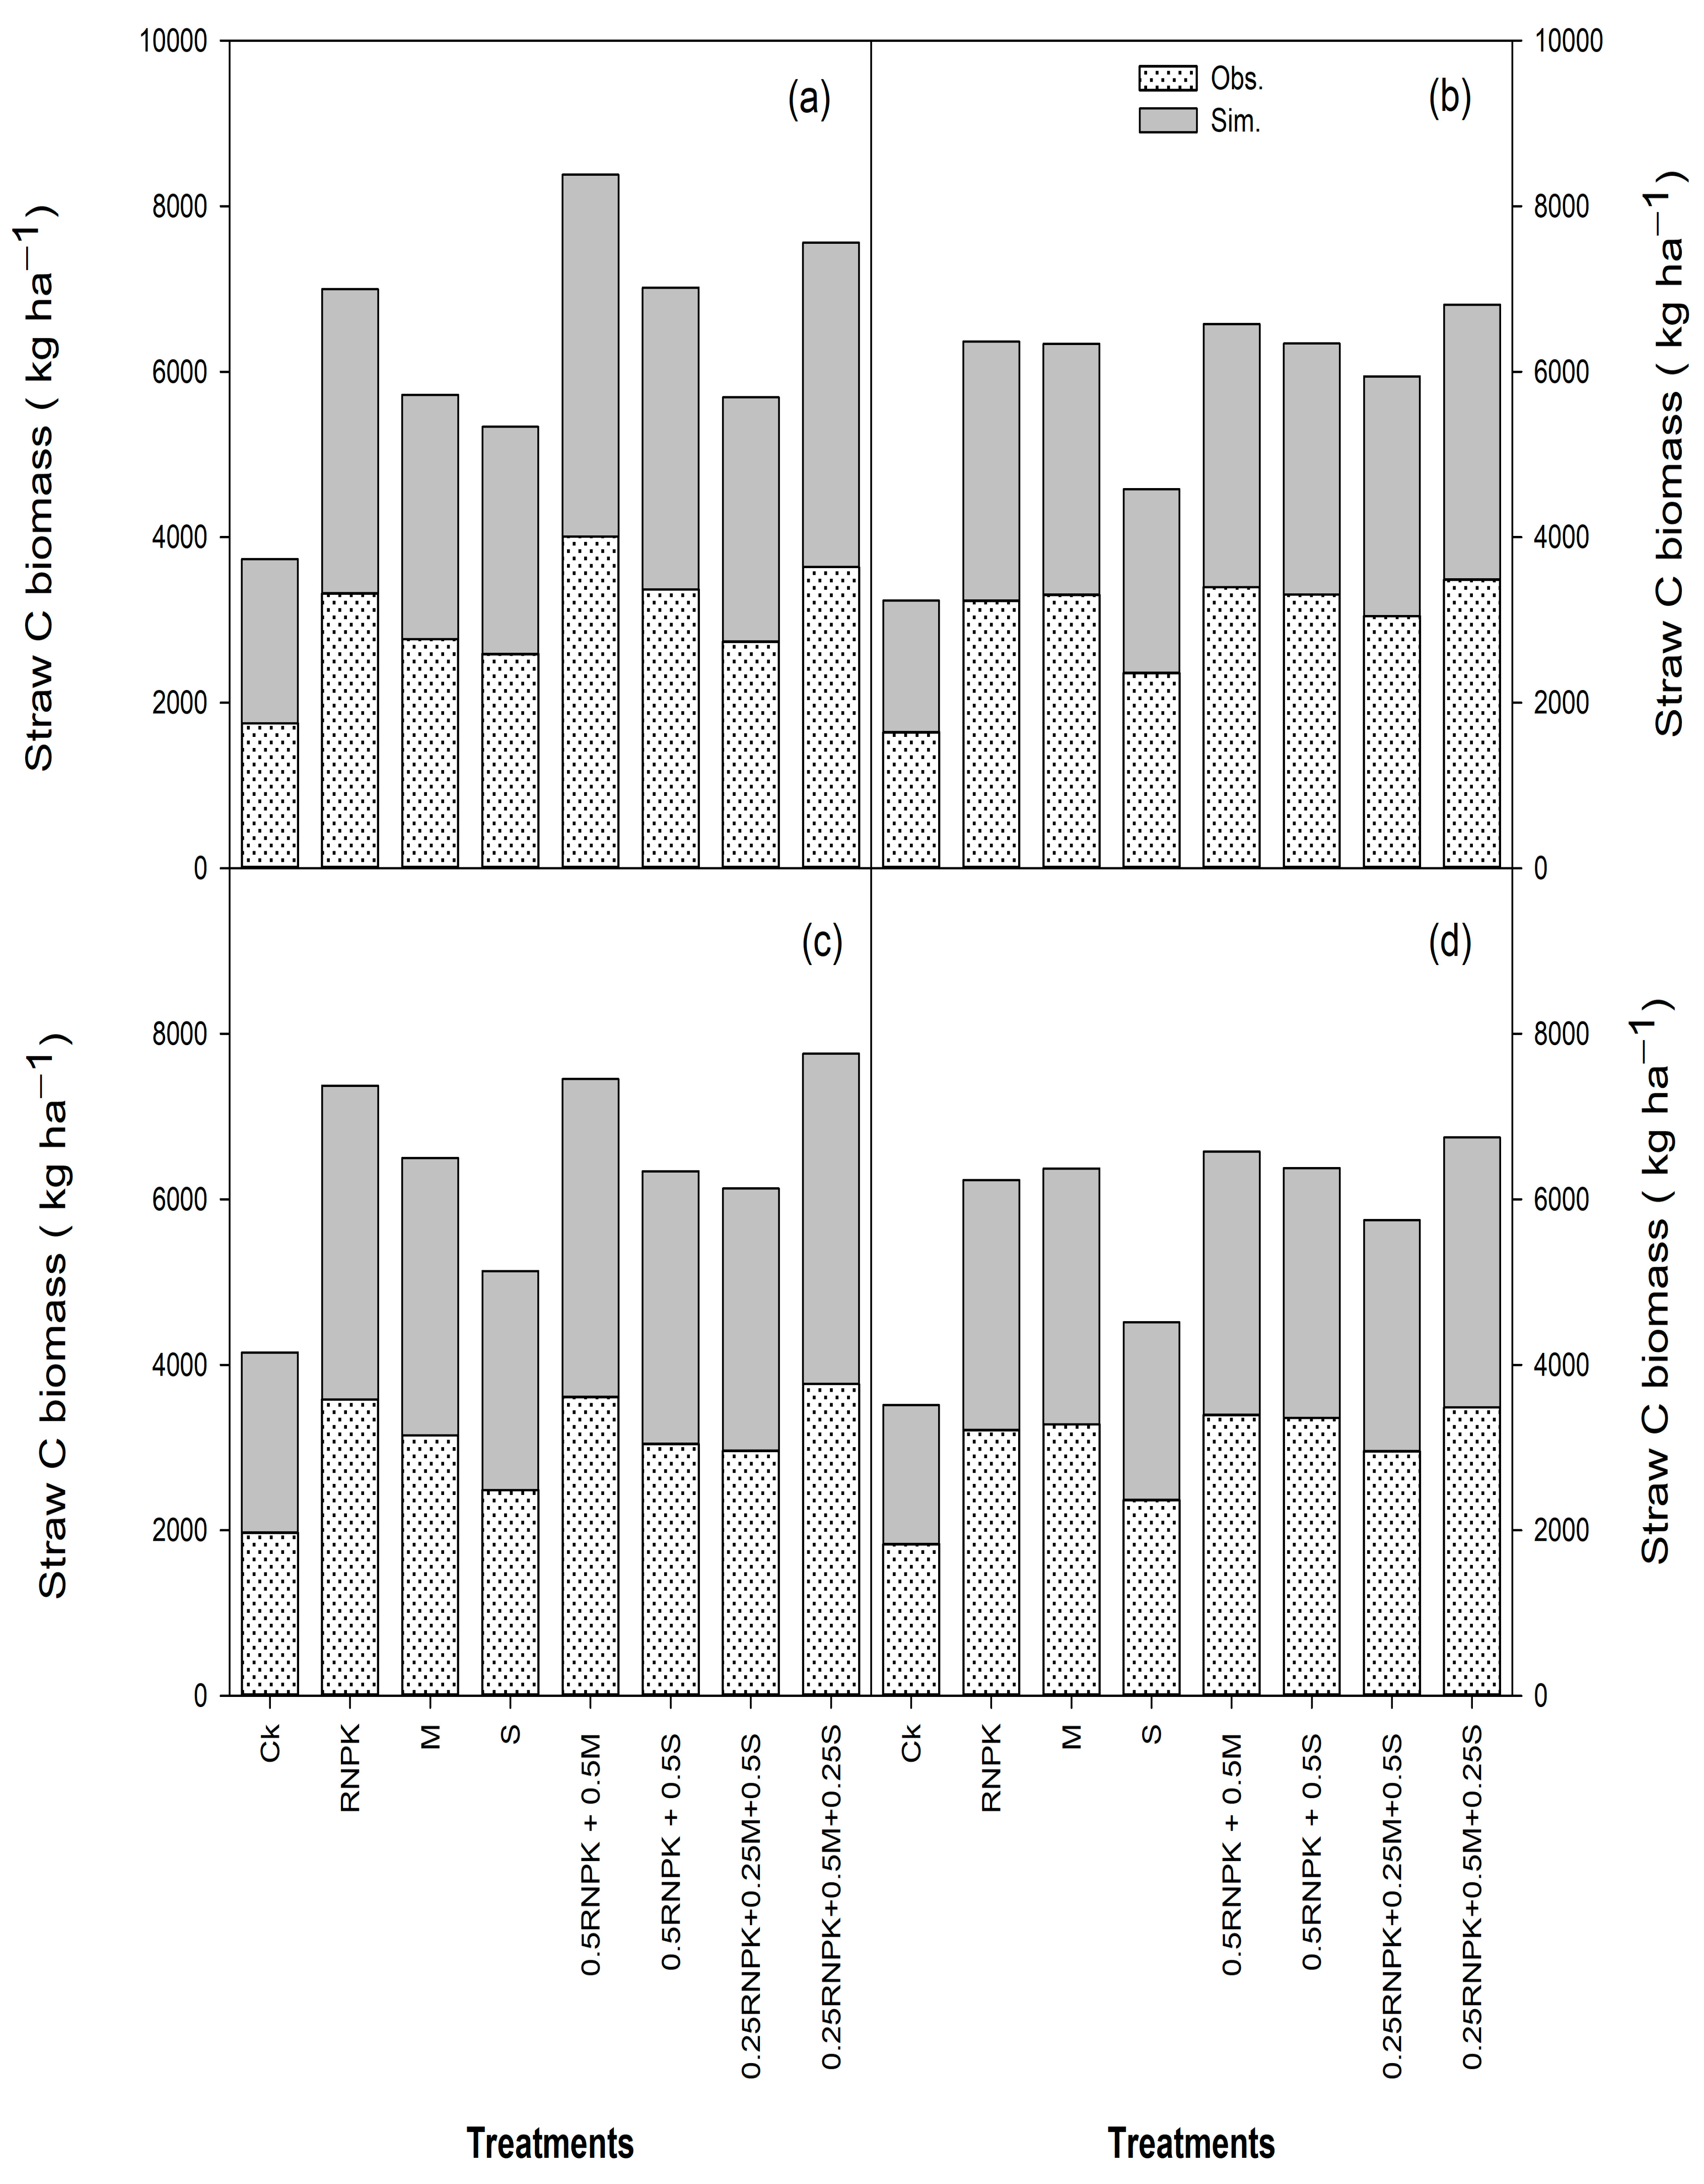
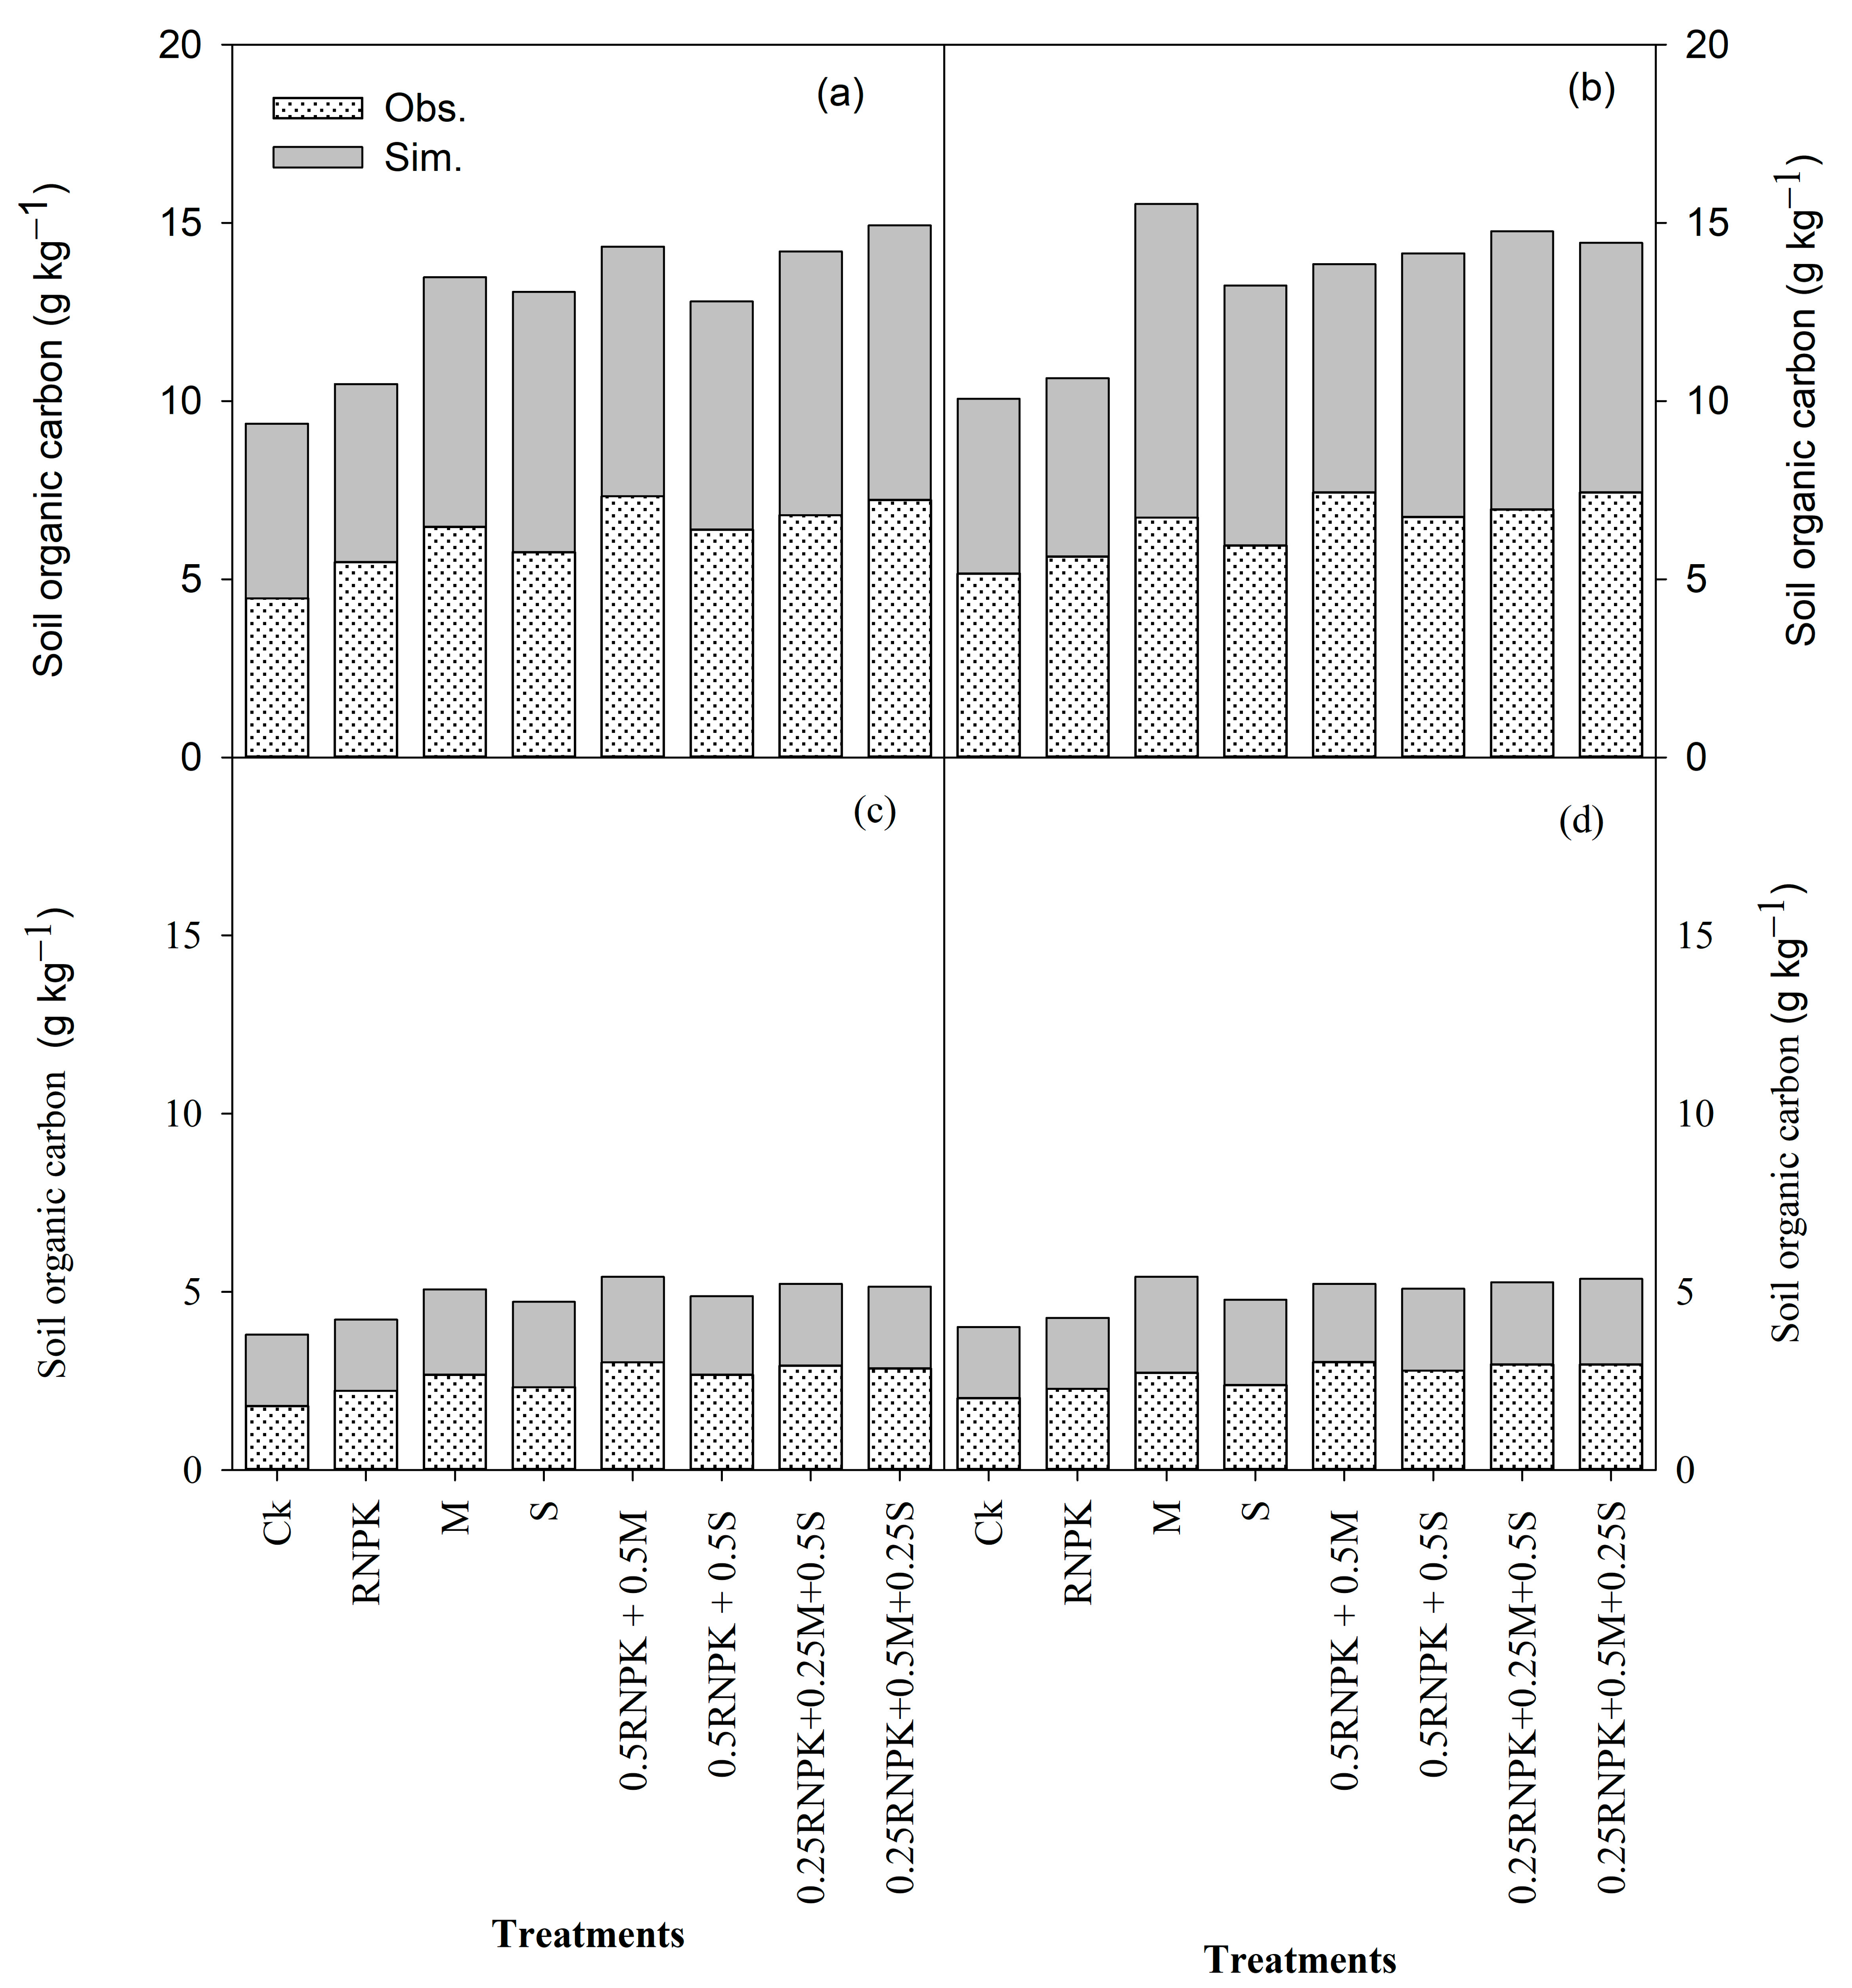
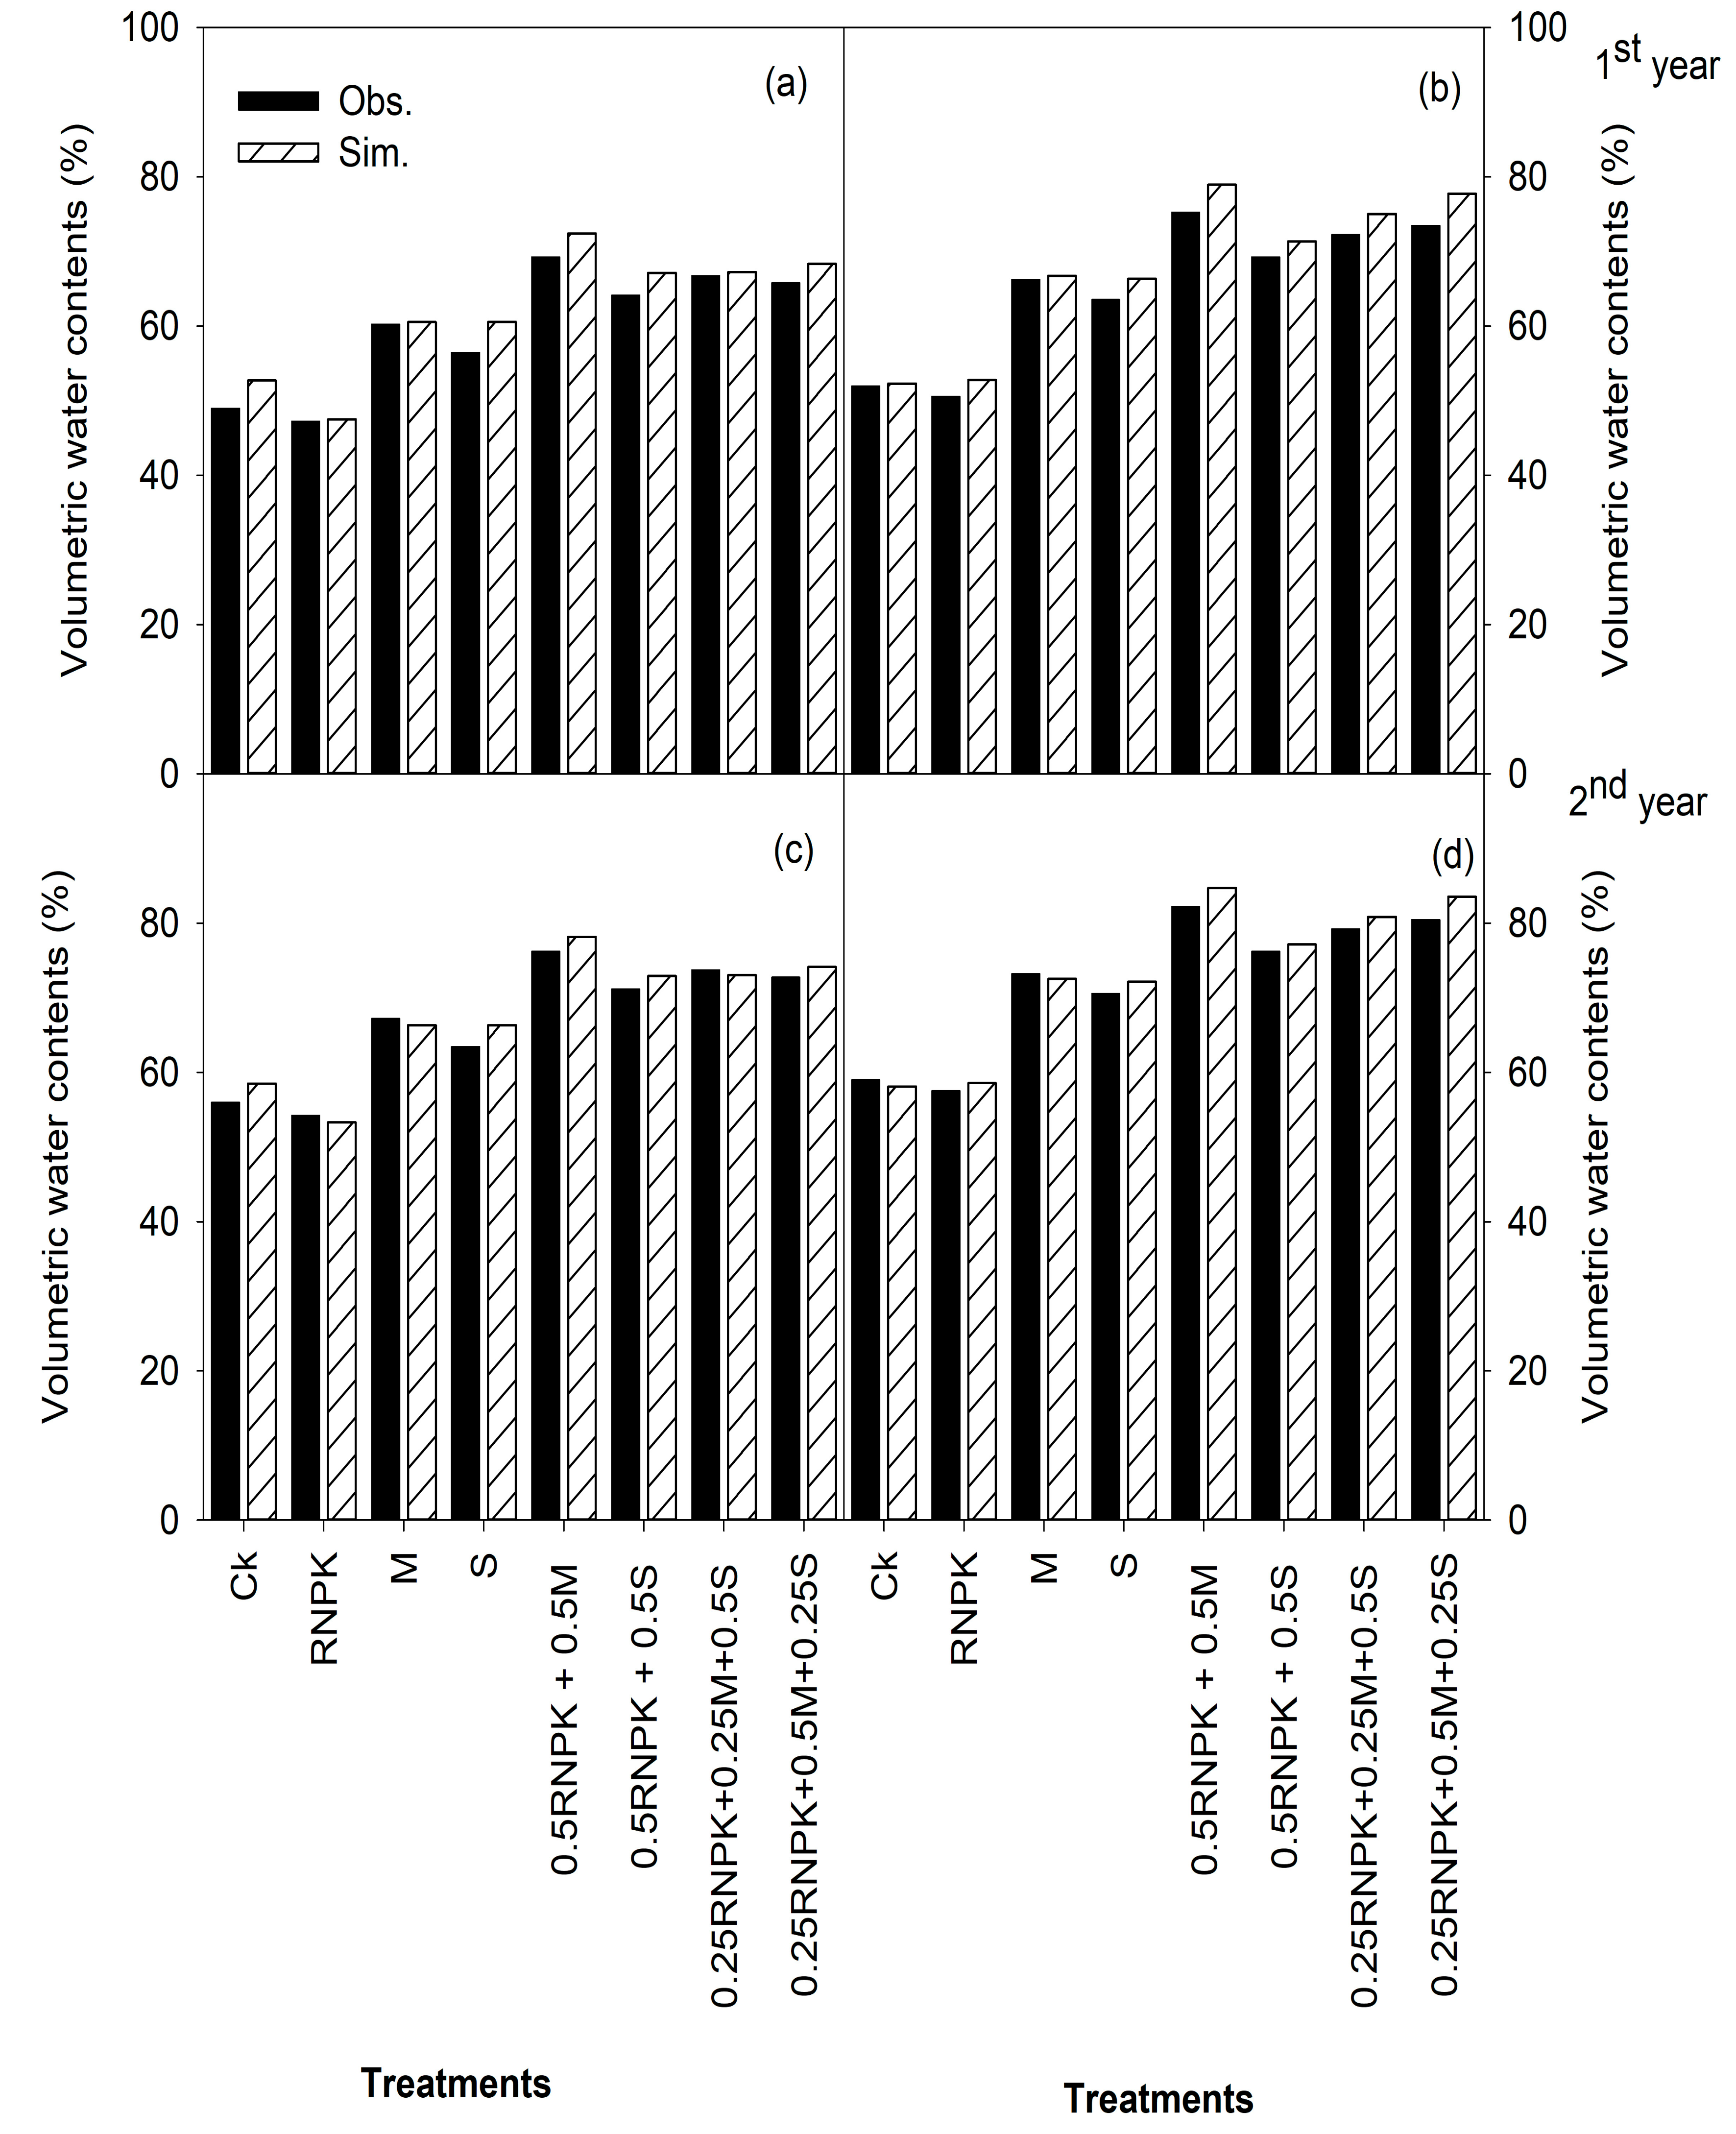
3.4. Prediction of Carbon Biomass, Soil Organic Carbon, and Volumetric Water Contents

DNDC predicted grain and straw C-biomasses of wheat close to the measurements recorded under all treatments during both years (Figure 4 and Figure 5). Maximum values of C-biomasses of wheat were measured from 0.5RNPK + 0.5M treatment during both seasons. Similar trends of C-biomass were also captured by DNDC. DNDC predicted grain and straw C-biomasses of rice in close to the measurements recorded under all treatments during both years (Figure 6 and Figure 7).
In the case of C-biomasses of rice, DNDC simulations under each treatment were close to measured values. Further, DNDC also predicted SOC in good agreement with the observed values under all treatments at soil depths of 0–15 and 15–30 cm (Figure 8). We observed the maximum value of SOC.
Maximum SOC (7.44 g kg−1) was measured for the 0.25RNPK + 0.50M + 0.5S treatment, and DNDC predicted a value of 7.00 g kg−1 for this treatment. Additionally, DNDC simulated SOC that was very near to the measured values under each treatment. Furthermore, the DNDC model also captured the soil volumetric water contents in wheat fields very close to the recorded values under all treatments at soil depths of 10 cm during both growing seasons (Figure 9).

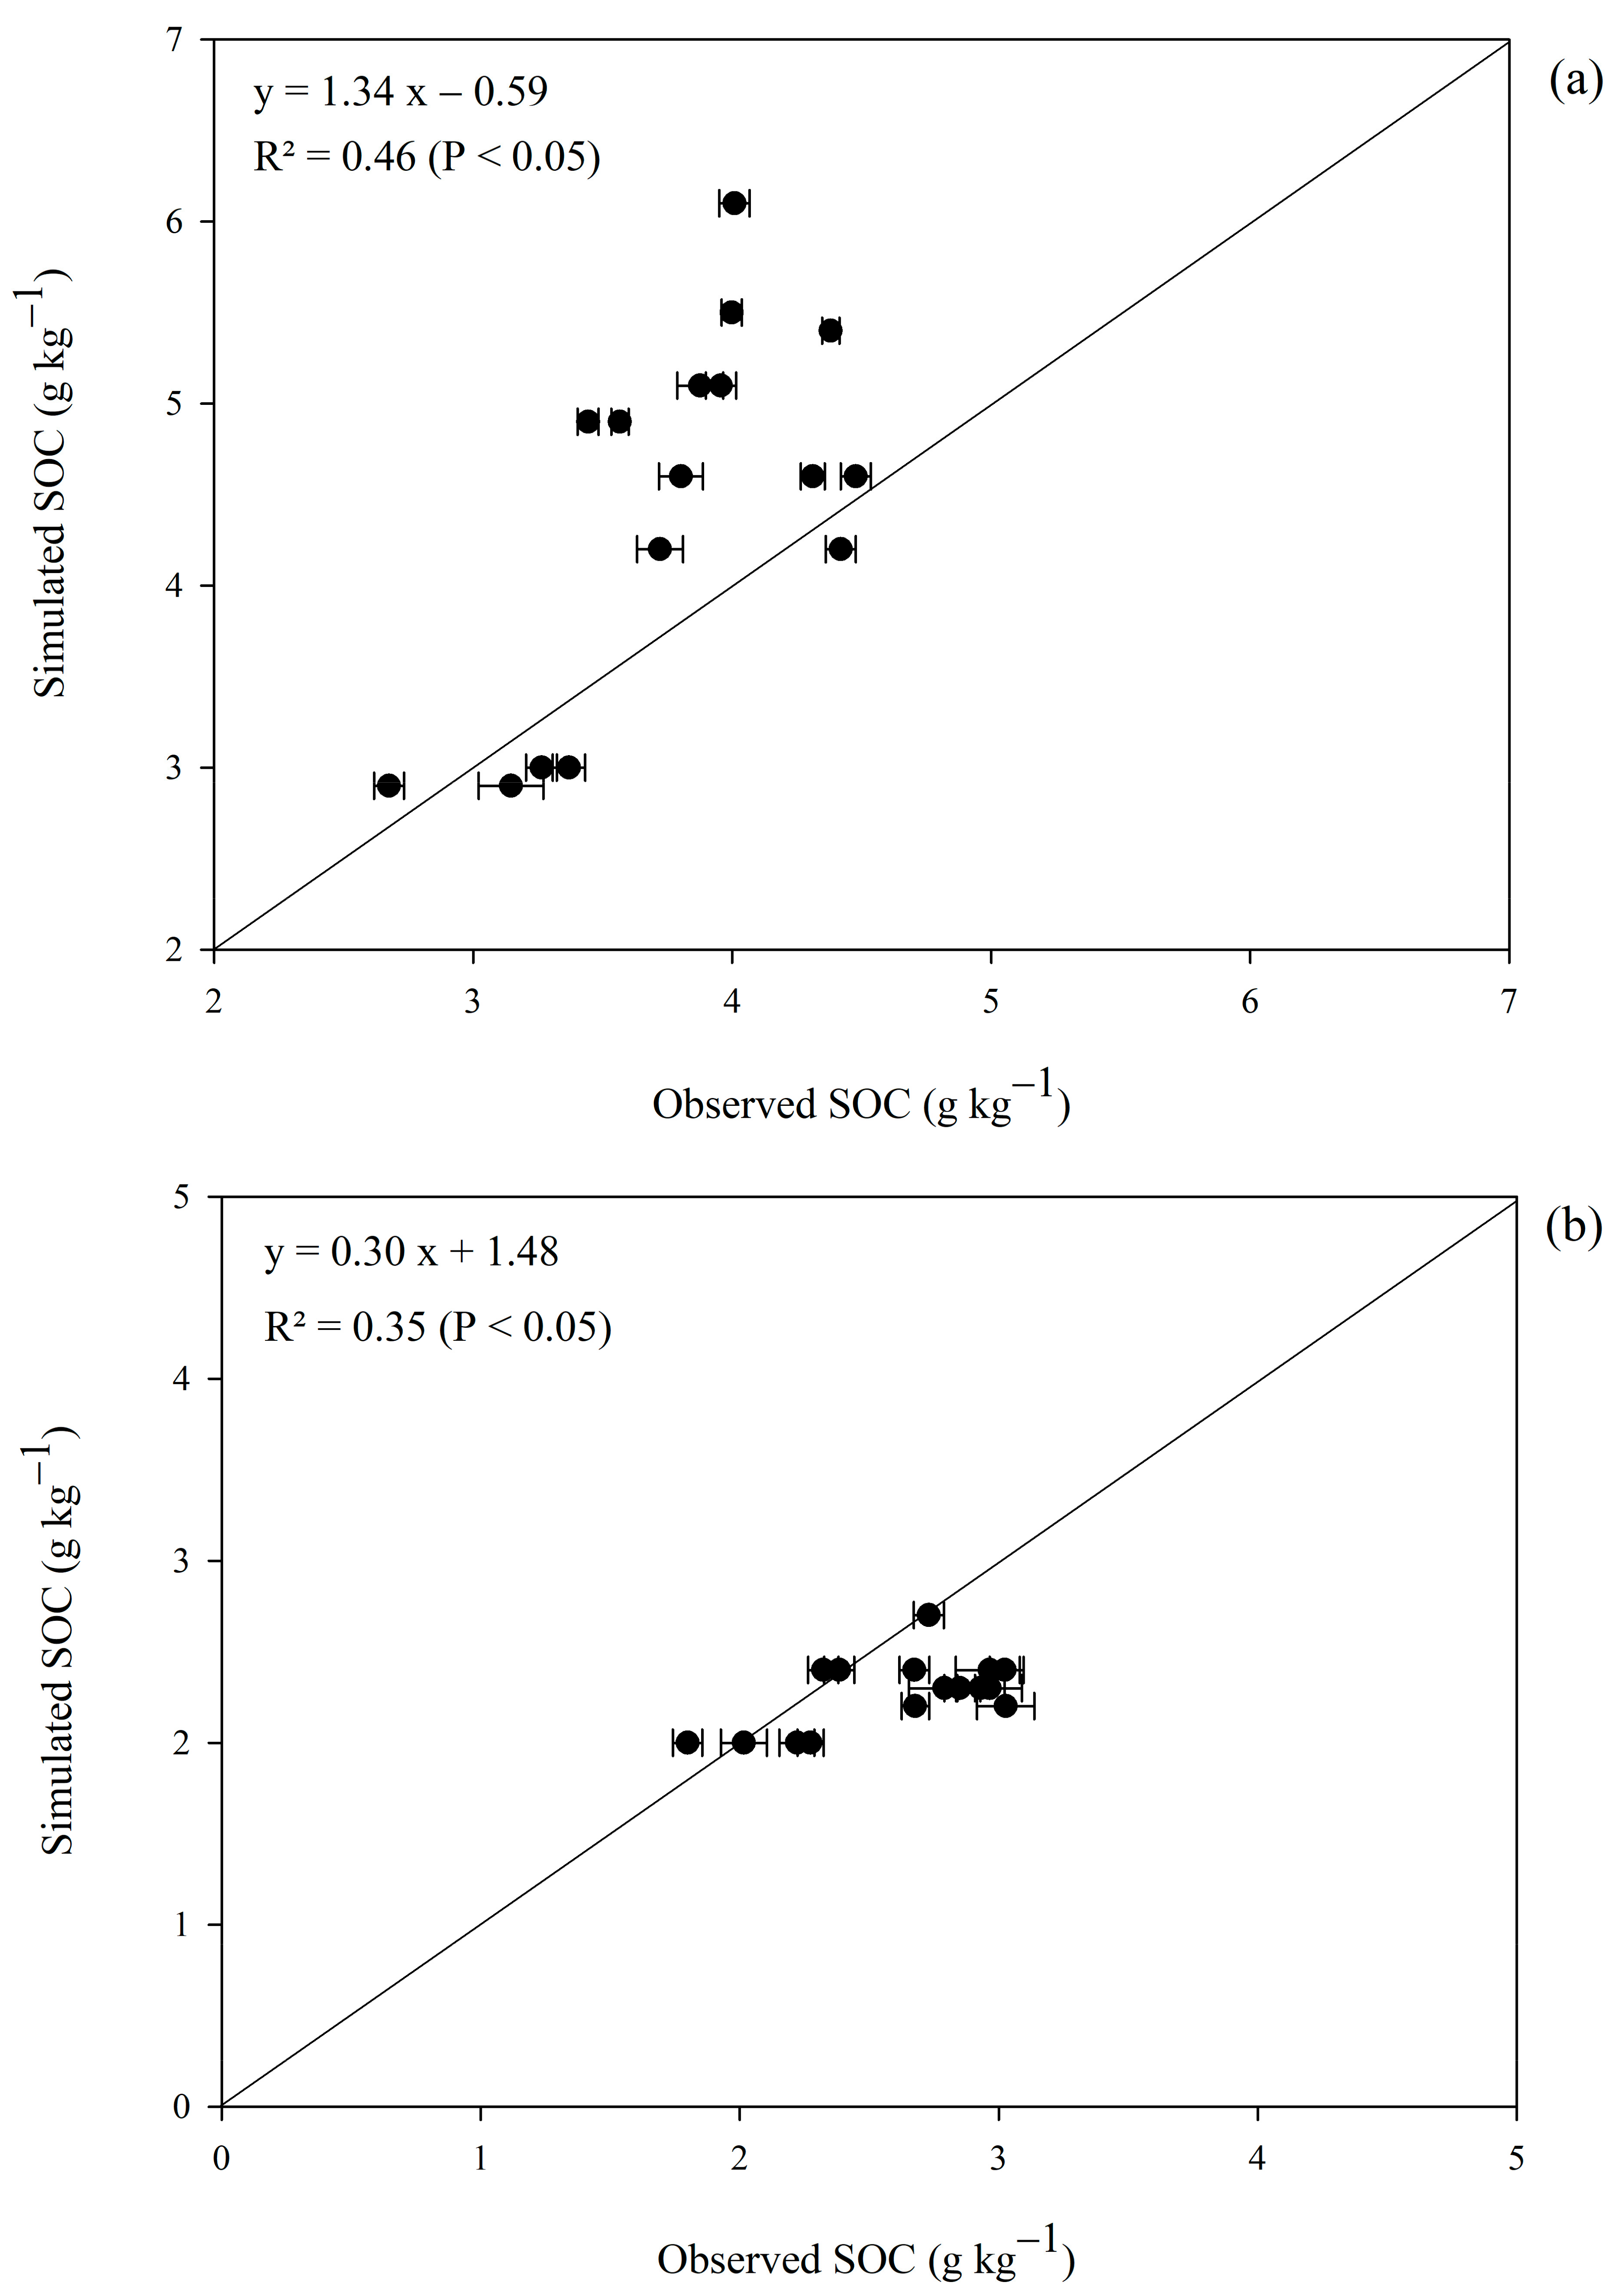
3.5. Regression Analysis

The regression analysis between modeled and observed SOC was also significant with R2 ranging from 0.35 to 0.46 (p < 0.01). The intercept ranged from 0.30 to 1.34 (p < 0.65). Regression line slopes were from −0.59 to 1.48 (p < 0.05; Figure 10).

4. Discussion

Understanding the carbon (C) cycle in soils is essential in order to identify the most appropriate management strategy that would optimize this cycle in both space and time. The DNDC model adopted in this study has been independently applied by several researchers to estimate C sequestration, crop yield, and greenhouse gas emissions [28,31,32]. For instance, Qiu et al., 2005 [33] assessed soil organic carbon (SOC) storage in China, where DNDC predicted the SOC dynamics with good correlation with observed values (e.g., r = 0.975). Similarly, Han et al. 2014 [32] applied the modified DNDC model by embedding a new mulching module to estimate corn yield, where the differences between predicted and observed yields ranged from −55 to 3170 kg ha−1. In our study, the differences between predicted and observed grain C-biomass of wheat ranged from −909.53 to 374.62 kg ha−1, while differences for straw C-biomass of wheat ranged from −1651.25 to 163.68 kg ha−1 (Figure 4 and Figure 5). In the case of rice, the differences between predicted and observed grain C-biomass ranged from 189.63 to 420.80 kg ha−1, while differences for straw C-biomass ranged from −51.75 to 120.38 kg ha−1 (Figure 6 and Figure 7).
Simulation of crop growth in good agreement with observed values is crucial to predicting the carbon biogeochemistry cycle correctly. If DNDC does not simulate the crop growth process in agreement with measurements, then there are chances of error in assessing the potential impact of management practices on SOC. According to Tang et al. 2012, soil C sequestration is directly influenced by C inputs in the form of crop residues or amendments [33]. In our experiment, changes in SOC declined under no fertilization treatment, and a similar decline in SOC contents with control treatment was also predicted by the DNDC model. So, DNDC predicted the value of SOC by 2.80 to 2.90 g kg−1 compared to field measurements, which ranged from 2.67 to 3.15 g kg−1 for the control treatment under both tillage methods at a soil depth of 0–15 cm (Figure 8).
In this study, an increase in SOC from the combined application of inorganic and organic amendments could be linked with higher soil moisture contents (Figure 9). Previously it was documented that SOC was increased by increasing soil water contents through precipitation [33,34,35,36]. Therefore in our study, DNDC experienced no water stress for 50% NPK and 50% animal manure under the CT treatment as indicated by trends in LAI for wheat and rice (Figure 2 and Figure 3). Similar results were also reported by Lembaid et al. 2022 [5]. Here, DNDC predicted an increase in SOC sequestration rate by 12.0 and 21.0 kg C ha−1 yr−1 with an increase in precipitation by 10% and 20%, respectively. The modeled SOC in our study has a maximum value of 7.00 g kg−1 under RT-0.25NPKS + 0.5M treatment followed by 0.25NPKM + 0.5S. This could be due to the combined application of inorganic and organic amendments (organo-mineral fertilization) which resulted in a high supply of N to stimulate soil microbial activity. Therefore, organo-mineral fertilization enhanced root biomass and root exudates, leading to more SOC sequestration [37].
In our study, NPK alone and organic amendments alone did not improve SOC sequestration, and DNDC also captured the similar impacts of these treatments on SOC sequestration. Kuzyakov et al. 2010 [38] and Fontaine et al. 2003 [39] reported that the combined use of mineral NPK and animal manure induced the priming effect on soil microbes to release more nutrients, eventually resulting in higher harvestable C-biomass and SOC sequestration in soils. By improving the soil fertility status after organo-mineral fertilization, the other factors, including soil temperature, moisture holding capacity, aggregation formation, etc., may lead to higher crop production and SOC sequestration relative to organic amendments alone and NPK alone. Darwish et al. 1995 observed that organic matter influenced crop growth and yield either directly by applying nutrients or indirectly by changing soil physical characteristics including aggregates stability and porosity [40].
Singh and Benbi 2020 [41] documented excellent agreement between simulated and measured SOC in a rice–wheat system (R2 = 0.935 **, DNDC; R2 = 0.920 **, RothC, p < 0.01). In our study, SOC was also significant with R2 ranging from 0.35 to 0.46 (p < 0.01). In a semi-arid region, changes in soil water contents have a potential effect on SOC stocks [42]. In this study, SOC increased under treatments that resulted in high soil water content. These results corroborate prior studies [33,34,35,36], which demonstrated that SOC accumulation increased with increased precipitation. The effect of soil moisture content on SOC accumulation may be associated with the influence of soil moisture on plants’ carbon (C) input to soils and the decomposition of these C inputs [43]. In contrast, loss in SOC was associated with a reduction in soil moisture [5].

5. Conclusions

The DNDC model simulated the harvestable grain and straw C-biomass compared to experimental field measurements for both wheat and rice in Faisalabad, Pakistan. DNDC simulated harvestable grain C-biomass for both wheat and rice with only slight underestimation (−2.81% to −6.17%) compared to observed values. DNDC results also suggest that organo-mineral fertilization may be beneficial to encourage higher crop production along with improved soil health and enhanced soil organic carbon sequestration. In this study, DNDC adequately modeled soil organic carbon trends for rice–wheat rotation via verification using several statistical indices. The performance of the DNDC model should be improved to predict soil organic carbon dynamics in deeper soil layers by validating it under a variety of long-term experiments.

Author Contributions

Conceptualization, S.M. and D.C.d.A.; methodology, M.S.; data curation, S.M. and I.A.A.; model calibration and validation, M.M.; validation of DNDC, I.A.A.; statistical indices calculations, M.M. and I.A.A.; writing—original draft preparation, M.S. and A.K.H.; writing—review and editing, A.K.H. and D.C.d.A.; visualization, M.M.; supervision, S.M. All authors have read and agreed to the published version of the manuscript.

Funding

This research received no external funding.

Data Availability Statement

Data would be made available on demand.

Acknowledgments

The authors are presenting a special acknowledgment to Donna Giltrap, an administrator of the process-based model, the DNDC, Landcare Research, Private Bag 11052, Palmerston North 4442, New Zealand. She helped our research team very much in understanding the difficulties in the DNDC model’s simulation during the calibration phase of the DNDC model.

Conflicts of Interest

The authors declare no conflict of interest. Supporting entities had no role in the design of the study; in the collection, analyses, or interpretation of data; in the writing of the manuscript; or in the decision to publish the results.

References

  1. Kopittke, P.M.; Menzies, N.W.; Wang, P.; McKenna, B.A.; Lombi, E. Soil and the intensification of agriculture for global food security. Environ. Intern. 2019, 132, 105078. [Google Scholar] [CrossRef] [PubMed]
  2. Vejan, P.; Khadiran, T.; Abdullah, R.; Ahmad, N. Controlled release fertilizer: A review on developments, applications and potential in agriculture. J. Control. Release 2021, 339, 321–334. [Google Scholar] [CrossRef]
  3. IPCC. Climate Change: Impacts, Adaptation, and Vulnerability. Part A: Global and Sectoral Aspects: Contribution of Working Group II to the Fifth Assessment Report of the Intergovernmental Panel on Climate Change; Cambridge University Press: Cambridge, UK; New York, NY, USA, 2014; pp. 1–1132. Available online: https://www.ipcc.ch/report/ar5/wg2/ (accessed on 28 April 2023).
  4. Drebenstedt, I.; Hart, L.; Poll, C.; Marhan, S.; Kandeler, E.; Böttcher, C.; Meiners, T.; Hartung, J.; Högy, P. Do Soil Warming and Changes in Precipitation Patterns Affect Seed Yield and Seed Quality of Field-Grown Winter Oilseed Rape? Agronomy 2020, 10, 520. [Google Scholar] [CrossRef]
  5. Lembaid, I.; Moussadek, R.; Mrabet, R.; Bouhaouss, A. Modeling Soil Organic Carbon Changes under Alternative Climatic Scenarios and Soil Properties Using DNDC Model at a Semi-Arid Mediterranean Environment. Climate 2022, 10, 23. [Google Scholar] [CrossRef]
  6. Seyedabadi, M.R.; Eicker, U.; Karimi, S. Plant Selection for Green Roofs and Their Impact on Carbon Sequestration and the Building Carbon Footprint. Environ. Chall. 2021, 4, 100119. [Google Scholar] [CrossRef]
  7. Abdullah, A.S. Minimum tillage and residue management increase soil water content, soil organic matter and canola seed yield and seed oil content in the semiarid areas of Northern Iraq. Soil Till. Res. 2014, 144, 150–155. [Google Scholar] [CrossRef]
  8. Guo, Z.; Zhang, Z.; Zhou, H.; Wang, D.; Peng, X. The effect of 34-year continuous fertilization on the SOC physical fractions and its chemical composition in a Vertisol. Sci. Rep. 2019, 9, 2505. [Google Scholar] [CrossRef]
  9. Chen, H.; Zhao, Y.; Feng, H.; Li, H.; Sun, B. Assessment of climate change impacts on soil organic carbon and crop yield based on long-term fertilization applications in Loess Plateau, China. Plant Soil 2015, 390, 401–417. [Google Scholar] [CrossRef]
  10. Wiesmeier, M.; Urbanski, L.; Hobley, E.; Lang, B.; von Lützow, M.; Marin-Spiotta, E.; Kögel-Knabner, I. Soil organic carbon storage as a key function of soils-A review of drivers and indicators at various scales. Geoderma 2019, 333, 149–162. [Google Scholar] [CrossRef]
  11. Mustafa, A.; Hu, X.; Abrar, M.M.; Shah, S.A.A.; Nan, S.; Saeed, Q.; Kamran, M.; Naveed, M.; Conde-Cid, M.; Hongjun, G.; et al. Long-term fertilization enhanced carbon mineralization and maize biomass through physical protection of organic carbon in fractions under continuous maize cropping. Appl. Soil Ecol. 2021, 165, 103971. [Google Scholar] [CrossRef]
  12. Korav, S.; Rajanna, G.A.; Yadav, D.B.; Paramesha, V.; Mehta, C.M.; Jha, P.K.; Singh, S.; Singh, S. Impacts of Mechanized Crop Residue Management on Rice-Wheat Cropping System—A Review. Sustainability 2022, 14, 15641. [Google Scholar] [CrossRef]
  13. Arshad, M.; Amjath-Babu, T.S.; Krupnik, T.J.; Aravindakshan, S.; Abbas, A.; Kächele, H.; Müller, K. Climate variability and yield risk in South Asia’s rice–wheat systems: Emerging evidence from Pakistan. Paddy Water Environ. 2017, 15, 249–261. [Google Scholar] [CrossRef]
  14. Allory, V.; Séré, G.; Ouvrard, S. A meta-analysis of carbon content and stocks in Technosols and identification of the main governing factors. Eur. J. Soil Sci. 2022, 73, e13141. [Google Scholar] [CrossRef]
  15. Chen, Z.; Wang, J.; Deng, N.; Lv, C.; Wang, Q.; Yu, H.; Li, W. Modeling the effects of farming management practices on soil organic carbon stock at a county-regional scale. Catena 2018, 160, 76–89. [Google Scholar] [CrossRef]
  16. Clivot, H.; Mouny, J.C.; Duparque, A.; Dinh, J.L.; Denoroy, P.; Houot, S.; Vertès, F.; Trochard, R.; Bouthier, A.; Sagot, S.; et al. Modeling soil organic carbon evolution in long-term arable experiments with AMG model. Environ. Model. Softw. 2019, 118, 99–113. [Google Scholar] [CrossRef]
  17. Yao, Y.; Li, G.; Lu, Y.; Liu, S. Modelling the impact of climate change and tillage practices on soil CO2 emissions from dry farmland in the Loess Plateau of China. Ecol. Model. 2023, 478, 110276. [Google Scholar] [CrossRef]
  18. Gilhespy, S.L.; Anthony, S.; Cardenas, L.; Chadwick, D.; del Prado, A.; Li, C.; Sanz-Cobena, A. First 20 years of DNDC (DeNitrification DeComposition): Model evolution. Ecol. Model. 2014, 292, 51–62. [Google Scholar] [CrossRef]
  19. Li, C.; Zhuang, Y.; Frolking, S.; Galloway, J.; Harriss, R.; Moore, B., III; Wang, X. Modeling soil organic carbon change in croplands of China. Ecol. Appl. 2003, 13, 327–336. [Google Scholar] [CrossRef]
  20. Li, C.; Frolking, S.; Crocker, G.J.; Grace, P.R.; Klír, J.; Körchens, M.; Poulton, P.R. Simulating trends in soil organic carbon in long-term experiments using the DNDC model. Geoderma 1997, 81, 45–60. [Google Scholar] [CrossRef]
  21. Smith, W.; Grant, B.; Desjardins, R.; Rochette, P.; Drury, C.; Li, C. Evaluation of two process-based models to estimate soil N2O emissions in Eastern Canada. Can. J. Soil Sci. 2008, 88, 251–260. [Google Scholar] [CrossRef]
  22. Kurbatova, J.; Li, C.; Varlagin, A.; Xiao, X.; Vygodskaya, N. Modeling carbon dynamics in two adjacent spruce forests with different soil conditions in Russia. Biogeosciences 2008, 5, 969–980. [Google Scholar] [CrossRef]
  23. Sleutel, S.; De Neve, S.; Beheydt, D.; Li, C.; Hofman, G. Regional simulation of long-term organic carbon stock changes in cropland soils using the DNDC model: 1. Large-scale model validation against a spatially explicit data set. Soil Use Manag. 2006, 22, 342–351. [Google Scholar] [CrossRef]
  24. Shaukat, M.; Ahmad, A.; Khaliq, T.; Hoshide, A.K.; de Abreu, D.C. Organic Amendments and Reduced Tillage Accelerate Harvestable C Biomass and Soil C Sequestration in Rice–Wheat Rotation in a Semi-Arid Environment. Sustainability 2023, 15, 6415. [Google Scholar] [CrossRef]
  25. Institute for the Study of Earth, Oceans, and Space, University of New Hampshire. The DNDC Model. Available online: http://www.dndc.sr.unh.edu/ (accessed on 28 April 2023).
  26. Li, C.S. Modeling trace gas emission from agricultural ecosystems. Nutr. Cycl. Agroecosyst. 2000, 58, 259–276. [Google Scholar] [CrossRef]
  27. Giltrap, D.L.; Li, C.; Saggar, S. DNDC. A process-based model of greenhouse gas fluxes from agricultural soils. Agric. Ecosyst. Environ. 2010, 136, 292–330. [Google Scholar] [CrossRef]
  28. Li, C.; Frolking, S.; Frolking, T.A. A model of nitrous oxide evolution from soil driven by rainfall events: 1. Model structure and sensitivity. J. Geophys. Res. 1992, 97, 9759–9776. [Google Scholar] [CrossRef]
  29. Perlman, J.; Hijmans, R.J.; Horwath, W.R. Modelling agricultural nitrous oxide emissions for large regions. Environ. Mod. Softw. 2013, 48, 183–192. [Google Scholar] [CrossRef]
  30. Yang, Z.J.; Aloe, A.M.; Feeley, T.H. Risk information seeking and processing model. A meta-analysis. J. Commun. 2014, 64, 20–41. [Google Scholar] [CrossRef]
  31. Han, J.; Jia, Z.K.; Wu, W.; Li, C.S.; Han, Q.F.; Zhang, J. Modeling impacts of film mulching on rainfed crop yield in Northern China with DNDC. Field Crop Res. 2014, 155, 202–212. [Google Scholar] [CrossRef]
  32. Tang, J.W.; Yin, J.X.; Qi, J.F.; Jepsen, M.R.; Lü, X.T. Ecosystem carbon storage of tropical forests over limestone in Xishuangbanna, SW China. J. Trop. For. Sci. 2012, 24, 399–407. Available online: http://sourcedb.xtbg.cas.cn/zw/lw/201208/P020120809369756667621.pdf (accessed on 28 April 2023).
  33. Qiu, J.J.; Wang, L.L.; Tang, H.J.; Li, H.; Li, C.S. Studies on the situation of soil organic carbon storage in croplands in northeast of China. Agric. Sci. China 2005, 4, 594–600. Available online: https://www.dndc.sr.unh.edu/papers/Qiu_Jianjun.pdf (accessed on 28 April 2023).
  34. Chen, X.; Zhang, D.; Liang, G.; Qiu, Q.; Liu, J.; Zhou, G.; Liu, S.; Chu, G.; Yan, J. Effects of Precipitation on Soil Organic Carbon Fractions in Three Subtropical Forests in Southern China. J. Plant Ecol. 2016, 9, 10–19. [Google Scholar] [CrossRef]
  35. Mishra, G.; Sarkar, A.; Giri, K.; Nath, A.J.; Lal, R.; Francaviglia, R. Changes in Soil Carbon Stocks under Plantation Systems and Natural Forests in Northeast India. Ecol. Model. 2021, 446, 109500. [Google Scholar] [CrossRef]
  36. Huang, W.; Ye, C.; Hockaday, W.C.; Hall, S.J. Trade-Offs in Soil Carbon Protection Mechanisms under Aerobic and Anaerobic Conditions. Glob. Change Biol. 2020, 26, 3726–3737. [Google Scholar] [CrossRef]
  37. Saiz, G.; Bird, M.I.; Domingues, T.; Schrodt, F.; Schwarz, M.; Feldpausch, T.R.; Veenendaal, E.; Djagbletey, G.; Hien, F.; Compaore, H.; et al. Variation in Soil Carbon Stocks and Their Determinants across a Precipitation Gradient in West Africa. Glob. Change Biol. 2012, 18, 1670–1683. [Google Scholar] [CrossRef]
  38. Kuzyakov, Y.; Gavrichkova, O. Time lag between photosynthesis and carbon dioxide efflux from soil a review of mechanisms and controls. Glob. Change Biol. 2010, 16, 3386–3406. [Google Scholar] [CrossRef]
  39. Fontaine, S.; Mariotti, A.; Abbadie, L. The priming effect of organic matter a question of microbial competition. Soil Biol. Biochem. 2003, 35, 837–843. [Google Scholar] [CrossRef]
  40. Darwish, O.H.; Persaud, N.; Martens, D.C. Effect of long-term application of animal manure on physical properties of three soils. Plant Soil 1995, 176, 289–295. [Google Scholar] [CrossRef]
  41. Singh, P.; Benbi, D.K. Modeling Soil Organic Carbon with DNDC and RothC Models in Different Wheat-Based Cropping Systems in North-Western India. Commun. Soil Sci. Plant Anal. 2020, 51, 1184–1203. [Google Scholar] [CrossRef]
  42. Jebari, A.; Del Prado, A.; Pardo, G.; Rodríguez Martín, J.A.; Álvaro-Fuentes, J. Modeling Regional Effects of Climate Change on Soil Organic Carbon in Spain. J. Environ. Qual. 2018, 47, 644–653. [Google Scholar] [CrossRef]
  43. Zhou, G.; Guan, L.; Wei, X.; Tang, X.; Liu, S.; Liu, J.; Zhang, D.; Yan, J. Factors Influencing Leaf Litter Decomposition: An Intersite Decomposition Experiment across China. Plant Soil 2008, 311, 61–72. [Google Scholar] [CrossRef]
Figure 2. Trends in predicted and observed LAI during the (a) first and the (b) second growing seasons of wheat under the calibrated treatment using conventional tillage (NPKM 5/5).
Crops 03 00021 g002
Figure 3. Trends in predicted and observed LAI during the (a) first and the (b) second growing seasons of rice under the calibrated treatment using conventional tillage (NPKM 5/5).
Crops 03 00021 g003
Figure 4. Predicted and measured wheat grain C-biomass under conventional (a,c) and reduced tillage (b,d) affected nutrient management treatments during both seasons. Ck, control; NPK, recommended dose of mineral N, P, and K; M, animal manure; S, 100% crop residue incorporation; 0.5RNPK + 0.5M, 50% of RNPK and 50% M; 0.5RNPK + 0.5S, 50% of RNPK and 50% crop residue incorporation; 0.25RNPK + 0.25M + 0.5S, 25% of RNPK with 25% M and 50% crop residue incorporation; and 0.25RNPK + 0.50M + 0.5S, 25% of RNPK with 50% M and 25% crop residue incorporation.
Crops 03 00021 g004
Figure 5. Predicted and measured wheat straw C-biomass under conventional (a,c) and reduced tillage (b,d) affected by nutrient management treatments during both seasons. Ck, control; NPK, recommended dose of mineral N, P, and K; M, animal manure; S, 100% crop residue incorporation; 0.5RNPK + 0.5M, 50% of RNPK and 50% M; 0.5RNPK + 0.5S, 50% of RNPK and 50% crop residue incorporation; 0.25RNPK + 0.25M + 0.5S, 25% of RNPK with 25% M and 50% crop residue incorporation; and 0.25RNPK + 0.50M + 0.5S, 25% of RNPK with 50% M and 25% crop residue incorporation.
Crops 03 00021 g005
Figure 6. Predicted and measured rice grain C-biomass under conventional (a,c) and reduced tillage (b,d) affected by nutrient management treatments during both seasons. Ck, control; NPK, recommended dose of mineral N, P, and K; M, animal manure; S, 100% crop residue incorporation; 0.5RNPK + 0.5M, 50% of RNPK and 50% M; 0.5RNPK + 0.5S, 50% of RNPK and 50% crop residue incorporation; 0.25RNPK + 0.25M + 0.5S, 25% of RNPK with 25% M and 50% crop residue incorporation; and 0.25RNPK + 0.50M + 0.5S, 25% of RNPK with 50% M and 25% crop residue incorporation.
Crops 03 00021 g006
Figure 7. Predicted and measured rice straw C-biomass under conventional (a,c) and reduced tillage (b,d) affected nutrient management treatments during both seasons. Ck, control; NPK, recommended dose of mineral N, P and K; M, animal manure; S, 100% crop residue incorporation; 0.5RNPK + 0.5M, 50% of RNPK and 50% M; 0.5RNPK + 0.5S, 50% of RNPK and 50% crop residue incorporation; 0.25RNPK + 0.25M + 0.5S, 25% of RNPK with 25% M and 50% crop residue incorporation; 0.25RNPK + 0.50M + 0.5S, 25% of RNPK with 50% M and 25% crop residue incorporation.
Crops 03 00021 g007
Figure 8. Predicted and measured SOC at soil depth of 0–15 and 15–30 cm under conventional (a,c) and reduced tillage (b,d) affected nutrient management treatments. Ck, control; NPK, recommended dose of mineral N, P, and K; M, animal manure; S, 100% crop residue incorporation; 0.5RNPK + 0.5M, 50% of RNPK and 50% M; 0.5RNPK + 0.5S, 50% of RNPK and 50% crop residue incorporation; 0.25RNPK + 0.25M + 0.5S, 25% of RNPK with 25% M and 50% crop residue incorporation; and 0.25RNPK + 0.50M + 0.5S, 25% of RNPK with 50% M and 25% crop residue incorporation.
Crops 03 00021 g008
Figure 9. Predicted and measured volumetric water contents (%) in wheat at soil depth of 10 cm under conventional (a,c) and reduced tillage (b,d) affected nutrient management treatments during both growing seasons. Ck, control; NPK, recommended dose of mineral N, P, and K; M, animal manure; S, 100% crop residue incorporation; 0.5RNPK + 0.5M, 50% of RNPK and 50% M; 0.5RNPK + 0.5S, 50% of RNPK and 50% crop residue incorporation; 0.25RNPK + 0.25M + 0.5S, 25% of RNPK with 25% M and 50% crop residue incorporation; and 0.25RNPK + 0.50M + 0.5S, 25% of RNPK with 50% M and 25% crop residue incorporation.
Crops 03 00021 g009
Figure 10. Comparison of simulated versus measured soil organic carbon at (a) 0–15 and (b) 15–30 cm soil depths. Each point represents the SOC from a treatment ± SD. The solid line indicates the 1:1 line that could be expected after a perfect fit; solid circles above and below this 1:1 line are over- and under-simulated SOC, respectively.
Crops 03 00021 g010
Table 1. Crop parameters for rice and wheat used in crop library of the DNDC model [25].
ParametersRiceWheat
Default Value Modified Value Default ValueModified Value
Max. grain production 8443.95460278005492.34
Grain fraction 0.410.310.40.40
Leaf fraction0.230.300.220.27
Stem fraction0.240.310.220.27
C/N ratio for grain45.045.050.037.0
C/N ratio for leaf85.065.080.066.0
C/N ratio for stem85.065.080.069.0
C/N ratio for root85.030.080.039.0
N fixation index 1.051.191.01.39
Water requirement 508430300300
Optimum temperature (°C)25.025.022.018.0
Total degree days (°C-days)2000230015001500
Table 2. Soil parameters tested in DNDC for the current study.
Value Unit
Soil ParameterInitial SetupModified Setup
Land-use typeUpland crop fieldRice paddy field
Soil textureSilt loamSilt loam
Soil organic carbon (kg C kg−1 soil)0.03 0.003
Bulk density (cm−3)1.041.51
Soil pH8.237.1
Field capacity (%)40.043.3
Wilting point (%)20.017.0
Clay fraction0.140.42
Hydrological conductivity (mh−1)0.0259 0.0259
Drainage efficiency (0–1)10.85
Table 3. Simulated harvestable C-biomass of rice and wheat before and after DNDC’s calibration with percent difference (PD, %) between observed and modeled.
CropLeaf + Stem C-Biomass (kg ha−1)Grain C-Biomass (kg ha−1)
Observed Modeled% DifferenceObservedModeled% Difference
Before calibration
Wheat3043.753144.8−3.312220.373441.84−55.01
Rice4012.292321.4742.141894.511340.7629.22
After calibration
Wheat3043.753129.43−2.812220.372357.55−6.17
Rice4012.293232.1719.441894.512008.76−6.03
Table 4. Statistical evaluation of DNDC’s performance simulating harvestable grain and straw C-biomass of rice and wheat under conventional and reduced tillage.
TreatmentObservedSimulatednMPD a RMSEnRMSE a MAEdME
Rice grain C-biomass (kg ha−1)
CT1449.011451.827−2.626.7425.872.820.85−0.01
RT1498.971316.188−16.99380.6925.39−182.940.860.09
Wheat grain C-biomass (kg ha−1)
CT1601.491950.29726.11510.3931.87348.790.76−0.08
RT1626.251995.99827.49499.9830.75369.740.77−0.05
Rice leaf and stem C-biomass (kg ha−1)
CT2886.032402.237−17.83769.8326.67−481.800.73−0.73
RT3074.852277.928−28.90966.2231.42−786.950.69−1.86
Whet leaf and stem C-biomass (kg ha−1)
CT2215.082764.16727.16657.4429.68549.080.74−0.39
RT2212.022856.31833.32747.1533.77644.280.65−0.86
a The units of both mean average error (MAE) and root mean squared error (RMSE) for C-harvest biomass and soil organic carbon (SOC) are kg ha−1 and g kg−1 of soil, respectively. The units of mean percent difference (MPD) and normalized RMSE (nRMSE) are percentage (%), while n is the number of observations for both conventional tillage (CT) and reduced tillage (RT).
Table 5. Statistical indices for validation of DNDC’s performance to simulate grain and straw C-biomass for rice and wheat as well as soil organic carbon content under both conventional and reduced tillage.
TreatmentObservedSimulatednMPDRMSE anRMSE MAE adME
Rice grain C-biomass (kg ha−1)
CT1570.251278.458−20.44360.6222.96−292.250.840.16
RT1581.051147.638−31.05494.1831.26−433.420.76−0.70
Wheat grain C-biomass (kg ha−1)
CT2016.431910.418−3.59242.3312.02−106.020.920.75
RT1953.351893.178−2.88165.368.47−60.180.960.87
Rice leaf and stem C-biomass (kg ha−1)
CT3175.922544.108−20.82849.6526.75−631.830.69−0.93
RT3331.562326.768−32.791144.4834.35−1004.90.63−2.76
Wheat leaf and stem C-biomass (kg ha−1)
CT2975.763011.282.21230.857.7635.430.950.85
RT2988.752961.308−1.71212.147.09−27.450.960.86
Soil organic carbon (g kg−1 soil)
CT6.256.5985.770.6810.940.340.870.42
RT6.516.8384.821.0616.260.310.70−0.75
a The units for both mean average error (MAE) and root mean squared error (RMSE) for C-harvest biomass and soil organic carbon are kg ha−1 and g kg−1 of soil, respectively. The unit for both mean percent difference (MPD) and normalized RMSE (nRMSE) is percentage (%), while n is the number of observations for both conventional tillage (CT) and reduced tillage (RT).
Disclaimer/Publisher’s Note: The statements, opinions and data contained in all publications are solely those of the individual author(s) and contributor(s) and not of MDPI and/or the editor(s). MDPI and/or the editor(s) disclaim responsibility for any injury to people or property resulting from any ideas, methods, instructions or products referred to in the content.

