Article

Evaluating Strip and No-Till Maintenance of Perennial Groundcovers for Annual Grain Production

1
Department of Agronomy, Iowa State University, Agronomy Hall, Ames, IA 50011-1010, USA
2
Department of Horticulture, Iowa State University, Horticulture Hall, Ames, IA 50011-1010, USA
*
Author to whom correspondence should be addressed.
Crops 2022, 2(3), 268-286; https://doi.org/10.3390/crops2030020
Submission received: 11 May 2022 / Revised: 28 July 2022 / Accepted: 29 July 2022 / Published: 5 August 2022

Abstract

:
Perennial groundcover (PGC) merges scalable soil and water conservation with high-yielding row crops, enhancing ecosystem services of annual grain crop production. However, ineffective groundcover suppression increases competition between the groundcover and row crop, reducing row crop grain yield. The objective of this study was to assess the effectiveness of three Kentucky bluegrass (KBG) groundcover suppression methods each at narrow and wide widths on maize (Zea mays L.) growth and development in evenly spaced PGC, compared to alternating PGC swards and a no-PGC conventional tillage control. Suppression methods for evenly spaced PGC included two different strip tillage implements, completing either shallow or deep soil fracture, for mechanical suppression and a banded sprayer for no-tillage chemical suppression. We measured weekly for maize plant height, phenological stage of development, reflected red:far-red (R:FR) ratio, early vegetative and final plant density, grain and stover yield, yield components of kernel rows ear−1, kernels row−1, kernels ear−1, ear length, kernel weight, grass frequency, and weed community. In 2020, maize grain yield in the alternating PGC swards (11.38 Mg ha−1) was similar to the control (12.78 Mg ha−1) and greater than in the evenly spaced groundcover (9.62 Mg ha−1). Maize grain yield was similar for systems in 2021 (7.41 Mg ha−1), due to drought and high coefficient of variation. Weed community was similar for systems in both years. A maize competition response was observed for both suppression widths across methods. Groundcover dormancy may be needed in conjunction with effective chemical and/or mechanical groundcover suppression to support maize production in PGC.

1. Introduction

The perennial groundcover (PGC) system involves growing an ecologically appropriate groundcover in the interrow spacing of an annual row crop. The PGC system conserves natural resources underpinning crop production while enhancing the biological functioning of the soil–plant environment, improving both soil health and crop productivity. Perennial groundcovers provide ecosystem services that are presently lacking in conventional agriculture and only achievable by perennializing the landscape, increasing plant cover diversity and duration [1]. Such services include preventing soil erosion, building soil carbon and soil health, increasing water infiltration, reducing runoff, and retaining nitrogen. In the USA, PGC can be integrated into >50% of the 96 Mha of corn, soybean, wheat, cotton, and sorghum grown annually. These crops comprise nearly ¾ of the 130 Mha of harvested cropland in the USA [2]. An important advantage of integrating PGC into annual grain crop operations as a conservation practice relates to utilizing the existing timing of operations, particularly in the northern Corn Belt of the USA or other regions with a restricted window of opportunity for management operations. Most row crop systems are designed to use the entire growing season leaving little time to establish and remove or suppress a winter cover crop. After establishment of the perennial groundcover in the first system year, activities such as spring strip tillage and chemical suppression in PGC may be coupled with existing management practices for annual grain crop production.
Variations of perennial cover crop systems offer promising solutions for sustainable intensification outside the USA. The integrated crop livestock (ICL) model deployed in South America and elsewhere improves degraded soil by livestock grazing of perennial grass pastures after the annual cash crop is harvested [3,4,5]. The ICL configuration has been deployed on >9 Mha of land in Brazil [6]. In East Africa, low-input Push–Pull systems, where an intercropped legume and annual cereal crop are bordered by insect ‘trap’ plants, enhance pest management and soil fertility for food and feed production. Push–pull systems have been implemented by nearly 300,000 smallholder farmers in East Africa, resulting in a 3.5-fold average increase in maize yield [7,8,9].
Some of the desirable characteristics of grass species used as PGC for grain production have been recognized as disadvantages in modern turfgrass applications, emphasizing the importance of effective early-season groundcover suppression. Dormancy, for example, is an adaptive mechanism that entails an escape from drought stress, facilitating life cycle completion prior to the onset of moisture insufficiency [10]. Dormancy has not been a valued characteristic in cool-season grasses used as PGC because it reduces productivity [11]. Nondormant or ineffectively suppressed groundcover will elicit a shade avoidance response (SAR) in maize, resulting from a low red:far-red (R:FR) light ratio quality shift, and subsequently compete with the row crop during the critical period for weed control [12,13,14,15,16,17]. Previous PGC studies have identified rapid post-suppression recovery with modern Kentucky bluegrass (KBG) (Poa pratensis L.) varieties [13,14] that maintain green tissue under drought stress instead of senescing [18]. Where groundcover dormancy is lacking or delayed, a longer duration of PGC suppression would be needed to support grain yield [15,19]. Previous studies have found that 50% groundcover will both limit erosion and support maize yield in PGC systems [19,20]. A research gap exists for the effect of groundcover suppression width on maize yield in a PGC system.
An experiment was therefore conducted to assess the effectiveness of three groundcover suppression implements and the resulting competition from the suppressed grass cover crop on maize growth and yield. Suppression efficacy was evaluated for two strip tillage implements for mechanical groundcover suppression and one sprayer implement to apply a strictly chemical, no-tillage suppression on the groundcover, each performed at a narrow and wide width. Chemical, no-tillage suppression was included as a treatment because highly erodible land makes tillage unsuitable, and for incorporation of PGC into existing no-till operations. The resultant treatment effect was assessed by measuring (i) post-suppression groundcover frequency and width, (ii) post-suppression reflected R:FR ratios from the groundcover canopy, (iii) maize developmental morphology, yield, and yield components, and (iv) weed community. It was hypothesized that wider suppression widths would produce greater maize yield with limited groundcover interference.

2. Materials and Methods

In 2020 and 2021, a 2 site-year study was conducted at the Agronomy and Agricultural Engineering Sorenson Research Farm (Sorenson), 11.9 km southeast of Boone, IA (42°0′ N 93°44′ W). The Sorenson Research Farm climate data during the two consecutive study years were obtained from the Ames-8-WSW Iowa Environmental Mesonet station, 3 km northwest of the research site [21].
Growing degree days (GDD) were calculated from planting according to the following equation:
GDD = Σ [(daily maximum temp. ≤30 °C + daily minimum temp. ≥10 °C)/2] − 10 °C
where 30 °C is the maximum and 10 °C the base temperature for maize development [22].
The experiment was located on dominant soil types of Webster clay loam (0–2% slope, fine-loamy, mixed, superactive, mesic Typic Endoaquoll) and Clarion loam (2–6% slope, fine loamy, mixed, superactive, mesic Typic Hapludoll). The experiment design was a randomized complete block with four replicates. The nine treatments were randomly allocated in each replicate and each plot was 3 m wide (4 rows × 0.76 cm inter-row spacing) and 6.1 m long. The plots with the alternating strip treatment were widened to 6 m to better assess the treatment effect. Cropping history of the site prior to PGC seeding included soybean, maize, and oats in 2017, 2018, and 2019, respectively. Pioneer P0574AM 105 Comparative Relative Maturity maize [23] was planted as the maize hybrid in all plots. Pioneer P0574AM maize is a relatively fixed ear type that is well adapted to water-limited conditions with rapid emergence [24].
The three suppression methods included (Table 1): ETS SoilWarrior prototype strip tillage implement (Environmental Tillage Systems, Inc., Faribault, MN, USA), Unverferth 330 Ripper Stripper strip tillage implement (Unverferth Manufacturing Company, Kalida, OH, USA), and Redball-Hooded band sprayer (Willmar Fabrication, LLC, Benson, MN, USA) each at a narrow and wide width (25 and 38 cm for the tillage implements and 25 and 51 cm for the band sprayer). Groundcover swards in alternating interrow spaces (“alternating PGC”) at 25 and 38 cm and a no-PGC conventional tillage control were also compared. While the ETS strip tillage implement has cogwheels for soil penetration to a 9 cm shallow soil depth, the ripper shanks on the Unverferth strip tillage implement allowed for vertical soil fracture to a 25 cm depth, with deeper vertical soil fracture than the ETS. The ETS strip tillage implement is a prototype, non-commercial machine developed specifically for the PGC system, consisting of a toolbar with colters and cogwheels and a three-point mount unit. The light weight of the ETS strip tillage machine achieves shallower vertical soil fracture than the Unverferth strip tillage machine, because the ETS strip tillage machine lacks the weight of the fertilizer hopper to force the colters and cogwheels into the ground during tillage.
The research site was tilled prior to grass planting on 30 August 2019. Kentucky bluegrass ‘Midnight’ variety (Outsidepride Seed Source, LLC, Independence, OR, USA) was seeded as the PGC for all plots on 3 September 2019 by making two passes at 5.6 and then 7.8 kg ha−1, for 13.4 kg ha−1 total, with a Tye 104-4204 Pasture Pleaser no-till seeder (AGCO Corporation, Duluth, GA, USA). Multiple passes were completed to split the drill row spacings of 20 cm for a denser initial establishment. The seedbed was then packed. The groundcover plots established in 2019 were used in both experiment years in 2020 as a juvenile stand and in 2021 as an established stand. Permanent tillage strips were established at maize planting in spring 2020, and maize was planted into the same tillage strips after strip tillage was performed in both site years.

2.1. Site Management

On 7 April 2020, di-ammonium phosphate (18-46-0, N–P2O5–K) and potash (0-0-62, N–P–K2O) were broadcast at a rate of 35, 90, and 112 kg ha−1 of N, P, and K, respectively, and on 7 April 2021 at a rate of 45-112-123 kg ha−1 of N, P, and K, respectively. A finish mower clipped remaining residue in plots to a uniform height of 6.4 cm on 29 March 2021 to minimize interference with subsequent spring operations.
A 2,4-D (2,4-dichlorophenoxyacetic acid) (Amine 400, PBI/Gordon Corporation, Kansas City, MS, USA) application was broadcast sprayed with 159 L ha−1 water at 1.18 kg acid equivalent (a.e.) ha−1 on 23 April 2020 and at 1.57 kg a.e. ha−1 on 26 May 2021 on perennial grass swards to control broadleaf weeds. All applications in both years were completed at 207 kPa.
Tillage operations were performed on 11 May 2020 and 26 April 2021. The 25- and 38 cm strip tillage were completed with an ETS SoilWarrior prototype strip tillage machine at 9 cm depth and to a 25 cm depth in the appropriate plots with an Unverferth 330 Ripper Stripper. Conventional tillage was completed with a King Kutter TG-72 rotary tiller (Northern Tool + Equipment, Burnsville, MN, USA) at 15 to 20 cm depth to simulate a multiple pass system of chisel plowing, disking, and field cultivating. Alternate strip removal was completed with a Honda FRC800 rear tine rotary tiller (American Honda Motor Co., Inc., Torrance, CA, USA) to a 15 cm depth on 11 May 2020 and 27 April 2021, and re-tilled in year 1 on 4 June 2020.
Large clods of soil caused by strip tillage were hand raked from perennial grass swards on 12 May 2020. Raking of soil clods prevented smothering of the grass swards and interference with the hooded band sprayer, which is operated at close proximity to the soil surface to minimize drift. Maize was planted 12 May 2020 at 79,100 seeds ha−1 and planted at 80,300 seeds ha−1 on 30 April 2021. Nitrogen as S-coated urea (43–0–0–4, N–P–K–S) was banded on 12 May 2020 at 168 kg N ha−1 and on 4 May 2021 at 169 kg ha−1 N.
For groundcover suppression in chemical, no-tillage suppression treatments on the day of maize planting, Glyphosate (N-phosphonomethyl)glycine) (Roundup PowerMAX, Monsanto, St. Louis, MO, USA) was applied in 25- and 51 cm suppression widths at 1.26 kg a.e. ha−1 and 159 L ha−1 water with a custom four-row RedBall-Hooded band sprayer on 12 May 2020 and 27 April 2021. All PGC was suppressed by applying paraquat (1,1′-dimethyl-4,4′-bipyridinium dichloride, Gramoxone SL 2.0, Syngenta Canada) immediately after maize planting. The paraquat was applied at a rate of 0.56 kg active ingredient (a.i.) ha−1 with 159 L ha−1 water with Enduraplas broadcast sprayer (Enduraplas, Neche, ND, USA). Glyphosate (Roundup PowerMAX) was applied on 3 June 2020 and 1 June 2021 at 1.26 kg a.i. ha−1 and 140 L ha−1 water in 25 cm bands for weed control directly over maize rows in all plots with a custom four-row RedBall-Hooded band sprayer.
On 24 July 2020 and 18 July 2021, 0.22 kg ha−1 Permethrin was sprayed in all plots in a 159 L ha−1 solution with an Enduraplas sprayer to control Japanese beetles (Popillia japonica L.). On 12 October 2020, a flail harvester and forage wagon were used after grain harvest to remove 90% of stover in all plots.

2.2. Measurement Procedures

Maize stand density was recorded at V2 and R6 in both years. Six plants per plot were tagged between the V5 and V6 leaves in the center two rows from which the mean plot growth stage was obtained. Maize maturity and height were collected on a weekly basis from tagged plants beginning at the V2 stage until plants reached R1, at which point the terminal plant height was collected. Maize maturity was thereafter collected on a bi-weekly basis until plants reached the R6 stage. Maize maturity was determined by the leaf collar method [25]. The tallest point on each tagged plant was recorded as plant height for each data collection date. Husks from a representative ear were peeled back during the reproductive stages in each plot to assess kernel development and maturity. A Field Scout Red/Far Red Meter (Spectrum Technologies, Inc., Aurora, IL, USA) was used to capture the red and far-red light values, from which the reflectance R:FR ratio above the groundcover canopy was calculated. The light quality measurement was recorded from the center interrow of each plot with the meter sensor facing the ground approximately 1.2 m above the soil surface or groundcover canopy, as close to weekly as possible and only on clear sunny days, from the V2 maize stage until the V8 maize stage. Four readings per plot were collected from which mean R:FR ratio was calculated. For the alternating PGC sward treatment, the R:FR ratio above the PGC sward and adjacent cultivated inter-row were measured and averaged.
Post-suppression perennial grass sward width was measured at mid-season and end-of-season in both years, with an additional early-season post-suppression measurement in year 2. Widths were measured on 7 August 2020 and 16 July 2021 for mid-season, 6 October 2020 and 20 October 2021 for end-of-season, and 25 May 2021 for early-season in year 2. Four widths were collected in each center row and averaged for mean plot width. Perennial grass in the PGC sward and adjacent cultivated inter-row was measured and averaged for the alternating PGC sward treatment mean grass sward width.
At physiological maturity, a 1.5 m row of maize (equivalent to 1.15 area m2) was manually harvested on 29 September 2020 and 22 September 2021 from the two center maize rows in each plot from which plant number, ear number, fresh weight of stover (husks, stalks, and leaves), and fresh weight of ears were recorded. All harvested ears and stover from a random two-plant sample were retained and dried at 70 °C until a constant weight was achieved [26]. The remainder of the two center rows were combine harvested on 8 October 2020 and 1 October 2021 with a modified John Deere 9450 combine with weigh system and moisture sensor. To determine grain yield, combine maize grain yield was adjusted to 15% moisture and added to the hand harvested grain yield at 15% moisture from the same plot.
Before separating kernels from the cob, kernel rows ear−1, kernels row−1, and kernels ear−1 were obtained from each harvested ear of randomly selected plants each year. Ear length was also recorded in year 2. A seed counter (Old Mill Model 900-2, International Marketing and Designs Corp., San Antonio, TX, USA) was used to obtain kernel number for each plot, from which average kernels ear−1 was obtained for each treatment. Individual kernel weight was determined by dividing kernels ear−1 by grain weight for the plot at 15% moisture.
Cobs and grain were separated before cobs were added back to dried stover for total stover weight (husks, stalks, leaves, and cobs) [27]. A grain moisture analyzer (Model GAC 2000, DICKEY-john, Auburn, IL, USA) was used to assess grain moisture. Using the following equation, harvest index (HI) was calculated from the dried weights obtained for each treatment:
HI = grain dry weight/total aboveground biomass dry weight
After harvest on 5 October 2020 and 19 October 2021, a 10 by 10 frequency grid (7.5 by 7.5 cm per square) was used to evaluate groundcover persistence. The 5 by 5 Vogel and Masters [28] frequency grid used for warm season grassland grasses was modified for application to cool season turfgrass frequency estimates with smaller squares to fashion a 10 by 10 frequency grid. A total of 200 cells were counted per plot. Cells with grass were totaled to assess the percent presence of cover, yielding plant frequency of occurrence or stand percentages. Because the KBG was planted the prior fall and produces rhizomatous stems, plants m–2 was not estimated from the plant frequency data. Alternating PGC mean frequency was calculated from two grid counts in the strip-tilled inter-row and two grid counts in the perennial grass sward to account for cultivated strips.
In both years post-harvest, fall weed density (weeds m−2) and weeds per species per square meter were measured. The number of weeds by species in five randomly distributed 0.1 m2 hoops per plot were counted on 6 October 2020 and 5 October 2021.

2.3. Statistical Analysis

Data were analyzed with the PROC GLM procedures in SAS version 9.4 [29]. ANOVA was used to assess significant effects in the linear additive model. Since the experiment treatment structure was an incomplete factorial, custom contrasts and differences of least square means were used for comparisons of treatments at α = 0.05. Fisher′s Least Significant Difference (LSD) was also applied as a post hoc means comparison where treatment was significant for subsequent treatment comparisons. Because of year × treatment interactions from the combined analysis, data were subsequently analyzed within each site-year with treatment as a fixed effect and block as a random effect and presented as such.

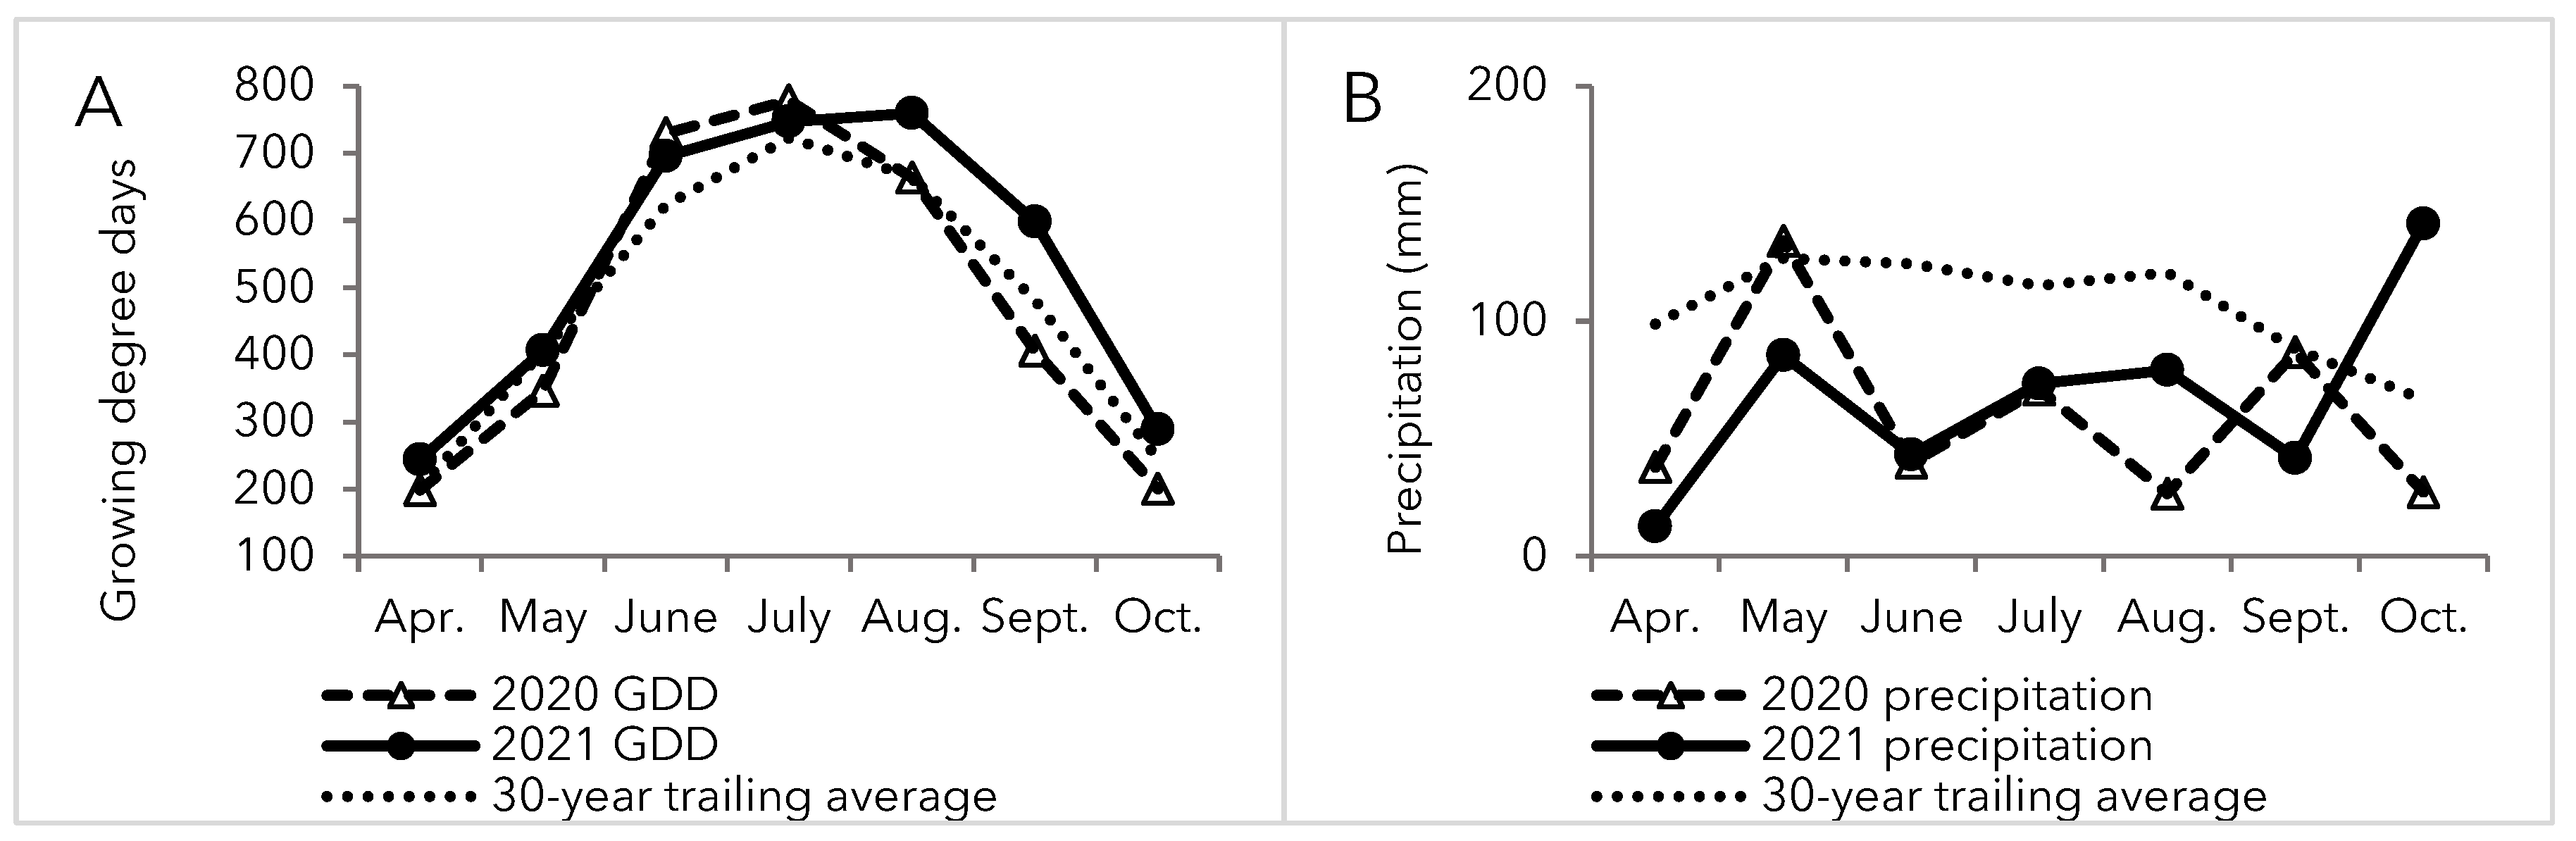
2.4. Weather Conditions

In 2020, the Boone research site logged 2801 GDD from maize planting to maize harvest, with greater heat unit accumulation in June and July (by 110 and 59 GDD, respectively) and less heat unit accumulation in May and September (by 58 and 79 GDD, respectively) than the 30-yr trailing average (Figure 1). A total of 347 mm precipitation accumulated during the growing season. Precipitation was only consistent with the 30-yr trailing average in May and September and less in all other months. In 2021, a total of 3058 GDD accumulated from maize planting to maize harvest, with the 30-year trailing average exceeded in June, August, and September (by 73, 95, 117 GDD, respectively) (Figure 1). Less precipitation than the 30-year trailing average was logged in every month of the growing season in 2021, totaling only 292 mm. In 2020, abnormally dry to moderate drought conditions were observed from the end of July. Abnormally dry to severe drought conditions persisted throughout 2021 [30].

3. Results

3.1. Perennial Groundcover Persistence, Sward Width, and R:FR Ratio

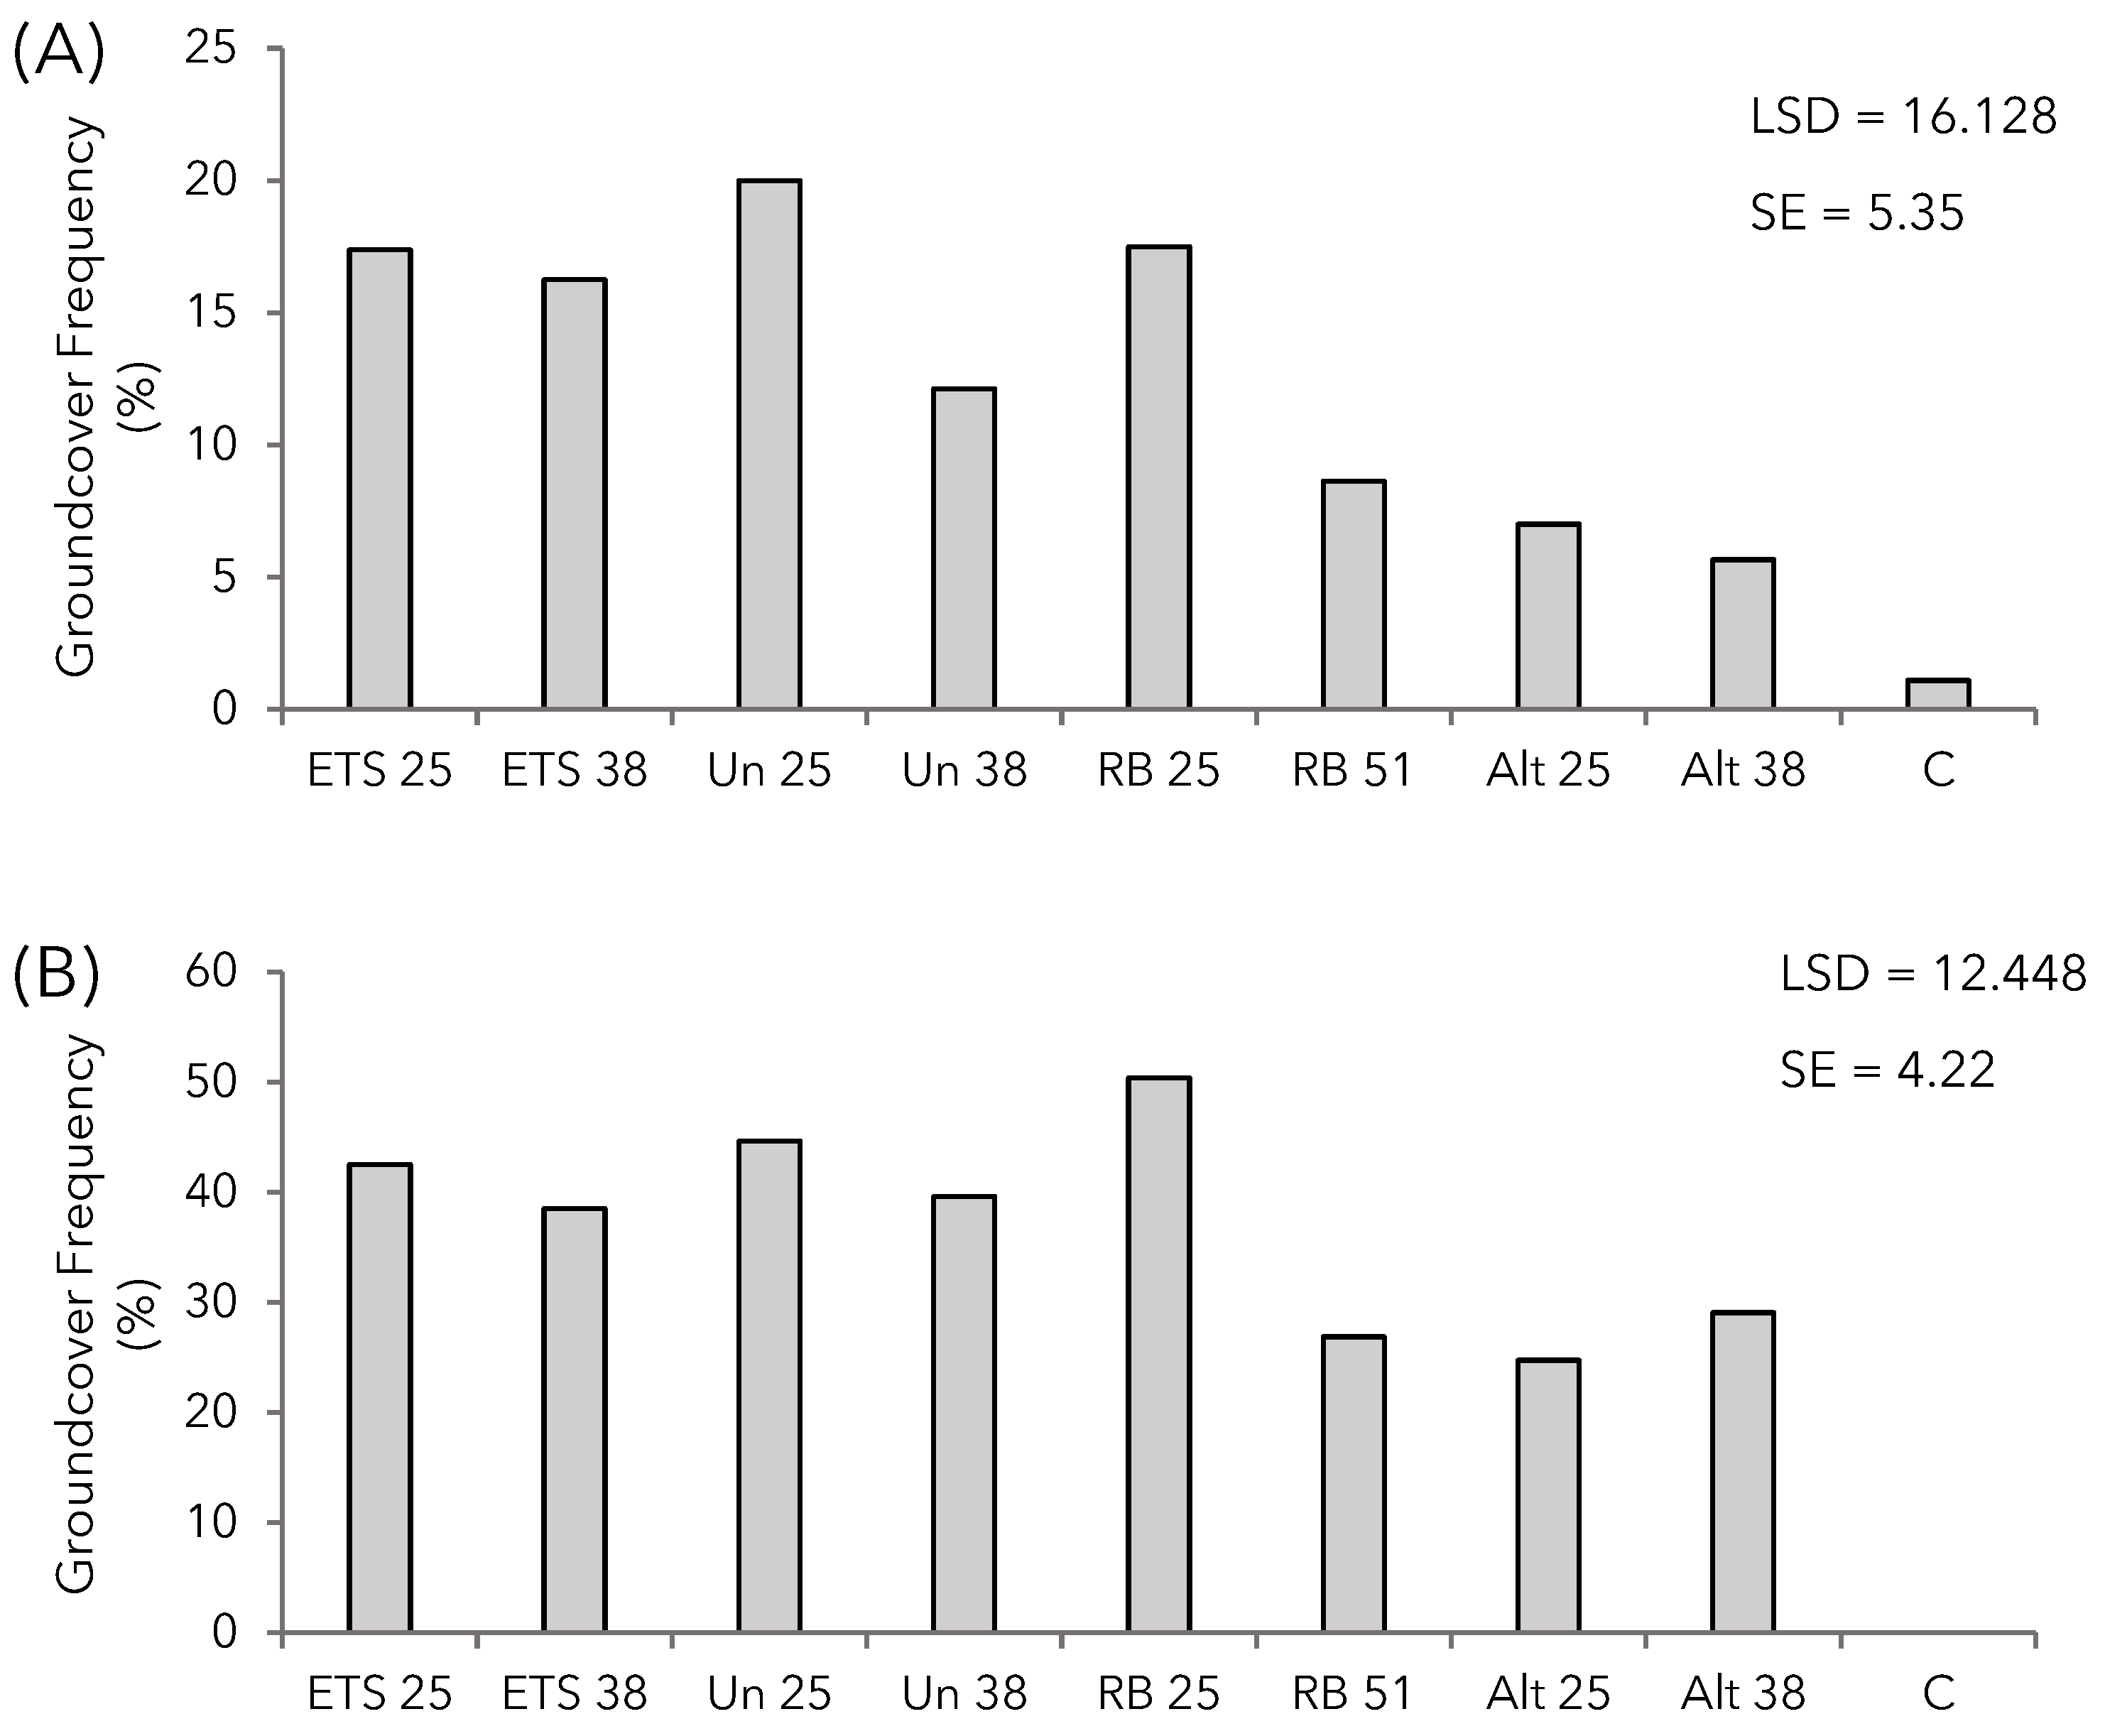
3.1.1. Frequency of Perennial Groundcover (End-of-Season)

A year by treatment interaction was observed for end-of-season groundcover frequency (Table 2). End-of-season groundcover frequency indicated development from the juvenile stand in year 1 to an established stand in year 2 but was less for wider than narrower suppression widths in year 2. End-of-season groundcover frequency was greater for the evenly spaced PGC than the alternating swards in year 1 at 15 and 7%, respectively, and year 2 at 40 and 27%, respectively (Figure 2). In year 2, greater frequency was recorded specifically in the chemical 25- than 51 cm suppression width, at 50 and 27%, respectively (p < 0.01).

3.1.2. Perennial Groundcover Sward Width (Early, Mid, and End-of-Season)

A year by treatment interaction was observed for mid-season and end-of-season groundcover sward width (Table 2). While end-of-season grass sward widths were similar for PGC treatments in 2020, the effect of suppression width persisted at the end-of-season collection date in 2021. In 2020, suppression treatments produced similar end-of-season sward widths but different mid-season sward widths. The Unverferth produced 36% greater mid-season sward width than the chemical treatment. The PGC mid-season sward width was greater for the chemical treatment 25- than 51 cm suppression width, at 35 and 14 cm, respectively.
More pronounced differences were observed between suppression widths in year 2, as the chemical wider 51 cm suppression width maintained narrower groundcover sward widths than the 25 cm suppression widths at early season, mid-season, and end-of-season. Suppression methods produced similar sward widths at all collection dates. The evenly spaced PGC sward width was greater than the alternating width at the early and end-of-season collection dates (Table 3).

3.1.3. R:FR Ratio

The PGC treatments produced lower R:FR ratio in both years than the control. In 2020, treatment was significant for R:FR ratio at only two early season collection dates (Table 4). On 29 May, the R:FR ratio for the evenly spaced PGC and alternating PGC were both less than the control, at 0.38, 0.39, and 0.45, respectively, with greater R:FR ratio for the alternating than evenly-spaced PGC. Comparing suppression methods, the chemical treatment had 11% greater R:FR ratio than the ETS. Between suppression widths, the Unverferth 38 cm suppression width had 11% greater R:FR ratio than the Unverferth 25 cm suppression width. On 3 June, a lower R:FR ratio was recorded within the evenly spaced PGC than the alternating PGC, at 0.40 and 0.44, respectively. The chemical treatment produced 13% greater R:FR ratio than other methods, and similar R:FR ratio to the control.
In 2021, treatment was significant for R:FR ratio at every collection date (Table 5). The R:FR ratio for the evenly spaced PGC was less than the control at all dates. The R:FR ratio in the PGC alternating swards was less than the control only at the first two collection dates, but greater than the evenly spaced PGC. As in year 1, the chemical treatment produced similar R:FR ratio to the control at one collection date, 12 June. The R:FR ratio was less for the ETS than other methods on 23 June. Only on the last collection date was suppression width significant for R:FR ratio, with greater R:FR ratio in the ETS 25 cm than 38 cm width.

3.2. Maize Stand Density, Maize Maturity, and Maize Plant Height

3.2.1. Maize Stand Density

While maize stand density was similar for treatments in year 1, PGC treatments produced greater V2 maize stand density in year 2. In 2020, maize plant density was similar for treatments at V2 and R6, at 77,200 and 74,600 plants ha−1, respectively. In 2021, maize plant density at V2 was greater in the alternating PGC than the evenly-spaced PGC and the control, at 71,400, 67,900, and 63,300 plants ha−1, respectively. Maize plant density at V2 was greater in the evenly spaced PGC than the control. Among suppression methods, the Unverferth produced greater V2 maize stand density than the chemical suppression method (70,000 and 65,000 plants ha−1, respectively) and control. The chemical treatment (65,000 plants ha−1) and ETS (68,000 plants ha−1) produced similar V2 maize stand density to the control (p < 0.05). Regarding suppression widths, V2 maize density was less in the Unverferth 25 cm than 38 cm suppression width, at 66,700 and 73,200 plants ha−1, respectively, but greater in the chemical treatment 25 cm than 38 cm suppression width, at 70,100 and 60,900 plants ha−1, respectively. At R6 in 2021, maize plant density was similar for treatments, averaging 75,300 plants ha−1.

3.2.2. Maize Maturity

In both 2020 and 2021, the alternating PGC and control produced taller and more rapidly maturing maize than the evenly spaced PGC. In 2020, maize maturity was similar early in the season at the first two collection dates (3 June, 308 GDD, V3 and 12 June, 519 GDD, V5), and later in the season from R1 (22 July, 1477 GDD) as reproductive stages progressed. Maize maturity in evenly spaced PGC trailed the control for all dates on which treatment was significant for maize stage and to the alternating PGC on two dates. Alternating PGC produced similar maize maturity to the control at all dates. The chemical treatment produced similar maize maturity to the control, and greater than the ETS and Unverferth suppression methods on three dates (p < 0.05). Suppression widths produced similar maturity, excepting greater maize maturity for the wider than narrower Unverferth width on 24 June (V7.3 vs. V7.7).
In 2021, maize maturity trends paralleled year 1 findings, with additional effect of slowed maturity in narrower suppression width. Similar maturity was observed for early season collection dates (25 May, 352 GDD, V2 and 2 June, 450 GDD, V3), and from the late vegetative stages (13 July, 724 GDD, V15). After the first collection date, maize maturity in evenly spaced PGC lagged the control (p < 0.01) (15 June, 767 GDD, V6 and V7; 22 June, 925 GDD, V7 and V8; 29 June, 1089 GDD, V9 and V11; 6 July, 1270 GDD, V11 and V12, respectively), with the three suppression methods producing similar maize maturity. Maize was more mature in the alternating swards than evenly spaced PGC for five collection dates (9 June, V5.0 and V4.8; 15 June, V6.3 and V5.8; 22 June, V8 and V7; 29 June, V10 and V9; 6 July, V12 and V11, respectively) (p < 0.05). Maize maturity was similar in the alternating swards and control on 9 June, and from 29 June for the remainder of the season, slightly lagging the control maize maturity only on 15 June and 22 June (p < 0.05). Maize maturity in the PGC suppression width of 25 cm was slightly delayed compared to the 38- and 51 cm widths on 15 June and 29 June (V5.7 vs. V6 and V7.0 vs. V7.2, respectively) and specifically for the Unverferth 25 cm compared to 38 cm-width on 9 June (p < 0.01) (V4 vs. V5), but widths produced similar maturity at other collection dates.

3.2.3. Maize Plant Height

In 2020, treatment was significant for maize plant height at all collection dates. Maize plant height was similar in the alternating PGC and control until V13 on 8 July, at 224 and 230 cm, respectively, and for final plant height at R1 on 22 July, at 241 and 250 cm, respectively. Maize plants in alternating PGC were taller than in evenly spaced PGC from V8 on 24 June, with a final plant height of 241 and 234 cm, respectively. At every collection date, chemical suppression produced taller maize than the Unverferth or ETS, first observed at V3 on 3 June at 15, 17, and 19 cm, respectively, and for final plant height on 22 July at 228, 230, and 244 cm, respectively. The chemical treatment produced greater maize plant height than the control early in the growing season from 3 June at 19 and 16 cm, respectively, but similar height for the rest of the season excepting one mid-season date when the chemical treatment narrow width produced shorter maize than the control. Suppression widths produced similar maize plant height, excepting only 8 July with shorter plant averages for the chemical treatment 25 cm than 51 cm widths at 189 and 201 cm, respectively (p < 0.05).
In contrast to 2020, in 2021, maize plant height was similar for the first three data collection dates. Treatment was significant for maize plant height on four dates in year 2 (V6 on 15 June, V10 on 29 June, V12 on 6 July, and at final plant height on 13 July). On all four dates, maize in evenly spaced PGC was shorter than in alternating PGC or the control. On all four dates, alternating PGC and the control produced similar maize height. All three suppression methods produced similar maize height except for 6 July, when ETS produced greater maize plant height than either Unverferth or chemical treatment, at 147, 133, and 134 cm, respectively. Suppression width was significant for height for the Unverferth 25 cm and 38 cm (62 and 76 cm, respectively) on 15 June, and for the ETS 25 cm and 38 cm on 29 June (111 and 126 cm, respectively). The terminal maize plant height in the control was 53 cm less in year 2 than year 1 (197 and 250 cm, respectively).

3.3. Maize Total Aboveground Biomass, Stover Yield, Grain Yield, Yield Components, and Harvest Index

3.3.1. Maize Grain Yield

In 2020, maize grain yield was greater in the alternating PGC (11.39 Mg ha−1) than evenly spaced PGC (9.62 Mg ha−1), and similar for the alternating PGC and control (11.85 Mg ha−1 average) (Table 6). Alternating swards at both widths produced similar grain yield to the control (p < 0.05). In 2021, treatment was nonsignificant for maize grain yield, averaging 7.41 Mg ha−1 (Table 7). Maize grain yield analysis yielded a year 1 coefficient of variation of 13.97, versus 24.2 in year 2. The control produced 54% more grain in year 1 than year 2.

3.3.2. Stover Yield

A year by treatment interaction was observed for maize stover production (Table 8). In 2020, evenly spaced and alternating PGC produced similar stover yield, but the evenly-spaced PGC yielded less stover than the control. The 51 cm chemical treatment yielded similar stover to the control and greater stover than the chemical treatment 25 cm suppression width (at 8.12 and 10.68 Mg ha−1, respectively), as the only significant tillage width for stover production (Table 6). In 2021, evenly spaced PGC yielded less than alternating PGC and control, at 5.24, 6.25, and 7.66 Mg ha−1, respectively. Alternating PGC yielded less than control. Stover yield was similar among suppression methods and between widths (Table 7).

3.3.3. Total Aboveground Biomass

In 2020, evenly spaced PGC (16.51 Mg ha−1) produced less total aboveground biomass (TAB) than the alternating PGC (18.73 Mg ha−1) and control (22.23 Mg ha−1); the alternating PGC also produced less TAB than the control. The chemical treatment 51 cm width specifically produced similar TAB to the control (Table 6). In 2021, TAB was greater in the alternating PGC and the control than evenly spaced PGC, at 13.42, 13.53, and 11.11 Mg ha−1, respectively. The alternating PGC and control produced similar TAB. Of the evenly spaced PGC suppression methods, the chemical treatment 25 cm (11.80 Mg ha−1) alone produced similar TAB to the control (Table 7).

3.4. Yield Components

A year by treatment interaction was observed for rows ear−1 (Table 8). In 2020, treatments produced 14.4 rows ear−1 (Table 6). In 2021, treatment was significant for rows ear−1. The evenly spaced PGC produced fewer rows ear−1 than the alternating PGC and control, at 13.0, 13.9, and 13.9 rows ear−1, respectively. The alternating PGC produced similar rows ear−1 to the control. The chemical 25 cm suppression width produced fewer rows ear−1 than the 51 cm width, at 12.1 vs. 13.1 rows ear−1, respectively (Table 7).
In 2020, evenly spaced PGC produced fewer kernels ear−1 (482 kernels ear−1) than the alternating PGC and control. Alternating PGC produced similar kernels ear−1 to the control. All suppression methods and widths produced similar kernels ear−1 (Table 6). In 2021, treatments produced 414 kernels ear−1 (Table 7).
In 2020, kernel weight was less in the evenly spaced PGC than control and alternating PGC, at 0.25, 0.30, and 0.27 g kernel−1, respectively. The alternating PGC produced less kernel weight than the control. The kernel weight was similar between suppression methods and widths (Table 6). In 2021, treatments produced 0.23 g kernel−1 (Table 7).
In 2021, ear length averaged 13.2 cm across treatments. Treatments produced 34.1 and 31.2 kernels row −1 in 2020 and 2021, respectively (Table 6 and Table 7). Harvest index was also similar for treatments in both years, averaging 0.50 in 2020 and 0.52 in 2021.

3.5. Weed Community

Weed community was similar for systems in both years. In 2020, fall weed community averaged 22 weeds m−2 and was comprised of 56% grass species and 44% broadleaf species. The top three dominant weed species included foxtail (Setaria spp.) (49%), dandelion (Taraxacum sp. L.) (86%), and Speedwell (Pseudolysimachion (W.D.J. Koch) Opiz) (10%). The fall weed community in 2021 averaged 34 weeds m−2 and was composed of 45% grass and 55% broadleaf species. The top three species were crabgrass (Digitaria × umfolozi D.W. Hall) (32%), yellow foxtail (Setaria pumila (Poir.) Roem. & Schult.) (31%), and dandelion (15%). While not quantified, in 2021, broadleaf weeds persisted after 2,4-D application.

4. Discussion

4.1. Perennial Groundcover Frequency and Sward Width

Abnormally dry to severe drought conditions likely restricted post-suppression groundcover recovery and stand regeneration in year 2, as PGC sward width differences persisted to the end of the season, in contrast to the groundcover recovery observed in year 1 and spring conditions in previous studies that supported groundcover regrowth [13,14,15,16,19,20]. Kentucky bluegrass cover thickens by the production of rhizomes and then tillers [31], with rhizomes produced in the late spring and fall [32]. The reduction in early season to mid-season PGC width in year 2 is attributable to scant precipitation through the mid-season data collection date, as loss of green cover is an initial sign of drought response in KBG [33]. The development of the juvenile to established stand from year 1 and year 2, respectively, was observed in greater groundcover frequency generally for the second year. Of all suppression methods, the chemical treatment more effectively limited groundcover recovery.

4.2. R:FR Ratio

Dark soils produce high light quality for plant growth by reflecting red light and producing a greater reflected R:FR ratio. In contrast to bare soil, sod reduces the light quality reflected to neighboring plants because of red light absorption by the green tissue [34]. Green tissue absorbs red light and reflects far-red light, reducing the R:FR ratio intercepted by neighboring plants [35,36,37,38] and explaining the differences observed between PGC and the control for this response variable. Additionally, the plant sphere of influence for light quality perception is influenced by the size, number, proximity, and orientation of competing leaves [39]. System affected light quality in both years, with best light quality recorded in the conventional control and diminished light quality for both PGC systems. Regarding suppression methods, in year 2, the alternating 38 cm PGC was also similar to the control for the duration of the collection dates. The chemical treatment also achieved similar light quality to the control on some collection dates in both years, indicating that the Glyphosate more effectively suppressed groundcover than the mechanical treatments. The few differences recorded in light quality between narrow and wide sward widths over the two-year study indicate that both suppression widths for evenly spaced PGC were largely within the sphere of influence for light quality perception of adjacent maize plants, indicating a need to further investigate PGC suppression efficacy to turn the perennial cover crop aboveground biomass brown during early vegetative maize stages.

4.3. Maize Morphology, Yield, Quality, and Yield Components

4.3.1. Maize Stand Density

Perennial groundcover retains soil moisture and decreases soil temperature, delaying maize seedling emergence with cool and wet conditions [17,40]. Clump-forming sods also produce asymmetrical row crop seed beds that impair uniform maize stand development [16]. With moderate drought conditions in early season year 2, however, greater soil moisture in PGC treatments likely supported uniform maize germination and emergence as recorded in greater V2 stand density than the control. The alternating PGC produced the greatest V2 maize stand density of all treatments, resulting from similar light quality to the control, PGC-related soil moisture benefit, and limited groundcover competition [41]. Delayed germination from inadequate soil moisture [42] in year 2 produced greater average plant density from the V2 to R6 maize stage.

4.3.2. Maize Maturity and Height

Groundcover delayed maize maturation and decreased height for maize in PGC likely caused by competition in year 1 from insufficient suppression and moisture inadequacy. Severe drought conditions superseded groundcover competition and the SAR effect on response variables in year 2, diminishing treatment effects. The SAR results from a low R:FR ratio and begins to impact maize shortly after emergence [43], preceding the onset of the critical period for weed control [44]. Physiological responses to the SAR during the maize growing season include elongation of the maize plant, larger or rapidly developing leaves, and biomass dedications that increase the shoot:root ratio [38,44,45]. We observed few differences in maize plant etiolation from light quality as a SAR response specifically between suppression widths. The chemical suppression method wide width was the only treatment that produced comparable plant height to the control for the duration of the season, with a potential SAR response in the narrow chemical suppression width in year 1.

4.3.3. Maize Yield

While a PGC-related maize yield penalty occurred for the mechanically suppressed, evenly spaced PGC, the chemical suppression and alternating PGC swards produced some comparable yield metrics to the control. In year 1, the chemical no-tillage suppression produced greater TAB and stover than the strip tillage suppression methods. Furthermore, the chemical suppression wide width produced similar stover, similar TAB, but less grain yield than the control in year 1 and the narrow width produced similar TAB to the control in year 2. The alternating PGC produced similar grain and stover yield to the control in year 1, and similar stover and TAB to the control in year 2. Chemical suppression produced greater yields than the tillage suppression methods in evenly spaced PGC likely because no-till retains subsoil moisture during abnormally dry to moderate drought conditions, and suppressed the groundcover more effectively as evidenced by better light quality to support maize growth [46]. The chemical treatment still reduced grain yield compared to the control; weeds reduce biomass partitioning to grain and can account for up to 65% of dry matter loss [47]. In the alternating PGC, less groundcover competition with the maize and better light quality than the evenly spaced PGC supported maize grain yield.
The theoretical maximum grain yield, stover yield, and TAB was not reached in year 2 because of moisture insufficiency, which suppressed treatment effects and compounded both the maize SAR and groundcover competition in end-of-season response measurements. While empirical soil moisture testing in several plots in year 2 on 27 July indicated twice the soil moisture under PGC as in the control at 20% and 10%, respectively, soil moisture was still grossly inadequate to achieve maize yield potential. Excessive soil evapotranspiration during extreme heat and drought produces moisture deficiencies for crop yield regardless of row crop root depth [48]. A high coefficient of variation (24.2) indicated greater variability in the mean estimates for grain yield in year 2, which likely rendered treatment nonsignificant. In persistent and severe drought conditions such as in year 2, the ETS SoilWarrior prototype strip tillage machine weight and resulting vertical soil fracture may actually support grain yield in PGC as a best management practice. The shallow ETS strip tillage affords better maize seed to soil contact at planting than no-till, without drying out the soil to the extent of the Unverferth strip tillage machine with deeper tillage. Grain yield decreases in no-till systems with early season drought onset where plant rooting is delayed, and accrued no-till moisture is inaccessible to the plant [49].
The control, alternating PGC, and evenly spaced PGC maize grain yield of 12.78, 11.39, and 9.62 Mg ha−1, respectively, in 2020 is far greater than the reported maize grain yield for Story County, IA, USA, of 9.3 ha−1 in 2020 [50]. In year 1, an extreme weather event in central Iowa on 10 August 2020 produced widespread damage from wind speeds of 112–225 km hour−1. The specific maize hybrid and PGC in this study were unaffected by the weather event, in contrast to severe and extensive lodging in conventional maize in adjacent plots and fields. The increased soil structure in PGC systems may enhance grain crop resiliency to extreme weather events and reduce maize lodging, as an area for future research.

4.3.4. Maize Yield Components

In both years, moisture insufficiency and the SAR likely decreased maize yield components, with additional effect of groundcover competition in year 1. In year 1, low light quality was recorded in the R:FR ratio for PGC at the earliest collection date, shortly after groundcover suppression. Rainfall was only commensurate with the 30-year trailing average in May, with much less precipitation than the 30-year trailing average for the rest of the season and specifically in June from the V3 to V8 maize stages. These factors likely emphasize moisture insufficiency and SAR as causes of reduced kernels ear−1 and kernel weight for maize in PGC. Environmental stressors including drought that curtail plant growth rate prior to maize silking and during grain fill can reduce kernel set and kernel weight [47,51]. The SAR exacerbates early season maize plant-to-plant variability and compounds the effect of secondary stressors, further reducing end-of-season yield components such as maize kernel number per plant [47]. Even though low light quality was recorded for PGC treatments consistently during the early maize stages in year 2, maize yield components were largely similar excepting rows ear−1 with extensive and severe drought that same year. Row number is determined by the early vegetative stage of V7 after ear initiation [25], indicating that early season stressors reduce rows ear−1 [52]. The reduction in rows ear−1 for maize in evenly spaced PGC compared to the control and alternating PGC in year 2 could be explained by early-season low light quality in evenly-spaced PGC treatments, given that moisture insufficiency in year 2 did not encourage rapid post-suppression recovery of PGC. Kernels ear−1 for all treatments in year 1 were within the industry standard of 450 to 550 kernels ear−1 [25], but kernels ear−1 for all treatments plus control fell short of this benchmark in year 2 because of severe moisture insufficiency.

4.4. Weed Community

Findings are consistent with previous reports, whereby PGC and living mulches provided weed control but to varying extents [53,54,55,56]. Mulches reduce light interception and alter soil temperature for weed seed germination, decreasing weed populations [57]. Cover crops that effectively reduce weed pressure usually themselves require management with chemical or mechanical suppression to minimize competition with the interseeded grain crop [57,58,59]. Pre-emergent herbicide in conjunction with PGC can manage weed pressure more effectively than PGC alone [59], which could be combined with groundcover chemical suppression practices. In light of increasing weed resistance to existing herbicide modes of action [60,61], PGC presents a tenable solution as a novel weed management practice that is independent of new mode of action discoveries. We attribute persistence of broadleaf weeds after 2,4-D application specifically in year 2 to the reduced translocation of the amine 2,4-D formula on drought stressed weeds, limiting efficacy [62].

5. Conclusions

While PGC suppression methods require further development to effectively manage the early season R:FR ratio and subsequent competition, enhanced soil moisture retention and weed control benefits hold promise to support maize growth in a PGC system. Both the narrow and wide suppression widths included in this study produced early-season low light quality perceived by the maize plant within the maize plant′s sphere of influence. Perennial groundcover dormancy coupled with effective suppression that can turn the groundcover from green to brown is needed throughout the period of the maize SAR and critical period for weed control, ideally from day of maize planting but at least prior to maize emergence. Effective suppression that would turn the PGC brown during the early maize vegetative growth stages would produce similar light quality as conventional bare soil, recorded as a greater reflected R:FR ratio above the groundcover canopy, to support maize production and end-of-season yield, limiting groundcover competition. One noteworthy result was that chemical suppression produced greater maize yield than the other PGC suppression methods in year 1 during moderate drought conditions, which is important for the development of no-till systems. To promote maize production while delivering ecosystems services in a PGC system, further research is needed for groundcover varietal screening and development, chemical suppression evaluation, and maize-groundcover compatibility to develop best management practices.

Author Contributions

Conceptualization, C.A.B., K.J.M., S.-z.F., A.W.L., and R.L.H.; methodology, C.A.B., K.J.M., S.-z.F., A.W.L., and R.L.H.; formal analysis, C.A.B., K.J.M., and S.M.K.; investigation, C.A.B., K.J.M., S.-z.F., A.W.L., R.L.H., and S.M.K.; writing—original draft preparation, C.A.B.; writing—review and editing, C.A.B., K.J.M., S.-z.F., and A.W.L.; project administration, K.J.M.; funding acquisition, K.J.M., S.-z.F., and A.W.L. All authors have read and agreed to the published version of the manuscript.

Funding

This research was funded by the Agriculture and Food Research Initiative Competitive Award No. 2017-67019-26370, from the United States Department of Agriculture National Institute for Food and Agriculture.

Institutional Review Board Statement

Not applicable.

Informed Consent Statement

Not applicable.

Data Availability Statement

All data are provided in this article within the format of tables and figures.

Conflicts of Interest

The authors declare no conflict of interest. The funders had no role in the design of the study; in the collection, analyses, or interpretation of data; in the writing of the manuscript, or in the decision to publish the results.

References

  1. Moore, K.J.; Anex, R.P.; Elobeid, A.E.; Fei, S.; Flora, C.B.; Goggi, A.S.; Jacobs, K.L.; Jha, P.; Kaleita, A.L.; Karlen, D.L.; et al. Regenerating agricultural landscapes with perennial groundcover for intensive crop production. Agronomy 2019, 9, 458. [Google Scholar] [CrossRef] [Green Version]
  2. USDA National Agricultural Statistics Service. 2017 Census of Agriculture; United States Summary and State Data Volume 1, Geographic Area Series, Part 51. 2019. Available online: https://www.nass.usda.gov/Publications/AgCensus/2017/Full_Report/Volume_1,_Chapter_1_US/usv1.pdf (accessed on 2 January 2022).
  3. Gil, J.D.B.; Garrett, R.; Berger, T. Determinants of crop-livestock integration in Brazil: Evidence from the household and regional levels. Land Use Policy 2016, 59, 557–568. [Google Scholar] [CrossRef] [Green Version]
  4. Mateus, G.P.; Crusciol, C.A.C.; Pariz, C.M.; Costa, N.R.; Borghi, E.; Costa, C.; Martello, J.M.; Castilhos, A.M.; Franzluebbers, A.J.; Cantarella, H. Corn intercropped with tropical perennial grasses as affected by sidedress nitrogen application rates. Nutr. Cycl. Agroecosyst. 2020, 116, 223–244. [Google Scholar] [CrossRef]
  5. da Silveira, J.G.; Oliveira Neto, S.N.d.; Canto, A.C.B.d.; Leite, F.F.G.D.; Cordeiro, F.R.; Assad, L.T.; Silva, G.C.C.; Marques, R.d.O.; Dalarme, M.S.L.; Ferreira, I.G.M.; et al. Land Use, Land Cover Change and Sustainable Intensification of Agriculture and Livestock in the Amazon and the Atlantic Forest in Brazil. Sustainability 2022, 14, 2563. [Google Scholar] [CrossRef]
  6. Embrapa. Integrated Crop-Livestock-Forestry Systems. Available online: https://www.embrapa.br/en/tema-integracao-lavoura-pecuaria-floresta-ilpf/nota-tecnica (accessed on 2 January 2022).
  7. ICIPE. ‘Push-Pull’: A Platform Technology for Improving Livelihoods of Resource Poor Farmers. 2022. Available online: http://www.push-pull.net/dissemination.shtml (accessed on 22 April 2022).
  8. Mutyambai, D.M.; Bass, E.; Luttermoser, T.; Poveda, K.; Midega, C.A.O.; Khan, Z.R.; Kessler, A. More than “push” and “pull”? Plant-soil feedbacks of maize companion cropping increase chemical plant defenses against herbivores. Front. Ecol. Evol. 2019, 7, 217. [Google Scholar] [CrossRef] [Green Version]
  9. Hassanali, A.; Herren, H.; Khan, Z.R.; Pickett, J.A.; Woodcock, C.M. Integrated pest management: The push-pull approach for controlling insect pests and weeds of cereals, and its potential for other agricultural systems including animal husbandry. Philos. Trans. R. Soc. B 2008, 363, 611–621. [Google Scholar] [CrossRef]
  10. Pessarakli, M. Handbook of Plant and Crop Physiology, 3rd ed.; CRC Press: Boca Raton, FL, USA, 2014; ISBN 978-1-4665-5328-6. [Google Scholar] [CrossRef]
  11. Bonos, S.A.; Huff, D.R. Cool-season grasses: Biology and breeding. In Turfgrass: Biology, Use, and Management; Stier, J.C., Horgan, B.P., Bonos, S.A., Eds.; American Society of Agronomy, Crop Science Society of America, Soil Science Society of America: Madison, WI, USA, 2013; pp. 591–660. [Google Scholar]
  12. Wiggans, D.R.; Singer, J.W.; Moore, K.J.; Lamkey, K.R. Response of continuous maize with stover removal to living mulches. Agron. J. 2012, 104, 917–925. [Google Scholar] [CrossRef] [Green Version]
  13. Bartel, C.A.; Banik, C.; Lenssen, A.W.; Moore, K.J.; Laird, D.A.; Archontoulis, S.V.; Lamkey, K.R. Living mulch for sustainable maize stover biomass harvest. Crop Sci. 2017, 57, 3273–3290. [Google Scholar] [CrossRef] [Green Version]
  14. Bartel, C.A.; Banik, C.; Lenssen, A.W.; Moore, K.J.; Laird, D.A.; Archontoulis, S.V.; Lamkey, K.R. Establishment of perennial groundcovers for maize-based bioenergy production systems. Agron. J. 2017, 109, 822–835. [Google Scholar] [CrossRef] [Green Version]
  15. Bartel, C.A.; Archontoulis, S.V.; Lenssen, A.W.; Moore, K.J.; Huber, I.L.; Laird, D.A.; Dixon, P.M. Modeling perennial groundcover effects on annual maize grain crop growth with APSIM. Agron. J. 2020, 112, 1895–1910. [Google Scholar] [CrossRef]
  16. Flynn, E.S.; Moore, K.J.; Singer, J.W.; Lamkey, K.R. Evaluation of grass and legume species as perennial ground covers in corn production. Crop Sci. 2013, 53, 611–620. [Google Scholar] [CrossRef]
  17. Wiggans, D.R.; Singer, J.W.; Moore, K.J.; Lamkey, K.R. Maize Water Use in Living Mulch Systems with Stover Removal. Crop Sci. 2012, 52, 327–338. [Google Scholar] [CrossRef] [Green Version]
  18. Richardson, M.D.; Karcher, D.E.; Hignight, K.; Rush, D. Drought tolerance of Kentucky bluegrass and hybrid bluegrass cultivars. Appl. Turfgrass Sci. 2009, 6, 1–10. [Google Scholar] [CrossRef]
  19. Elkins, D.M.; Vandeventer, J.W.; Xapusta, G.; Anderson, M.R. No-tillage maize production in chemically suppressed grass sod. Agron. J. 1979, 71, 101–105. [Google Scholar] [CrossRef]
  20. Elkins, D.; Frederking, D.; Marashi, R.; McVay, B. Living mulch for no-till corn and soybeans. J. Soil Water Conserv. 1983, 38, 431–433. [Google Scholar]
  21. Iowa Environmental Mesonet Network. National Weather Service Cooperative Observer Program. Iowa Environ. Mesonet Network. 2021. Available online: https://mesonet.agron.iastate.edu/COOP/ (accessed on 22 April 2022).
  22. McMaster, G.S.; Wilhelm, W.W. Growing degree-days: One equation, two interpretations. Agric. For. Meteorol. 1997, 87, 291–300. [Google Scholar] [CrossRef] [Green Version]
  23. Pioneer.com. 18D-1182 Northern Iowa Product Guide. Available online: https://www.pioneer.com/corn (accessed on 1 May 2020).
  24. Pioneer. Product Spotlight P0574AM and P0574AMXT. 2018. Available online: https://www.youtube.com/watch?v=dISMb9x2Tiw (accessed on 1 May 2020).
  25. Abendroth, L.J.; Elmore, R.W.; Boyer, M.J.; Marlay, S.K. Corn growth and development. Ext. Publ. PMR-1009; Iowa State University: Ames, IA, USA, 2011; Available online: https://store.extension.iastate.edu/Product/Corn-Growth-and-Development (accessed on 22 April 2022).
  26. Dobermann, A. Procedure for Measuring Dry Matter, Nutrient Uptake, Yield and Components of Yield in Maize. Researchgate. 2005. Available online: https://www.researchgate.net/file.PostFileLoader.html?id=56a89ca57eddd3b3618b45aa&assetKey=AS%3A322455225208832%401453890724796 (accessed on 22 April 2022).
  27. Wilhelm, W.W.; Johnson, J.M.F.; Hatfield, J.L.; Voorhees, W.B.; Linden, D.R. Crop and soil productivity response to maize residue removal: A literature review. Agron. J. 2004, 96, 1–17. [Google Scholar] [CrossRef]
  28. Vogel, K.P.; Masters, R.A. Frequency grid: A simple tool for measuring grassland establishment. J. Range Manag. 2001, 54, 653–655. [Google Scholar] [CrossRef]
  29. SAS Institute. SAS/STAT 9.3 User’s Guide; SAS Inst.: Cary, NC, USA, 2011. [Google Scholar]
  30. National Drought Mitigation Center. US Drought Monitor Comparison Slider. 2021. Available online: https://droughtmonitor.unl.edu/Maps/ComparisonSlider.aspx (accessed on 3 January 2022).
  31. Moser, L.E.; Anderson, S.R.; Miller, R.W. Rhizome and tiller development of Kentucky bluegrass (Poa pratensis L.) as influenced by photoperiod, cold treatment, and variety. Agron. J. 1968, 60, 632–635. [Google Scholar] [CrossRef] [Green Version]
  32. Beard, J.B. Turfgrass: Science and Culture; Prentice Hall: Englewood Cliffs, NJ, USA, 1972. [Google Scholar]
  33. Richardson, M.D.; Karcher, D.E.; Hignight, K.; Rush, D. Drought tolerance and rooting capacity of Kentucky bluegrass cultivars. Crop Sci. 2008, 48, 2429–2436. [Google Scholar] [CrossRef] [Green Version]
  34. Rajcan, I.; Chandler, K.J.; Swanton, C.J. Red–far-red ratio of reflected light: A hypothesis of why early-season weed control is important in corn. Weed Sci. 2004, 52, 774–778. [Google Scholar] [CrossRef]
  35. Matthews, S. Phytochrome-mediated development in land plants: Red light sensing evolves to meet the challenges of changing light environments. Mol. Ecol. 2006, 15, 3483–3503. [Google Scholar] [CrossRef] [PubMed]
  36. Smith, H. Light quality, photoperception, and plant strategy. Annu. Rev. Plant Physiol. 1982, 33, 481–518. [Google Scholar] [CrossRef]
  37. Kasperbauer, M.J. Far-red reflection from green leaves and effects on phytochrome-mediated assimilate partitioning under field conditions. Plant Phys. 1987, 85, 350–354. [Google Scholar] [CrossRef] [Green Version]
  38. Ballaré, C.L.; Sanchez, R.A.; Scopel, A.L.; Casal, J.J.; Ghersa, C.M. Early detection of neighbour plants by phytochrome perception of spectral changes in reflected sunlight. Plant Cell Environ. 1987, 10, 551–557. [Google Scholar]
  39. Kasperbauer, M.J.; Hunt, P.G. Cotton seedling morphogenic responses to r/fr ratio reflected from different colored soils and soil colors. Photochem. Photobiol. 1992, 56, 579–584. [Google Scholar] [CrossRef]
  40. Kimmelshue, C.L.; Goggi, A.S.; Moore, K.J. Single-plant grain yield in corn (Zea mays L.) based on emergence date, seed size, sowing depth, and plant to plant distance. Crops 2022, 2, 62–86. [Google Scholar] [CrossRef]
  41. Demotes-Mainard, S.; Péron, T.; Corot, A.; Bertheloot, J.; Le Gourrierec, J.; Pelleschi-Travier, S.; Crespel, L.; Morel, P.; Huché-Thélier, L.; Boumaza, R.; et al. Plant responses to red and far-red lights, applications in horticulture. Environ. Exp. Bot. 2016, 121, 4–21. [Google Scholar] [CrossRef]
  42. Delouche, J.C. Influence of moisture and temperature levels on the germination of corn, soybeans and watermelons. Miss. Agric. For. Exp. Stn. 1953, 43, 117–126. [Google Scholar]
  43. Page, E.R.; Tollenaar, M.; Lee, E.A.; Lukens, L.; Swanton, C.J. Shade avoidance: An integral component of crop-weed competition. Weed Res. 2010, 50, 281–288. [Google Scholar] [CrossRef]
  44. Page, E.R.; Tollenaar, M.; Lee, E.A.; Lukens, L.; Swanton, C.J. Does the shade avoidance response contribute to the critical period for weed control in maize (Zea mays)? Weed Res. 2009, 49, 563–571. [Google Scholar] [CrossRef]
  45. Kasperbauer, M.J.; Hunt, P.G. Root size and shoot/root ratio as influenced by light environment of the shoot. J. Plant Nutr. 1992, 15, 685–697. [Google Scholar] [CrossRef]
  46. Al-Kaisi, M.M.; Elmore, R.W.; Guzman, J.G.; Hanna, H.M.; Hart, C.E.; Helmers, M.J.; Hodgson, E.W.; Lenssen, A.W.; Mallarino, A.P.; Robertson, A.E.; et al. Drought impact on crop production and the soil environment: 2012 Experiences from Iowa. J. Soil Water Conser 2013, 68, 19A–24A. [Google Scholar] [CrossRef] [Green Version]
  47. Page, E.R.; Cerrudo, D.; Westra, P.; Loux, M.; Smith, K.; Foresman, C.; Wright, H.; Swanton, C.J. Why early season weed control is important in maize. Weed Sci. 2012, 60, 423–430. [Google Scholar] [CrossRef]
  48. Newell, R.L.; Wilhelm, W. Conservation tillage and irrigation effects on corn root development. Agron. J. 1987, 79, 160–165. [Google Scholar] [CrossRef] [Green Version]
  49. West, T.D.; Griffith, D.R.; Steinhardt, G.C.; Kladivko, E.J.; Parsons, S.D. Effect of tillage and rotation on agronomic performance of corn and soybean: Twenty-year study on dark silty clay loam soil. J. Prod. Agric. 1996, 9, 241–248. [Google Scholar] [CrossRef]
  50. USDA National Agricultural Statistics Service. (Dataset). NASS—Quick Stats. USDA National Agricultural Statistics Service. 2022. Available online: https://data.nal.usda.gov/dataset/nass-quick-stats (accessed on 10 May 2022).
  51. Borrás, L.; Gambín, B.L. Trait dissection of maize kernel weight: Towards integrating hierarchical scales using a plant growth approach. Field Crops Res. 2010, 118, 1–12. [Google Scholar] [CrossRef]
  52. Milander, J.J.; Jukic, Z.; Mason, S.C.; Galusha, T.; Kmail, Z. Plant Population Influence on Maize Yield Components in Croatia and Nebraska. Crop Sci. 2016, 56, 2742–2750. [Google Scholar] [CrossRef]
  53. Ateh, C.M.; Doll, J.D. Spring-planted winter rye (Secale cereale) as a living mulch to control weeds in soybean (Glycine max). Weed Technol. 1996, 10, 347–353. [Google Scholar] [CrossRef]
  54. Nagabhushana, G.G.; Worsham, A.D.; Yelverton, F.H.; Wickliffe, W.B.; Lemmons, R.W. Agronomic manipulation of rye cover for improved weed suppression in no-till crop production systems. Proc. South. Weed Sci. Soc. 1995, 48, 168–169. [Google Scholar]
  55. Singer, J.W.; Moore, K.J.; Kohler, K.A.; Meek, D.W. Living mulch forage yield and botanical composition in a corn-soybean-forage rotation. Agron. J. 2009, 101, 1249–1257. [Google Scholar] [CrossRef] [Green Version]
  56. Echtenkamp, G.W.; Moomaw, R.S. No-till corn production in a living mulch system. Weed Technol. 1989, 3, 261–266. [Google Scholar] [CrossRef]
  57. Teasdale, J.R. Contribution of cover crops to weed management in sustainable agricultural systems. J. Prod. Agric. 1996, 9, 475–479. [Google Scholar] [CrossRef]
  58. Martin, R.C.; Greyson, P.R.; Gordon, R. Competition between corn and a living mulch. Can. J. Plant Sci. 1999, 79, 579–586. [Google Scholar] [CrossRef] [Green Version]
  59. Yenish, J.P.; Worsham, A.D.; York, A.C. Cover crops for herbicide replacement in no-tillage corn (Zea mays). Weed Technol. 1996, 10, 815–821. [Google Scholar] [CrossRef]
  60. Duke, S.O. Why have no new herbicide modes of action appeared in recent years? Pest Manag. Sci. 2012, 68, 505–512. [Google Scholar] [CrossRef] [Green Version]
  61. Green, J.M. Current state of herbicides in herbicide-resistant crops. Pest Manag. Sci. 2014, 70, 1351–1357. [Google Scholar] [CrossRef]
  62. Parker, R.; Boydston, R.A. Weed Management and Herbicide Performance during Drought Conditions; Washington State University Website Extension Bulletin: Washington, DC, USA, 2005; p. 2. [Google Scholar]
Figure 1. (A) Growing degree days (GDD) by month in 2020 and 2021 and 30-yr trailing average at NWS COOP site Ames-8-WSW; and (B) total precipitation by month in 2020 and 2021 and 30-yr trailing average at NWS COOP site Ames-8-WSW.
Crops 02 00020 g001
Figure 2. End-of-season groundcover frequency for treatments at the Sorenson Research Farm in 2020 (A) and 2021 (B). Treatments include ETS strip tillage 25 cm width (ETS 25); ETS strip tillage 38 cm width (ETS 38); Unverferth strip tillage 25 cm width (Un 25); Unverferth strip tillage 38 cm width (Un 38); Chemical band sprayer 25 cm width (RB 25); Chemical band sprayer 51 cm width (RB 51); alternating PGC swards 25 cm width (Alt 25); alternating PGC swards 38 cm width (Alt 38); control (C).
Crops 02 00020 g002
Table 1. Treatments at Sorenson Research Farm in 2020 and 2021.
TreatmentSuppression Type, Width, and Equipment
1ETS SoilWarrior strip tillage 25 cm width
2ETS SoilWarrior strip tillage 38 cm width
3Unverferth 330 strip tillage 25 cm width
4Unverferth 330 strip tillage 38 cm width
5Chemical, Redball-Hooded band sprayer 25 cm width
6Chemical, Redball-Hooded band sprayer 51 cm width
7Alternating PGC strips 25 cm width
8Alternating PGC strips 38 cm width
9No-PGC conventional tillage control
Table 2. Type III tests of significance for fixed sources of variation for perennial groundcover (PGC) mid-season (Mid) and end-of-season (End) sward width, and PGC end-of-season frequency (PGC Frequency) at Sorenson Research Farm in 2020 and 2021.
Source of VariationPGC Width ‘Mid’PGC Width ‘End’PGC Frequency
Treatment (T)<0.0001<0.0001<0.0001
Sequence Year (Y)<0.00010.0003<0.0001
T × Y<0.0001<0.0001<0.0001
Table 3. Perennial groundcover sward widths at mid- and end-of-season in 2020 and 2021 and early season in 2021 at the Sorenson Research Farm.
TreatmentMid-
Season
End of
Season
Early
Season
Mid-
Season
End of
Season
 _________ 2020 _________________________ 2021 ________________
 ____________________________________ cm ___________________________________
ETS 25 cm 3230272131
ETS 38 cm 2925211722
Unverferth 25 cm 3331342429
Unverferth 38 cm 3323241823
Chemical 25 cm 3525302330
Chemical 51 cm 1416201218
Alternating 25 cm 3526231619
Alternating 38 cm 3122191316
Control00000
SE3.455.142.402.653.11
Pr > F
Treatment<0.00010.0035<0.0001<0.0001<0.0001
Evenly spaced vs. alternating PGC0.19870.85890.02220.05080.0043
Unverferth vs. ETS0.43750.90370.06140.41070.9847
Unverferth vs. chemical0.01870.21870.11880.27640.4498
ETS vs. chemical0.09960.17830.73770.78570.4386
ETS 25 vs. 38 cm0.53190.55060.10950.29460.0529
Unverferth 25 vs. 38 cm0.94000.33340.00520.13510.1937
Chemical 25 vs. 51 cm0.00010.26400.00890.00790.0183
Table 4. Perennial groundcover R:FR ratio at the Sorenson Research Farm in 2020.
TreatmentR:FR Ratio—2020
29 May3 June11 June25 June
ETS 25 cm 0.380.390.350.17
ETS 38 cm 0.350.370.320.17
Unverferth 25 cm 0.360.370.340.18
Unverferth 38 cm 0.400.400.360.16
Chemical 25 cm 0.390.430.340.17
Chemical 51 cm 0.410.430.360.18
Alternating 25 cm 0.380.410.340.16
Alternating 38 cm 0.400.470.350.17
Control0.450.430.360.16
SE0.020.020.010.01
Pr > F
Treatment0.00180.03930.06420.0509
Evenly spaced PGC vs. control0.00020.2134--
Alternating PGC vs. control0.00260.6339--
Evenly spaced PGC vs. alternating PGC0.50230.0226--
Unverferth vs. ETS0.19290.9955--
Unverferth vs. Chemical0.15260.0252--
ETS vs. Chemical0.00890.0248--
PGC 25 vs. 38&51 cm 0.25800.7335--
ETS 25 vs. 38 cm0.19620.5841--
Unverferth 25 vs. 38 cm0.03300.2799--
Chemical 25 vs. 51 cm0.28720.9619--
Chemical vs. control0.01510.8714--
ETS vs. control<0.00010.0876--
Unverferth vs. control0.00070.0884--
Alternating 25 cm PGC vs. control0.00290.5991--
Alternating 38 cm PGC vs. control0.02060.1825--
Table 5. Perennial groundcover R:FR ratio at the Sorenson Research Farm in 2021.
TreatmentR:FR Ratio—2021
26 May4 June12 June23 June
ETS 25 cm 0.300.290.260.23
ETS 38 cm 0.300.290.250.20
Unverferth 25 cm 0.290.280.270.24
Unverferth 38 cm 0.290.280.250.22
Chemical 25 cm 0.280.270.260.24
Chemical 51 cm 0.300.290.280.25
Alternating 25 cm 0.330.310.280.20
Alternating 38 cm 0.350.320.280.19
Control0.370.360.290.19
SE0.010.020.010.01
Pr > F
Treatment<0.0001<0.0001<0.0001<0.0001
Evenly spaced PGC vs. control<0.0001<0.00010.0265<0.0001
Alternating PGC vs. control0.02890.02360.29210.5355
Evenly spaced PGC vs. alternating PGC0.00020.00690.1496<0.0001
Unverferth vs. ETS0.45320.75910.65310.0492
Unverferth vs. Chemical0.95550.78100.54500.0574
ETS vs. Chemical0.48710.55960.29480.0004
PGC 25 vs. 38&51 cm 0.41590.72200.86590.0380
ETS 25 vs. 38 cm0.98970.98830.47280.0271
Unverferth 25 vs. 38 cm0.87600.71230.17020.0538
Chemical 25 vs. 51 cm0.21800.32100.07610.5713
Chemical vs. control<0.0001<0.00010.1198<0.0001
ETS vs. control<0.00010.00030.01930.0068
Unverferth vs. control<0.00010.00020.0441<0.0001
Alternating 25 cm PGC vs. control0.01550.02040.36210.3947
Alternating 38 cm PGC vs. control0.16870.10310.35880.8257
Table 6. Treatment means and significance for maize measurements including grain yield, stover yield, total aboveground biomass (TAB), rows ear−1, kernel weight, kernels per ear (KE), and kernels per row (KR) at Sorenson Research Farm in 2020. Grain yield was obtained from hand and combine harvest and expressed at 150 g kg−1 moisture content. Total aboveground biomass and stover yield are expressed on an oven-dry basis.
TreatmentGrain YieldStover
Yield
TAB Rows Ear−1Kernel WeightKEKR
____________ mg ha−1 ____________no. ear−1g kernel−1no. ear−1no. row−1
2020
ETS 25 cm 9.226.8714.7114.30.2447633.3
ETS 38 cm 9.177.9115.7114.50.2649334.1
Unverferth 25 cm 8.957.9615.5714.20.2648033.7
Unverferth 38 cm 9.478.4616.5115.20.2547832.5
Chemical 25 cm 10.428.1216.9814.00.2647733.9
Chemical 51 cm 10.4710.6819.5814.50.2548833.6
Alternating 25 cm 11.398.8518.5414.60.2752034.9
Alternating 38 cm 11.389.2518.9214.60.2750234.8
Control12.7811.3722.2314.70.3052834.8
SE0.880.621.010.300.0112.290.67
Pr > F
Treatment0.00710.00050.00040.16610.00110.03510.3159
PGC 25 vs. 38&51 cm 0.0003<0.0001<0.0001-<0.00010.0014-
PGC evenly spaced vs. control0.12170.00370.0082-0.02170.2699-
Alternating PGC vs. control0.00500.15510.0116-0.00540.0059-
Evenly spaced vs. alternating PGC0.98470.18050.4151-0.67060.5957-
Unverferth vs. ETS0.09330.05710.0343-0.73140.7257-
Unverferth vs. Chemical0.08990.00220.0048-0.93430.8567-
ETS vs. Chemical0.77130.00910.0766-0.62220.3830-
ETS 25 vs. 38 cm0.96300.22900.4883-0.05260.3218-
Unverferth 25 vs. 38 cm0.61510.55970.5169-0.75600.9090-
Chemical 25 vs. 51 cm0.96310.00520.0789-0.40610.5261-
Chemical vs. control0.01230.01200.0033-<0.00010.0047-
Chemical 25 vs. control0.02670.00060.0009-0.00160.0059-
Chemical 51 vs. control0.02960.42430.0735-0.00020.0271-
ETS vs. control0.0003<0.0001<0.0001-<0.00010.0068-
Unverferth vs. control0.00030.0002<0.0001-0.00020.0022-
Alternating 25 cm PGC vs. control0.18070.00590.0148 0.03760.6683
Alternating 38 cm PGC vs. control0.17530.01830.0275-0.05260.1405-
Table 7. Treatment means and significance for maize measurements including grain yield, stover yield, total aboveground biomass (TAB), rows ear−1, kernel weight, kernels per ear (KE), and kernels per row (KR) at Sorenson Research Farm in 2021. Grain yield was obtained from hand and combine harvest and expressed at 150 g kg−1 moisture content. Total aboveground biomass and stover yield are expressed on an oven-dry basis.
TreatmentGrain YieldStover
Yield
TAB Rows Ear−1Kernel WeightKEKR
____________ mg ha−1 ____________no. ear−1g kernel−1no. ear−1no. row−1
2021
ETS 25 cm 6.485.0110.5213.20.2140531.9
ETS 38 cm 8.496.0113.2313.50.2442432.7
Unverferth 25 cm 5.904.469.4712.80.2235927.4
Unverferth 38 cm 7.075.3511.3613.40.2239430.5
Chemical 25 cm 7.045.8111.8012.10.2439331.0
Chemical 51 cm 6.414.8210.2713.10.2339530.2
Alternating 25 cm 8.446.2813.4513.70.2345832.1
Alternating 38 cm 8.436.2113.3814.10.2444332.2
Control8.297.6614.7114.10.2644032.7
SE0.920.561.330.290.0232.921.60
Pr > F
Treatment0.42240.00850.04060.00020.25860.39650.3459
PGC 25 vs. 38&51 cm -0.49660.25410.0096---
PGC evenly spaced vs. control-0.00020.00420.0007---
Alternating PGC vs. control-0.03780.33520.4915---
Evenly spaced vs. alternating PGC-0.02750.01340.0005---
Unverferth vs. ETS-0.26260.18700.4101---
Unverferth vs. Chemical-0.44480.57230.0822---
ETS vs. Chemical-0.71580.44190.0132---
ETS 25 vs. 38 cm-0.19270.08510.4849---
Unverferth 25 vs. 38 cm-0.24440.22430.1422---
Chemical 25 vs. 51 cm-0.19430.32160.0152---
Chemical vs. control-0.00110.0091<0.0001---
Chemical 25 vs. control-0.01990.0657<0.0001---
Chemical 51 vs. control-0.00070.00660.0134---
ETS vs. control-0.00250.03960.0243---
Unverferth vs. control-0.00020.00280.0047---
Alternating 25 cm PGC vs. control-0.07590.41560.2926
Alternating 38 cm PGC vs. control-0.06360.39080.8935---
Table 8. Type III tests of significance for fixed sources of variation for grain yield, stover yield, total aboveground biomass (TAB), harvest index (HI), rows per ear, kernel weight, kernels per ear (KE), kernels per row (KR), and maize stand density at Sorenson Research Farm in 2020 and 2021.
Source of VariationGrain YieldStover
Yield
TAB HIRows Ear−1Kernel WeightKEKRV2 DensityR6
Density
Treatment (T)0.0207<0.0001<0.00010.64780.00060.00050.06470.14710.00530.7993
Sequence Year (Y)<0.0001<0.0001<0.00010.1891<0.0001<0.0001<0.0001<0.0001<0.00010.6110
T × Y0.64230.02520.09820.88930.01350.76700.88310.65620.11330.4769
Publisher’s Note: MDPI stays neutral with regard to jurisdictional claims in published maps and institutional affiliations.

