1. Introduction
Work zones are necessary for roadway maintenance, rehabilitation, and construction, but they often create temporary traffic conditions that differ substantially from normal roadway operations [
1]. Lane closures, roadway geometry transitions, speed reductions, and temporary traffic-control measures can reduce roadway capacity and disrupt traffic flow along affected corridors [
2]. These disruptions commonly lead to increased delay, emissions, queue formation, stop-and-go traffic, and elevated crash risk [
3]. Because work zones operate under temporary and constrained roadway conditions, they are often characterized by unstable queues, merging turbulence, and shockwave development, particularly when traffic demand approaches or exceeds the reduced capacity of the open lane [
4,
5,
6].
National crash statistics show that work zone segments experience elevated crash risk compared with non-work zone roadway sections [
7]. Rear-end crashes are especially common because work zones frequently generate sudden deceleration, speed differentials, queue spillback, and unstable merging near lane closures [
8]. However, evaluating work zone safety using historical crash records alone can be difficult because crash data are often sparse, site-specific, and affected by reporting or classification inconsistencies [
9]. For this reason, many studies have used surrogate safety indicators and traffic-instability measures to identify unsafe operating conditions before crashes occur [
10]. These indicators are particularly useful in work zones because they can capture short-term changes in speed, spacing, acceleration, braking, queue growth, and merging behavior [
11].
Traditional traffic signal control strategies are not always well suited to these temporary and unstable conditions [
12]. Pre-timed signal control relies on predetermined timing plans and therefore lacks responsiveness to rapid changes in demand, queue formation, or capacity reductions caused by work zone lane closures [
13]. Fully actuated control can respond to detector calls, but its performance may degrade under work zone conditions when detectors are misaligned, blocked, affected by lane shifts, or unable to capture queues that extend beyond the detection range [
14]. More advanced adaptive signal control systems can adjust timings in response to changing traffic conditions, but many are still designed around assumptions of relatively stable roadway geometry and recurrent traffic patterns [
15]. As a result, conventional signal control strategies may not effectively regulate inflow into a reduced-capacity work zone segment [
16,
17].
Reinforcement learning provides a promising alternative for adaptive traffic signal control because it allows an agent to learn directly from interaction with the traffic environment [
18,
19]. Early reinforcement learning applications used tabular methods such as Q-learning and SARSA, but these approaches were limited by large state-action spaces [
20]. Deep reinforcement learning addresses this limitation by using neural networks to approximate value functions in complex traffic environments [
21]. Among these methods, the Deep Q-Network is particularly suitable for isolated signalized intersection control because signal phase decisions can be represented as a discrete action space while maintaining relatively low computational complexity [
22].
Despite these advances, most reinforcement-learning-based traffic signal control studies remain primarily focused on operational efficiency measures such as delay, queue length, travel time, throughput, and average speed [
23]. Safety-related indicators are often treated as post-training evaluation measures rather than being incorporated directly into the learning process [
24]. This limitation is especially important in work zone environments, where mobility and safety are closely connected. A signal controller that improves throughput without considering spillback, stop-and-go instability, or merge conflict risk may unintentionally increase unsafe vehicle interactions near the work zone transition area. Recent safety-aware reinforcement learning studies have begun incorporating surrogate safety indicators such as Time-to-Collision, Post-Encroachment Time, and Deceleration Rate to Avoid Collision into traffic control or vehicle-control frameworks [
25]. However, many of these studies focus on freeway operations, autonomous driving, or general traffic management rather than signalized intersections operating near work zone lane closures. In addition, safety is still frequently evaluated after policy training rather than being embedded directly into the state representation and reward formulation [
26].
Motivated by these limitations, this study develops a safety-aware Deep Q-Network framework for adaptive traffic signal control at a signalized intersection operating near a work zone lane closure. The proposed framework integrates work-zone-specific safety and mobility indicators directly into both the state representation and reward function. These indicators include accumulated waiting time, work zone spillback length, average traffic speed, stop-behavior instability, merge conflict risk, and current signal phase information. The merge conflict component is formulated using relative spacing, relative speed, acceleration behavior, and interaction instability among vehicles near the work zone merge region. By penalizing spillback growth, unstable merging interactions, and stop-and-go turbulence while rewarding stable traffic movement, the controller is trained to jointly improve traffic operations and reduce safety-critical instability.
This study addresses three specific gaps in the literature. First, existing safety-aware reinforcement learning studies rely predominantly on generic surrogate measures such as Time-to-Collision or emergency braking counts and largely target freeways or autonomous driving rather than the failure modes specific to signalized work zone bottlenecks, forced merging at the lane-drop taper, queue spillback into upstream approaches, and stop-and-go turbulence within the activity area. Second, in most multi-objective formulations, the weights balancing efficiency and safety are selected ad hoc, leaving the resulting trade-off implicit and difficult to reproduce or adapt to agency priorities. Third, while reinforcement learning-based signal control has been studied extensively for recurrent congestion at conventional intersections, control of intersections operating near work zone lane closures where temporary geometry, reduced capacity, and elevated rear-end and sideswipe risk fundamentally alter the control problem has received very limited attention.
Accordingly, the contributions of this study are threefold. (1) It develops a work-zone-specific safety-aware DQN framework in which merge conflict risk, spillback propagation, and stop-behavior instability are embedded as first-class learning signals in both the state representation and the reward function, rather than serving as post-training evaluation measures; the merge conflict component, formulated from relative spacing, relative speed, and acceleration behavior in the merge region, is a surrogate indicator purpose-built for lane-drop tapers. (2) It formulates the balance between operational efficiency and safety as an explicit multi-objective problem and applies a Pareto-based procedure that samples reward-weight vectors to identify non-dominated policies, making the mobility–safety trade-off transparent and allowing practitioners to select operating points aligned with agency priorities. (3) It provides one of the first evaluations of safety-aware reinforcement learning for signal control at a work zone lane closure in which the surrogate safety indicators are specific to work zone failure modes, assessed using operational, surrogate safety, and shockwave-based measures that link the learned control behavior to the underlying traffic flow mechanisms.
2. Work Zone Modeling Framework
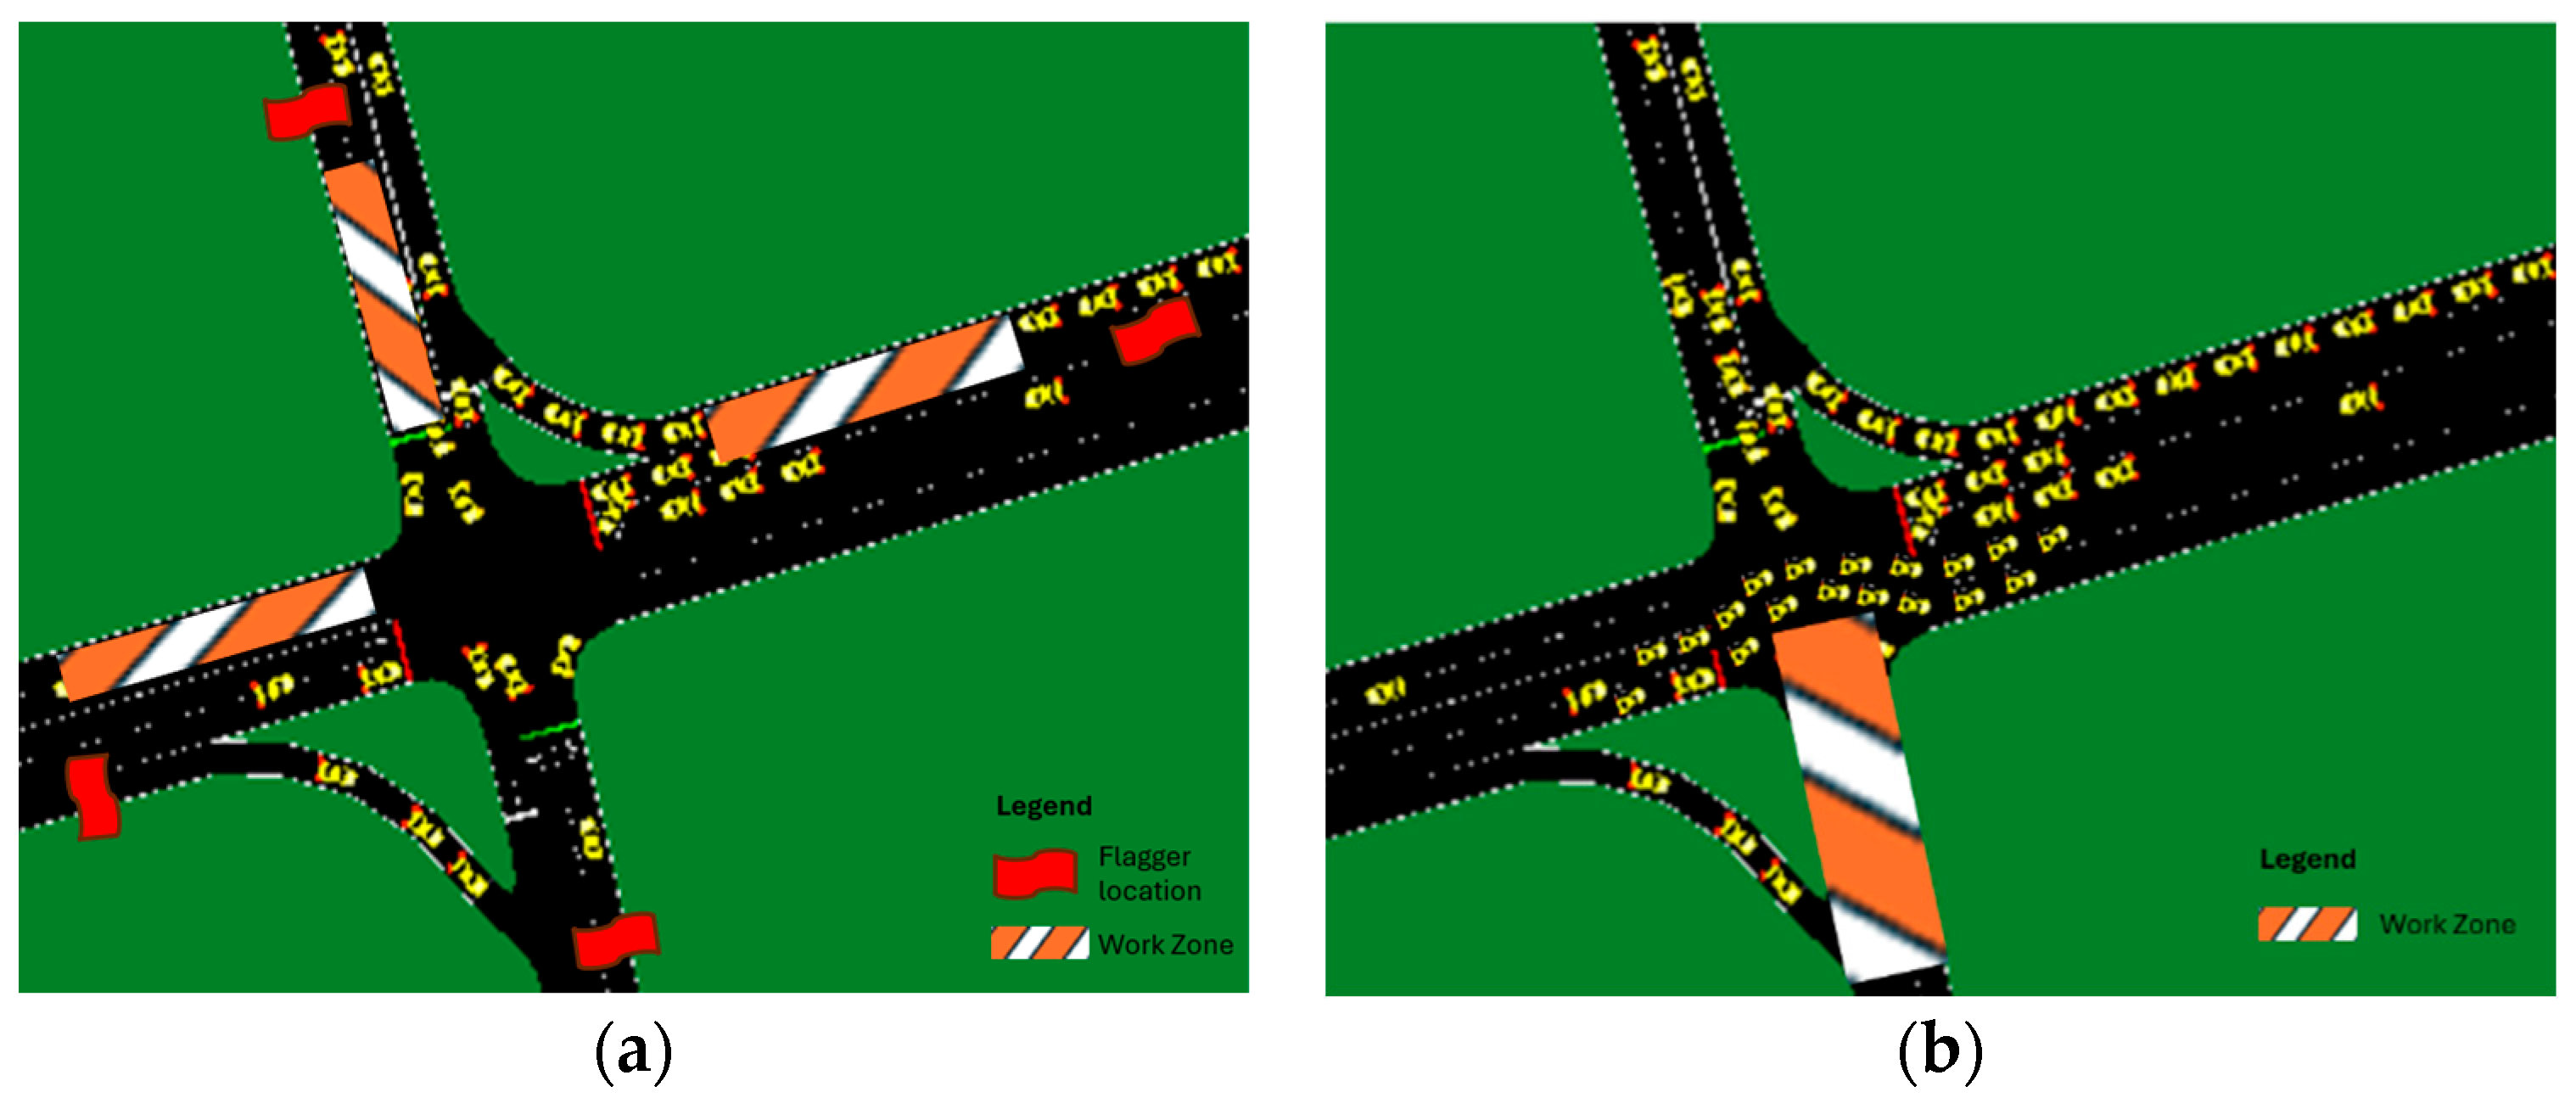
Work zones can generally be grouped into two primary operational configurations: flagging work zones and lane-closure work zones [
27]. In flagging work zones, two-way traffic is alternately controlled through a single open lane, typically under the direction of flaggers or temporary traffic-control devices [
28]. These configurations are commonly used on two-lane highways where construction or maintenance activities temporarily restrict one direction of travel. In contrast, lane-closure work zones occur on multilane facilities where one or more lanes are closed, requiring motorists to merge, shift lanes, reduce speed, or adjust their car-following behavior as they approach and travel through the activity area [
29]. As illustrated in
Figure 1, flagging operations rely on alternating directional movements, whereas lane-closure configurations often maintain simultaneous two-directional flow but introduce lane-changing and merging maneuvers that disrupt normal traffic operations.
These operational adjustments fundamentally alter roadway performance by introducing abrupt transitions that generate merging conflicts, unpredictable queues, and speed variability near the work zone entrance. Because these disruptions affect both traffic flow and crash risk, work zone performance should be evaluated from a perspective that jointly considers safety, mobility, and constructability [
30]. Safety focuses on reducing crash risk and unsafe vehicle interactions, particularly in areas where unstable merging behavior, abrupt deceleration, speed differentials, and queue propagation occur near lane closures [
31]. Several studies have shown that work zones are associated with increased crash risk and that these crashes are not uniformly distributed along roadway corridors [
32]. Consequently, surrogate safety indicators and conflict-based measures are often used to characterize unsafe traffic conditions in areas where merging turbulence, abrupt braking, and vehicle interactions are difficult to evaluate using crash data alone.
Mobility focuses on preserving efficient travel through and around the work zone by minimizing delay, stopping frequency, queue length, and spillback [
33]. Constructability ensures that construction and maintenance activities can be completed with adequate workspace for crews while minimizing disruption to traffic operations [
34]. Balancing these objectives is challenging because lane closures, reduced speeds, and temporary geometric constraints introduce uncertainty and instability into the traffic stream [
35]. These conditions often lead to congestion, long queues, merge turbulence, and an increased likelihood of rear-end and merging-related conflicts.
Several strategies have been proposed to mitigate these impacts. Work zone information systems can provide advance warning and safety information to motorists approaching the activity area, helping drivers adjust speed and lane position before reaching the bottleneck [
36]. Cooperative Intelligent Transportation Systems have also been proposed to reduce bottlenecks near work zone entrances and promote smoother vehicle movement through coordinated traffic operations [
37]. However, these strategies do not directly control signal timing at intersections affected by work zone capacity reductions. At signalized intersections affected by lane closures, the controller must not only serve competing approaches but also regulate the rate at which vehicles are discharged into the reduced-capacity segment.
To address this need, the proposed reinforcement-learning-based framework directly manages traffic movements under the capacity constraints and geometric disruptions associated with active work zones. Rather than relying on pre-programmed phase cycles or reactive detector-based logic, the RL agent continuously observes real-time traffic states, including queue spillback, traffic speed, stop-behavior instability, and merge conflict risk. Based on these observations, the agent iteratively selects signal phase actions that improve traffic operations while reducing unsafe merging interactions. Through a structured trial-and-error learning process, the agent develops adaptive signal timing strategies that minimize congestion and merge-related conflict risk, providing a more responsive and safety-aware alternative to conventional signal control methods.
Implementing this learning process directly in a real-world traffic system is impractical because the exploration phase may create safety concerns, operational disruptions, and severe congestion. Therefore, a simulation environment is required to provide a safe and controlled platform for training and evaluation. In this study, the Simulation of Urban Mobility software is used to model the work zone and provide a virtual testbed in which the RL agent can interact with realistic traffic conditions under varying demand levels and geometric configurations. This simulation environment enables repeated experimentation, controlled variation in work zone scenarios, and detailed measurement of both operational and safety-related performance metrics, including delay, queue spillback, throughput, stop instability, and merge conflict risk.
Multi-Stage Driver Behavior Before the Work Zone
To realistically model driver responses near the work zone lane closure, a multi-stage behavioral framework was implemented in SUMO based on the distance between each vehicle and the work zone barrier. Let
where
denotes the longitudinal distance between vehicle
and the work zone barrier,
is the barrier location, and
is the position of vehicle
. Vehicles entering the 200-ft queue formation region gradually decelerate to 10 ft/s to promote orderly queue development. Within the 170-ft cooperative merge region, vehicles are encouraged to perform zipper-merging maneuvers while maintaining a target speed of 20 ft/s. Vehicles remaining in the closing lane within 20 ft of the barrier are assigned a forced merge command and reduced to 10 ft/s to prevent deadlock. After passing the blockage, vehicles enter a 90-ft post-merge region where speeds are limited to 35 ft/s to represent residual congestion and shockwave effects. This framework enables realistic simulation of queue formation, cooperative merging, forced merging, and post-work zone traffic turbulence. Temporary geometric changes and fluctuating demand patterns create non-stationary traffic conditions that challenge traditional signal-control strategies [
38]. Fixed-time controllers, for example, rely on predetermined timing plans that cannot adapt to rapidly changing conditions such as sudden queue formation near the taper or unexpected surges in demand caused by lane closures [
39]. Fully actuated controllers also struggle because they depend exclusively on detector actuations, which often become unreliable in work zones due to shifted lanes, misalignment of detection zones, slow-moving queues that mimic gaps, or vehicles traveling outside normal detection paths [
40]. As a result, actuated controllers may terminate phases prematurely, extend phases unnecessarily, or fail to regulate inflow into a reduced-capacity zone [
41]. Most critically, these conventional control strategies optimize primarily for mobility and do not incorporate safety-related indicators such as TTC, speed variance, shockwave development, or turbulence in merging areas [
42]. Studies have emphasized that traditional signal strategies cannot adapt to sudden work zone turbulence and consistently overlook real-time safety indicators such as potential spillback or rapidly deteriorating speed conditions [
43]. Given that work zones introduce operational disruptions and traditional signal-control systems cannot effectively manage the resulting instabilities, a reinforcement-learning with a safety-aware learning objective based adaptive signal control system provides a promising alternative for improving work zone performance [
44]. The next section presents the architecture of the RL framework and describes how it is integrated within the SUMO microsimulation environment to evaluate its effectiveness under realistic work zone conditions.
3. Reinforcement Learning
Reinforcement learning is a trial-and-error learning framework in which an agent interacts with an environment and learns to make decisions by receiving rewards or penalties based on its actions [
45]. Traditional reinforcement learning methods often struggle in complex environments because of large state-action spaces and high-dimensional data [
46]. To address these limitations, Deep Reinforcement Learning (DRL) was introduced by integrating traditional reinforcement learning with deep neural networks to approximate complex nonlinear relationships between dynamic environments and control actions [
47]. In this study, a DQN framework was used to approximate the optimal action-value function
[
48]. The DQN consists of an online Q-network for learning and action selection, and a target Q-network that stabilizes training by periodically updating the target values [
49]. The network architecture contains fully connected hidden layers and ReLU activation functions, followed by an output layer corresponding to the discrete signal-control action space [
50]. The network learns by minimizing the temporal-difference loss between predicted Q-values and Bellman target values [
51]. To improve training stability, experience replay is used, where traffic interactions are stored in a replay memory and randomly sampled during training [
52]. This approach enables the model to learn stable and efficient traffic signal control policies under dynamic work zone traffic conditions [
53]. In this study, the proposed Deep Q-Network (DQN) employs a fully connected feed-forward neural network consisting of two hidden layers with 128 neurons each and Rectified Linear Unit (ReLU) activation functions. The input layer receives the state vector comprising accumulated waiting time, work zone spillback length, average traffic speed, stop-behavior instability, merge conflict risk, and current signal phase information. The output layer contains two neurons corresponding to the available signal-control actions: maintaining the current signal phase or switching to the next phase.
3.1. State Representation
The state space
represents the current traffic condition of the work zone at time
, including the key traffic features required for adaptive signal control and merge-risk evaluation [
54]. The state space is composed of traffic operational variables, merge instability indicators, and signal phase information, as given in Equation (2).
where
represents the accumulated waiting time,
is the upstream work zone queue spillback length,
denotes the average traffic speed,
represents the stop-behavior instability term,
is the merge conflict risk, and
represents the current signal phase. The three surrogate safety indicators spillback length, merge conflict risk, and stop-behavior instability appear in both the state representation and the reward function of Equation (4). Accumulated waiting time and the current signal phase are included in the state as contextual inputs to the policy but are not penalized directly in the reward since their operational effects are captured through the spillback and speed terms.
The state transition process is represented as [
55]
where
denotes the signal control action selected by the DQN agent at time
. The traffic environment evolves dynamically based on the selected signal phase and prevailing traffic conditions [
56]. The accumulated waiting time
acts as a congestion indicator representing vehicle delay within the network. The spillback term
captures upstream queue propagation caused by the work zone lane closure and reflects the severity of congestion near the blocked section. The average speed
represents the overall traffic mobility condition within the corridor. The stop-behavior instability term
captures stop-and-go traffic conditions generated by repeated vehicle stopping and low-speed operations near the merge region [
57]. The merge conflict risk term
represents the interaction instability between merging vehicles and surrounding traffic using relative spacing, relative speed, and acceleration behavior [
58]. This term allows the model to represent unsafe merging conditions within the work zone. The signal phase variable
provides the current intersection control state and enables the agent to learn phase-dependent traffic dynamics during training. The selected state variables provide a compact representation of both operational efficiency and merging safety while maintaining a manageable state dimension for stable DQN training. The state variables, their sources, normalization methods, and corresponding roles in the proposed DQN framework are summarized in
Table 1.
3.2. Action Definition and Strategy
The action space of the proposed reinforcement learning agent consists of selecting the active traffic signal phase at the controlled intersection [
59]. Let
denote the set of all signal phases, where
is the total number of feasible phases. At each decision time step
, the agent selects an action
, which corresponds to activating a particular green phase that serves a specific set of traffic movements. The decision interval is defined by
seconds [
60]. If the agent repeatedly selects the same action in successive decision steps, the current green phase is extended by another
seconds. Conversely, if a different action is selected, the environment automatically initiates a yellow transition period before switching to the new green phase [
61]. Consequently, the agent does not explicitly set the green duration; instead, it implicitly learns the optimal green time allocation by deciding whether to maintain or change the active phase based on prevailing traffic conditions [
62]. Control decisions are taken at fixed intervals of Δt = 5 s, subject to the minimum green constraint.
3.3. Reward Definition
The reward function
guides the DQN agent in selecting signal control actions that improve traffic operations and reduce unsafe merging interactions within the work zone environment [
63]. The reward function is designed to minimize upstream spillback, reduce merge conflict risk, suppress stop-and-go instability, and maintain stable traffic flow through the work zone corridor [
64]. The reward at time
is given in Equation (4).
where
represents the normalized upstream work zone spillback length,
represents the merge conflict risk,
represents stop-and-go instability, and
represents the normalized average traffic speed. The parameters
,
,
, and
are tunable weights controlling the relative importance of each objective [
65].
The spillback term penalizes excessive upstream queue propagation toward the work zone blockage [
66]. The stop-behavior instability term captures unstable stop-and-go conditions caused by repeated vehicle stopping and low-speed operations near the merge region [
67]. The speed term rewards sustained traffic through the work zone corridor. The merge conflict risk term is based on the interaction instability between merging vehicles and surrounding traffic [
68]. The framework evaluates vehicle interactions using relative spacing, relative speed, and acceleration behavior between surrounding vehicles to characterize unsafe merging conditions [
69]. Four interaction scenarios are considered, including conflicts with the preceding vehicle in the closing lane, the following vehicle in the closing lane, the leading vehicle in the open target lane, and the lagging vehicle in the open target lane [
70]. The conflict probability associated with each interaction is represented by
, while
denotes the Merge Instability Time for interaction scenario
. Smaller MIT values indicate more unstable vehicle interactions and produce larger conflict probabilities [
71]. In the work zone environment,
represents the spacing distance between the subject merging vehicle and the surrounding interacting vehicle involved in interaction scenario
.
These four components were selected because each maps directly onto a documented work zone failure mode rather than a generic efficiency objective. The spillback term captures upstream blocking and rear-end crash exposure at the back of the queue; the merge conflict term captures sideswipe and forced-merge risk at the lane-drop taper; the stop-and-go instability term captures the oscillatory conditions associated with rear-end crashes in activity areas; and the normalized speed term serves as a compact operational proxy for corridor performance. Commonly used alternatives were considered but not adopted as separate reward terms for the following reasons. Delay and travel time are strongly and inversely correlated with average speed in a single-intersection lane-drop network, so including them alongside the speed term would introduce redundant, collinear signals without adding new information to the learning process; delay and travel time are instead retained as independent evaluation metrics. Pressure-based rewards, as used in Max Pressure-style formulations, are designed to balance flows across multiple coordinated intersections and lose much of their theoretical motivation at an isolated intersection where the binding constraint is the reduced capacity of the work zone taper rather than inter-intersection flow balance. The adopted formulation therefore prioritizes reward components that are (i) directly observable from the state representation, (ii) non-redundant with one another, and (iii) specific to the safety-critical dynamics of work zone operations.
3.4. Pareto Weight and Policy Evaluation
Although scalarization enables the application of standard DQN training, the traffic signal control problem remains inherently multi-objective [
72]. Different Pareto weight vectors w induces different trade-offs between efficiency and safety objectives and therefore lead to qualitatively different policies [
73]. During training, a set of weight vectors is randomly sampled and used to scalarize the four objectives of Equation (4)—work zone spillback length, merge conflict risk, stop-behavior instability, and average speed—into a single scalar reward [
74]. Rather than manually selecting a single weight configuration, multiple weight vectors
are sampled to systematically explore the trade-off surface [
75]. Specifically, each weight vector
w =
(α,
β,
γ,
δ) is four-dimensional, with one weight for each objective of Equation (4). Weight vectors were drawn independently and uniformly at random from the four-dimensional unit simplex so that all four components are non-negative and sum to one. Sampling from the simplex rather than from an unconstrained box ensures that the scalarized reward remains on a common scale across configurations and that no configuration can be obtained from another by a simple rescaling. A total of 20 weight vectors were drawn in this way, and an independent policy was trained for each under identical network architecture, state representation, training budget, and random seed so that differences between the resulting policies are attributable to the weight vector alone. The same set of 20 weight vectors and the resulting Pareto-optimal subset were used unchanged for every comparison reported in this paper; no re-sampling was performed between experiments.
For each sampled vector, an independent DQN policy
is trained using the corresponding scalarized reward [
76]. After training, each objective vector for a policy is evaluated using multiple separate performance metrics (delay, speed, safety, etc.), forming a vector that captures trade-offs as shown in Equation (5).
The objective vector evaluated for each policy comprises the same four quantities that define the reward in Equation (4): the work zone spillback length L, the merge conflict risk C, the stop-behavior instability S, and the average speed V, with the speed term negated so that all four objectives are expressed in minimization form as required by the dominance relations in Equations (6) and (7). No additional evaluation axes are introduced, so that the Pareto front is defined over exactly the quantities the controller is trained to optimize.
Instead of using one combined value, the analysis looks at all the objectives separately [
77]. This is because a single combined value depends on how the weights are chosen, and different weights can make results hard to compare [
78]. By looking at each objective individually, it becomes easier to understand the real trade-offs, such as the balance between speed, delay, and safety [
79]. Pareto dominance is defined as a policy
which is said to dominate another policy
if
And
after converting maximization objectives into equivalent minimization form. The Pareto-optimal set (P) is then defined as
where no other policy dominates any member of
.
This set in the objective space forms the Pareto front, which consists of non-dominated traffic signal control policies, where each policy represents a different balance between efficiency and safety [
80]. Instead of relying on manually chosen reward weights, the proposed approach clearly shows how improving one objective may affect others. This makes it easier to understand the trade-offs and allows decision-makers to choose a policy based on specific needs, such as improving safety near work zones or increasing traffic flow during congestion. Algorithm 1 presents the pseudocode for the proposed Pareto-based DQN training algorithm implemented in this study.
| Algorithm 1. Pareto—Based DQN Training for Safety—Aware Work zone Signal Control |
| Input: |
| Set of Pareto weight vectors W |
| Replay memory capacity N |
| Target update interval C |
| Episodes M, steps per episode T |
| Discount factor γ, exploration rate ε |
| Output: |
| Set of trained policies Π |
| Pareto-optimal policy set |
| For each weight vector wi ∈ W do |
| Initialize replay memory D with capacity N |
| Initialize Q—network (s, a; θ) |
| Initialize target network (s, a; θ−), where θ− = θ |
| For episode = 1 to M do |
| Reset the work—zone simulation environment |
| Observe initial state s1 |
| Preprocess state ϕ1 = ϕ(s1) |
| For t = 1 to T do |
| Select action a using ε—greedy policy |
| Execute action a |
| Observe next |
| Measure traffic performance vector m: |
| spillback length, merge conflict risk, stop-behavior instability, average speed |
| Compute scalarized reward: |
| r = wi · m |
| Preprocess next state: |
| ϕt+1 = ϕ( ) |
| Store transition: |
| (ϕ, a, r, ) in D |
| Sample minibatch from D |
| Compute target value: |
| yj = rj + γ maxa ′ Q (ϕj+1, a′; θ−) |
| Update Q—network by minimizing loss |
| Every C step: |
| θ−← θ |
| Set: |
| ϕ ← |
| End for |
| End for |
| Save trained policy πi |
| End For |
| Evaluate all trained policies Π |
| Identify Pareto—optimal policy set P |
| Return Π and P |
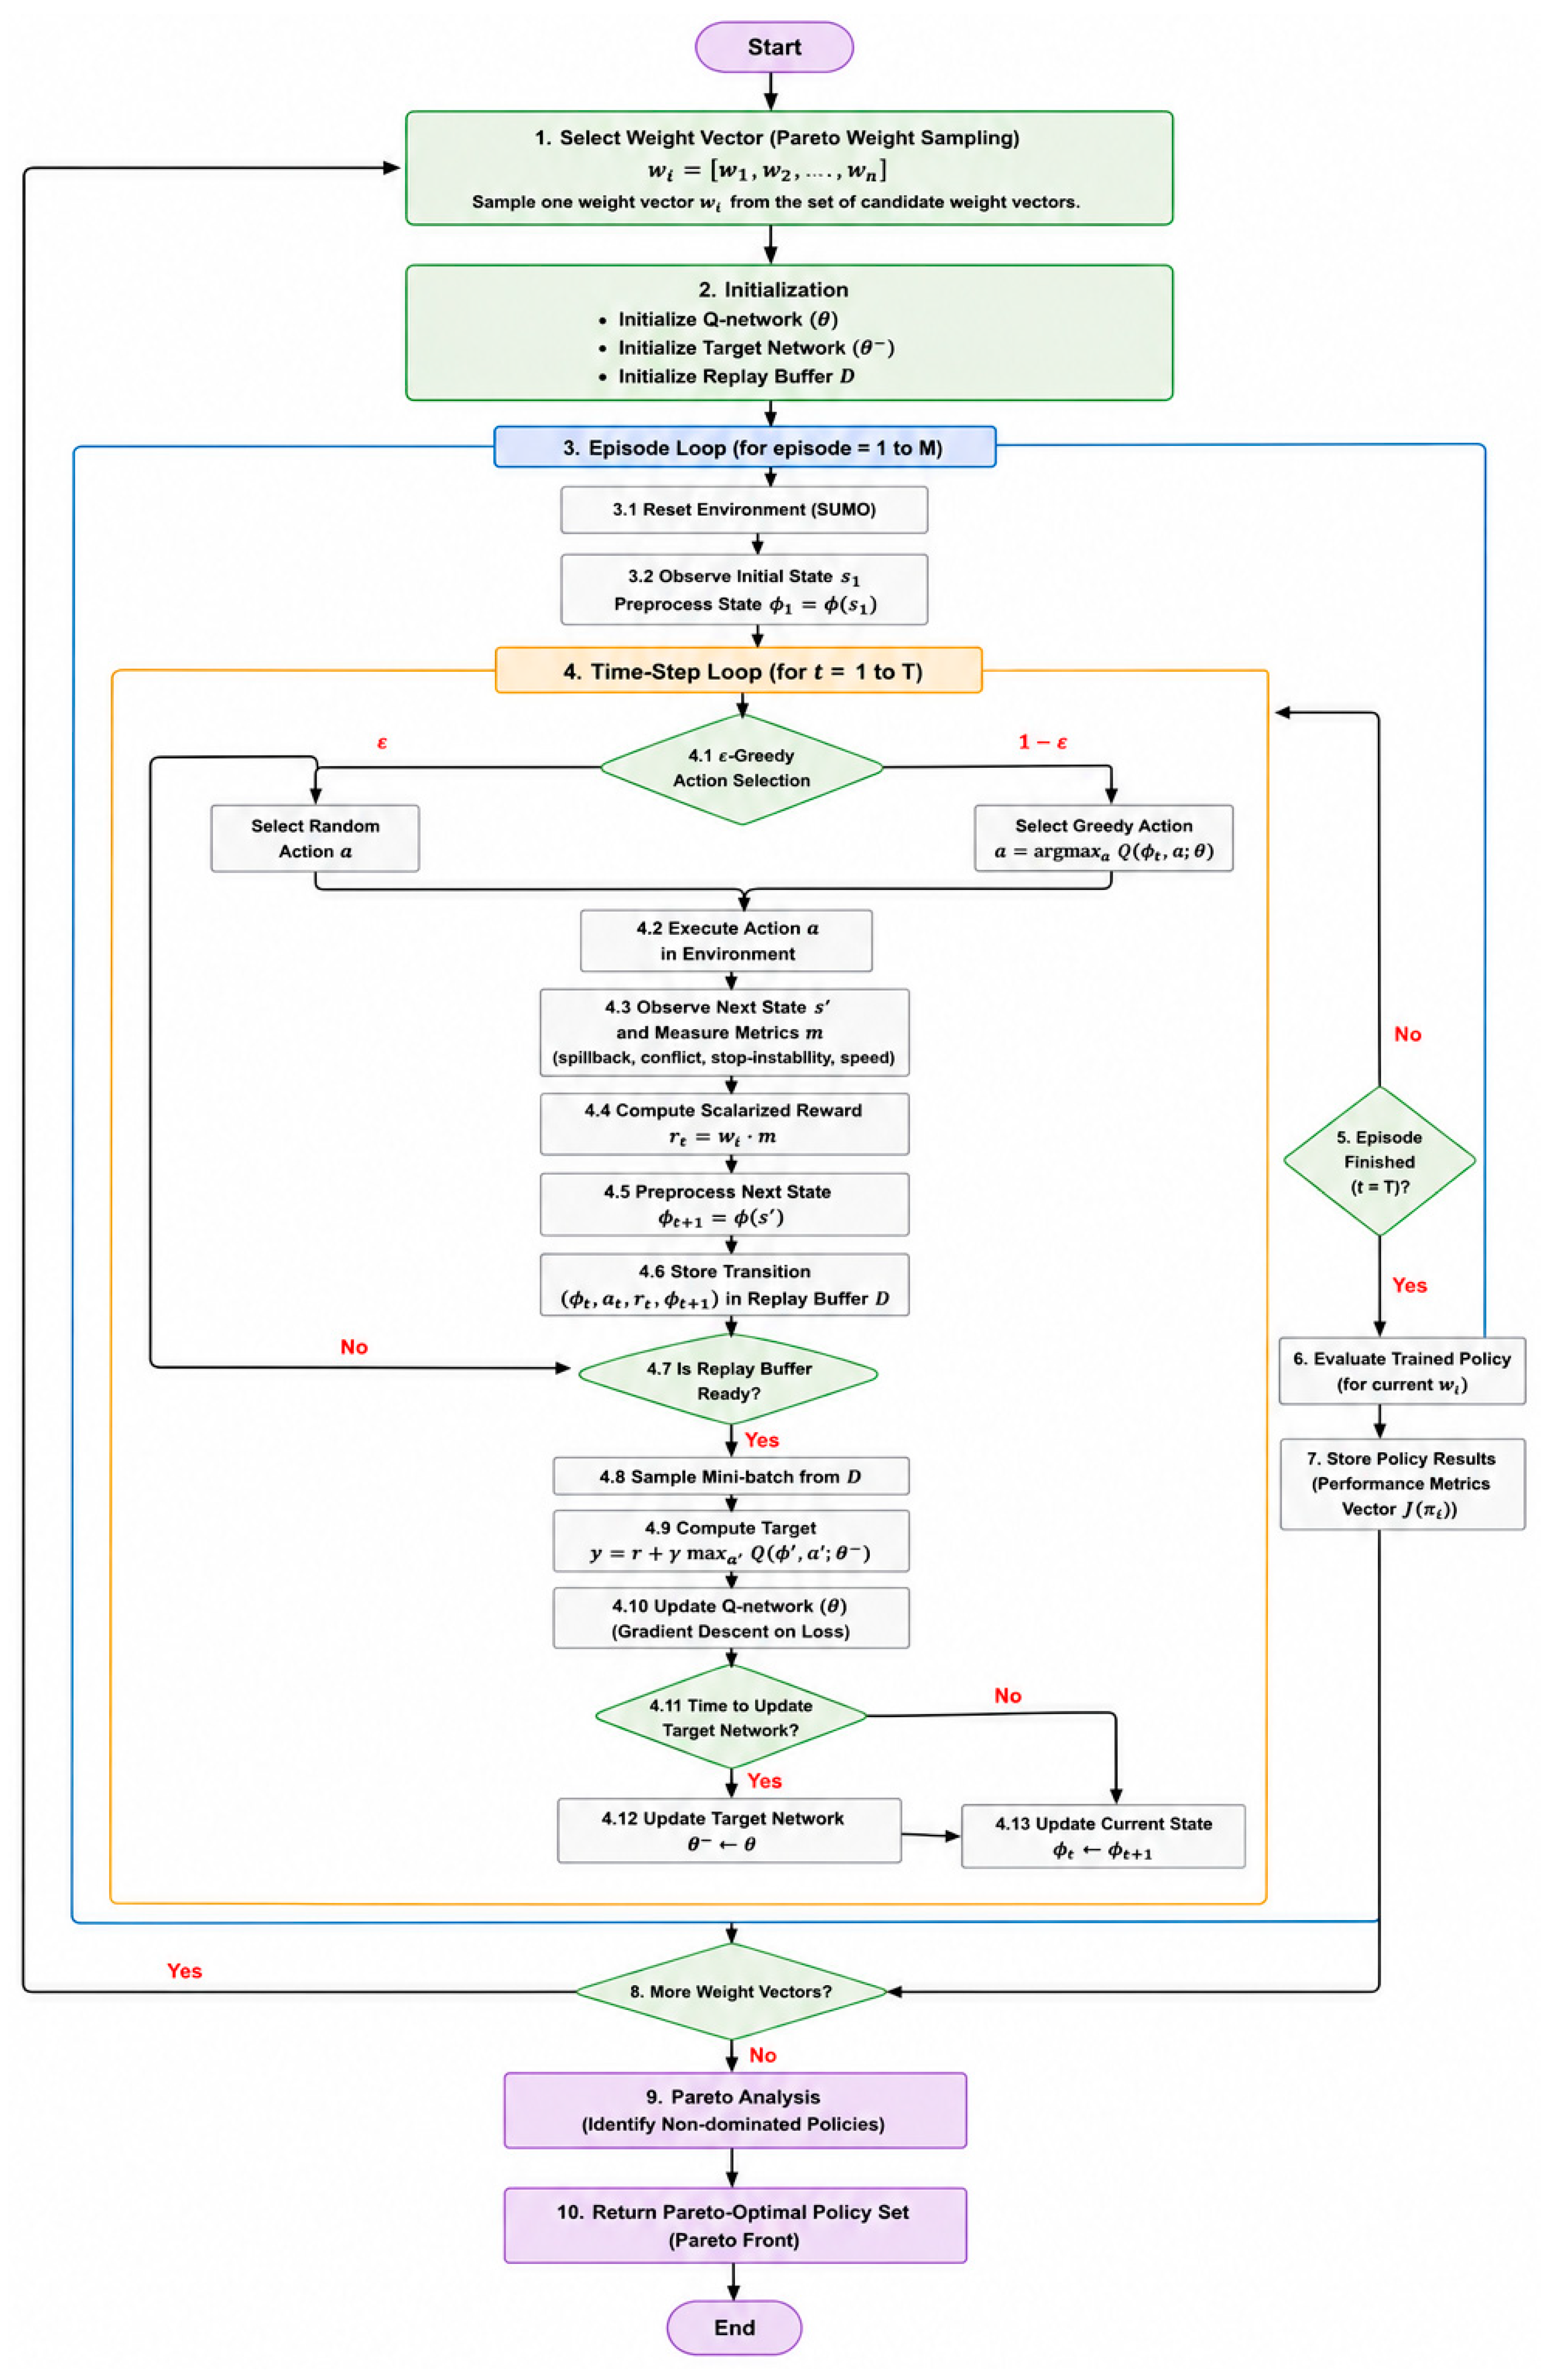
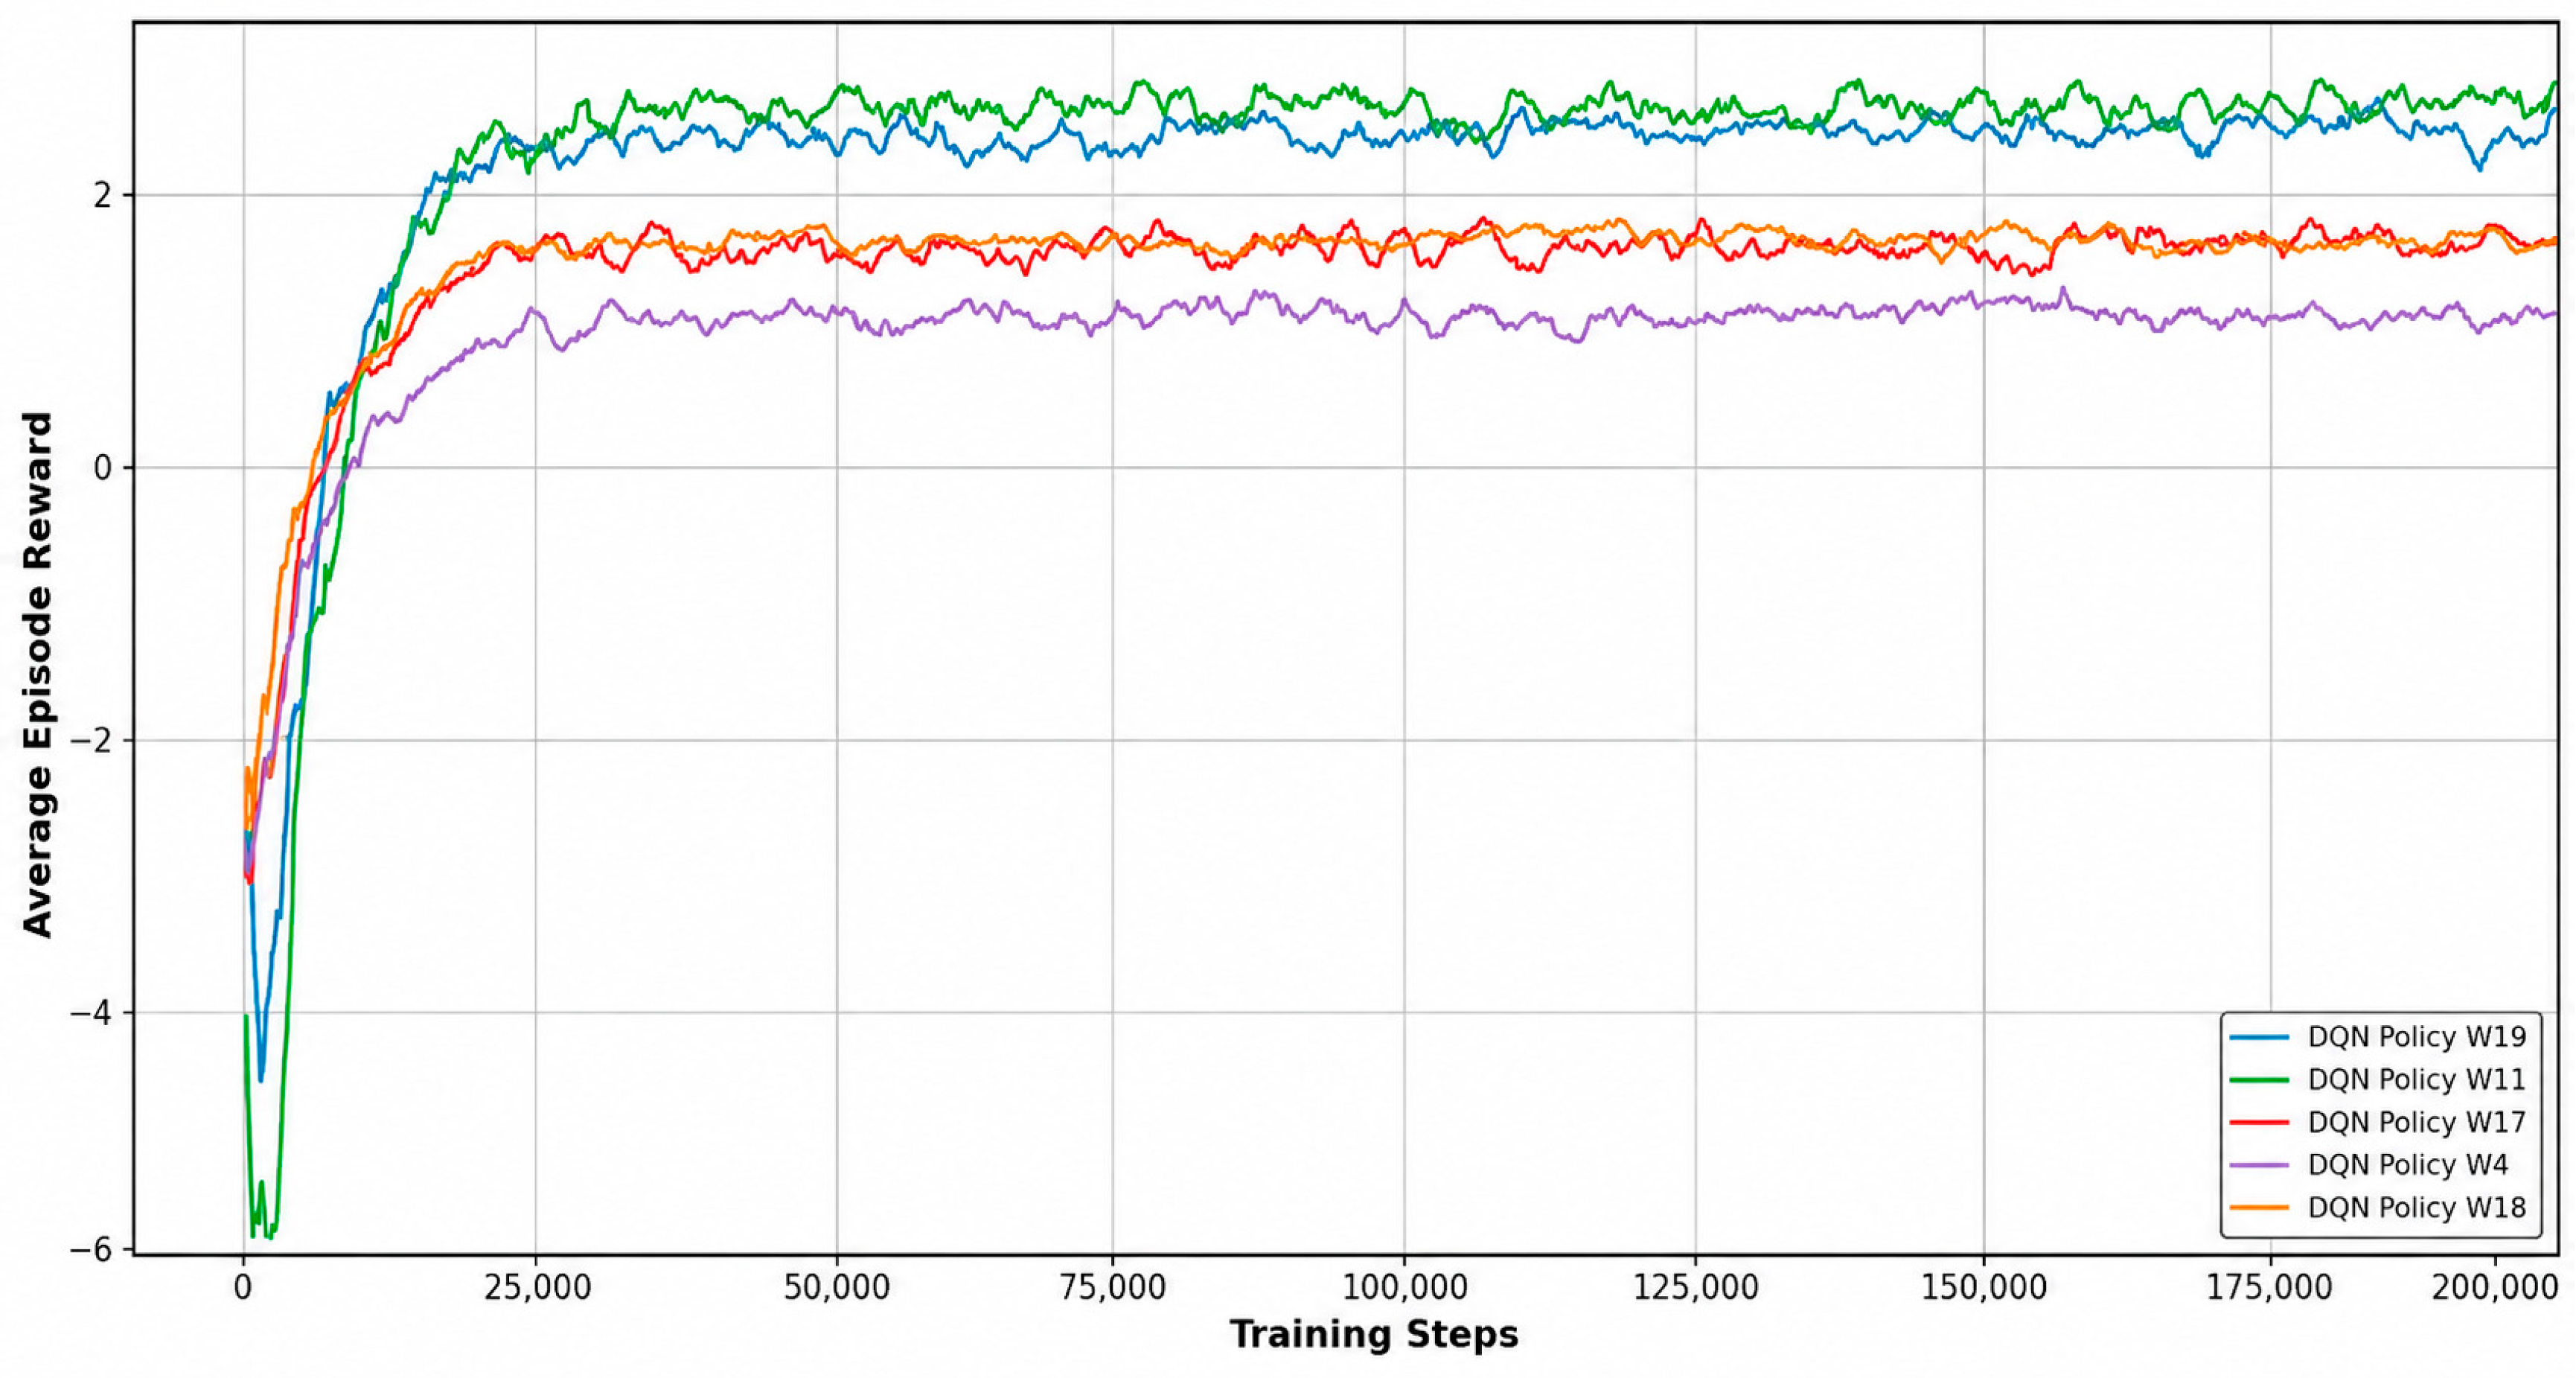
Figure 2 presents the overall training framework of the proposed Pareto-based Deep Q-Network (DQN) adaptive signal control system for work zone traffic management. The framework begins by iterating through different reward-weight vectors to represent varying operational and safety preferences within the multi-objective optimization process. For each weight vector, the DQN environment is initialized with the online Q-network, target network, and replay memory buffer. At the beginning of each training episode, the traffic state
is initialized and the agent continuously interacts with the SUMO traffic environment over multiple time steps. At each decision step, the agent selects an action using the ε-greedy exploration strategy. With probability
, a random action is selected to encourage exploration, while with probability
, the action with the maximum estimated Q-value is selected using the online network. The selected signal control action is then executed within the traffic environment, after which the agent observes the next traffic state and computes the reward based on the proposed multi-objective reward formulation. The transition
is subsequently stored in the replay memory buffer. Once sufficient experiences are collected, random mini-batches are sampled from the replay memory to train the online Q-network. The target Q-values are computed using the target network, and the temporal-difference loss is minimized to update the online network parameters. Periodically, the target network parameters are synchronized with the online network to stabilize training and reduce oscillatory learning behavior.
After completing all training episodes for a particular reward-weight configuration, the trained policy performance is evaluated and stored. The framework then proceeds to the next reward-weight vector until all candidate policies are generated. Finally, Pareto analysis is performed on the trained policies to identify non-dominated solutions that provide balanced trade-offs between work zone spillback mitigation, merge conflict reduction, stop-behavior stability, and traffic mobility performance.
3.5. Shockwave Analysis
Shockwave theory provides a macroscopic framework for analyzing the formation, propagation, and dissipation of traffic congestion along a roadway segment [
81]. In work zone environments, temporary lane closures and reduced roadway capacity often create abrupt traffic disturbances that generate congestion waves and upstream queue propagation [
82]. These traffic shockwaves can be represented using the Rankine–Hugoniot condition, which defines the shockwave speed as
Equation (9) is presented as the theoretical basis for interpreting the wave speeds reported in this study. The values themselves are not obtained by estimating flow and density; they are measured directly from the simulated vehicle trajectories. At each simulation step, the position of the queue tail x_tail is determined as defined in Equation (11), namely the most upstream vehicle whose speed falls below the queued-vehicle threshold. Two traffic states are then identified within each signal cycle: a queue formation state, beginning when the queue tail first advances upstream after the onset of the red interval, and a queue dissipation state, beginning when the queue tail first recedes downstream after the onset of green. For each state, the wave speed is computed as the rate of change in the queue tail position over the duration of that state, w = Δx_tail/Δt, which corresponds to the wave speed defined by Equation (9) for the same pair of traffic states, measured geometrically rather than through separate estimation of flow and density.
Cycle-level wave speeds are averaged across all cycles within an episode and then across the 50 evaluation episodes, and the reported values are these episode-averaged means. By convention, negative values denote waves propagating upstream, so both the formation and the dissipation waves carry negative speeds. The two rows should therefore be read in opposite directions: for the queue formation wave, a smaller magnitude is preferable, indicating slower upstream propagation of congestion, whereas for the dissipation wave, a larger magnitude is preferable, indicating that the queue clears more rapidly once vehicles are released. The percentage differences are computed on the magnitudes of these speeds and are expressed so that a positive percentage always denotes an improvement.
3.6. Data Preprocessing
The proposed reinforcement-learning framework was trained and evaluated using traffic states generated within the SUMO microscopic traffic simulation environment. The simulated network represents a signalized urban intersection operating under work zone lane-closure conditions. Traffic measurements, including vehicle counts, average speed, queue length, accumulated waiting time, spillback length, and signal phase status, were collected through the TraCI interface at one-second intervals during each simulation episode.
Prior to training, continuous traffic variables were normalized using min-max scaling to improve numerical stability and prevent feature dominance within the learning process. Average speed was normalized relative to the free-flow speed, while signal phase information was encoded using one-hot representation. State variables including accumulated waiting time, upstream spillback length, average speed, stop-behavior instability, and merge conflict risk were extracted from the simulated traffic stream. The spillback metric was derived from upstream queue propagation near the lane closure, while stop-behavior instability was estimated using stopped-vehicle counts and lane-average speed conditions. Merge conflict risk was computed from relative spacing, relative speed, and acceleration characteristics of vehicles within the work zone merge area.
Exploratory analysis of the simulated traffic states was conducted to evaluate congestion formation, queue propagation, speed variation, and stop-and-go behavior under different demand conditions. These variables were subsequently integrated into a compact state-space representation that captures both operational efficiency and safety-related traffic dynamics. The resulting state representation provides the input to the DQN agent for adaptive signal-control decision-making under dynamic work zone conditions.
3.7. Simulation Experiments
3.7.1. Study Network and Work Zone Configuration
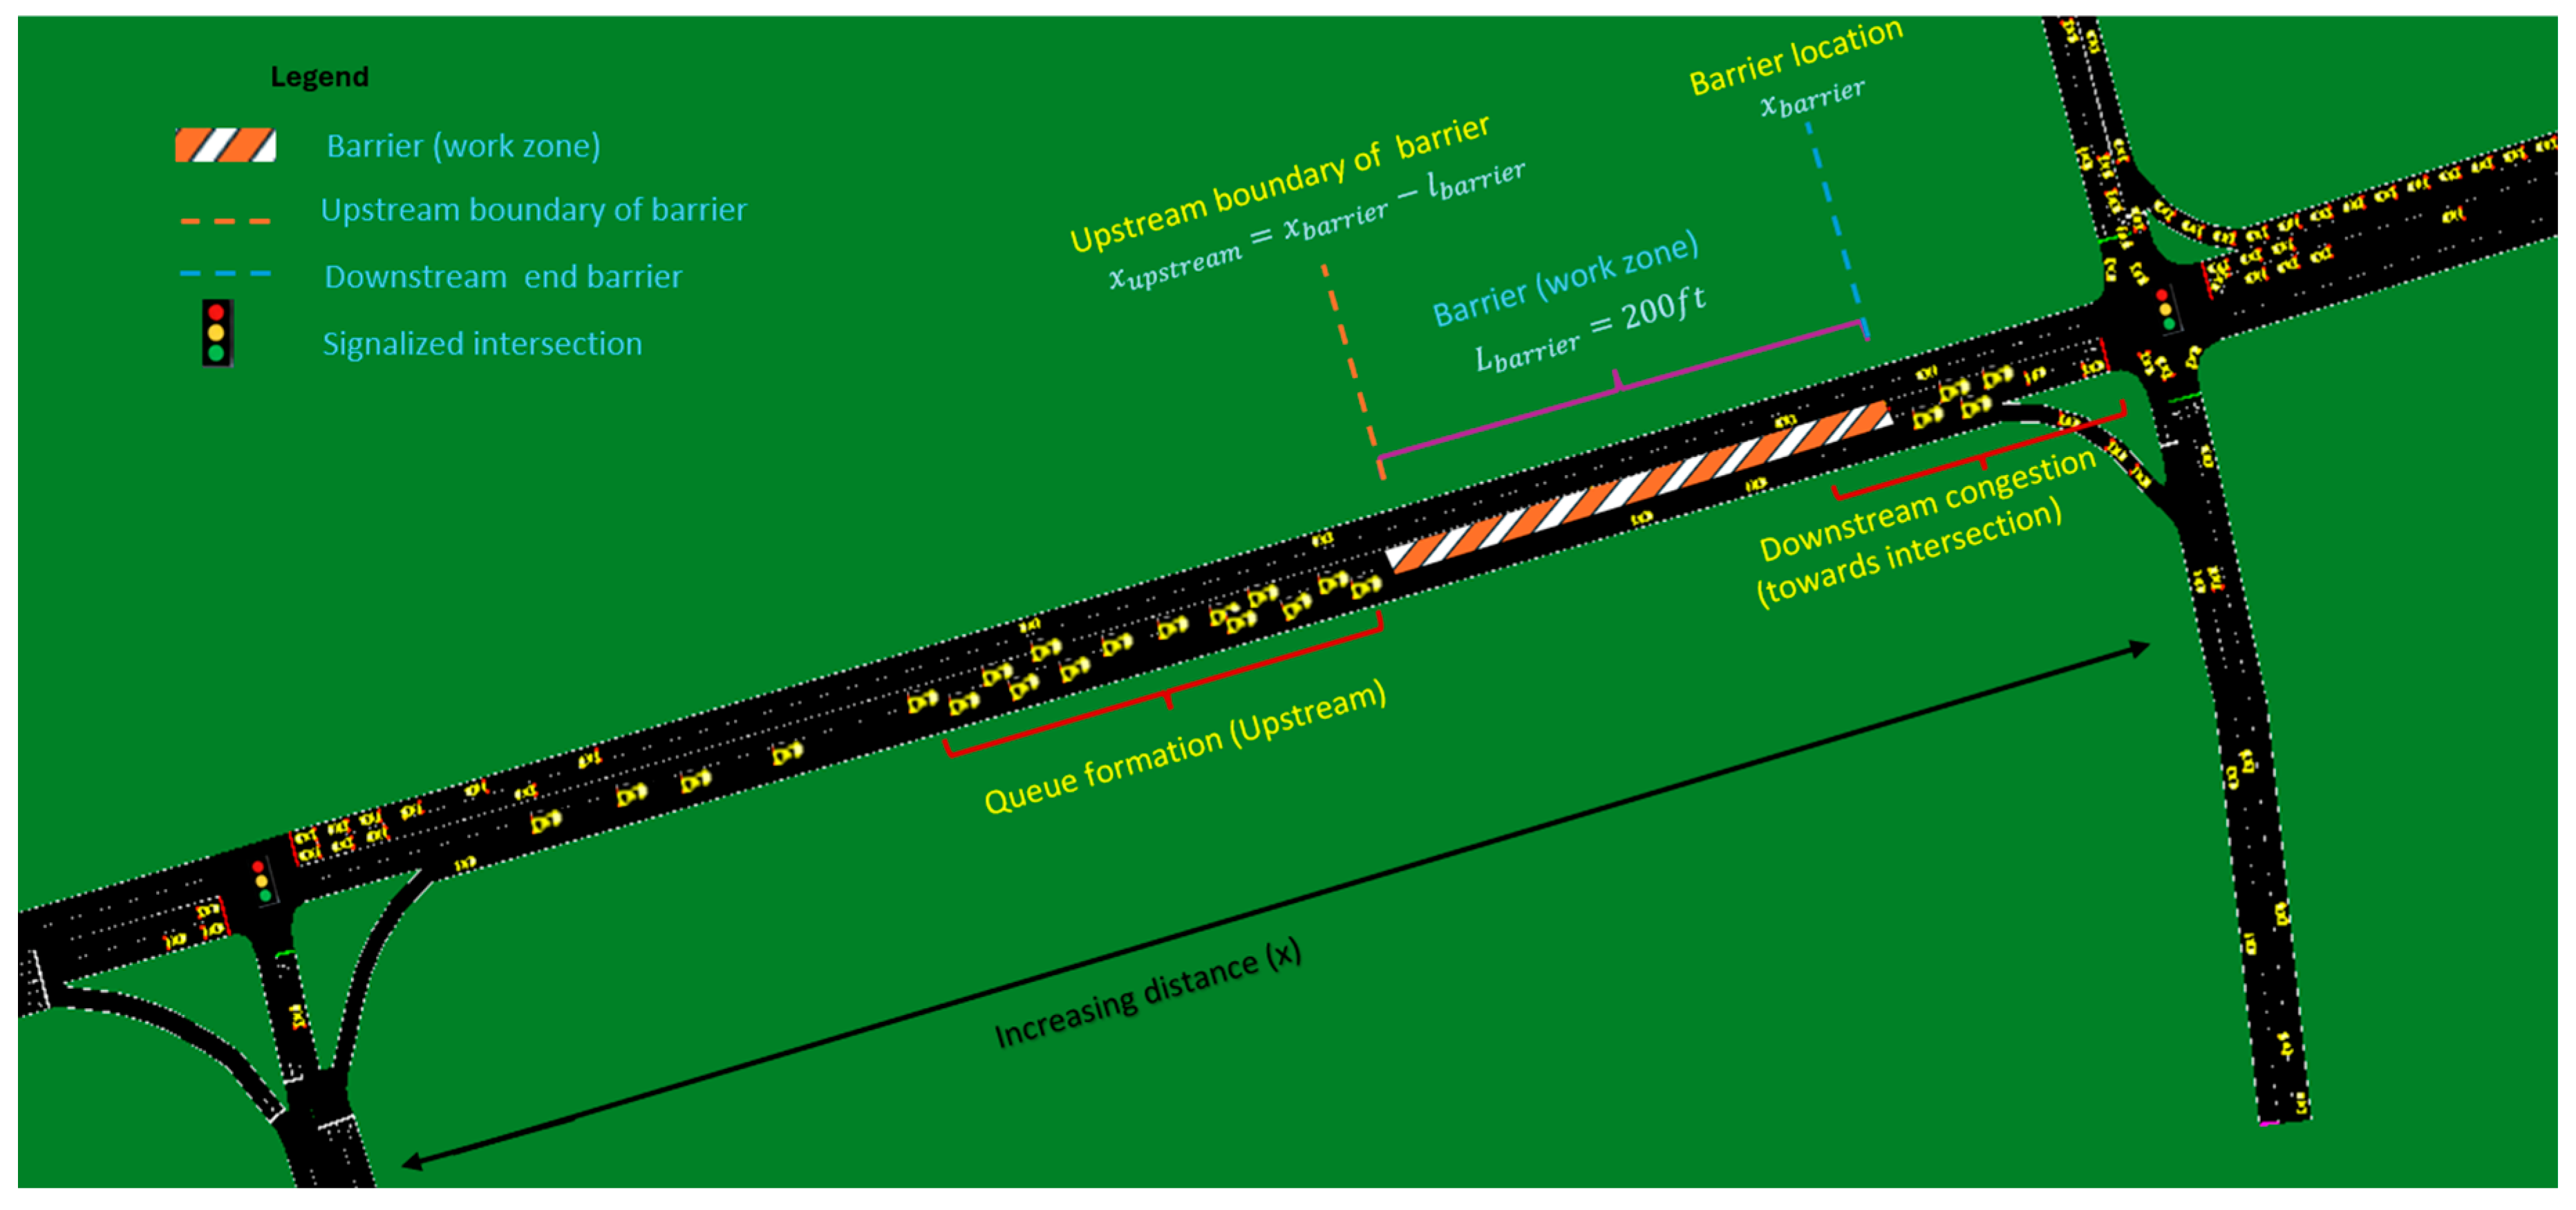
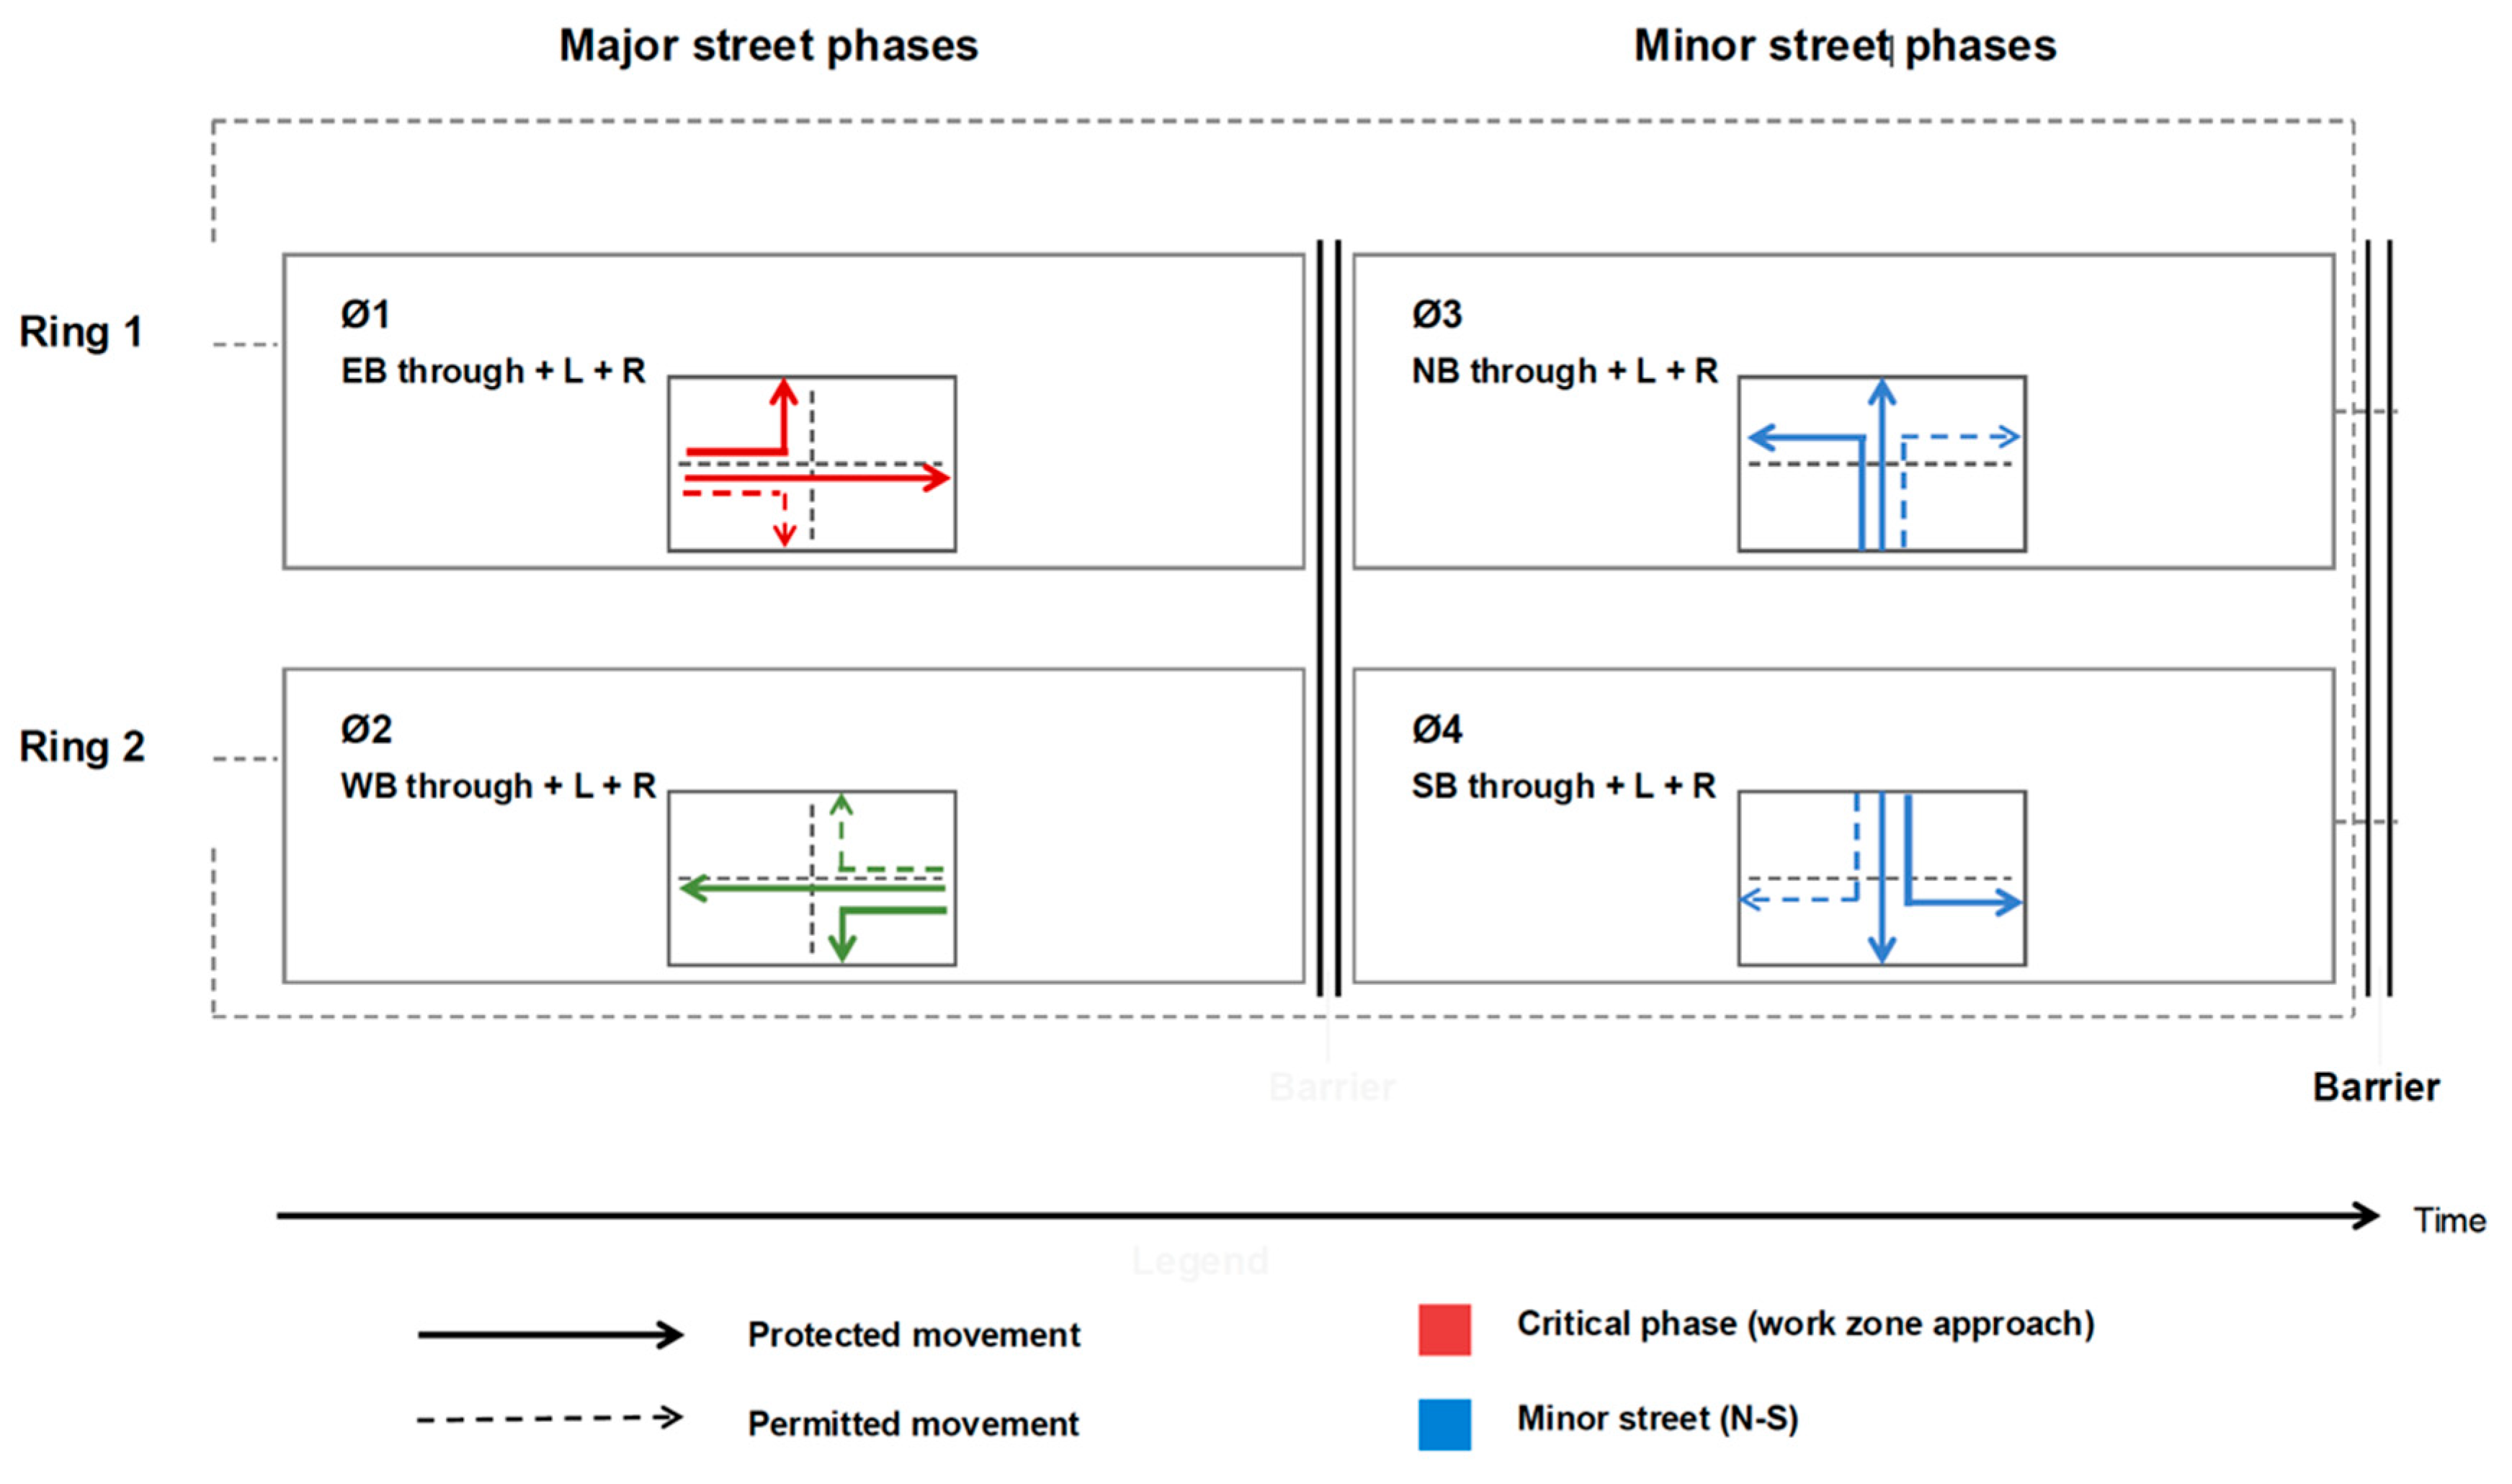
The study network comprises two signalized four-leg intersections in series, denoted A and B, each with two through lanes per approach and a posted speed limit of 55 mph. Intersection A lies upstream and operates under control throughout, held unchanged across all scenarios and all evaluated controllers. Intersection B lies downstream, immediately adjacent to the work zone, and is the intersection placed under reinforcement learning control. A work zone lane closure was introduced approximately 200 ft upstream of intersection B, reducing roadway capacity from two lanes to one lane within the affected segment. Because intersection A is held under identical control in every scenario, it forms part of the shared environment rather than a source of difference between the controllers compared in this study; its effect is to deliver partially platooned arrivals to intersection B rather than raw demand. Intersection B operates under a four-phase split-phasing scheme to accommodate the reduced roadway capacity introduced by the work zone bottleneck on the eastbound (EB) approach. Each phase exclusively serves all traffic movements (through, left-turn, and right-turn) for a single approach: Phase 1 serves eastbound (EB), Phase 2 serves westbound (WB), Phase 3 serves northbound (NB), and Phase 4 serves southbound (SB). Split phasing was adopted instead of the conventional concurrent EB–WB operation because the 200-ft work zone barrier (
) significantly reduces the available lane capacity through the bottleneck segment. Under these constrained conditions, simultaneous opposing through movements cannot be safely accommodated without introducing operational conflicts and unstable merging interactions near the work zone transition area. Split phasing is acknowledged to be less efficient than concurrent operation at conventional intersections, and it was adopted here for site-specific reasons rather than for efficiency. The lane closure removes one of the two eastbound through lanes so that eastbound traffic must discharge through a single lane whose alignment is offset from the receiving lane beyond the intersection, and the taper and activity area occupy the approach immediately upstream of the stop bar, restricting sight distance for opposing turning movements. The same phasing is applied to the fixed-time baseline, the actuated baseline, and the learning agent, so it cannot account for differences between them; it does, however, bound the performance attainable by all controllers, and evaluating the framework under concurrent phasing is identified as future work. The study network and work zone bottleneck configuration are illustrated in
Figure 3, while the corresponding signal phase sequence and movement configuration are presented in
Figure 4.
Table 2 presents the phase sequence and timing parameters of the default fixed-time controller used as the baseline for evaluating the proposed adaptive DQN controller.
The phase duration includes the green, yellow-change, and all-red clearance intervals. The default fixed-time controller followed the sequence Phase 1 → Phase 2 → Phase 3 → Phase 4, producing a total cycle length of 120 s.
To represent work zone conditions within the simulation framework, a structured modeling approach is adopted in which roadway disruptions are introduced as controlled obstructions within the traffic stream. The architecture is designed to capture key operational phenomena associated with work zones, including queue formation, speed adaptation, merging behavior, and downstream congestion propagation. Within this framework, a barrier is introduced to emulate the effects of construction activity or lane closure. The barrier is positioned at a fixed location
and remains active throughout the simulation horizon. It has an effective length of
, representing the spatial footprint of the work zone. This obstruction modifies vehicle behavior upstream and downstream, triggering gradual speed reduction, cooperative merging, and congestion buildup as vehicles approach the intersection. The upstream boundary of the barrier is defined as
This formulation allows the obstruction region to be explicitly defined along the road with marking the upstream limit and marking the downstream limit of the blocked segment.
At each iteration, the simulation evaluates all vehicles approaching the blocked lane. The queue tail position,
, is defined as
where
and
denote the position and speed of vehicle
, respectively, and
is a predefined speed threshold used to identify queued vehicles. The condition
ensures that only vehicles upstream of the barrier are considered. The minimum operator selects the smallest position value, corresponding to the most upstream vehicle in the queue. Therefore,
represents the upstream extent of the queue and provides a dynamic measure of queue growth, which can be used to quantify congestion severity around the work zone.
All experiments were implemented in Python 3.8 and executed on an ASUS ROG workstation equipped with an Intel Core i9 processor, 32 GB RAM, and an NVIDIA GeForce RTX 2080 GPU. The simulation environment was developed using Eclipse SUMO Version 1.12.0 and interfaced with the reinforcement learning framework through the TraCI Python API to enable real-time interaction between the learning agent and the traffic network. All experiments were conducted using one-second simulation intervals under microscopic traffic simulation conditions.
3.7.2. Driving Behavior Models and Vehicle Parameters
Because the surrogate safety indicators are computed from vehicle spacing, relative speed, and acceleration, the driving behavior models govern the measurements on which the controller is trained and evaluated and are therefore reported in full. Longitudinal behavior was represented using the Krauss car-following model, selected because it derives following behavior from an explicit safe-distance constraint, which is the mechanism of interest where abrupt braking and short spacings drive rear-end risk at a lane closure, and because it requires few parameters, all of them reportable. Lateral behavior was represented using the LC2013 lane-changing model, which enforces gap acceptance before a maneuver is executed and is therefore consistent with a merge conflict indicator defined over the spacings and speed differentials arising when vehicles seek gaps at the taper. Three vehicle classes were simulated; their parameters are given in
Table 3.
The simulation environment is interfaced with the learning algorithm through SUMO’s TraCI Python API, which allows real-time communication between the controller and the traffic network. Through this interface, the reinforcement learning agent continuously observes the evolving traffic state, selects signal control actions, and applies phase changes dynamically during simulation execution. The traffic network is constructed to represent a signalized intersection corridor that includes a dedicated work zone segment. The work zone is explicitly embedded within the SUMO network by modifying lane attributes and operational parameters of the affected roadway segment.
These structural and operational modifications reduce the effective discharge rate of the segment, thereby creating a bottleneck that limits downstream throughput. As traffic demand approaches or exceeds this reduced service capability, vehicles accumulate upstream of the work zone, producing realistic queue formation, spillback, and congestion propagation patterns that the learning agent must manage. Traffic demand is defined through route files specifying vehicle arrival patterns over the simulation horizon. The demand profile is designed to generate sustained congestion near the bottleneck, ensuring that the control problem reflects recurrent work zone traffic conditions rather than uncongested flow. The simulation advances in discrete one-second intervals, and each episode corresponds to a complete one-hour simulation rollout, resulting in 3600 interaction steps per episode. At every time step, the environment progresses forward, traffic measurements are collected via TraCI, the agent selects a signal phase according to its current policy, and the selected control action is implemented within the simulator. After the final step of the episode is reached, the environment is reset, and training proceeds to the next episode. The state representation supplied to the learning algorithm is constructed from real-time traffic measurements extracted from SUMO. These include vehicle counts, lane occupancies, queue lengths, and average speeds on incoming approaches. These variables characterize the instantaneous traffic condition both upstream and downstream of the work zone, allowing the agent to detect congestion buildup, discharge dynamics, and spillback effects.
The action space consists of feasible traffic signal phases at the controlled intersection. When a new phase is selected, built-in transition constraints such as fixed yellow intervals are automatically enforced by the traffic light logic to ensure realistic and safe signal operation. Consequently, the agent selects among admissible green phases while clearance intervals are handled internally by the simulator. All controllers evaluated in the study operate under identical state definitions, action spaces, and control frequencies to ensure a fair and consistent performance comparison. A fully actuated signal controller was implemented using detector-based phase extension logic available within the SUMO simulation environment. The controller dynamically adjusted green phase durations based on real-time vehicle detections and queue presence on each approach. Phase extensions were triggered when vehicles continued to be detected within the active approach, while phase termination occurred when detector occupancy dropped below the specified threshold or when maximum green limits were reached. This benchmark controller was included to evaluate the DQN framework against conventional detector-based adaptive signal control strategies commonly used in practice.
Since the lane configuration is modified to represent a lane-closure work zone, congestion develops naturally when inflow exceeds the reduced discharge capacity of the segment. This modeling approach captures nonlinear vehicle interactions, realistic queue spillback, and recovery dynamics, thereby enabling the reinforcement learning controller to be evaluated under controlled conditions that reproduce the operational mechanisms of a signalized lane-closure bottleneck. The environment is not a calibrated replica of a specific site, and results are therefore interpreted as comparative rather than site-specific. The hyperparameter values selected for the RL algorithm are presented in
Table 4.
Traffic Demand
Traffic demand was defined separately for the northbound, southbound, eastbound, and westbound approaches through the SUMO route files. Four vehicle-composition scenarios were evaluated: cars only, trucks only, buses only, and mixed traffic.
Table 5 presents the approach-level demand used in each scenario. The northbound approach carried the highest demand because it received traffic from two upstream entry links. To ensure a fair comparison, the same demand rates and arrival-generation settings were applied to the default fixed-time, fully actuated, and DQN controllers within each vehicle-composition scenario.
Demand was specified so that all four vehicle-composition scenarios impose an equivalent load on the network in passenger-car equivalents. Truck and bus flows were scaled by factors of 1.67 and 2.10, respectively, reflecting the greater road space and longer headways these vehicles require, so that differences in performance across scenarios reflect vehicle-class dynamics rather than differences in the intensity of demand.
3.8. Experimental Protocol and Statistical Analysis
To account for the stochastic nature of microscopic traffic simulation, all reported results are based on multiple independent evaluation runs. For each reward-weight configuration, the DQN agent was trained once, using a fixed random seed (seed = 42) governing the neural network weight initialization, the ε-greedy exploration sequence, and the replay buffer sampling. The trained policy was then evaluated with exploration disabled (ε = 0) over five independent simulation seeds (11, 22, 33, 44, and 55), with ten evaluation episodes per seed and a deterministic per-episode sub-seed, yielding a total of 50 evaluation episodes per controller. All performance metrics reported in
Table 6,
Table 7,
Table 8,
Table 9 and
Table 10 and the associated figures are expressed as the mean ± standard deviation across these 50 episodes. These statistics therefore characterize the stability of a single trained policy under simulation stochasticity rather than variability across independent training runs; the latter is acknowledged as a limitation in
Section 5.2.
Statistical comparisons between the proposed controller and each baseline were performed using two-tailed independent-samples t-tests assuming equal variances, applied to the episode-level metric distributions with a significance level of 0.05. With 50 episodes per controller, this yields df = 98 for all pairwise comparisons. Effect sizes are reported using Cohen’s d, computed with the pooled standard deviation, where values of 0.2, 0.5, and 0.8 correspond to small, medium, and large effects, respectively. The random seeds used for training and evaluation are reported above to support reproducibility.
5. Discussion
5.1. Mechanisms Underlying the Observed Improvements
The reduction in merge conflict risk can be attributed to the metering behavior the controller acquires during training. Because the reward penalizes merge conflict at every decision step, the agent learns green durations that release platoons sized to what the single open lane can absorb, rather than discharging the full upstream demand toward the taper. This has three consequences in the merge region. First, the arrival rate at the taper is held closer to its merging capacity, so vehicles executing mandatory lane changes encounter larger available gaps. Second, the speed differential between merging and through vehicles is reduced, which lowers both the likelihood and the severity of sideswipe conflicts. Third, fewer vehicles are forced into late merges near the end of the taper, where gap acceptance thresholds decline as remaining distance shrinks and drivers accept increasingly critical gaps [
69,
70]. This mechanism is consistent with evidence from ramp metering, where regulating inflow to a merge bottleneck reduces merging turbulence and preserves discharge capacity [
34], and with work zone safety studies identifying speed differential and forced merging as primary contributors to merge-area crashes [
65,
66].
The reduction in queue spillback follows from a change in the effective control objective. Incorporating spillback length into the reward converts the problem from local delay minimization into storage-constrained control: because the penalty grows as the queue approaches the available storage of the upstream link, the agent truncates green extensions that would push the queue beyond that limit and reallocates green time to competing movements. Importantly, spillback carries a nonlinear cost. Once the queue blocks the upstream approach, the bottleneck experiences a capacity drop and discharge flow falls below the pre-queue rate [
83], so preventing spillback is simultaneously a safety action and an efficiency action. This explains an otherwise counterintuitive feature of the results: rather than trading mobility for safety, the controller improved both. The two objectives conflict locally, in the allocation of green time within a cycle, but are aligned at the bottleneck, where instability degrades throughput and elevates crash exposure at the same time. Similar alignment underlies queue-based and pressure-based control formulations, which achieve throughput optimality precisely by keeping queues bounded [
84].
The differential performance across vehicle classes is consistent with the kinematic and geometric characteristics of heavy vehicles. Throughput gains were largest for buses (37.3%) and trucks (32.7%) and smallest for passenger cars (24.6%). Heavy vehicles accelerate more slowly and require longer to reach free-flow speed after a stop, so each stop–start cycle imposes a disproportionately large time penalty and consumes more queue storage during the transition; a policy that reduces the frequency of stops therefore yields larger relative gains for these classes. The same asymmetry applies to startup lost time, which is greater for heavy-vehicle platoons and is recovered more effectively under the smoother, better-utilized green intervals the agent learns. In the merge region, heavy vehicles require longer gaps to complete a lane change because of their greater length and slower lateral maneuvering, so the gap-metering mechanism described above benefits them more than passenger cars. Finally, because heavy vehicles occupy more physical storage per vehicle, mitigating spillback frees proportionally more usable storage in heavy-vehicle streams. These effects also carry a safety dimension: heavy vehicles require substantially longer braking distances, so suppressing stop-and-go oscillations reduces rear-end exposure most for the classes whose crashes tend to be most severe [
66].
5.2. Limitations and Future Research
Several limitations should be acknowledged. First, the framework was developed and evaluated entirely within a SUMO microscopic simulation, which assumes idealized state observation. In field deployment, the state variables that drive the controller—queue lengths, occupancies, speeds, and merge-region spacing—would be reconstructed from physical detectors subject to miscalibration, occlusion, communication latency, and outright failure, conditions that are further aggravated in work zones where lane shifts displace existing loop detectors. The resulting partial observability could degrade policy performance relative to the simulated results reported here. Addressing this gap will require training under injected sensor noise and dropout, domain randomization, and uncertainty-aware or robust reinforcement learning formulations, together with hardware-in-the-loop testing prior to field deployment.
Second, the framework does not model connected or automated vehicle environments. Connected vehicle data could substitute for or augment detector-based state estimation, providing direct measurement of individual vehicle trajectories in the merge region and thereby improving the fidelity of the merge conflict indicator; in a mixed-autonomy setting, cooperative merge guidance could additionally be coordinated with signal timing. Extending the framework to variable market penetration rates of connected vehicles represents a natural direction for future work.
Third, although the network contains two signalized intersections, only the intersection adjacent to the work zone is placed under reinforcement learning control, while the upstream intersection operates under fixed control throughout. The framework is therefore evaluated as a single-agent controller within a two-intersection network rather than as a coordinated strategy. Coordinated multi-intersection control introduces additional considerations: offset optimization, arterial progression, and the propagation of spillback across successive links that a single-agent formulation cannot capture; the computational cost of the Pareto-based weight sampling procedure grows with the number of controlled intersections. Multi-agent reinforcement learning with parameter sharing or graph-based state representations offers a plausible path toward corridor-level scalability. The evaluation is also confined to a single demand profile and a single work zone geometry. Robustness to varying demand levels, to different taper and activity area lengths, and to alternative closure configurations has not been tested systematically. Evaluating the trained policy under such conditions requires re-evaluation rather than retraining and is identified as a direct extension of this work.
A distinction should also be drawn between imposed and emergent vehicle behavior. The zone-based target speeds described in Section Multi-Stage Driver Behavior Before the Work Zone are imposed through the TraCI interface and define a speed envelope that depends on a vehicle’s distance to the barrier. Within that envelope, the spacing between successive vehicles, their relative speeds, their acceleration profiles, and the timing and feasibility of each lane change remain emergent outcomes of the car-following and lane-changing models, and it is these quantities that enter the merge conflict formulation. The signal action influences them by determining when and in what platoon size vehicles are released toward the taper, which sets the density and the distribution of gaps in the merge region. Because the same speed envelope applies to every controller evaluated, it cannot account for differences between them. As the envelope is not calibrated from observed work zone driver behavior, however, the merge conflict values should be interpreted as comparative rather than absolute measures of risk.
A further limitation concerns the scope of the comparative evaluation. The proposed controller is benchmarked against fixed-time and fully actuated control, both of which are non-learning strategies. This design establishes the benefit of the framework relative to conventional signal control, but it does not separate the contribution of the safety-aware reward from that of deep reinforcement learning itself. An ablation in which an otherwise identical agent is trained on a mobility-only reward, together with comparisons against established reinforcement learning baselines, would isolate this contribution and is the principal extension planned for future work.
Fourth, the surrogate safety formulation characterizes merge-related risk through relative spacing, speed, and acceleration rather than modeling crash outcomes directly, and the reported results are conditioned on the specific work zone geometry, demand profile, and reward-weight sampling adopted in this study. Establishing the correspondence between the proposed indicators and observed crash frequencies would require field data collection at instrumented work zones. Finally, the multi-objective procedure relies on linear scalarization of the reward components, which can only recover policies lying on the convex portion of the Pareto front; non-convex regions of the trade-off surface would require Pareto-dominance-based multi-objective reinforcement learning methods. Future research will address these limitations by extending the framework to coordinated corridors, evaluating robustness across a wider range of work zone configurations and demand levels, incorporating connected and automated vehicle behavior, and pursuing field validation to translate these simulation-based gains into operational practice.
6. Conclusions
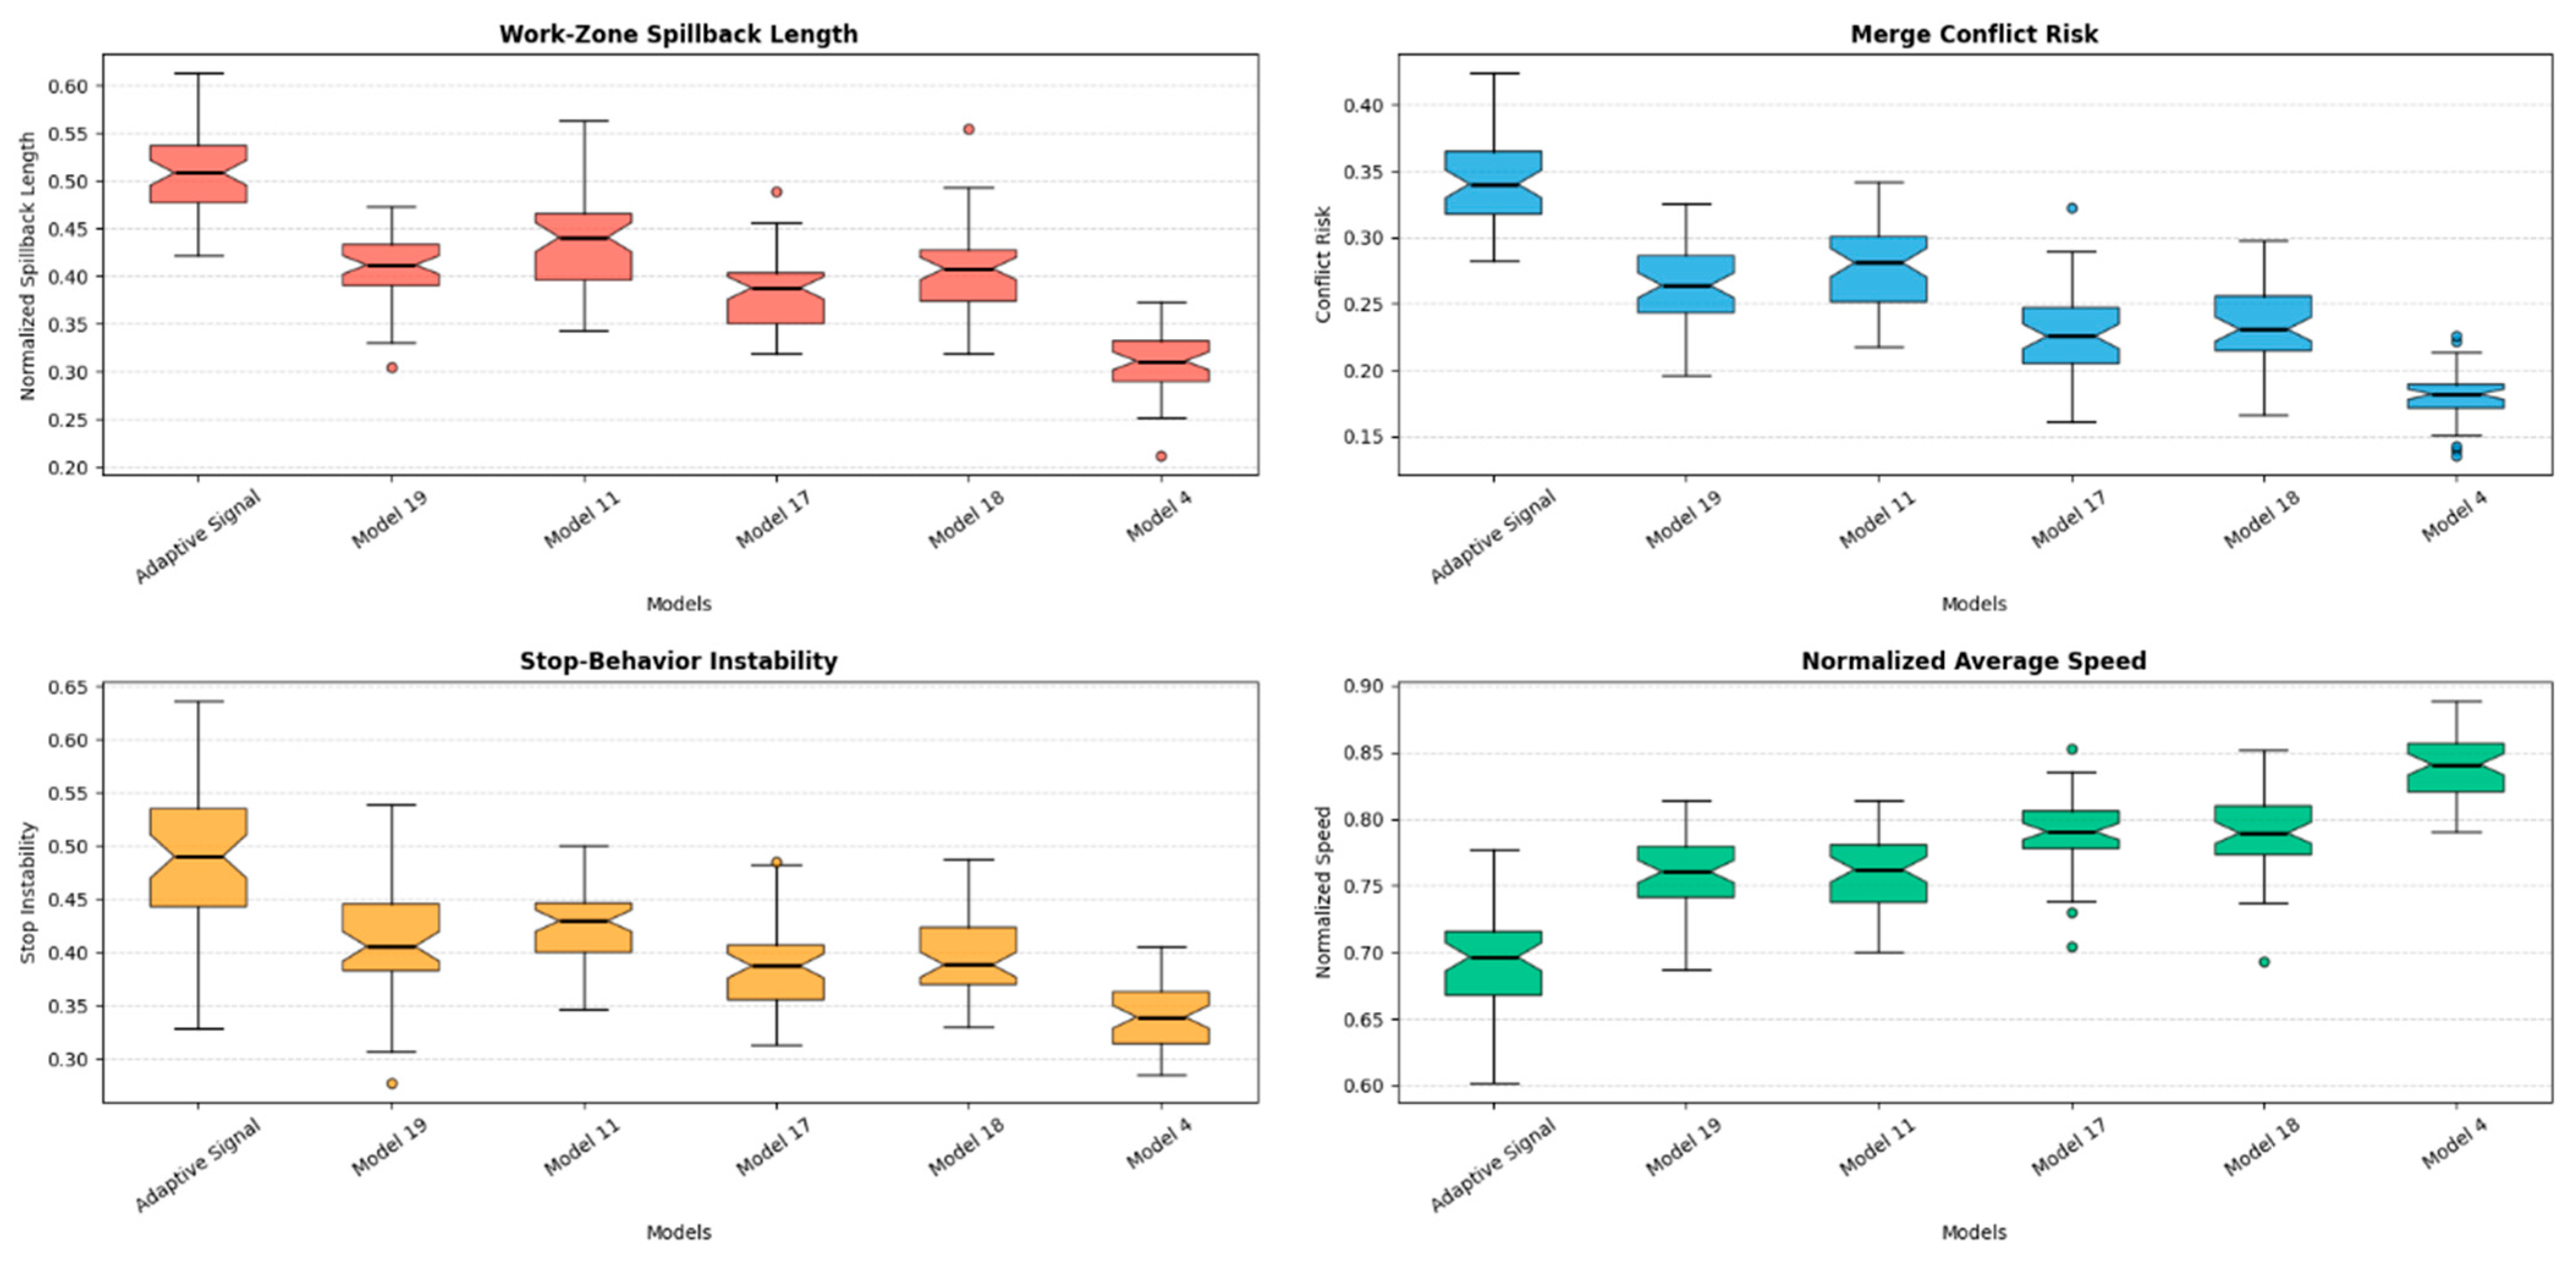
This study developed a safety-aware DRL for adaptive traffic signal control in a signalized work zone environment. Unlike traditional adaptive signal control, which only focuses on operational efficiency, the safety-aware DQN considers work zone spillback length, merge conflict, stop behavior instability, and traffic mobility directly in its state and reward definition. Operational and safety performance indicators were encoded into the reward function and perceived through state observations, allowing the controller to adapt signal timings based on real-time work zone traffic conditions. The framework was implemented in a SUMO-based microscopic traffic simulation of a signalized intersection under lane-closure conditions. Traffic performance was assessed for each reward weight combination by conducting Pareto-based multi-objective optimization and selecting the optimal action based on non-dominated policies. Model 4 outperformed all other models in terms of both safety and operational performance, minimizing spillback propagation, merge conflict risk, and stop instability while maximizing average normalized speed. Relative to the default signal-timing strategy, the RL-based controllers reduced spillback length, merge conflict risk, and stop instability while improving traffic mobility across all vehicle classes. Model 4 achieved the largest throughput gains, increasing vehicle throughput by 24.6%, 32.7%, 37.3%, and 29.7% for cars, trucks, buses, and mixed traffic, respectively, with all p-values below 0.001 and Cohen’s d values ranging from 0.53 to 1.29, indicating moderate-to-large practical effect sizes. The improvements were most pronounced for trucks and buses, the vehicle classes most adversely affected by capacity reductions and unstable merging within work zones. The safety-aware DQN likewise outperformed the actuated adaptive signal-control baseline with statistical significance and large effect sizes, confirming that the observed gains are unlikely to reflect random simulation variability. Moreover, the macroscopic shockwave analysis showed that the DQN controller slowed upstream congestion propagation and accelerated recovery relative to the adaptive signal-control baseline, reducing maximum queue length by 39.1% and maximum spillback distance by 45.8% while raising the queue dissipation rate from 5.1 to 8.3 vehicles per minute. These results show that the controller not only reduces the magnitude of congestion but also improves the temporal dynamics of queue formation and clearance, enabling traffic to recover to free-flow conditions more quickly after a disturbance. Taken together, these findings show that a controller trained with surrogate safety indicators as learning objectives improves traffic operations while reducing safety-critical instability relative to fixed-time and actuated control under the non-stationary, capacity-constrained conditions that characterize work zones. Because both comparison controllers are non-learning, these results establish the benefit of the proposed framework over conventional signal control rather than isolating the contribution of the safety-aware reward itself. Determining that contribution requires comparison with an otherwise identical controller trained on a mobility-only reward, which is identified as the immediate next step in this work. The Pareto-based formulation further allows practitioners to select among non-dominated policies according to site-specific priorities, making the framework adaptable to differing operational and safety preferences without retraining a single fixed reward.





 ,
,