1. Introduction
Urban intersections are among the most safety-critical components of roadway networks, where complex interactions between vehicles, pedestrians, and cyclists often lead to a high incidence of crashes and conflicts [
1,
2,
3]. Left-turn movements are particularly critical due to conflicts with opposing through traffic, vulnerable road users including pedestrians and bicyclists, and the complexities of signal phasing and timing [
4,
5,
6,
7,
8,
9].
Modeling crash probability and severity are central themes in road safety research and practice. Traditional safety performance functions (SPFs) estimate expected crash frequency at segments and intersections using roadway, traffic, and contextual variables, such as road design, control type, and exposure measures like AADT [
10,
11]. Studies commonly apply count models, notably Poisson, negative binomial (NB), and extensions that address excess zeros and heterogeneity to analyze factors and predict frequency [
12,
13,
14]. Machine learning and AI methods have also been explored to enhance predictive performance for crash counts and severities [
15,
16,
17].
Crash-based assessment safety performance by estimating risk from historical crash counts is increasingly seen as insufficient because crashes are rare, often underreported and typically provide limited information about the pre-crash interactions that guide design or control changes [
18,
19]. In particular, a long period of time is typically required to collect a sufficient sample of road crash data that could allow for reliable estimates of the road safety level as road crashes are rare events by nature [
20]. These limitations motivate a transition toward Surrogate Safety Measures (SSMs) derived from traffic conflicts/near-misses—an approach rooted in the traffic conflict technique [
21] and later formalized for intersection applications, because conflicts occur far more frequently than crashes and can be observed or extracted from trajectories to quantify risk [
22].
While several studies have examined geometric effects on intersection safety, these characteristics are often analyzed within crash-based or simulation-based frameworks, rather than being systematically integrated with field-derived, trajectory-based SSMs for left-turn movements. This study investigates left-turn safety at urban intersections using surrogate safety measures derived from field video observations. Time-to-Collision (TTC) and Post-Encroachment Time (PET) were extracted for left-turn conflicts across five inter-section types in Thessaloniki, Greece, and linked to geometric attributes, signal operations, and traffic conditions.
The rest of the paper is structured as follows. The literature review follows in
Section 2.
Section 3 describes the methodological approach of this study.
Section 4 includes data analysis.
Section 5 includes discussion and concludes the paper.
2. Literature Review
Surrogate Safety Measures (SSMs), especially Time-to-Collision (TTC) and Post-Encroachment Time (PET), have become the intersection-level risk prediction indicators because they can be derived from short observation periods and rich trajectory data. TTC defines the time until a collision between the vehicles would occur if they continued on their current speed and direction, while PET defines the time lapse between the moment that a road user leaves the conflict area and the other road user arrives the area [
22,
23].
Across the literature, predictive models of TTC and PET rely on either (i) field-data sources, including trajectories derived from video cameras or LiDAR, or (ii) simulation-based datasets, typically microsimulation calibrated to site conditions [
24].
Caliendo and Guida [
25] developed one of the earliest frameworks linking conflicts to expected crash frequencies at unsignalized intersections. Using a calibrated traffic microsimulation environment, they generated conflict counts based on surrogate safety measures, including TTC and PET, under varying geometric and traffic conditions. These simulated indicators were then related to crash occurrence through regression modeling. Their findings demonstrated that surrogate measures derived from simulation can reliably approximate safety performance and serve as practical predictors of crash likelihood. However, their analysis relied exclusively on simulation-generated data, which may not fully capture the complexity and variability of real-world driver behavior and interaction dynamics.
Several studies that include real-time data analysis describe “critical conflict” prediction as a supervised classification problem, where TTC/PET thresholds define near-crashes events and models learn from video- or detector-derived kinematics. Osman et al. [
26] modeled near-crash prediction directly from observed vehicle kinematics using SHRP2 (Second Strategic Highway Research Program) driving data. The study tested multiple algorithms and validated the concept that “kinematic turbulence” occurs before near-crashes by applying a supervised MP model. Rostami et al. [
24] developed predictive models for bicycle–vehicle conflicts at signalized intersections using video data collected from ten sites. The authors trained logistic regression (LR), support vector machine (SVM), and random forest (RF) classifiers, where conflicts were labeled based on PET and a modified TTC indicator. Their results showed that the RF model achieved the highest predictive accuracy, with recall values exceeding 90% for rear-end scenarios. They also conducted a sensitivity analysis on threshold and time-window definitions, highlighting how critical thresholds choices significantly affect model performance. Similarly, Zhang et al. [
27] emphasized that defining appropriate TTC and PET thresholds is essential for ensuring that these indicators remain measurable, comparable, and transferable across sites. Ma et al. [
28] developed conflict prediction models for expressway diverging areas using trajectory data to compute TTC (for rear-end and lane-change conflicts) and proposed an Hourly Conflict Risk Index (HCRI) as an operational output. The work demonstrates how video analytics can translate into interpretable risk indicators for field monitoring and management in high-turbulence freeway segments. Another study introduced a deep-learning framework for real-time traffic conflict prediction, integrating camera-based detection (R-CNN for lane/vehicle cues), in-vehicle sensor data, and traffic variables [
29]. Their centralized data architecture and DNN models achieved high predictive accuracy (reported best ≈ 94%), illustrating the value of data fusion from different data sources.
Zhang and Abdel-Aty [
30] proposed a real-time pedestrian conflict prediction framework at the signal-cycle level, integrating high-resolution Automated Traffic Signal Performance Measures (ATSPM) data with video-derived surrogate safety indicators. The study employed multiple machine learning algorithms, including logistic regression and tree-based models, to predict whether an upcoming signal cycle would contain pedestrian–vehicle conflicts, defined using TTC and PET thresholds. The results demonstrated that incorporating both operational (phase time, pedestrian/vehicle volume) and safety (TTC/PET) variables significantly improved predictive accuracy. In a more recent study, Gagliardi [
31] examined pedestrian-vehicle interactions at signalized intersections through field observations. Using video-based trajectory data, the authors computed TTC and PET to identify critical conflicts and evaluate intersection safety. The study found that the PET indicator is the most effective measure for detecting driver-pedestrian conflicts at signalized intersections. The analysis also revealed that the likelihood of conflicts increases with longer red signal durations and is higher among younger pedestrians, likely due to impatience and greater risk-taking behavior.
Appiah et al. [
32] developed a calibrated VISSIM–SSAM pipeline to analyze left-turn crash risk at signalized intersections across 750 synthesized scenarios varying geometry, volumes, speeds, and signal timing (including the share of protected time). Using conflicts per 100 left-turning vehicles as exposure risk, they compare Poisson, NB, and zero-inflated Poisson (ZIP) models and find ZIP fits best given many zero-conflict hours. In their study, the key factors identified as critical predictors were opposing volume and speed, protected share, and cycle allocation. Although the analysis revealed important insights into traffic safety at left turns, it was based on simulated scenarios rather than real-time field observations. Recent studies have begun to bridge this gap by using trajectory data from CVs or advanced video analytics to reconstruct conflicts on actual roadways. For example, Ma and Zhu [
33] proposed a CV-based framework using fused GPS, yaw-rate, and radar signals to compute PET in real time to enable continuous monitoring of left-turn conflicts. Goughnour et al. [
34] conducted multi-city empirical Bayes before–after studies to estimate crash modification factors (CMFs) for changes in left-turn signal phasing and pedestrian treatments. The authors analyzed data from Chicago, New York City, Charlotte and Toronto to evaluate the safety effects of converting intersections to protected or protected and permissive left-turn phasing. Although the study provides valuable evidence on how operational conditions and signal phasing influence left-turn safety, it does not explicitly consider the geometric characteristics of the evaluated intersections.
Based on the reviewed literature, several key conclusions and research gaps can be identified regarding the current state of intersection safety modeling:
Modeling crash probability and severity has advanced significantly over the past two decades, with a growing focus on predicting safety outcomes at urban intersections.
Simulation-based and field data-driven approaches have both proven effective in capturing the mechanisms that underline traffic conflicts.
Existing studies have primarily focused on operational and kinematic factors such as traffic volume, speed, and signal timing for left turns.
The present study aims to examine left-turn safety by using surrogate safety measures derived from field video observations. Specifically, it will analyze PET and TTC events collected from five distinct intersection types within the city of Thessaloniki, Greece, including signalized intersections with shared and exclusive left-turn lanes, unsignalized intersections, and roundabouts. By integrating these surrogate measures with detailed geometric characteristics, traffic signal operational parameters, and traffic flow conditions, the study seeks to identify the parameters that most strongly influence left-turn safety under diverse urban settings, in the framework of typical urban interchange in a Greek city.
3. Materials and Methods
3.1. Data Extraction and Static Variables
This study focuses on the development of a predictive model to assess the safety level of road intersections by using advanced video image processing techniques and algorithmic analysis. Field data were collected from five selected intersections presented in
Table 1 during morning peak hours (7:00 am–9:00 am). The geometric configuration and other characteristics are referred to as “static variables” in the model, as they can influence the occurrence of critical events but do not change dynamically over time.
The selected intersections were chosen to represent common urban intersection typologies in Thessaloniki, including signalized, stop-controlled, and roundabout configurations. Additional selection criteria included the presence of left-turn movements, pedestrian activity, variation in geometric design, and the availability of suitable camera viewpoints for reliable trajectory extraction.
3.2. Video Processing
The video processing pipeline began with object detection and segmentation using YOLO v11x (
https://docs.ultralytics.com/models/yolo11/), (accessed on 1 March 2025) a single-stage convolutional neural network that simultaneously predicts object classes and bounding boxes through a grid-based regression framework. Its real-time performance makes it suitable for traffic video analysis, although detection accuracy may degrade under occlusion or dense traffic conditions. To mitigate these limitations, the proposed methodology adopts a modular workflow in which YOLO is used exclusively for object detection, while tracking, trajectory reconstruction, and surrogate safety extraction are handled in separate stages. To track these detected objects across consecutive frames, DeepSort [
35] was applied, assigning unique tracking IDs that enable the reconstruction of complete vehicle trajectories over time.
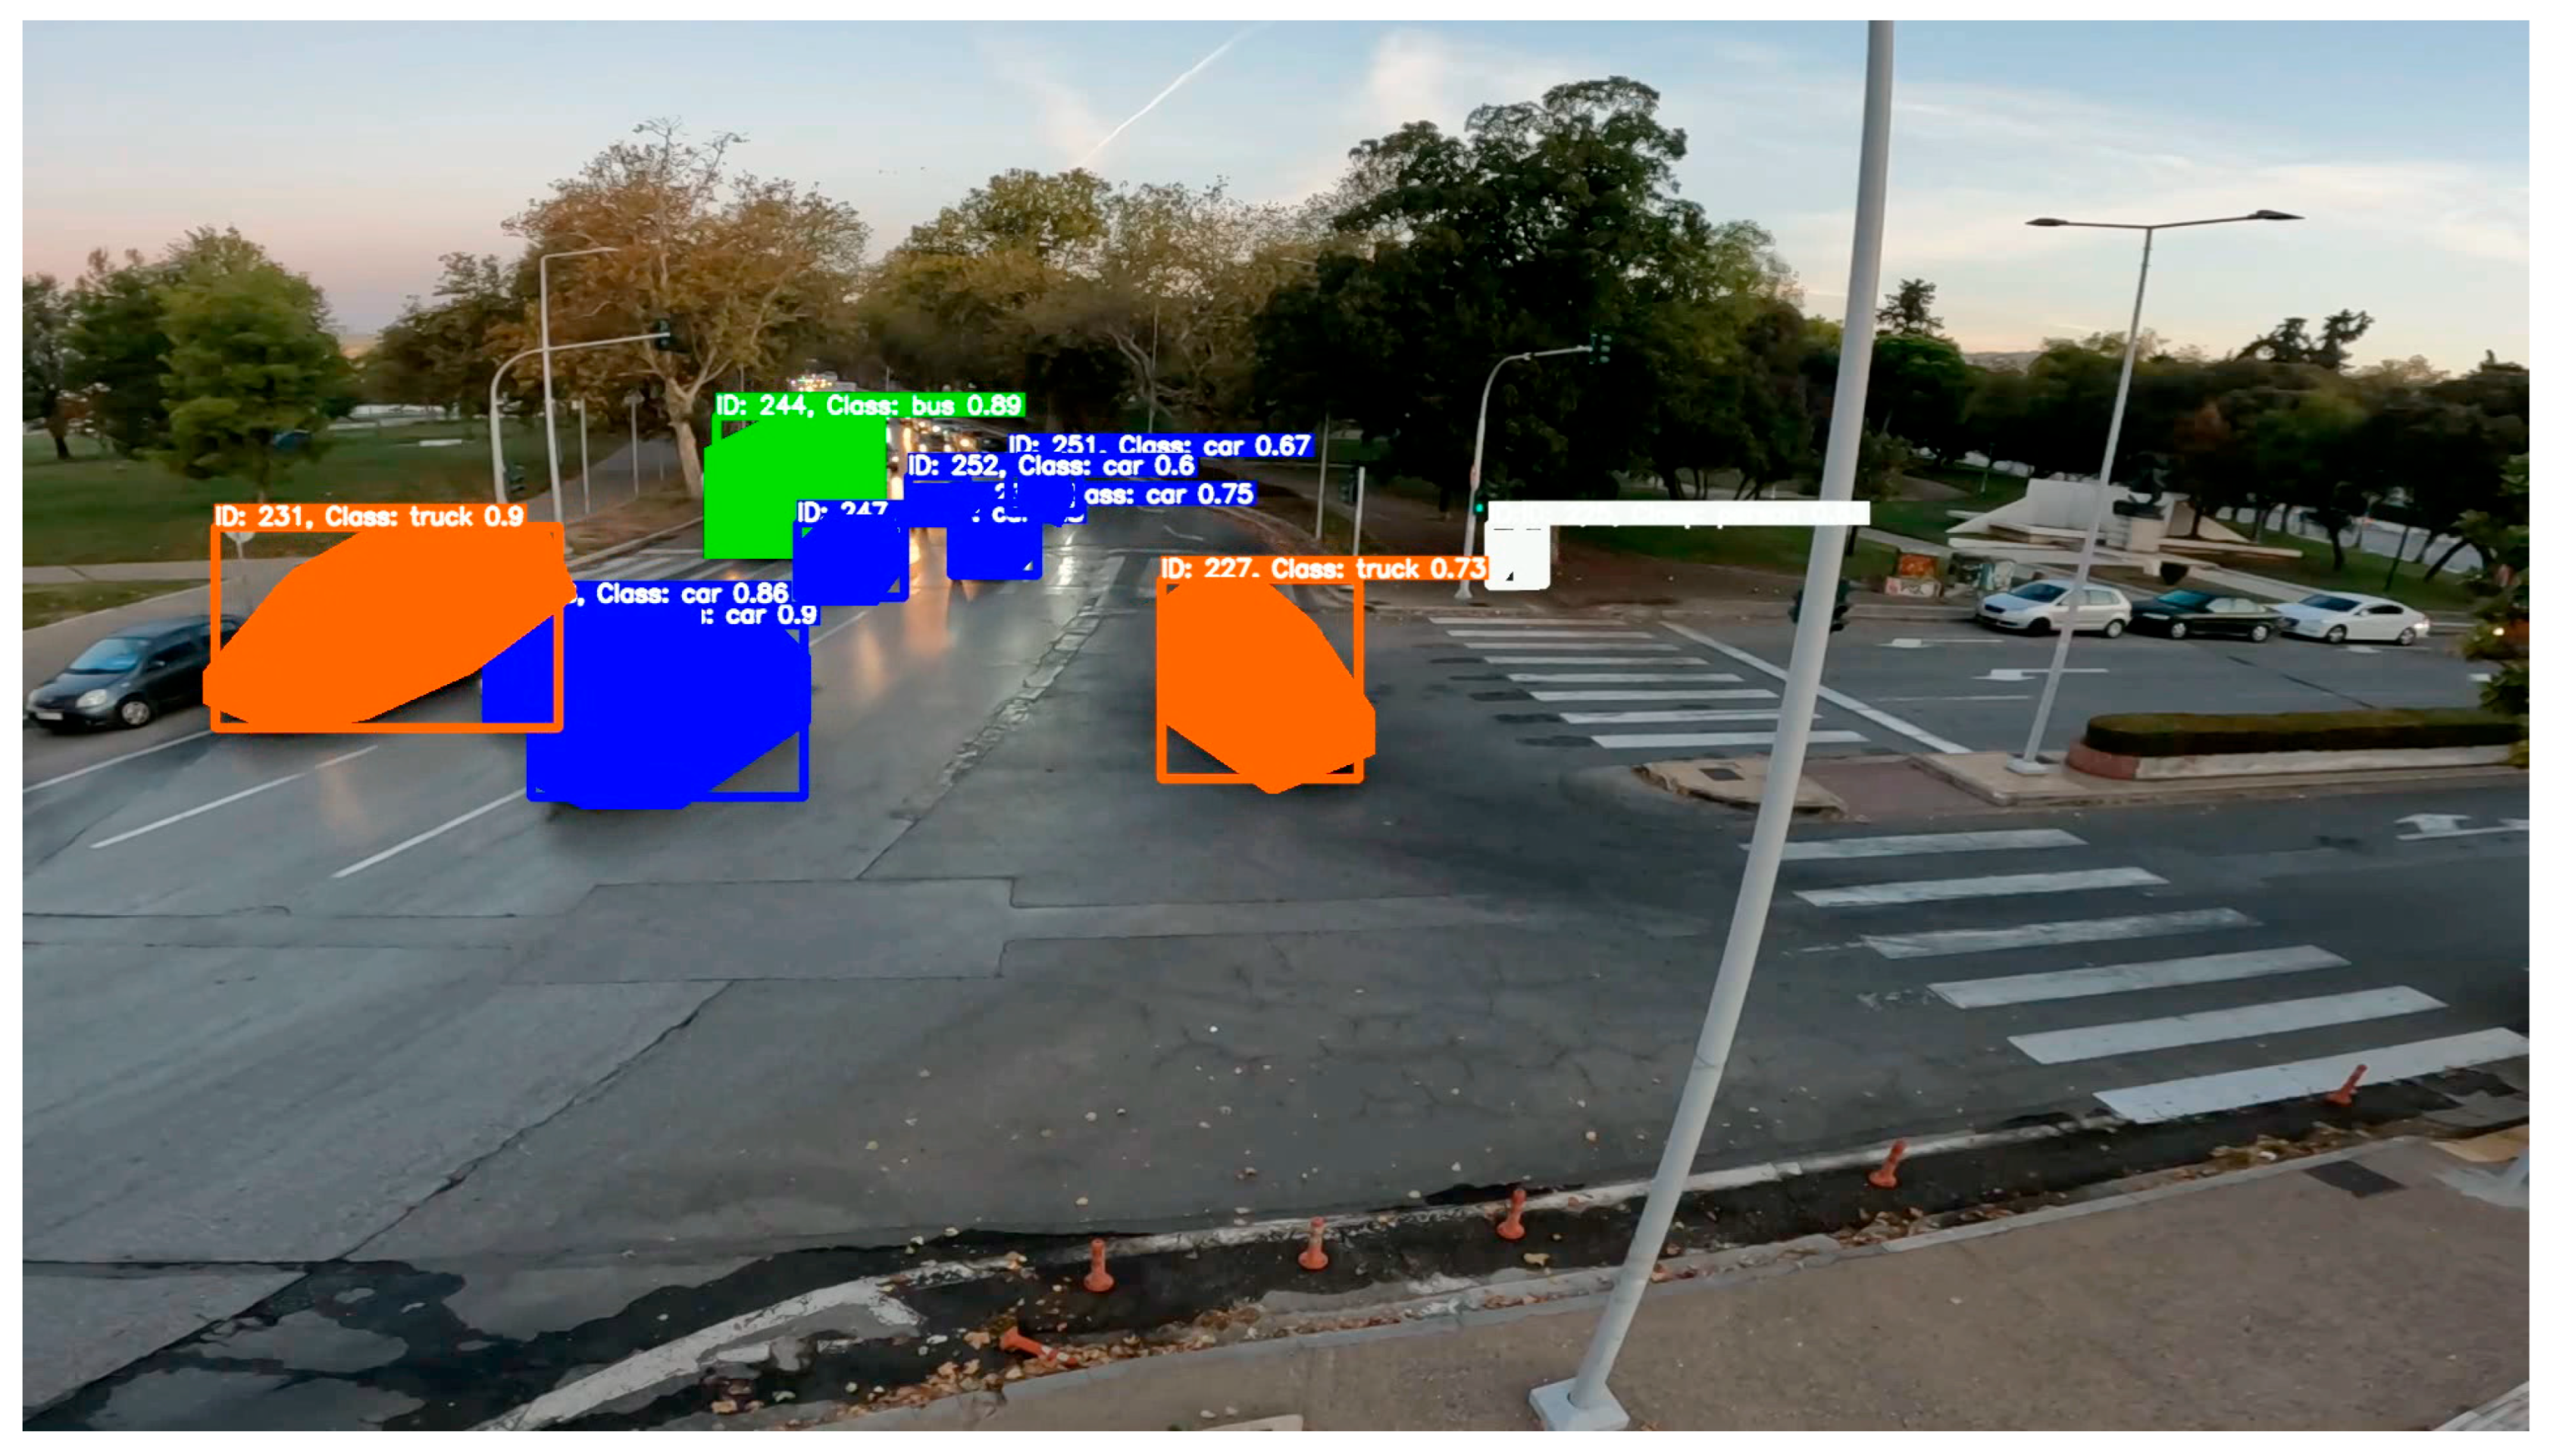
Figure 1 illustrates a video frame where the detection and tracking algorithms were applied.
The raw segmentation masks produced by YOLO often contain noise, small artifacts, or irregular boundaries due to imperfect predictions. To address this, a mask smoothening process was applied. This involved removing small disconnected components and applying a convex hull operation to each mask, resulting in cleaner and more regular shapes. The purpose of this step was to ensure that the extracted reference points for each vehicle were based on accurate and consistent object contours, thereby improving the reliability of trajectory extraction and reducing the impact of segmentation errors on downstream processing. To convert these trajectories from image coordinates to real-world positions, the Perspective-n-Point (PnP) [
36] method was used to compute a homography matrix [
37], allowing for transformation from pixel coordinates to geographic (GPS) coordinates.
An algorithm was developed to extract a consistent reference point for each vehicle, chosen dynamically based on vehicle orientation. These reference points were then transformed into GPS coordinates using the computed homography matrix. The final processed trajectories were converted into GeoJSON format and reprojected into the EPSG:2100 (EGSA87) coordinate reference system, ensuring alignment with Greek geospatial data standards and enabling further spatial analysis. Lastly, through video processing, the lanes of each vehicle at every timestamp can be determined to analyse traffic patterns, particularly for left turns. Additionally, vehicle average speeds have been calculated to provide valuable insights into acceleration, deceleration rates and relative speeds.
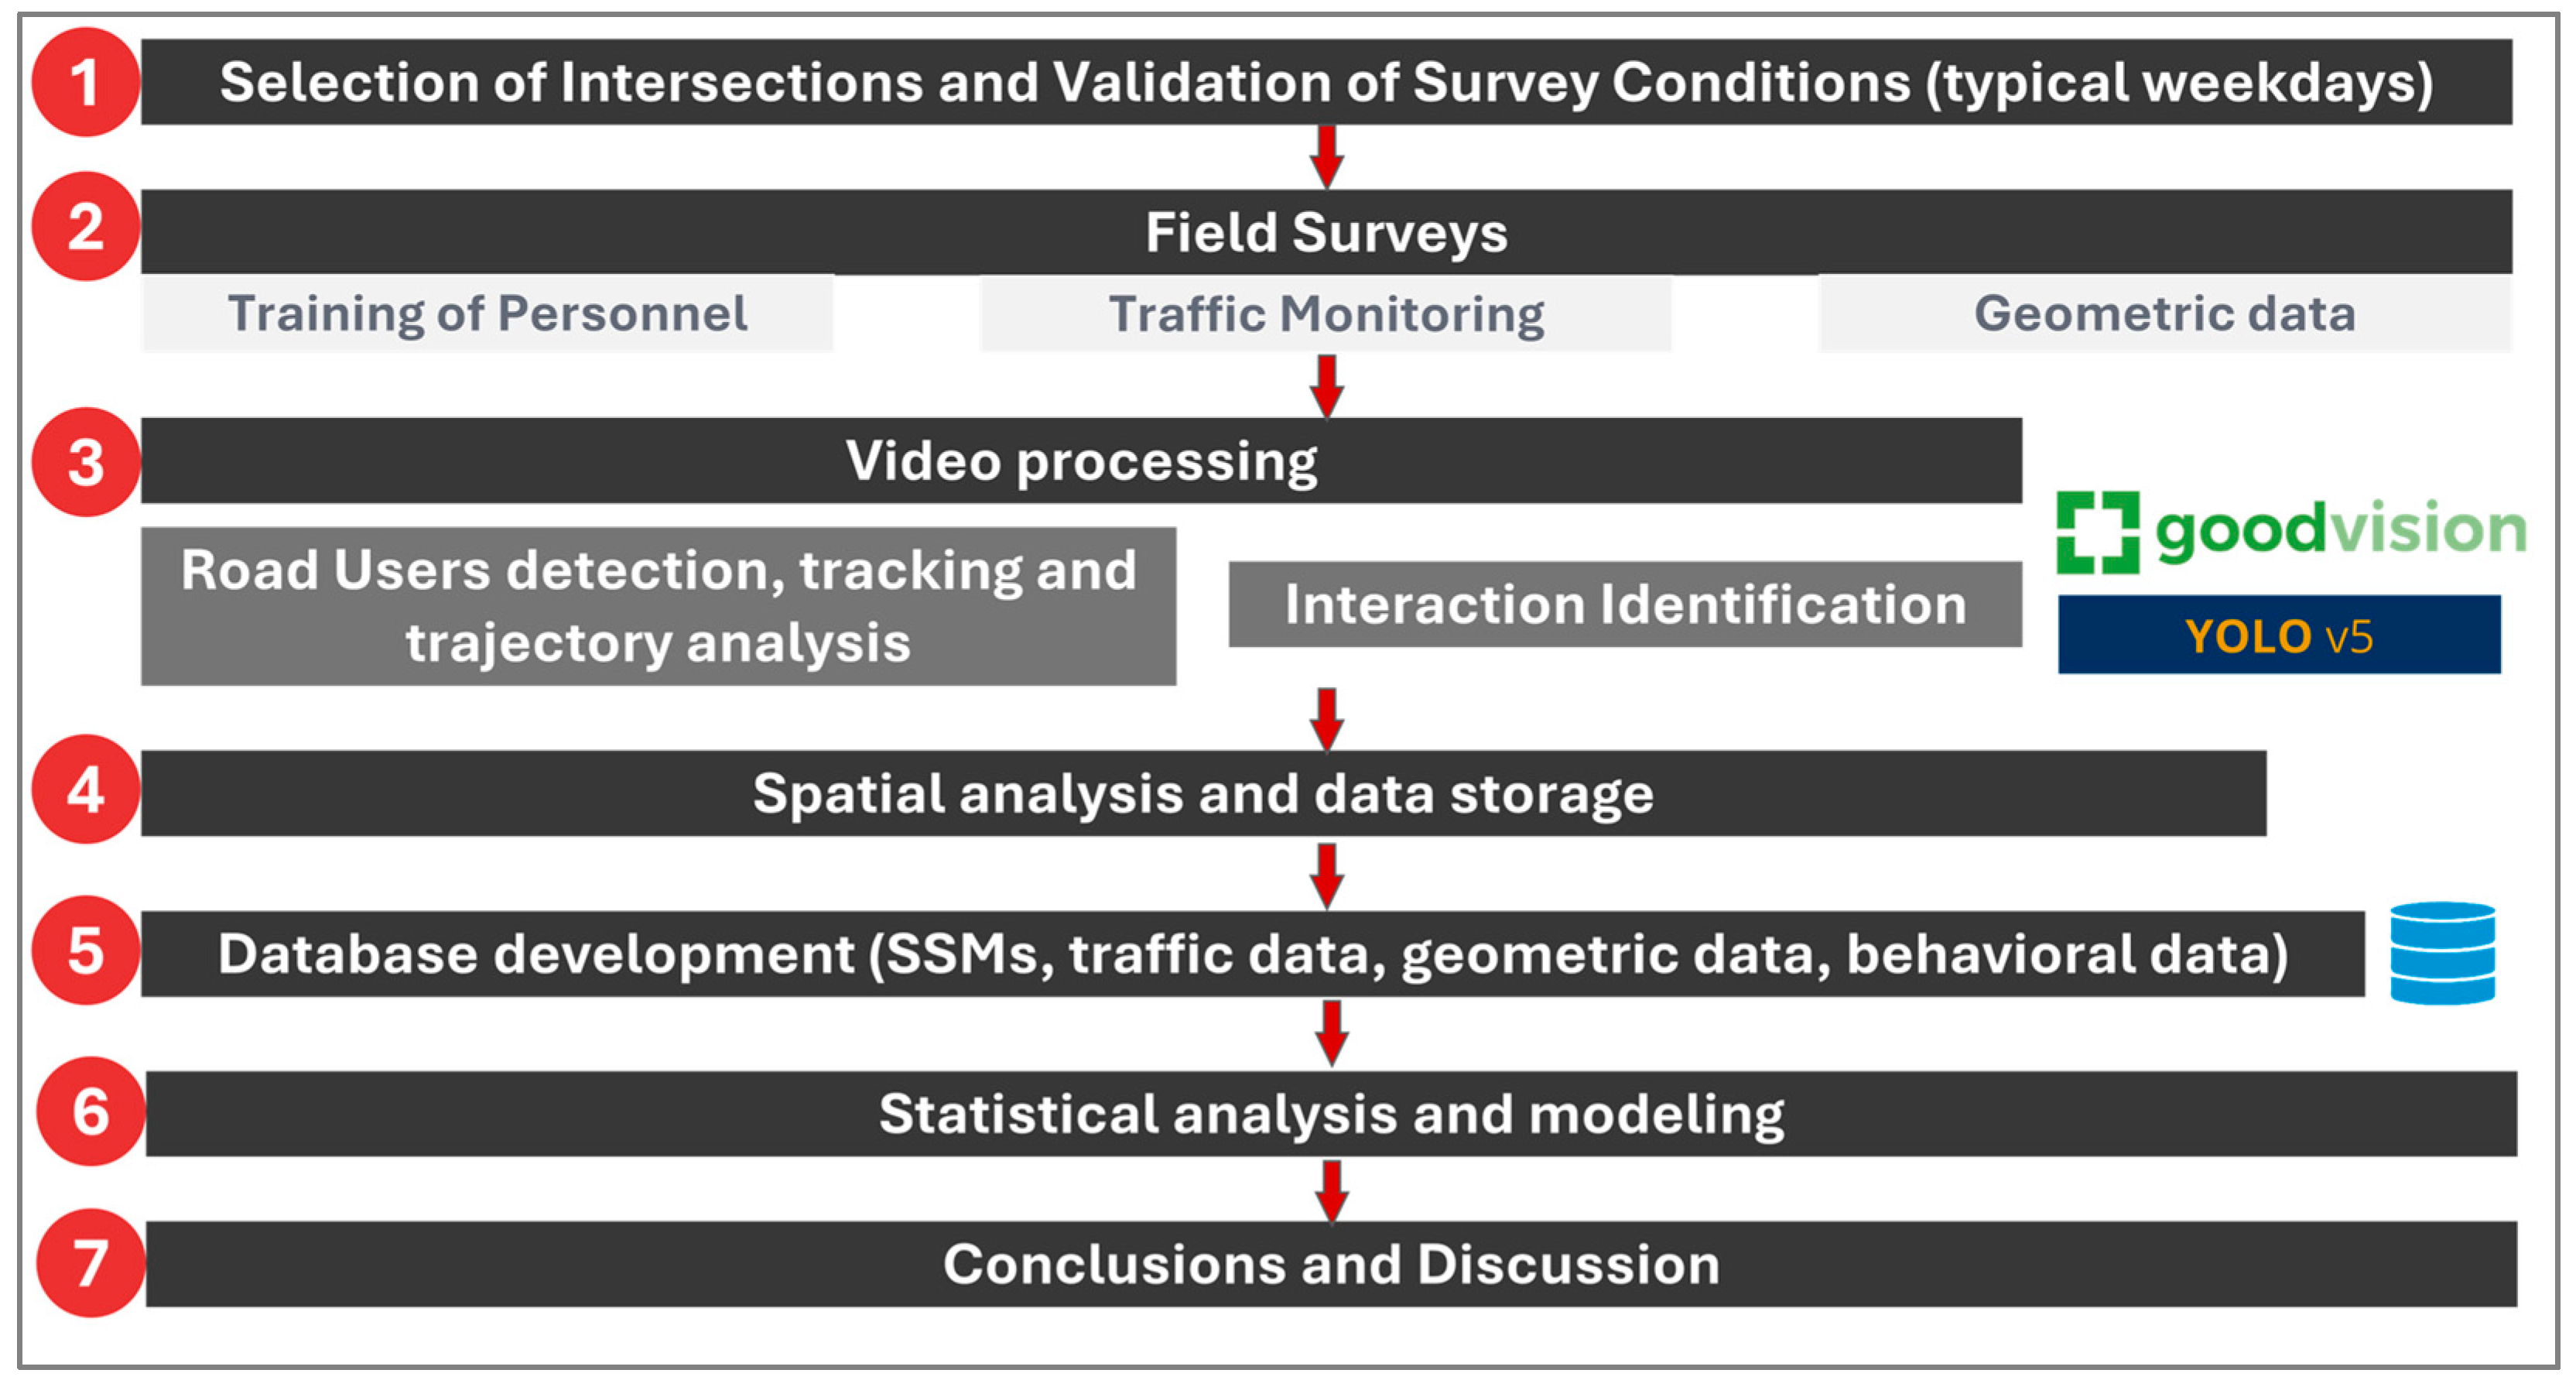
The adopted workflow follows a modular design. Object detection, tracking, and trajectory reconstruction were performed using a custom YOLO–DeepSort pipeline to ensure full control over classification, tracking continuity, and spatial accuracy. GoodVision software (
https://goodvisionlive.com/goodvision-video-insights/, accessed on 21 October 2025) was used exclusively for the semi-automated identification and manual verification of PET events, where human-in-the-loop validation is critical. This separation of tasks improves transparency and reproducibility while allowing each component to be optimized for its specific function. The adopted methodology is being presented in the
Figure 2 below.
3.3. Analysis of the Convergence of Actual Trajectories from Ideal Trajectories
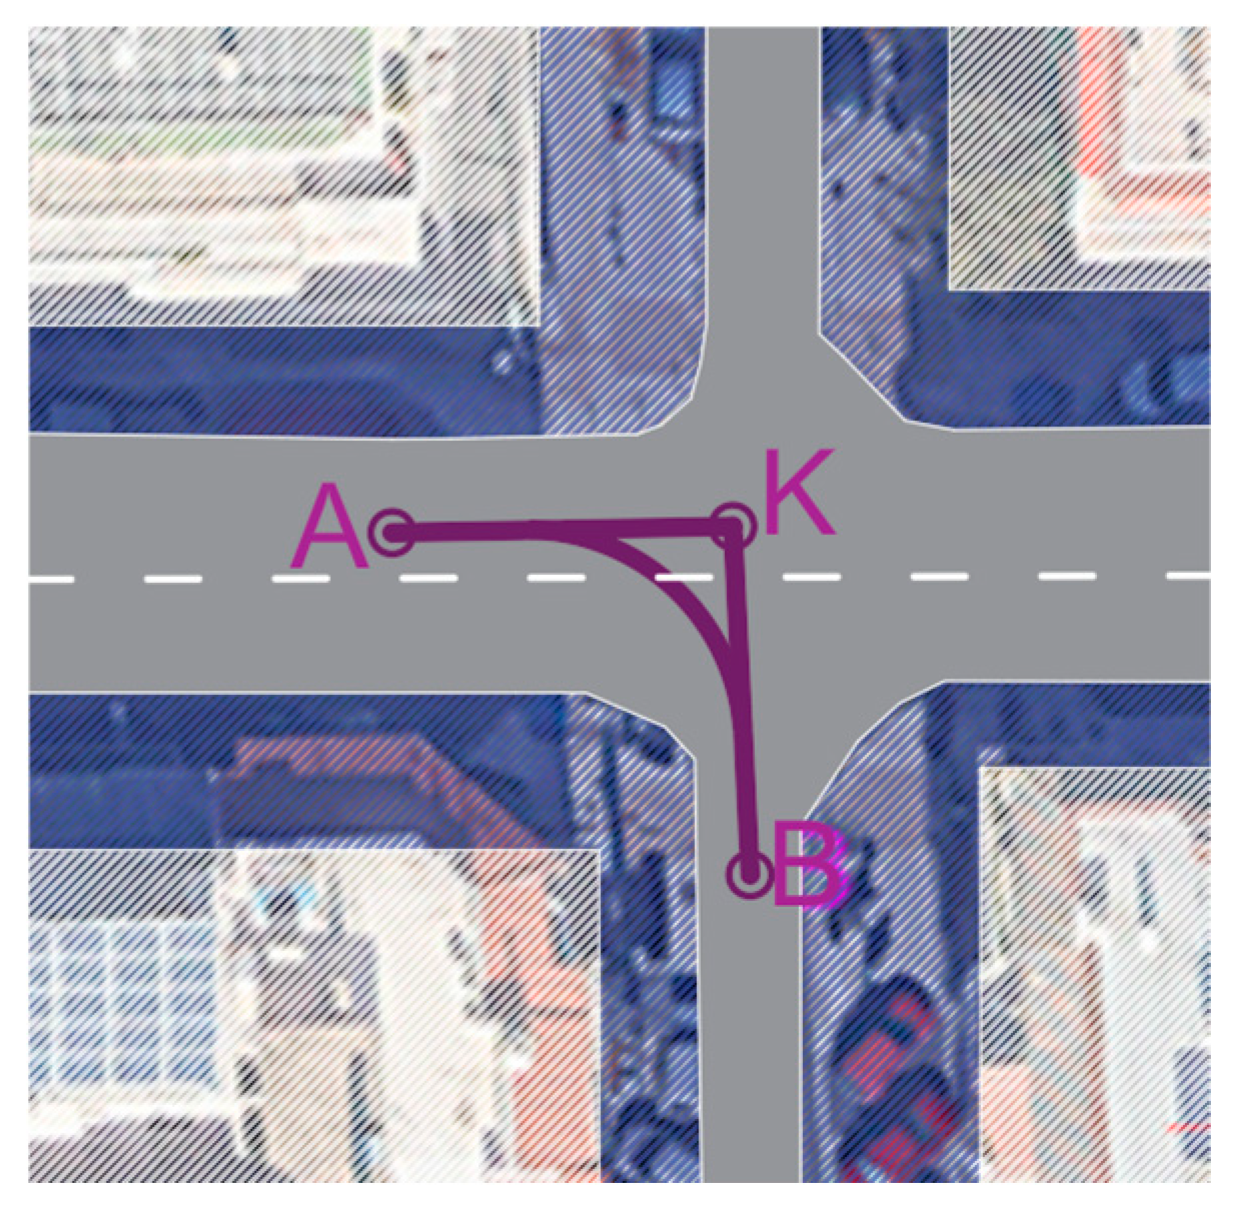
For each left-turn movement, the ideal path was constructed from geometry using symmetric entry/exit tangents [
38] as is presented in
Figure 3 and described below:
Let K be the intersection point of the prolongations of the entry and exit lane centrelines.
On the exit tangent, define point A at the downstream end of the pedestrian crossing; ∣KA∣ is the arc’s downstream tangential extent.
On the entry tangent, define point B so that ∣KB∣ = ∣KA∣.
The ideal path is the circular arc tangent to the entry/exit tangents at B and A.
With turning angle γ between tangents, the theoretical radius and curvature are:
where
Rtheor is the theoretical radius of the ideal left-turn path (m);
ktheor is the theoretical curvature of the ideal left-turn path (m−1);
is the tangential length between the intersection point and point on the exit approach (m);
is the deflection angle between the entry and exit lane centerlines (rad).
Trajectories extracted from video (and georeferenced) were trimmed so that comparison with the ideal arc is made over the same geometric extent: (a) creating two virtual cross-sections on the tangents: upstream at ∣KB∣ (entry) and downstream at ∣KA∣ (exit), (b) keeping only the trajectory segment between these sections (the curved portion of the manoeuvre), (c) discarding straight approach/departure segments outside [B, A].
Each trimmed trajectory
represented by its best-fit circle via the Kåsa algebraic least-squares method [
39]. The solution provides centre (x
0, y
0) and radius R
traj in a direct, non-iterative manner (efficient for large datasets). The measured curvature is:
where
3.4. Descriptive Analysis: Dynamic Variables
In this stage of the analysis, a basic statistical exploration is conducted for the key demand and exposure variables that will be used as predictors of PET events. Specifically, distributions are summarized for dynamic variables such as traffic flow, vehicle counts by class (Passenger Car, Bus, Truck, Heavy Truck, Motorcycle, Bicycle, Van), and pedestrian counts. In addition, kinematic indicators (average speed, average acceleration, and average deceleration) are examined to capture the operational dynamics of vehicles at each approach. Finally, trajectory deviation variables (abs_radius_diff_avg and abs_curvature_diff_avg), measure the absolute differences between ideal and observed paths.
The descriptive statistics (mean, standard deviation, quartiles, minimum and maximum values) for passenger cars reveal clear differences in demand across intersections and turning movements. At the busiest approaches, such as K02 (2-1) and K01 (4-3), average flows reach 4–4.5 vehicles per minute (≈240–270 vehicles per hour), while quieter approaches, like K03 (1-2) or K04 (3-2), average fewer than one vehicle per minute. Most approaches fall in the low-to-moderate range of 1–3 vehicles per minute, with typical peaks of 5–11.
In the dataset, both buses and heavy trucks appear very infrequently, with mean flows close to zero and only occasional single observations across all intersections. Despite their rarity, these vehicle types share important operational characteristics: they are large, slow to maneuver, and can obstruct visibility. To reduce sparsity while still capturing their potential influence on PET risk, buses and heavy trucks are merged into a single category of heavy-duty vehicles (HDVs). This new variable can be expressed as a binary indicator of presence/absence of HDVs. For similar reasons, Vans and Trucks classes are merged into a single variable named “goods_vehicles” and are, also, expressed as a binary indicator.
The statistics for motorcycles show that, similar to HDVs, they appear infrequently across most intersections, but their presence is more widespread and slightly more regular. Average flows are generally below 0.4 motorcycles per minute (≈20–25 per hour). Even at low frequencies, motorcycles are important to consider in PET risk modeling, since they can behave differently than passenger cars in interactions with pedestrians. The extremely low presence of motorcycles and bicycles suggests that both contribute negligibly to overall exposure in these intersections. Therefore, from a modeling perspective, motorcycle and bicycle counts are also likely to have limited predictive power due to their scarcity and could be better represented as a simple binary indicator.
The statistics for opposing traffic flow (the vertical road relative to the approach under examination) show marked differences across intersections. At some approaches, such as K05 (4-3) and K05 (2-1), opposing flows are very high, averaging over 26–31 vehicles per minute (≈1600–1800 vehicles per hour) with peaks exceeding 55–60 vehicles per minute. Similarly, K02 (2-1) also experiences heavy opposing demand (mean ≈ 25 vehicles/min, max 65). In contrast, intersections like K03 (2-1) and K02 (1-2) exhibit much lighter vertical flows, typically under 10 vehicles per minute. Intermediate patterns appear in K01 (2-1, 4-3) and K04 (1-4, 2-1), where averages range from 9 to 17 vehicles per minute.
The kinematic variables (average speed, acceleration, and deceleration) also highlight clear differences between high-volume arterial legs and lower-volume secondary approaches. The descriptive statistics for average speeds highlight significant variation across intersections and approaches. Most approaches operate within a range of 16–21 km/h, consistent with urban intersection environments for left turns, though some sites display distinct deviations. For example, K02 (2-1) stands out with the highest mean speed of ~28 km/h and maxima above 39 km/h, reflecting its role as a major arterial with faster through movements. By contrast, K03 (1-2) records extremely low speeds (mean ≈ 4.5 km/h). Other approaches, such as K01 (1-4, 2-1) and K05 (2-1, 3-2), maintain speeds around 20–21 km/h with moderate variability, while K04 (2-1) and K05 (4-3) operate at slightly lower averages (16–18 km/h).
For acceleration, typical values fall between 1.4 and 2.0 m/s2, with the strongest accelerations observed at K05 (2-1) (≈2.18) and K02 (2-1) (≈2.05), consistent with busy arterial conditions. Secondary roads such as K03 (1-2) and K04 (1-4, 2-1) show lower values (<1.1), reflecting slower recovery from stops. For deceleration, averages generally lie between −1.4 and −2.0 m/s2, again with arterials exhibiting sharper braking. K05 (2-1) (≈−2.08, min −3.58) and K01 (4-3) (≈−1.93) demonstrate the strongest deceleration, suggesting frequent abrupt stops in high-demand settings. By contrast, K03 (1-2) (≈−0.59) and K04 approaches (≈−0.2 to −0.8) show much gentler braking patterns. Overall, the combined kinematic analysis shows that arterial approaches are characterized by higher speeds, stronger accelerations, and sharper decelerations.
3.5. Variable Description
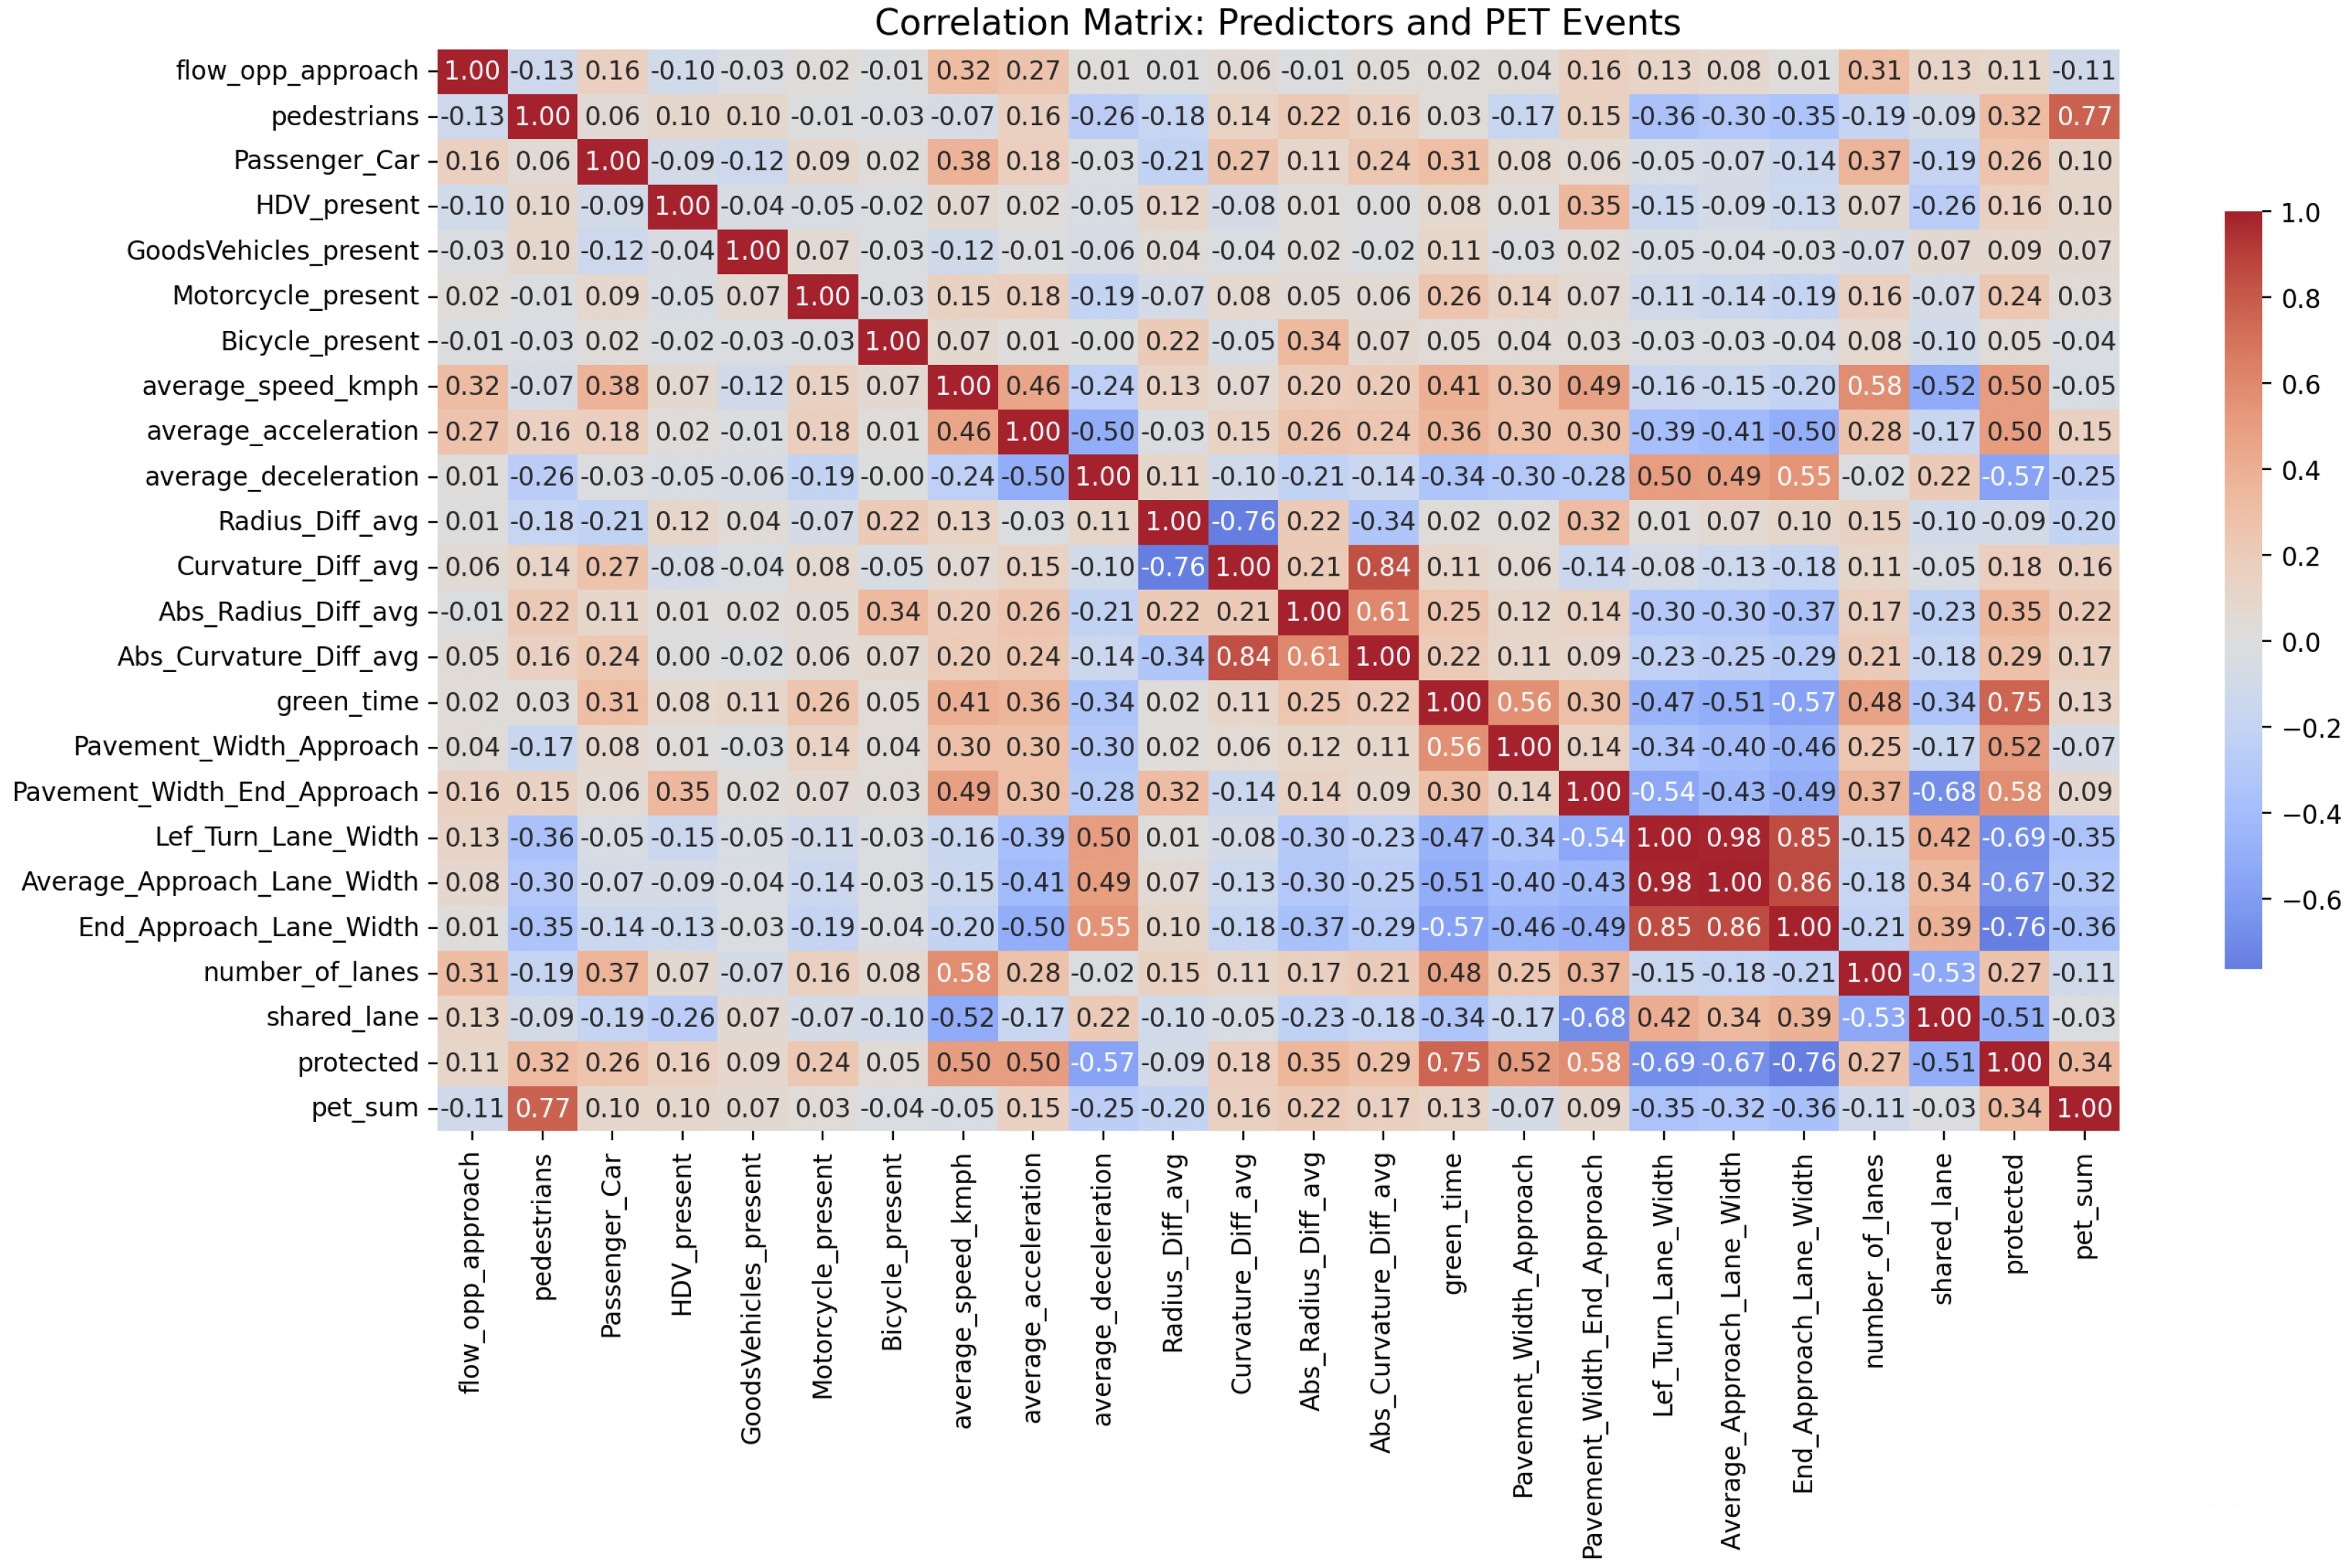
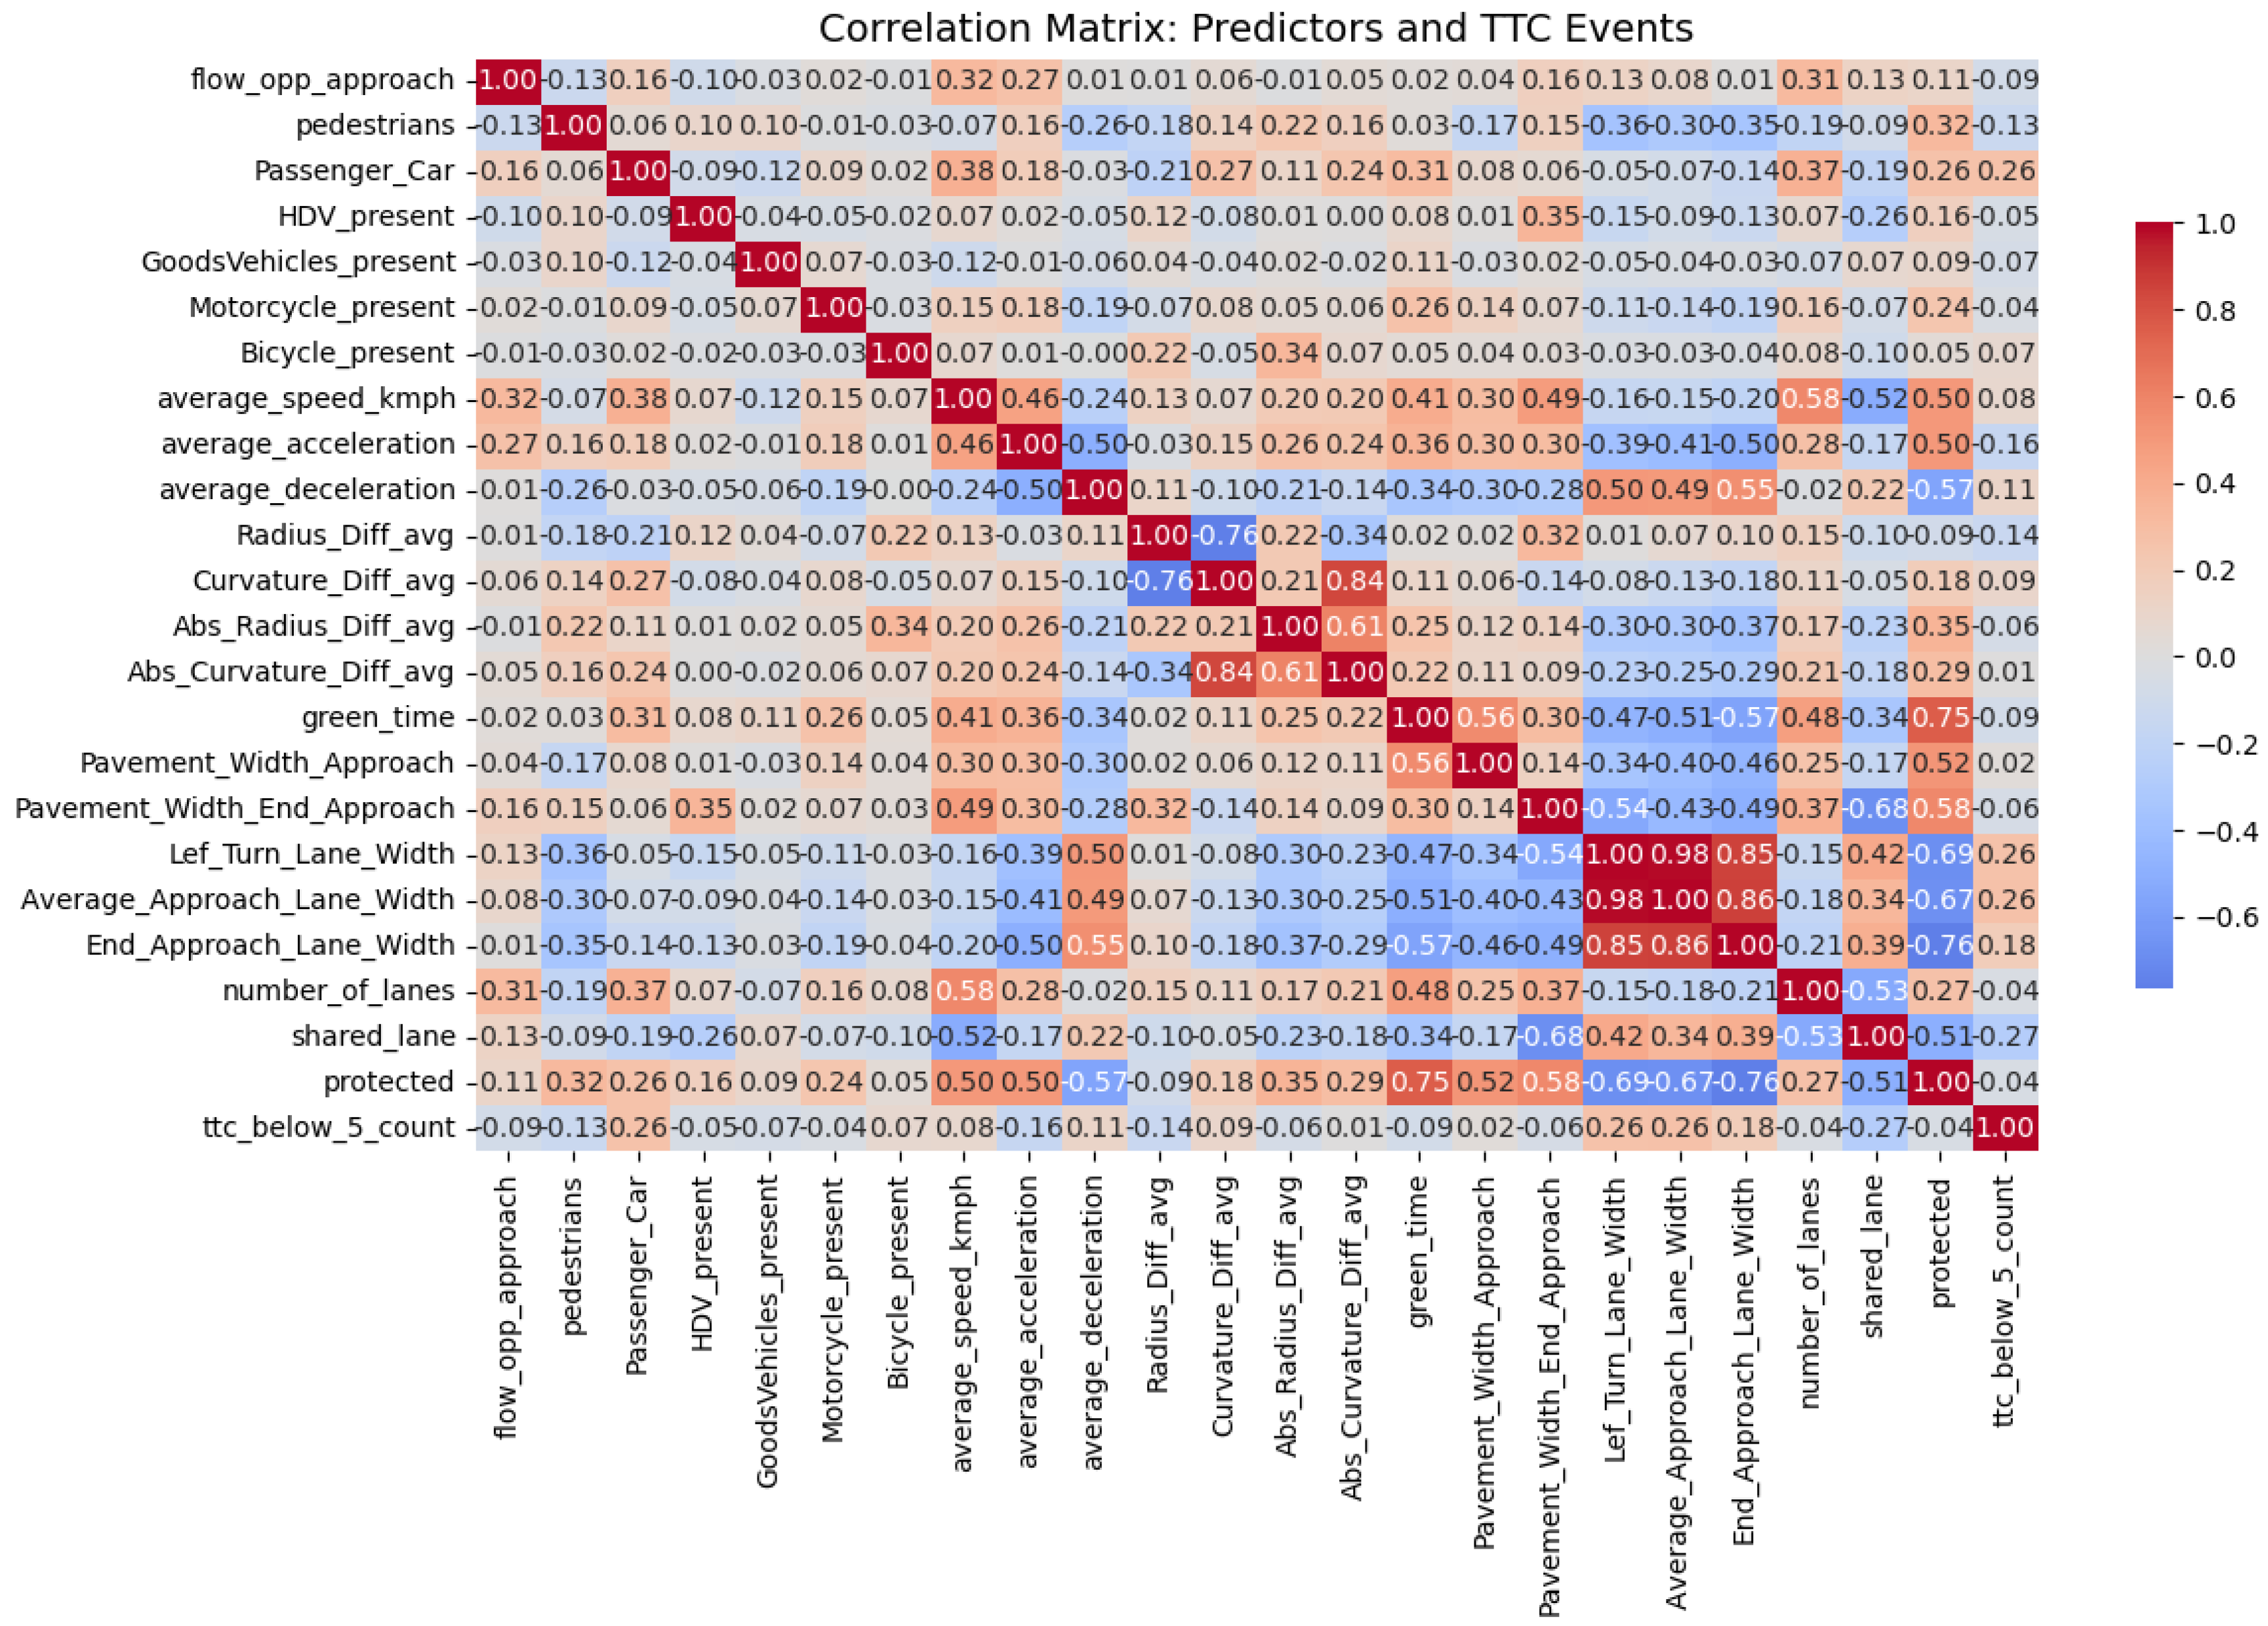
Model parameters and specifications were determined through an iterative process combining theoretical relevance and empirical testing. Candidate predictors were selected based on established traffic safety theory and prior literature on left-turn conflicts. Exploratory data analysis was used to assess variable distributions and pairwise correlations, guiding the application of log-transformations and the removal of redundant predictors. Final model specifications were selected based on dispersion behavior, goodness-of-fit, and predictive accuracy, ensuring both statistical adequacy and interpretability.
More specifically, to address distributional imbalances in the predictor variables, the skewness of all non-binary variables is examined. Several variables exhibited substantial positive skewness, including the average difference between the curvature of the ideal and actual trajectories (6.40), the number of pedestrians (2.45), the average difference between the radius of the ideal and actual trajectories (1.72), the opposing flow of the analyzed left turn (1.38), passenger car flow (1.32), and average acceleration (1.07), indicating long right-tailed distributions. To reduce skewness and stabilize variance, we applied a logarithmic transformation using log(x + 1). It is noted that exposure-related variables (such as pedestrian demand, opposing traffic flow, and left-turn passenger car volumes) were incorporated in the models as log-transformed predictors rather than offsets, as the objective of the analysis was to model conflict occurrence intensity per fixed temporal unit, and exposure in left-turn conflicts is inherently multi-dimensional.
Table 2 presents an overview of the model predictors and predictive variables, following the reorganization based on the descriptive analysis, and the logarithmic transformation of the dynamic variables. It is noted that PET and TTC were treated as count-based outcome variables aggregated over a fixed temporal unit, specifically a
1-
min observation interval, which constitutes the basic statistical unit of analysis throughout the study.
To identify and calculate the PET for each traffic conflict, a semi-automatic analysis was conducted in GoodVision software [
40] in order to ensure the highest accuracy and quality of the calculated time-events. PET is described as the amount of time that elapses between when a leading road user departs from a conflict point to the moment that the following road user approaches that point. For each traffic conflict, the critical timestamps for calculating the PET index were identified, recorded and then applied in Equation (3). The calculation of surrogate safety measures such as PET is sensitive to the pre-defined thresholds used for defining traffic conflicts, with several studies suggesting that a threshold value of 5 s for PET defines a conflict event [
19]. Therefore, a threshold of 5 s was used for the development of the overall database.
where
Although left-turn maneuvers are primarily associated with crossing or angular conflicts, the TTC formulation adopted in this study captured as well longitudinal interactions occurring during the execution of the maneuver, particularly during gap acceptance, vehicle following within the turn pocket, and clearance phases. In these situations, rear-end interactions between successive left-turning vehicles or between a left-turning vehicle and a yielding/conflicting vehicle remain relevant. Therefore, TTC was computed at each time step using the trajectory data extracted from the video feed. Under the assumption of constant longitudinal speeds over the prediction horizon, TTC represents the time (s) until a potential rear-end collision, given the current gap and relative speed.
For a following (ego) vehicle and a leader, TTC at time
was defined as:
where
It is noted that the TTC metric used in this study does not represent the full spectrum of left-turn conflict mechanisms but rather serves as a conditional surrogate safety indicator reflecting short-term longitudinal risk during left-turn maneuver execution.
3.6. Models
Predictors were initially grouped based on theoretical considerations related to traffic demand, vehicle kinematics, geometry, and control. Within each group, highly correlated variables were screened to avoid redundancy, and representative predictors were retained based on interpretability and relevance. Multicollinearity diagnostics (VIFs) confirmed that the final specifications were within acceptable limits.
The predictive analysis aims to model the frequency of pedestrian-vehicle interactions and vehicle-vehicle interactions measured through PET and TTC events, respectively. Since PET and TTC are count variables (non-negative integers, often with many zeros), regression techniques suitable for count data like Poisson and Negative Binomial were applied. The dependent variables correspond to the number of critical PET and TTC events observed within fixed 1-min intervals. A PET event was classified as critical when PET ≤ 5 s, while a TTC event was classified as critical when TTC ≤ 1.5 s, consistent with thresholds commonly adopted in the literature [
19].
Under the Poisson assumption, the mean and variance of the response are expected to be approximately equal. When this assumption is violated, Poisson regression may underestimate variability and produce biased standard errors. For this reason, Negative Binomial regression, which incorporates an additional dispersion parameter to relax the mean–variance equality assumption, was also considered as an alternative specification.
In a Poisson or Negative Binomial regression, the expected count of events
for observation
is modeled as presented in Equation (5).
where
= expected PET count for observation ;
= intercept;
= regression coefficient for predictor ;
= multiplicative effect on the expected PET count for a one-unit increase in .
Standard goodness-of-fit and predictive performance metrics were used for model evaluation (AIC, McFadden’s pseudo R2, MAE, RMSE, and dispersion). Next, two machine learning methods were applied: a Random Forest and a Gradient Boosting with Poisson loss. Prior to model training, a structured preprocessing pipeline was implemented. This included median imputation for numeric variables, and mode imputation for binary and categorical variables. To account for the hierarchical data structure, group-based cross-validation was employed using intersection-turning combinations as grouping identifiers.
Model hyperparameters were tuned through a randomized search procedure combined with 5-fold grouped cross-validation, ensuring robust parameter selection without overfitting to specific intersections. The models were then evaluated on a held-out 20% test set, with performance assessed using only MAE and RMSE. The reported MAE values are intended for relative comparison between alternative modeling approaches estimated on the same dataset and should therefore be interpreted in relation to one another rather than as absolute measures of predictive accuracy.
5. Discussion
The regression analysis of left-turn events revealed several traffic and geometric factors associated with Time to Collision (TTC) between vehicles. Increased pedestrian activity was negatively associated with TTC (β = −0.321), suggesting that the presence of pedestrians indirectly reduces vehicle-to-vehicle interactions, possibly because drivers behave more cautiously when pedestrians are nearby. In contrast, for Post-Encroachment Time (PET) events, the relationship between pedestrian volume and PET was positive, indicating that pedestrian presence increases the number of vehicle–pedestrian interactions.
The presence of passenger cars was positively associated with TTC (β = 0.238), suggesting that higher volumes of passenger cars contribute to more frequent vehicle-to-vehicle conflicts, whereas no significant relationship was found for PET events.
End-approach lane width had a strong positive effect on TTC events (β = 0.896), meaning wider lanes tend to increase the likelihood of vehicle conflicts. However, the relationship was negative for PET events (β = −0.49), implying that wider lanes may provide greater lateral separation between pedestrians and turning vehicles, thus reducing pedestrian-related conflicts.
Average speed was negatively associated with TTC (β = −0.105), suggesting that higher speeds corresponded to greater vehicle spacing and therefore less TTC events. Average speed, however, had no significant effect on PET, possibly because pedestrian interactions are driven more by crossing timing than by vehicle speed.
Shared lanes were negatively associated with TTC (β = −2.18), indicating fewer vehicle-to-vehicle conflicts where turning and through movements share the same lane. In contrast, shared lanes were positively associated with PET, suggesting that the mixing of movements increases the potential for vehicle–pedestrian interactions.
Finally, protected left-turn phases were positively associated with both TTC and PET. This relationship does not mean that protected phasing reduces safety; rather, it reflects that such phasing is typically implemented at larger or busier intersections with higher vehicle and pedestrian volumes, where both types of interactions are more likely to be observed.
The results of this study are generally consistent with previous research on surrogate safety measures at urban intersections [
25,
27,
30]. Studies focusing on PET-based indicators have highlighted the strong influence of pedestrian activity and interaction intensity on conflict occurrence, which aligns with the observed association between PET events, pedestrian demand, and shared or protected left-turn configurations. This supports the interpretation of PET as a surrogate measure primarily sensitive to pedestrian–vehicle interactions. The sensitivity of TTC to vehicle-related and operational variables is consistent with existing TTC-based and conflict-based analyses [
29]. By examining PET and TTC within the same empirical framework, the present study further confirms that different surrogate safety measures capture distinct conflict mechanisms and should therefore not be treated as interchangeable indicators.
6. Conclusions
This study investigated left-turn safety at urban intersections using field-derived surrogate safety measures, focusing on Post-Encroachment Time (PET) and Time-to-Collision (TTC) events extracted from video-based trajectory data. By integrating detailed geometric characteristics, traffic demand, signal control features, and kinematic indicators, the analysis provides a comparative assessment of the factors influencing pedestrian–vehicle and vehicle–vehicle interactions during left-turn maneuvers under real-world operating conditions.
The results demonstrate that PET and TTC capture distinct safety mechanisms and are influenced by different sets of explanatory variables. PET events, primarily associated with pedestrian–vehicle interactions, were best modeled using Poisson regression, reflecting approximate equidispersion in the data. Higher pedestrian activity and shared lane configurations were associated with increased PET occurrences, while wider end-approach lanes and higher average acceleration were linked to fewer PET events. In contrast, TTC events exhibited substantial overdispersion and were more appropriately modeled using Negative Binomial regression. It should be noted that model selection was conducted separately for PET and TTC outcomes based on dispersion diagnostics and overall goodness-of-fit. PET event counts exhibited approximate equidispersion (dispersion ≈ 1), for which Poisson regression provided the most parsimonious and best-performing specification. By contrast, TTC counts showed substantial overdispersion, and the Negative Binomial model was therefore retained as the appropriate formulation. TTC occurrences were mainly driven by vehicle-related factors, including passenger car volumes, lane widths, and signal control characteristics, highlighting the different operational dynamics underlying vehicle–vehicle conflicts.
From a practical perspective, the findings underscore the importance of context-sensitive design and control strategies for left-turn movements in urban environments. Shared lanes and protected left-turn phasing, while operationally justified in high-demand settings, are associated with increased interaction intensity and therefore warrant careful consideration in design and signal timing decisions. The contrasting effects of geometric features—such as lane widths—on PET and TTC further emphasize that interventions aimed at improving safety should be tailored to the specific type of conflict being addressed rather than relying on a single surrogate indicator.
Methodologically, this study illustrates the value of trajectory-based surrogate safety analysis using short observation periods, offering a viable alternative to traditional crash-based approaches in data-scarce urban contexts. At the same time, the analysis highlights important limitations inherent in video-based observational studies, including potential occlusion effects, limited sample size, and the absence of formal quantitative validation of trajectory accuracy. These aspects suggest that statistical significance should be interpreted with appropriate caution. More specifically, as with most empirical studies based on observational data, the present work is subject to certain limitations. Fixed-camera video data are inherently susceptible to occlusion effects, particularly in the presence of large vehicles that may temporarily obscure pedestrians or motorcycles. Although the video processing pipeline was carefully designed and quality-controlled, formal quantitative validation of calibration accuracy, positional errors, and speed estimation was not available. Trajectory quality was assessed through visual inspection and consistency checks against known geometric features, while PET timestamps were manually verified.
Future research should extend the proposed framework by incorporating larger multi-site datasets, enabling the use of hierarchical or mixed-effects models to explicitly account for within-site correlation and exposure normalization. Additional efforts should also focus on the systematic validation of trajectory accuracy and kinematic estimates, potentially through ground-truth data or complementary sensing technologies. Finally, expanding the analysis to include cyclist-related conflicts and alternative surrogate indicators would further enhance the understanding of left-turn safety in complex urban environments.





 ,
,