Abstract
There have been many attempts to model the flow of vehicular traffic in analogy to the flow of fluids. Given the evident change in distance between vehicles driving in platoons, the compressibility of traffic flow is inferred and, considering the reaction time-scales of the driver (human or autonomous), it is argued that this compressibility is increased as relative velocities increase—giving the lag in imposed redirection by the driver and the controller units a higher relative importance. Therefore, a supersonic compressible flow field has been opted for as the most analogous base flow. On this point, added to by the overall extreme similarities of the two above-mentioned flows, the non-dimensional group of the traffic Mach number MT has been defined in the present research, providing the possibility of calculating a suggested flow field and its corresponding shockwave systems, for any given obstacle ahead of the traffic flow. This suggested flow field is then taken as the basis to obtain trajectories designed for avoiding collision with the obstacle, and in compliance with the physics of the underlying analogous fluid flow phenomena, namely the internal supersonic compressible flow around a double wedge. It should be noted that herein we do not model the traffic flow but propose these trajectories for more optimal collision avoidance, and therefore the above-mentioned similarities (explained in detail in the manuscript) suffice, without the need to rely on full analogies between the two flows. The manuscript further analyzes the applicability of the proposed analogy in the path-planning process for an autonomous passenger vehicle, through dynamics and control of a full-planar vehicle model with an autonomous path-tracking controller. Simulations are performed using realistic vehicle parameters and the results show that the fluid flow analogy is compatible with the vehicle dynamics, as it is able to follow the target path generated by fluid flow calculations with minor deviations. Simulation results demonstrate that the proposed method produces smooth and dynamically consistent trajectories that remain stable under varying traffic scenarios. The controller achieves accurate path tracking and rapid convergence, confirming the feasibility of the fluid-flow analogy for real-time vehicle control.
1. Introduction
Theories for autonomous vehicle control have been under intensive development during the past few years. Smart future highways are supposed to be compatible with autonomous vehicles, which can communicate with each other and obtain preview information about the road and traffic conditions [1,2,3,4]. Although it would be ideal to establish a continuous connection between vehicles, for safety issues when dealing with unforeseen problems and also due to difficulties in the transition to such a fully automated environment, there is a need for the development of robust autonomous driving theories in which the virtual driver can adapt itself to sudden changes in the surrounding objects’ locations. Many different path-planning strategies have been introduced to facilitate automation of the driving task [5,6,7,8,9,10]. Among the path-planning studies, those that consider obstacle-avoidance scenarios are the most generic ones with the capacity to be applied to many driving conditions. An obstacle might be defined as another vehicle or any object located in the desired path of motion of the vehicle. Path planning is usually regarded as solving an optimization problem with the objective of optimizing certain measures, such as energy efficiency, passenger comfort, and safety. The path-planning problem was originally introduced as part of robotics applications, especially in the field of mobile robot control [11,12].
For vehicles moving at highway speed, a proper target path to ensure safe travel is one taking into account the limited available tire friction for directional vehicle control, as well as achieving smooth directional changes to make the target path physically feasible. Also, the information on the desired path must include a target velocity profile to be fed into an autonomous vehicle control algorithm. Gonzalez et al. [11] categorized the path-planning algorithms into four main groups: (i) graph search-based planners, (ii) sampling-based planners, (iii) interpolating curves, (iv) numerical optimization methods. In a graph-based search algorithm, the posture of the vehicle may be translated into a discrete grid and the objective of path planning is to find a feasible sequence of cells in the grid to be followed by the vehicle. Such a problem requires a smoothening procedure to make the final desired path of motion feasible and non-jerky for the vehicle [13].
In more recent studies, Li et al. [14] combined an improved RRT* with an enhanced Artificial Potential Field method to achieve faster, smoother, and more reliable path planning on curved roads. Their fusion algorithm reduced random sampling and avoided local minima, improving efficiency and obstacle-avoidance performance.
Wang et al. [15] proposed the APG-RRT algorithm, which uses adaptive guide paths and obstacle expansion to enhance sampling efficiency and safety in confined environments. Simulations and real-vehicle tests showed smoother, more efficient paths than standard RRT and RRT*. Yu et al. [16] introduced the Real-Time Double-Tree RRT (RDT-RRT) framework, which enhances the classical RRT by integrating Hermite interpolation and CNN-based dynamic collision detection for smoother, real-time trajectory generation. The method significantly improves convergence speed and path smoothness while maintaining computational efficiency, achieving robust performance in both static and dynamic obstacle environments.
Lin et al. [17] proposed an enhanced A* algorithm incorporating an improved heuristic function and curvature-based smoothing to generate more accurate and dynamically feasible paths for autonomous vehicles. The approach reduces computation time and eliminates unnecessary waypoints, achieving smoother and safer trajectories in complex road environments.
Zohaib et al. [18] proposed the intelligent follow-the-gap method (IFGM), an improved obstacle-avoidance algorithm capable of handling complex U- and H-shaped environments. By integrating features of the intelligent bug algorithm and the follow-the-gap method, IFGM enables smoother and shorter trajectories while avoiding local minima and ensuring fast convergence. This approach highlights the ongoing development of geometry-aware path-planning methods that enhance safety and efficiency in autonomous navigation. Zohaib et al. [19] presented the intelligent bug algorithm (IBA), a navigation method for mobile robots that enhances the traditional bug algorithm by incorporating dynamic sensing and adaptive decision-making to efficiently handle complex obstacle environments. The algorithm demonstrated faster convergence, smoother trajectories, and reduced travel distance compared to classical approaches, confirming its potential for real-time autonomous navigation applications.
Although, as stated above, several perspectives have been treated in path planning for autonomous vehicles, there has not been much focus on minimization of traffic disruption during emergency obstacle-avoidance maneuvers. This condition is particularly significant when an obstacle is located on a highway with a large number of vehicles traveling at relatively high speeds. To investigate such a condition seeking feasible solutions for the desired path of motion, we establish an analogy between the motion of the vehicles and that of fluid particles. The inherent smoothness in the motion of a fluid and the minimized disturbance along the way motivates us to establish such an analogy and to investigate how adoptable it is for vehicle path-planning and path-tracking applications. Also, in this way the minimum information is required from downstream for fluid particles to maneuver around an obstacle.
Going through the literature on insights taken from the fluid dynamics discipline and applied to that of artificial flows such as traffic, one comes upon distinct approaches. Jabari et al. [20], as well as Bonzani and Mussone [21], present stochastic approaches towards the flow of traffic, while Hoogendoorn et al. [22] propose that the pedestrian flow falls into the category and criteria of continuum media and present a set of analytical modeling schemes for a distinct and wide spectrum of microscopic to macroscopic phenomena, as well as a theory on the local route choice modeling [23,24,25,26].
Bellomo et al. [27] present the common chain between driver models and overall traffic flow phenomena as a hydrodynamic case, whereas a more flow-oriented study of the specific case of freeway traffic flow is addressed by [28]. Furthermore, Cho et al. [29] present a self-consistent multi-layer model for traffic flow.
On obstacle-based matters such as incidents inside the flow of traffic, Baykal-Gürsoy et al. [30] provide a fluid flow modeling approach. Marques and Méndez [31] compare two kinetic theories of vehicular traffic flow, namely, Chapman–Enskog expansion and Grad’s moment methods. And the discrete velocity kinetic model is addressed by [32].
Shi et al. [33] discuss the feasibility of defining such kinetic theory parameters as pressure, in the framework of the lattice-Boltzmann model, and reach a working definition of traffic equilibrium pressure, which is arguably the fundamental requirement in implementing fluid flow governing equations in models dealing with vehicular traffic, such as the current research, whereas Ma and Cui [34] tackle traffic density distribution based on finite element principles. Li et al. [35], however, introduce the parameter traffic viscosity as a function and by-product of a speed variation-based model.
Developing the case to include an urban transportation network and applying traffic flow on its roads has been simulated by Ugnenko et al. [36]. And extending the premise to a long and crowded route, Lighthill and Whitham [37] establish the theory of kinematic waves for the flow of traffic. The propagation of shockwaves is introduced for the case of highway traffic in [38]. Payne [39] models traffic flow and presents insights towards its control. De Angelis [40] considers the phenomena of a higher-complexity case and presents a nonlinear model for traffic flow. And finally, Zhang [41], considering the sub-phenomena as a viscous vehicular flow, tackles the driver’s memory in analytical modeling of the traffic.
Finally, it should be noted that approaching vehicular traffic flow, with its underlying principles, can be tackled from the viewpoint of complex high-degree-of-freedom systems with tendencies towards self-organization and pattern formation. These systems are traceable in the literature, among which the works of [42,43,44] are worthy of mention.
In this paper, we concentrate on the path-planning problem for obstacle-avoidance maneuvers, in contrast to full domain traffic modeling, by creating an analogy between traffic flow and the dynamics of supersonic, compressible flow. By doing so, we seek a physically meaningful solution with the minimal upstream information requirement, which is equivalent to minimizing the disturbed traffic flow ahead of unforeseen obstacles for a certain vehicle during the maneuver using a computationally inexpensive approach with real-time applicability benefits. The proposed desired path is then verified to be consistent with vehicle dynamics through simulations using an autonomous driving algorithm.
The present manuscript is organized as follows: Section 2 presents the methodological grounds for the trajectory planning algorithm. First, the analogous nature of vehicular traffic and supersonic compressible fluid flow are discussed. Then the principles and governing equations of the relevant fluid flow and its corresponding shockwave/expansion-fan systems are presented. Next, the case under study is presented, followed by the steps in solving the algorithm for the flow field and therefore the proposed trajectories for collision avoidance. Path planning based on the limitations of the dynamics and handling of the vehicle in following the target trajectory is also presented at a fundamental level, to be used later in the manuscript analyses. Section 3 presents insights into vehicle dynamics and control, and afterwards, the results of the study are reported and discussed in Section 4.
2. Methodology
There are inevitable analogies between a cluster of vehicles driving separately on a road (i.e., traffic flow), and a certain regime of fluid flows, namely, compressible flow. Considering two consecutive vehicles driving at a given distance, and with equal velocities, the distance between them will remain constant at all times, including if they embark on a deceleration, for instance, a sudden brake due to an unforeseen obstacle ahead on the road, at the same time. However, in reality, the second vehicle decelerates with a slight delay, due to the time required for the driver to obtain and process the information regarding the obstacle and the supposed alteration in the velocity due to latency in the brake system mechanism. This is the reason for the increase in the spatial concentration of vehicles whenever a deceleration is needed, such as when reaching a construction region on the road with a lower local speed limitation, and a decrease in the concentration when an acceleration occurs such as after the light turns green and all cars start, with approximately similar acceleration magnitudes but at slightly delayed (incremented) starting times.
Now, for the case of the fluid flow, consider the flow of water in a riverbed. By putting a stone of considerable size in the middle of it, the “information” regarding the existence of such an obstacle, leading a change in the geometry and dynamics of the fluid flow, emerges in the only form readable for flow—that is, pressure wave fronts—and travels with a state characteristic property of the medium, i.e., the speed of sound. Given the conventional intuition one has of water flow in a shallow river, the upstream bulk of the fluid, provided with such information on the obstacles and geometry of the road ahead, adjust themselves to undergo the path-lines with such dynamics corresponding to the conditions downstream. This is the case for all upstream particles knowing what the condition in front of them is—that is, having received the so-called information and acted upon it simultaneously. Hence, the concentration of the flow particles remains untouched, which corresponds to an incompressible flow. However, by increasing the flow velocity to one comparable with that of the information transfer established above, the bulk of the flow has a reduced reaction time which leads to an accumulation of particles in the vicinity of the forefront of the obstacle; this is called a shockwave in fluid dynamics terminology. The unaware bulk of the flow collides with the obstacle with its non-adjusted velocity, as if there is no obstacle. The density increases and velocity consequently decreases—hence the term compressible flow. Analog to the latter case, the comparable speed of the traffic with the reflexional speed of the drivers is the cause of the change in the distance between cars, although the acceleration rate is considered identical in all of them.
Given the above analogy, one could argue that a whole set of phenomenological and analytical descriptions of the kinematic behavior of traffic flow could be modeled through analog derivations of the compressible flow governing equations. Apart from the low computational burden of such an analysis, which makes it attractive for real-time implementation, the present methodology follows the naturally smooth fluid dynamics behavior. Upon successful establishment of the analogy, the resulting target path inherently ensures minimum disturbance in the traffic flow as well as minimum velocity change during the maneuver pertaining to optimal energy consumption. The methodology also demands minimal data from the downstream and as is described in the following sections, the resulting target paths for different vehicles do not automatically intersect with each other since they are an inter-consistent set of flow streamlines. Therefore, the problem needs to be solved only once for each obstacle on the road, i.e., a global solution.
Figure 1 summarizes the overall blocks of the action sequences starting with the emergence of the obstacle up to the final trajectories proposed to the vehicle control system and modified based on its dynamic limitations to follow discontinuities in the trajectories and the corresponding velocity magnitudes assigned to each point on them. The result is then directly communicated to the actuators in charge of handling the assigned maneuver for collision avoidance.
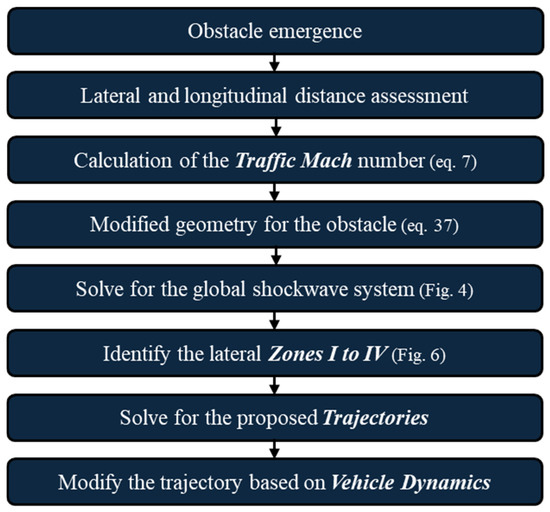
Figure 1.
Block diagram of the sequence of events throughout the collision avoidance trajectory proposition in the present work.
2.1. Governing Equations in Analogy to Fluid Flow
2.1.1. Compressibility
As a non-dimensional measure for categorizing flows in terms of the comparability of the speed of sound to their velocities, the Mach number is introduced in aerodynamics as
Needless to say, M ranges from zero corresponding the theoretical extreme, and non-existent in the case of incompressible flows, to infinity as the flow velocity grows, with the critical point of M = 1 dividing the spectrum into sub- and supersonic flows.
The speed of sound is, as mentioned above, an indicator of the local compressibility of the fluid in response to the induced pressure gradients.
where for the case of traffic flow, one could define the density or the longitudinal concentration of the vehicles in one lane as the reverse of characteristic length scale or the distance between two vehicles.
In the present research, an analog measure has been derived for the goal of quantifying the compressibility of traffic flow. Considering the same defining principle as that of the Mach number, in the case of traffic flow, the ratio between the flow velocity and the reaction speed of the driver/vehicle is to be considered. Reaction speed, although commonly used in conversational language, is not an accurate core parameter for the delay effect, similar to “reflex time”; since in reality there is no distance in the driver’s movement, by the act of decision-making a velocity can be defined. In order to keep the non-dimensionalized nature of the corresponding Mach number for traffic (hereafter denoted MT), the reverse ratio of the above-mentioned time, i.e., the transfer time of the data from downstream of the flow in the fluid mechanics sense, to the characteristic time-scale of the problem at hand is used:
where MT can be defined locally for the vehicles, as the Mach number can be for flow fluid bulks; however, the characteristic time is obtained using the distance between the two consecutive vehicles, which in case of a sudden traffic velocity change will be the distance between the vehicle under study and the obstacle ahead on the road and the instantaneous velocity of the vehicle.
The corresponding downstream to upstream data transfer time can be considered as the sum of distinct terms.
where the first term is the delay, by which the driver starts reacting to the upcoming obstacle, and the second term is the time required to decelerate with the maximum braking acceleration until the vehicle fully stops. Driven by the kinetics of the braking deceleration, the maximum acceleration would be defined as follows:
Hence, the ultimate definition of the traffic Mach number is derived:
This statement for the traffic flow Mach number is influenced under environmental conditions. For instance, low-visibility conditions will result in increasing the driver delay time, whereas a wet road will decrease the maximum braking acceleration and therefore increase the deceleration time. It is also worth mentioning that based on common safety considerations, the following statement could be advised as a rule of thumb in many standards for human drivers.
In a practical control framework, the traffic Mach number () may be computed online using real-time sensor data. The parameters v and L are obtained from the vehicle’s speed sensor and range-detection system (e.g., radar or LiDAR), while τ, µ, and are known system or environmental parameters. Hence, can be updated continuously to characterize the instantaneous flow regime of the traffic and determine the appropriate trajectory family (shockwave or expansion-fan configuration) for collision avoidance. This capability enables adaptive path-planning behavior in real-time autonomous driving implementations.
In the present work, we consider the reaction delays of both a human driver and an autonomously driven vehicle to compare the resulting paths of motion and to verify how the proposed analogy sits in line with our common-sense expectations regarding a quick versus a slow driver in terms of reaction time. It also shows how the selection of a reaction delay value affects the solution of the path-generation algorithm as well as the path-tracking performance.
As far as this study is concerned, a constant time factor for the driver’s reaction is sufficient to formulate the non-dimensional velocity expression and establish the analogy. The nature of the problem here requires us to focus on straight driving conditions with the driver reaction being defined as full braking. In such a case, normally, there is no preview effect to be considered, i.e., the driver does not receive any information regarding the future of the road/traffic conditions.
A realistic model of the braking action, including both the driver’s reaction delay and the latency in the brake system, which may be simplified to a first-order transfer function with a time constant as that starts with a delay from the detection of the obstacle (Figure 2).
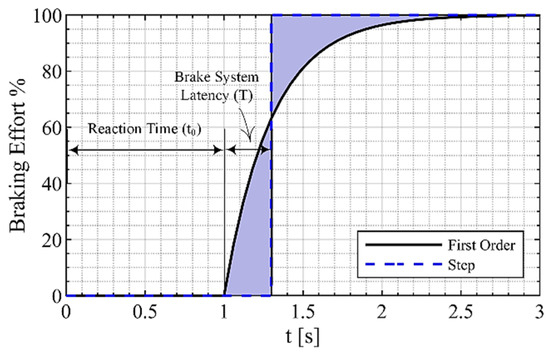
Figure 2.
Reaction and braking model.
The human driver’s reaction dynamics have been studied for many years and different modeling approaches have been introduced in the literature [45,46]. The delay incorporates the decision and reaction time of the driver which is assumed to be equal to for an average human driver [47].
On the other hand, for an autonomously driven vehicle, which is the main area of application of the present methodology, a reaction delay includes the time it takes for the system to complete one cycle of environment detection through measurements, path planning (decision-making), and sending control signals to the vehicle actuators, where the path-planning phase is the bottleneck of the process in terms of calculation time. Since the use of autonomous vehicles has not been widely industrialized yet, it is not easy to obtain a benchmark for this reaction delay, but advanced methods in the literature have achieved path-planning solutions in times as short as 20 milliseconds in the worst case [48]. For the sake of making a reasonably safe reaction delay assumption for autonomously driven vehicles, we may consider a safety factor of 10 to account for different computing powers and environmental factors, which may extend the above reaction time. Thus, a reaction time of is assumed for the average autonomous vehicle.
The magnitude of depends on the brake system dynamics which may be approximated as considering the brake fluid pressure generation, application of normal force on the brake rotors, and actual brake torque generation [49], which is assumed to be proportional to the brake force and, consequently, the acceleration of the vehicle.
Note that the area under the exponential curve in Figure 2 is equivalent to that of a step input curve starting at time as shown in the plot. Also, it is worth mentioning that the reaction time shown in the figure is for a human driver and would be around 5 times less for the case of an autonomous vehicle and the whole plot would shift to the left.
Thus, assuming proportionality between brake torque and vehicle acceleration, we may consider an equivalent full braking action occurring in in the case of a human driver and in the case of an autonomously driven vehicle after obstacle detection. Hence, there exists a time-dimensioned parameter inherent to the driver/vehicle system which enables us to establish the analogy. It is reasonable to use the above as in the expression of in (7) to correlate the physical phenomena of vehicle braking to the compression of fluid particles.
Although it is possible to consider subsonic traffic flows, most of them are compressible. This is perfectly intuitive, as the incompressibility of a subsonic vehicular flow demands a constant distance between two vehicles following each other on a single lane. Considering all dynamic conditions of the vehicles to be identical, this is only realizable through a response delay of zero duration as the second vehicle mimics the dynamics of the front vehicle. Otherwise, there will be a time/location delay in the behavior of the second vehicle, which is to be witnessed in most accelerations and decelerations seen in the traffic flow. Even in trivial maneuvers, such as starting to accelerate after being stationary at the traffic light or coming to a full stop while moving in a queue when the light turns red again, changes in the distance between consecutive vehicles are observable—hence the notion of compressibility and resemblance to the fluid flow field considered in this manuscript.
Tracing the underlying logic behind a “walking-pace” traffic zone in urban areas, the traffic Mach number proposed in this study has also been designed and checked to fulfill the subsonic conditions in exact compliance with the walking-pace velocity range (e.g., below 7–10 km/h in Germany). This is the velocity—Mach number flow regime—in which the traffic flow is incompressible; this means that the accelerations of the vehicles in front of the ego vehicle are mimicked with enough hesitancy and that the distance between said vehicle and the one coming to a full stop, or a child running suddenly into the road, could be kept constant—hence the premise of incompressibility.
In summary, all practically meaningful vehicular flows in streets and highways are already compressible, as the distances (and thereby the density of the distribution of the vehicles) are not constant and change with a time delay in response to the changes exerted ahead on the road. And their corresponding Mach numbers are also calculated to be above unity, which implies supersonic flow fields.
2.1.2. Normal Shockwave
The most basic form of supersonic flow (M > 1) interaction with blunt body obstacles is the formation of a normal shockwave. For the primary case of frictionless 1D flow with no added heat, the fundamental conservation equations of mass, momentum, and energy are written as follows:
The equation of momentum will take the following additional term in case of surface friction:
In contrast, the added heat is added to the energy equation in cases where the adiabatic assumption does not hold.
As the shockwave is an infinitesimally thin layer of less than 10 molecular collisions, a sudden jump in flow and thermodynamic properties is witnessed from a macroscopic point of view. Using the starting point of these fundamental equations, the state of flow can be obtained by the derived relations. Equations (14)–(18) present the relative changes in Mach number, density, pressure, and temperature, respectively, when the flow with properties denoted by subscript 1 crosses the corresponding normal shockwave dictated by the upstream flow properties.
It can be shown that M2 will be smaller than M1, corresponding to the subsonic flow regime. Furthermore, the flow velocity drops, leading to an increase in pressure, density, and temperature, consequently.
The gas dynamics parameter of the Poisson constant (γ), which is also known as the ratio of specific heats, is defined by (19) in its conventional form, as well as the kinetic theoretical definition given by (20).
where the parameter f is equal to 3 for monatomic gases and 5 for diatomic ones, leading to values of 5/3 = 1.66 and 7/5 = 1.4 for the Poisson constant, respectively.
2.1.3. Oblique Shockwave
Should the supersonic flow undergo a slight directional alteration due to a ramp-formed obstacle ahead in its path, a similar phenomenon known as an oblique shockwave will occur, adjusting the flow direction to that of the ramp. Equation (21) gives the global dependency of the shock angle on the ramp angle and upstream Mach number.
As the flow crosses through the oblique shockwave, only the normal components of the flow sense the existence of the shock and alter their quantities in response to it. Given this condition, once the normal components of the velocity and their corresponding Mach number have been calculated through the equation
the same procedure can be performed as for the normal shockwave, in order to obtain the properties of the flow behind the shock. These are given in Equations (23)–(27).
It is worth mentioning that as a consequence of the projection procedure, the obtained velocities are also the components normal to the oblique shockwave and should be converted back to the whole velocity vector, as well as its corresponding Mach number.
Considering the derived equation, the Mach number after an oblique shockwave, although reducing towards a value of one, remains above unity—still a supersonic regime.
2.1.4. Reflection from a Solid Boundary
As the first phenomenon relevant to the geometry of the case in the current research, one should pay attention to the reflection of a shockwave landing on a solid boundary. Among many conditions, this may happen in an internal flow case, where the oblique shockwave formed due to a ramp on one side of the channel reaches the other boundary of the flow. As the component of the velocity normal to the shockwave has been reduced in magnitude, the flow direction is turned towards the shockwave. This causes the flow to consider the formerly parallel second side of the domain, as another ramp, which will re-orient the flow due to its rigidity. Therefore, another oblique shockwave will be formed in the landing point of the former shock on the secondary side of the channel (Figure 3a). Although these two shockwaves are basically individual, this situation is called reflection of the shockwave in the literature due to the dependency of the second shock on the first one and the inevitable similarity of the geometry of this phenomenon to that of optical reflection.
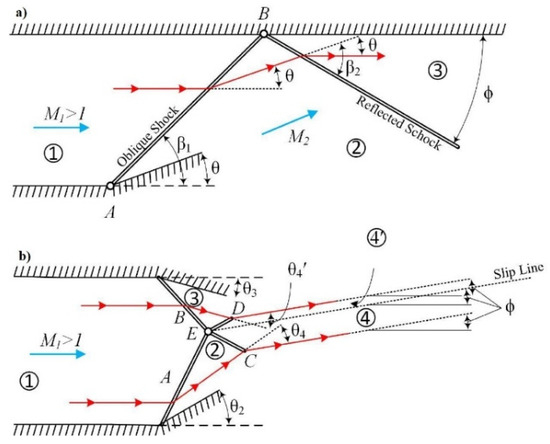
Figure 3.
Shockwave interactions. (a) Shockwave reflection. (b) Shockwave-to-shockwave interaction.
2.1.5. Intersection of Shocks of Opposite Families
In another case relevant to this research, two shockwaves of opposite families, i.e., initially originated from different obstacles, may occupy a single point in space or, as is usually said, collide with each other. Regardless of the situation of the two shocks, the flow before and after each of them, and the point at which they have collided, the flow after that point will act as a monodirectional uniform flow with a certain direction obtained through the following statement. The flow field after each of the primary shockwaves should undergo a new shockwave in order to turn the flow direction towards that of the mentioned single outflow (slip line), such that the pressure obtained by each of the conversions to this new flow direction should be identical, leading to a stable slip line fixed as a function of the geometry (Figure 3b).
2.1.6. Prandtl–Meyer Expansion Fans
As the opposite condition against compression shockwaves, a supersonic flow can undergo an expansion fan; this is historically known as the Prandtl–Meyer expansion fan when the flow turns around a convex corner or curved surface. The expansion waves (i.e., the fan) are composed of an infinite number of Mach waves, starting from the Mach line corresponding to the upstream Mach number, until the last one, namely, the Mach line corresponding to the downstream Mach number regarding the position of the corner.
In contrast to the shock relations, the final static properties after the expansion fan are not only functions of the upstream Mach number but also of the downstream.
The downstream Mach number is dependent on the upstream Mach number and the turn angle.
where υ(M) is the Prandtl–Meyer function, also known as the Prandtl–Meyer angle, and is the angle through which a flow with a free stream Mach number equal to unity should turn over a curve or a sharp corner to reach the desired Mach number (M), noted in the argument of the υ(M) function. This could also mathematically be proven as
or
By having the Mach number on the initial surface (i.e., upstream Mach number), the angle υ(M1) could be calculated using (36), and by substituting the value for the corner angle (θ), the Prandtl–Meyer angle for the second surface, υ(M2), could be obtained. And finally, by a reverse procedure of the above equations, the downstream Mach number, M2, is calculated.
2.2. The Case
As a summary of the above-discussed analogous behavior of the vehicular traffic and supersonic compressible fluid flows in this manuscript—and as the origin and basis of this research—we argue for two main aspects of the vehicular traffic flow:
- (i)
- The longitudinal distance between cars driving in a lane, as well as the lateral distance in a platoon of vehicles, is extremely variable. This even happens in extremely trivial maneuvers, such as coming to a full stop or starting to move from a full stop. There is an inherent time-scale associated with the velocity variations, which is rooted in driver (either human or autonomous) delay, and the centralized control systems, including the actuators, etc. This time-scale is argued in the paper to be a major reason behind the emergence of this distance (longitudinal) variation. Given this distance variation, the flow is considered kinematically compressible.
- (ii)
- Following the observations, the higher the relative velocities (i.e., shorter flow time-scales), the higher the relative importance of the above-mentioned time-scale, and therefore, similar to supersonic fluid flow where the information regarding the presence/emergence of an obstacle is back-propagated more slowly than the velocity at which the upstream constituents of the flow field are moving towards it, this disparity of the time-scales lead to the above-mentioned compressibility. It is argued that below a certain velocity the traffic flow can be approximated as incompressible. We discuss and show that this is the velocity at which the retardation time-scale is negligible, compared to the flow time-scale, and therefore vehicles moving in a line can come to a full stop with approximated incompressibility, i.e., stopping behind a vehicle coming to a full stop, without reducing the distance to it. This is exactly the velocity limit used in urban traffic rules for driving in pedestrian zones, where sudden obstacles need to be avoided incompressibly, e.g., children running in front of a moving vehicle, where an immediate decision (with no delay and a zero-retardation time-scale) should be made, commanded to the actuators through the control loop (at both human and machine levels). Hence the notion of a supersonic regime.
Table 1 summarizes the similarities and differences between the vehicular traffic and supersonic compressible fluid flows. Both cases show compressibility, which is the core attribute needed in the present research. Neither of the cases have significant viscous dissipation effects in the flow field, and they deviate in the macroscopic manifestations of the continuous trajectory. The flow field passing through a shockwave undergoes an abrupt (yet on the molecular scale, continuous) change in direction and velocity magnitude, yet a modification on such trajectories should be performed based on the control limitations of the vehicle to make the maneuver achievable for a real vehicle.

Table 1.
Analogies between vehicular traffic and compressible supersonic fluid flows.
The case being considered in this work is composed of two vehicles moving separately down the road. They are not necessarily in the same lane, nor on the same path, means they have zero relative lateral displacement, as the compressible flow fundamentals, and hence the methodology being used in analogy to that, fail to explain the very streamline going directly through the stagnation point of the body. There is a singularity in the solution, where the gas dynamics solutions do not hold. Pragmatically, this makes the method suggested here no less applicable, since this absolute zero lateral displacement actually never happens in the real case of vehicles driving on a road, and even if it is considered possible to happen, just a simple random number could count as a coin-flip for choosing to take the left solution or the right one at the stagnation point. It is important to note that since the lateral displacement definition in case of a fluid particle refers to the distance between a point mass and the obstacle, we need to define a safety margin to account for the width of the approaching vehicle as well as an additional safety space between the vehicle and the obstacle. This safety margin envelope is shown in Figure 4 and it may be easily accounted for by adding to the width of the obstacle to shift the trajectories further away from the obstacle.
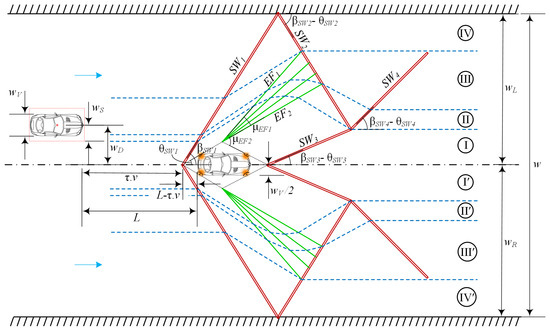
Figure 4.
The case, including the wedge barrier around the actual obstacle, the following vehicle, and solution zonal separations.
The scenario is developed further as the first vehicle stops instantaneously and is translated as a stationary obstacle for the second one. In order to morph the rather blunt body geometry of an actual vehicle, and turn it to a gas-dynamically valid geometry, namely a wedge, the following calculation could be utilized for the wedge half angle. Starting at this point, the actual vehicle is not of interest to us, as the collision is to be avoided with respect to the double wedge as the mathematical domain obstacle of the case.
It is correct that higher Mach numbers lead to a smaller obstacle (ramp) angle. However, since the lateral displacement in all cases is roughly equal to the width of the lane, and thereby constant, this smaller angle only translates to an earlier (in time and space) start of the obstacle-bypassing maneuver, which is even advantageous from the safety point of view. This is also observed in the intuitive behavior of human drivers, as a vehicle aiming to overtake a slower moving vehicle/obstacle starts the overtaking with a higher distance from said vehicle in cases where the relative velocity is higher.
This could also be explained in terms of the alterations that the wedge angle formed around the obstacle undergoes due to the changes in the kinematics of the case, e.g., the velocity of the vehicle aiming to avoid collision. However, since the lateral displacement required to stay just far enough from the obstacle to avoid colliding with it by a safety margin is constant, the higher the velocity and thereby the higher the Mach number, the lower the half-wedge angle, which with constant lateral displacement manifests as an earlier start of the bypass maneuver.
At this point in time, based on the above-mentioned lateral displacement (WD), the second car falls into one of the four zones (Figure 4) characterized briefly as follows, describing the conditions the vehicle undergoes in each zone.
- Zone I—Passing through the first shockwave (SW1) propagated at the leading edge of the wedge, aligning with the upper left-hand side of the wedge, reaching the top corner, going through a full set of Prandtl–Meyer expansion fans (EF1 to EF2), turning to flow parallel to the upper right-hand side of the backside of the double wedge, going through another shockwave (SW3) introduced to the flow field at the trailing edge of the geometry, and being dictated to flow parallel to the main road axis downstream.
- Zone II—The same as Zone I until the expansion fan, but facing the reflection of the first shockwave (SW2) propagated off the road boundaries, as discussed in earlier sections, and then undergoing a second shockwave (SW4), designed for alignment to the main road axis.
- Zone III—The same as Zones I and II, until entering the expansion fan, but facing the reflection shockwave (SW2) before going through the entire expansion region, and then facing the last aligning shockwave (SW4).
- Zone IV—Simply going through SW1 and its reflection off the upper boundary (SW2), which is the minimum required system for re-aligning to the main road axis.
It is noteworthy that the very same configuration is to be observed on the right-hand side of the road, with respect to the travel direction, given the lateral displacement falls into the negative values. And the fact that the obstacle vehicle is not located centered to the road does not change the shockwave and expansion system and zonings drastically; however, the width of the zones is subject to alterations.
Another mentionable event happens at the conjunction of SW2, SW3, and SW4. In a more physically accurate case, a fourth shockwave should happen as a result of the interactions of two shocks of opposite families (SW2 and SW3), and the slip line between the flow regions leaving these two shockwaves is not supposedly horizontal. Consequently, this united system of flow will reflect off one of the boundary surfaces, with its direction being non-horizontal, and the reflections will carry on undergoing interactions with the residual expansion fans and shockwaves of the upper field until the intensity of the shocks approaches zero, as well as their influence on the flow, leaving the downstream flow horizontal with no further residuum of the submerged body. However, as in the current research the main goal is not to follow the flow field precisely downstream, but rather to establish an analogy between the flow and develop a set of trajectories for the vehicles to better maneuver around the sudden obstacle, at the triple point of the conjunction of the mentioned shockwaves, a horizontal outlet flow has been dictated in the case in order to accelerate the return to normal operation after passing by the obstacle, and the shock system has been manipulated in such a way as to provide this demanded result.
Finally, it is to be addressed that the compressible fluid flow analogy tackles the collision avoidance problem with the underlying fundamentals of parabolic equations of such flows. The downstream disturbance does not propagate in the upstream region until it is physically urgent to change path along modified trajectories to avoid the collision. This manifests itself as the least amount of pre-awareness the autonomous computational center must take into consideration to come up with measures regarding collision avoidance. In other words, paths are remained unchanged until the very last point, both in temporal and spatial terms, before they first need to make a bypass around the obstacle. This is of great importance in terms of energy loss, traffic control, and maintenance minimization of the related sub-systems in acceleration and deceleration maneuvers as well as trajectory alterations.
It is of note that the implied notion of “minimum disturbance to traffic flow” is not related to the simulation level of the method, but the inherent nature of shockwave systems. In a supersonic flow field, fluid elements have higher velocities than the velocity at which the pressure waves (i.e., the mechanism through which the information regarding the presence of obstacles and field boundaries is propagated) travel. In this setting, the obstacles are not sensed by the fluid particles for the longest distance (and thereby time) before the absolute necessity for them to redirect in order not to penetrate the obstacle. The shockwave (here one can imagine a detached bow-shock ahead of a supersonic blunt body) is formed as the locus of the points closest to the obstacle, and its local strength emerges so that the change in the flow regime for any fluid element passing through the shock gives it the properties needed to obtain pressure-information in time for the elements to bypass the obstacle. That is to say that the shockwave forms at the nearest possible location to the obstacle where flow deflection becomes unavoidable and changes the thermodynamic properties of the fluid elements passing through it such that they are capable of that deflection. The same condition is met on any point on an oblique shockwave—even for elements positioned at lateral distances from the obstacle leading to their placement at its downstream positions in the streamwise direction. Therefore, the method proposed in this manuscript for the suggested trajectories to bypass obstacles without colliding with them causes the lowest disturbance to the flow field, as the flow field stays supersonic (i.e., with its prior regime and velocity level) until the furthest point possible, before the absolute necessity for the vehicle to maneuver. In other words, that is to say that the shockwave system represents a natural solution of minimal disturbance, as it preserves the upstream flow conditions until the final point where a discontinuous adjustment becomes necessary to satisfy boundary constraints.
Another advantage of this method is that no matter which streamline the following vehicle is considered to be on, as all other vehicles undergo the same shockwave/expansion-fan system, none of the streamlines collide with one another, leading to the comprehensiveness and globality of the solution over the entire domain, as the solution has been obtained considering the limitations and boundaries of the fluid flow. The streamlines do not collide; thus, the entire traffic flow is safely calculated with no interaction of other trajectories. It is needless to mention that under the methodology established in this work, even vehicles with no direct contact with the obstacle wedge should take the suggested trajectory in order to avoid colliding with those laterally closer to the obstacle and maneuvering around it.
In addition to the already mentioned points, the compressible fluid flow analogy gives one the opportunity to return back to the initial conditions as soon as possible, temporally and spatially, after bypassing the constraints, which is another advantage leading to the positive properties listed in the above paragraph, such as energy consumption and maintenance necessity minimization. However, since the velocities in each sector of the trajectory are obtained by the compressible flow premises, keeping in mind that the nature of shockwaves is not isentropic and a certain amount of entropy is introduced to the flow by each interaction through a shockwave, an avoidable kinetic energy—and hence, velocity—loss is witnessed after the vehicles move past the obstacle and its corresponding shockwave system. Therefore, an acceleration is to be demanded for the traffic downstream to maintain the initial velocities. Also, in terms of the lateral position of the vehicles, the methodology induces a displacement with respect to the initial conditions; this will be treated using a back-to-lane approach after the obstacle is avoided. In other words, the vehicles will be guided back to their initial lane gradually after the completion of the avoidance maneuver.
2.3. Flow Field Solution Strategy
In order to obtain the suggested trajectories based on the supersonic, compressible flow analogy, the initial values should be given. The utmost parameters in this regard are the geometry of the vehicles, the geometry of the road, and the relative orientation of the vehicles.
In addition, global constants of the solution should also be known, which are the driver/vehicle response time constant, the coefficient of friction of the vehicle on the road, the acceleration of gravity, and so on. Each set of these values will result in a flow configuration, as discussed in detail in Section 2.2 (see Figure 5).
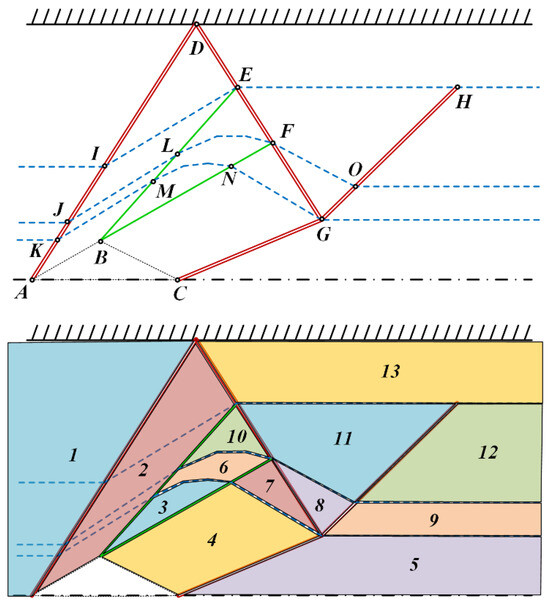
Figure 5.
Nomenclature of nodes and regions. (Top) Important Nodes: A, B, C—modified obstacle geometry; K, J, I, D—first contact of all lateral positions with the first shockwave; M, L, E—first contact with the expansion fan; N, F—end of expansion fan; G—intersection shocks; O, H—last contact with the shock system. (Bottom) Important Regions: 1—fully upstream; 5, 9, 12, 13—fully downstream; 2—after the first shock, common for all zones (I-IV); 3, 6, 10—gradual direction changes within the expansion fan; 4, 7—regions after the expansion fan; 8, 11—regions before the final shockwave.
Then, the following algorithm solves the compressible flow field system based on the theoretical fundamentals covered in previous sections (see Algorithm 1). The solution will then result in the location of all critical nodes, as well as shockwaves and expansion-fan geometries and orientations. This is accompanied by the flow properties of each region color coded in Figure 5, such as traffic Mach number, velocity magnitude, direction, and so forth.
| Algorithm 1. Block (pseudo-)algorithm for flow field analogous trajectories | |
| 1 | Constants: , , , g |
| 2 | Inputs: , , , , , |
| 3 | Form ABC obstacle using Equation (37) |
| 4 | Solve Equation (7) for |
| 5 | Solve SW1 |
| 6 | Locate D |
| 7 | Solve SW2 |
| 8 | Solve Equation (29) for |
| 9 | Locate E |
| 10 | Locate I |
| 11 | If Zone IV = true, Then |
| 12 | Solve for Trajectory IV |
| 13 | Else |
| 14 | Solve Equation (36) for |
| 15 | Solve Equation (34) for |
| 16 | Solve Equation (36) for |
| 17 | Solve Equation (30) for |
| 18 | Locate F |
| 19 | Locate L |
| 20 | Locate J |
| 21 | If Zone III = true, Then |
| 22 | Solve for |
| 23 | |
| 24 | Solve Equation (34) for |
| 25 | Solve Equation (36) for |
| 26 | Solve for |
| 27 | Else |
| 28 | Solve SW3 |
| 29 | Locate G |
| 30 | Locate O |
| 31 | Solve for |
| 32 | Solve for Trajectory III |
| 33 | Locate N |
| 34 | Locate M |
| 35 | Locate K |
| 36 | If Zone I = true, Then |
| 37 | Solve for |
| 38 | Solve for Trajectory I |
| 39 | Else |
| 40 | Solve for |
| 41 | Solve for |
| 42 | Solve for Trajectory II |
| 43 | End |
| 44 | End |
| 45 | End |
Having all such information, the next step is to track the streamline that the bulk of the flow—later to be replaced with the vehicle—takes, which would fall into one of the four zones mentioned in Section 2.4 (Figure 6). Knowing this, the vehicle dynamics criteria could be imposed upon the trajectories to make them realistically followable routes for a real vehicle.
2.4. Path Planning
The methodology discussed above is used to develop a target path of motion for the ego vehicle to be driven on. The formulation of the problem using a fluid dynamics analogy also provides a desired velocity profile along the calculated stream, which is also a necessary component of a vehicle path-planning strategy. In other words, the proposed analogy acts as a single-objective optimization problem which describes the desired vehicle maneuver as one with minimum disturbance to traffic flow. This qualitative objective is translated into a quantitative strategy based on the analogy provided here. Next, to convert the calculated fluid stream to a valid vehicle path, we may smoothen the edges by means of a transition curve which continuously alters the curvature from zero on a straight-line section to a maximum close to the intersection and then back to zero again to connect to the next straight-line section. The choice of the transition curve might be limited by several factors, but to avoid over-extending the scope of the present study, we use clothoids as the transition curves as they are known to provide smooth vehicle dynamics [50]. The parametric equations of a clothoid are given by Fresnel integrals as follows [51]:
where is a scaling factor and is the independent variable. The solutions to Fresnel integrals could be found using the numerically calculated lookup tables. An example of this is given in by Jazar [51] as a clothoid design graph. An advantage of Equations (38) and (39) is that the tangent angle to the clothoid is readily obtained as follows [51]:
Figure 6 shows how coordinate frames are fitted around the intersection of two adjacent straight lines. For continuity and smoothness of the resulting curve, at the intersection of the clothoid and the bisector line must be half of the angle between two adjacent linear path sections. The procedure is outlined below as performed in this study:
- Find the lengths of the linear sections of the road.
- Around each intersection point, take the shorter line and define as half of the smaller length.
- Fit coordinate frames 1 and 2 at distance with x-axes pointing towards the intersection point and y-axes pointing upwards.
- Find the equation for the bisector line of the corner in coordinate frame 1.
- To obtain a suitable value of , Equations (38) and (39) are intersected by the bisector in coordinate frame 1 for a range of values of and the corresponding is obtained as well as the corresponding . The closest solution to the required is picked.
- The coordinates of the second half of the resulting clothoid curve in frame 2 are mirrored with respect to frame 1 due to symmetry.
- The global coordinates of the clothoid curve are obtained by applying geometrical rotations and translations between frames 1 and 2 and the global coordinate frame XY. Note that transformation from frame 2 to the global frame requires a negation in x-values as well, due to the left-handedness of frame 2:
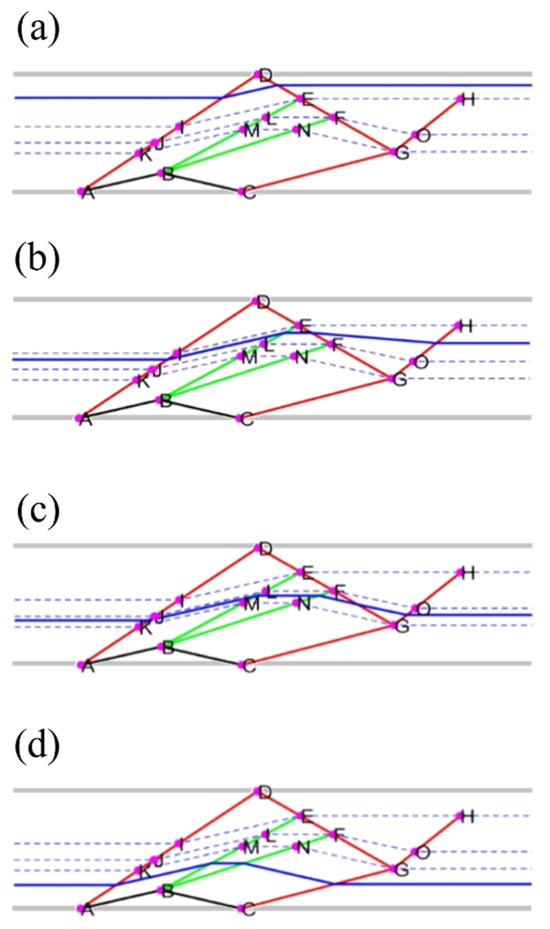
Figure 6.
Effect of the lateral location of the vehicle on the outcome trajectories. Sample trajectories within each of the zones have been illustrated as they pass through their corresponding shockwave/expansion-fan components on their route. (a) Zone IV, (b) Zone III, (c) Zone II, (d) Zone I.
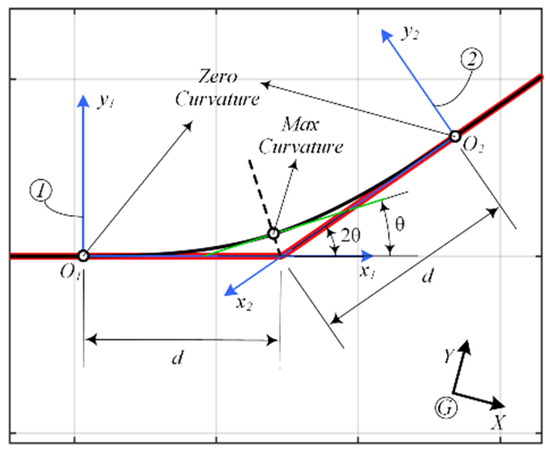
Figure 7.
Smoothing the target path using clothoids.
As mentioned earlier, the desired velocity profile of the calculated points is also part of the path-planning process. The fluid dynamics analogy provides us with an instantaneous velocity change when passing through shockwaves; at this stage, to prepare a suitable velocity profile according to vehicle dynamics, one may smoothen the target velocity profile along the sequence of points and make it continuous as a function of the longitudinal coordinate by means of a weighted average of the target velocity in each section as follows:
where is the target velocity dictated by the fluid dynamics analogy for each section of the road, is the total number of sections considered ( is opted for here), and is the resolution of the total waypoints considered in the direction ( is opted for here). is a design parameter which determines how sharply the velocity profile changes along ( is opted for here).
It is important to note, as observed in Figure 4, the final lateral position and the velocities of the streamlines along the road might be different from their initial values before facing the obstacle; this is due to the compressible flow assumption and the fact that we cannot continue considering reflected shockwaves infinitely far away from the obstacle. Thus, to reasonably obtain the streamlines in their initial conditions within a limited distance, we added a “return phase” of two extra linear sections to the end of the path during which both the lateral position and velocity go back to their initial values. Since the slope of the unfiltered path is discontinuous and sharp changes are treated afterwards, we may introduce the return phase with two linear sections: The first section connects the current position to the desired lateral position within 20% of the longitudinal distance required for complete obstacle avoidance, namely the horizontal distance between points A and H in Figure 5. The second linear section is a horizontal line with an arbitrary length, assuming there is no other obstacle further down the road. The velocity during the first section of the return phase is equal to the previous stage, and the set velocity for the second section of the return phase is equal to the initial velocity before the obstacle. Figure 8 shows the overall output of the path planner for a streamline with a condition similar to Figure 6c. The figure also shows that the maximum number of sections is a suitable choice as the depicted streamline enters a maximum of five regions as shown in Figure 6c, and the last two sections constitute the return phase.
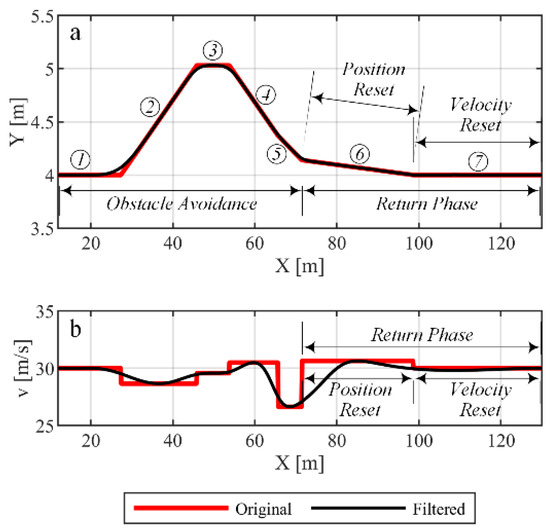
Figure 8.
Example of the path-planning result indicating design sections of the path; (a) global coordinates of the path, (b) velocity profile.
The sequence of points and the corresponding velocity profile calculated from the smoothed path above are then fed into a path-tracking algorithm as described in the following section.
Compared to conventional path-planning algorithms relying on iterative optimization, the proposed method benefits from the analytical and continuous nature of fluid flow solutions. The governing equations of compressible flow provide closed-form relations that depend mainly on the obstacle geometry and flow conditions, allowing direct calculation of feasible trajectories without iterative optimization or discretization. As a result, the computational effort is minimal and the resulting paths are globally smooth, non-intersecting, and dynamically feasible. These characteristics highlight the potential of the fluid dynamics analogy as a real-time, physics-based alternative for autonomous navigation in connected vehicle environments.
3. Vehicle Dynamics and Control
3.1. Simulation Model
In order to validate the proposed methodology in designing a target path for autonomous vehicle control, it is necessary to show whether the suggested path is consistent with vehicle planar dynamics and whether it would be feasible to follow such trajectories. This process is conducted using a simulation model of a vehicle of interest, i.e., an ego vehicle, which is supposed to follow the set path and avoid an obstacle using a path-tracking algorithm. In this paper, we use a planar vehicle model with rotational dynamics of the wheels and nonlinear tire characteristics. The tire force model follows the Magic Formula [52] for combined longitudinal and lateral slip conditions. This way, we will be able to model both the lateral and longitudinal dynamics of the vehicle and validate the proposed methodology for full planar vehicle dynamics. As a result, the vehicle body will incorporate the longitudinal, lateral, and yaw DOFs, and the rotations of the four wheels are modeled separately, constituting a total of seven DOFs. Figure 8a shows the vehicle body coordinate frame and the numbering of the wheels, and Figure 9b indicates the forces acting on the vehicle body in the horizontal plane, velocity vectors, and definition of angles.
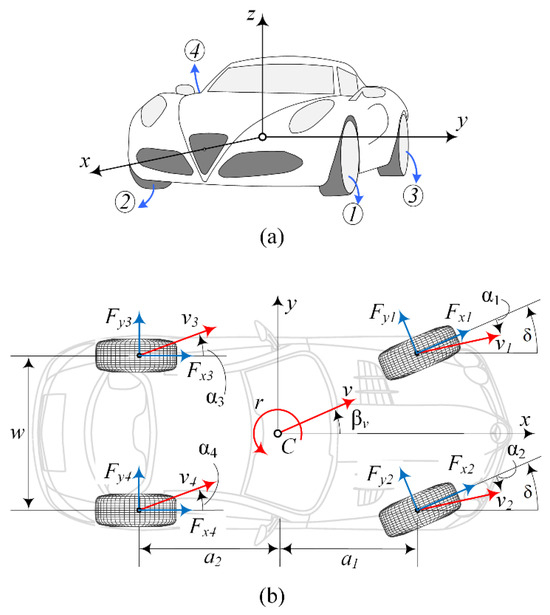
Figure 9.
Vehicle coordinate frame and wheel numbering. (a) Bird-eye view of the vehicle in ist coordinate system. (b) Nomenclature of the force systems.
The planar equations of motion of the vehicle and wheels’ rotational dynamics are as follows:
where , , and represent the vehicle body’s longitudinal, lateral, and yaw velocities in the body coordinate frame, respectively, and wheel rotation dynamics are represented by as the wheel rotational speed.
Due to the lateral and longitudinal accelerations experienced by the vehicle, the amount of vertical force on the tires will continuously vary. These vertical forces are calculated as follows [51]:
where the longitudinal and lateral accelerations and are defined as
Note that the effect of vehicle suspension compliance and roll and pitch motions are not considered in this model. The key vehicle model parameters used in the simulations are listed in Table 2. Note that for the stiffness of the tires, the linearized tire force model is considered when reporting the parameters in the table.

Table 2.
List of key vehicle model parameters.
It is important to show that the selected vehicle with the above parameters is a valid example of passenger vehicles as the main area of application of the present methodology. One may come up with an idea that only works for a certain range of vehicle parameters which correspond to no or very limited cases in real life, but which is not applicable to the domain of passenger vehicles as a whole. To demonstrate that the vehicle parameters in Table 2 are realistic in the realm of passenger vehicles, we take a non-dimensional approach and compare the dynamic properties of the vehicle with those of common passenger cars in terms of dimensionless quantities representing vehicle dynamics. Based on a bicycle vehicle model, Brennan and Alleyne [53] provided reference values of four key dimensionless Π-groups for the vehicle planar dynamics of production passenger vehicles. These reference values are obtained by considering the frequency of occurrence in the domain of a large range of production vehicles. Calculation of these Π-groups for the vehicle under investigation and comparison with the reported range of those numbers for real vehicles provides us with a clear picture of whether the vehicle of interest sits in the category of passenger vehicles. These dimensionless numbers are defined as below [53]:
where the common range of these dimensionless quantities in passenger vehicles for the speed of 14.6 m/s is reported as
Note that there also exists a value of which is dependent on and, therefore, equivalent to it in terms of dynamical properties. The Π-groups related to the vehicle described in Table 2 at the same speed are as follows:
which are all in the anticipated range of passenger vehicles, justifying the use of the given vehicle parameters without a loss of generality in the results.
3.2. Control Design
In Section 2, the path-planning algorithm was detailed and the output from the planner level was discussed. To evaluate the proposed path-planning methodology, we use the provided desired path of motion and the desired velocity to simulate autonomous vehicle motion in different scenarios of an obstacle-avoidance maneuver. The autonomous vehicle is equipped with a path-tracking controller based on the Autodriver algorithm [54]. The controller consists of a feedforward structure which forces the vehicle to turn about the center of curvature of the desired path at every instance by applying the required steer angle in steady-state turning conditions. This required steer angle is obtained using a lookup table by coinciding the center of rotation of the vehicle and the center of curvature of the road at every instance. Such mapping can be performed between the steering angle and the radius of rotation of the vehicle in steady-state conditions using a bicycle vehicle model [55]. To eliminate transient errors, a feedback structure based on sliding-mode control (SMC) measures the lateral tracking error in the vehicle coordinates and adjusts the steering angle accordingly. For the longitudinal control, a PD controller adjusts the input torque to the driving wheels, based on the longitudinal position error, in the vehicle body coordinate frame. Thus, the vehicle is always tracking the desired path of motion, provided that the set target path is valid and achievable in the feasible tire friction range. Note that the path-tracking problem here refers to both lateral tracking and longitudinal tracking, where the vehicle is supposed to obtain a predetermined velocity profile along the path. This combined tracking may be converted into an object tracking problem, where the target moves on the reference path with the desired velocity.
Figure 10a shows how the longitudinal and lateral tracking errors are defined in the vehicle body frame, and an example of autonomous path following using this approach is shown in Figure 10b, in which the vehicle is initially forced to have an error in the heading angle, but it eventually approaches the required reference position which itself is changing as a function of time. This will ensure the vehicle is always tracking the path laterally, as well as following the desired velocity along the path.
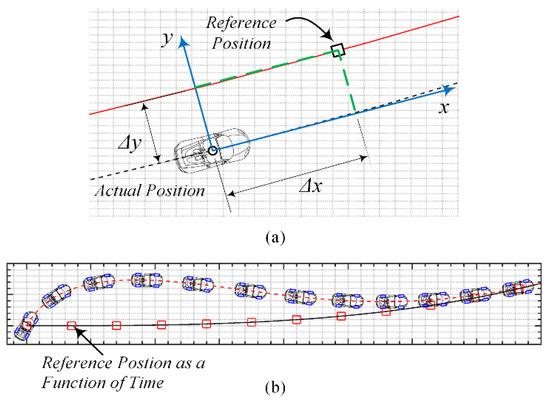
Figure 10.
Target tracking: (a) path-tracking errors in vehicle body frame, (b) minimized tracking error over time.
The SMC, which is responsible for steering the vehicle, is designed to ensure accurate lateral tracking with robust performance against tire parameter uncertainties. A bicycle vehicle model [56] augmented with the lateral position dynamics is considered as the control-oriented model, as shown in Figure 11.
in which represent the tire cornering stiffnesses and are vehicle parameters explained in Figure 8 and Table 2. The lateral tracking error dynamics is calculated based on the kinematics of motion described in Figure 11:
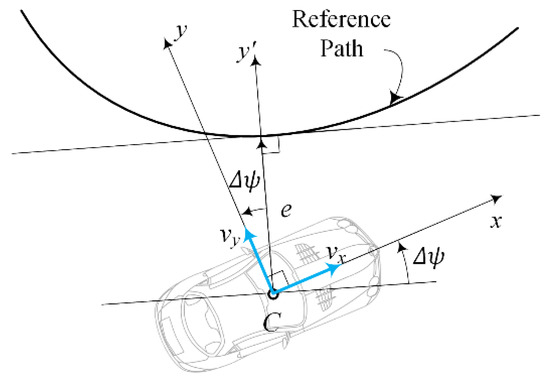
Figure 11.
Tracking error dynamics.
A sliding surface of the form
guarantees that the error dynamics will converge to zero for the nominal model. Taking the derivative of the sliding surface and equating it to zero provides one with equivalent control [57]:
Equation (63) works as a control law if no uncertainty is present and if the lateral tracking error is initially set to zero; however, to have robust control and account for vehicle model and parameters uncertainties, a compensating term using saturation function is added to the equivalent control:
where is the saturation function and is defined as
The PD controller design for longitudinal position control is performed using a simple first-order model. The overall control structure is shown in Figure 12.
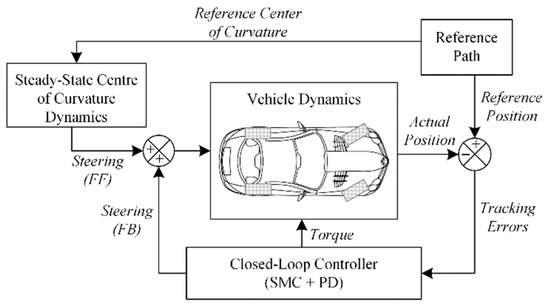
Figure 12.
Control system structure.
The controller parameters were adopted based on prior hardware-in-the-loop validation (presented by Milani et al. [58]), where they were optimized to achieve stable convergence and minimal chattering across a range of operating conditions. Accordingly, the same parameter set was applied in this study to maintain consistency and ensure real-time feasibility of the SMC structure. The parameters are summarized in Table 3.

Table 3.
Controller parameters.
It is acknowledged that sliding-mode control (SMC) inherently introduces chattering due to the discontinuous switching of its control law. Recent adaptive formulations, such as the chattering-free PID-based SMC (proposed by Liang et al. [59]), employ smooth reaching laws and adaptive gains to minimize this effect while maintaining robustness. In the present study, the SMC framework is used solely to demonstrate trajectory-tracking feasibility, and chattering mitigation will be considered in future experimental work.
4. Results and Discussion
The current section first presents an overall insight into the spectrum of cases of interest to the scope of the concept issued in this paper. As the initial set of results concern the validity and physical soundness of the shockwave systems obtained through the calculation of MT, the configurations of said systems are to be discussed afterwards, in a fluid flow feasibility level analysis occurring under the overall vehicle dynamics premises. The more in-depth validity analyses of the results from the vehicle dynamics perspective are then presented following the aerodynamics level analyses.
The computational feasibility of the proposed framework is ensured at both the planning and control levels. The analytical equations used in the flow-field-based path planner are linear or quasi-linear, requiring only direct algebraic evaluations without iterative optimization. Consequently, the trajectory generation process is well suited for real-time implementation on embedded hardware.
In addition, the sliding-mode controller (SMC) employed for path tracking has been demonstrated in previous work [58] to achieve stable real-time performance with negligible processing overhead in hardware-in-the-loop simulations, outperforming a fast MPC benchmark. This further supports the suitability of the proposed algorithm for real-time autonomous driving applications.
Table 4 (also see Figure 13) summarizes the two categories of the cases considered in the current study, namely cases with τ = 1.3 for human drivers and τ = 0.5 for autonomous vehicles. As the higher value of τ for the case of human drivers implies, the regulations in place must tend more towards increasing the safe distance between vehicles to compensate for the longer time duration expected from the driver to respond. Consequently, the distance L for the human driver at the speed of 15 m/s is intentionally increased by about 10 m to calibrate the numerical process to ensure a compatible geometry is achieved at higher speed and distance. Note that this does not imply the safety distance being independent of velocity, but only serves as an adjustment parameter, and the final value of L for each speed is obtained according to the compatibility of the geometry with the proposed physical analogy, shown in Figure 14, as well as a more exhaustive presentation of all cases in Figure A1 in Appendix A.

Table 4.
Traffic Mach number for the range of tests under study.
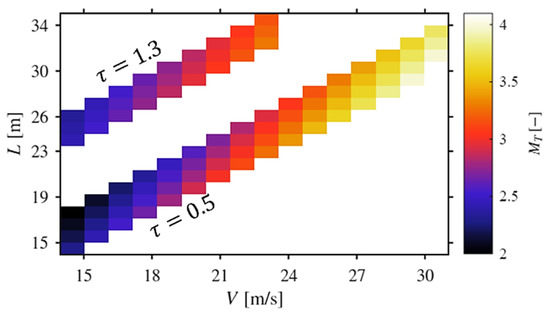
Figure 13.
Distribution of MT for the entire space of analyzed cases, based on Table 4.
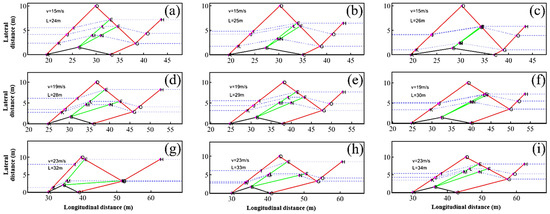
Figure 14.
Equivalent flow field configuration for the cases with τ = 1.3 for human drivers. The capital letters indicate the nodes presented in Figure 5. A full exhaustive case list is presented in Figure A1 in Appendix A (covering the whole range in Table 4). The values of V and L for each subplot are as follows: (a) 15 m/s, 24 m. (b) 15 m/s, 25 m. (c) 15 m/s, 26 m. (d) 19 m/s, 28 m. (e) 19 m/s, 29 m. (f) 19 m/s, 30 m. (g) 23 m/s, 32 m. (h) 23 m/s, 33 m. (i) 23 m/s, 34 m.
Based on the range of values of interest for vehicle velocities and their relative positions, and also the concern of not even slightly approaching the nominal hypersonic flow regime (M = 5), the cases have been monitored to have MT values roughly no greater than 4. In other words, increasing L might theoretically change the value of MT; however, having such a higher than usual longitudinal distance to the vehicle ahead on the road could also translate itself into the condition where the following vehicle has not yet entered the vicinity of the obstacle, and no calculation of MT would be logical at that distance yet. This is only logical after a certain point in which the two vehicles are practically considered to be in each other’s inter-affecting neighboring domain. This also led us to bound the problem length scale by the higher limit of 35 m.
Considering the V < L < 2V rule of thumb for human-driven vehicles and slightly lower safety displacement for the case of more nimble autonomous driving systems, a range of V = [15–23 m/s] and L = [25–33 m] followed by another spectrum of V = [15–30 m/s] and L = [16–31 m] is studied for human and autonomous drivers, respectively. This is also added to by a margin of ±1 m and +2/−1 m for the length scale of both categories, respectively, so that alterations to the proportionality of the variables could also be studied, which is another configuration for changing the values of MT, in the neighboring region of each (V, L) node in the mathematical domain.
Considering the definition of MT in (7), Table 4 presents a minimum of 2.338 and 1.999 and a maximum of 3.283 and 4.098 for cases of human and autonomous drivers, respectively (see Figure 13). And as a reference point for comparison, the obtained MT for V = 20 m/s and L = 20 m for autonomous drivers is identical to the case of the same velocity but L = 30 m in the human drivers’ category, with the numerical value of MT = 2.899. This example clearly illustrates the compensating effects of 160% increase in τ, against a relative mere 50% increase in L, for that specific velocity. Other than this point, increasing the velocity would certainly increase MT, while keeping the velocity constant and increasing the distance would certainly decrease MT.
Implementation of the algorithm discussed in Section 2.3, for the cases with τ = 1.3 for human drivers, is presented in Figure 13, where each row of the graph represents a column of the groups of three in Table 4.
It should be noted that the cross-influences of the variables used in the definition of the traffic Mach number—as some are themselves relative functions of the other ones, although common and harmless in the definition of dimensionless number groups—is taken into consideration in the formation of the cases presented in Table 4 as samples selected to be presented in this manuscript for case configurations.
The main concern being verified with the aerodynamics domain shown in Figure 13 is the logical formation of the subsections of the domain. The results show a lack of negative volumes (areas) as one could think of for cases, where shockwaves/expansion fans intersect in other configurations than those explained in Figure 4 and Figure 5. Keeping vehicles’ speed constant while increasing the distance between them has been shown to decrease the size of expansion fans. This trend has the theoretical implications of a sharper turn at the top corner of the rhombus obstacle in a shorter time duration. As a matter of geometric observation, the shrinkage of the expansion-fan area results in the elimination of Zone III, which included trajectories going through only a portion of the redirecting expansion area. However, since the aerodynamics-based trajectory calculations are to be filtered through vehicle dynamics approximations for the final path, the high rotational acceleration resulting from minimization of the expansion area is harmless. This is while increasing the velocity has the overall effect of increasing the aforementioned expansion-fan area throughout all of the cases. Having the lower extreme of the mentioned condition at V = 15 m/s, L = 26 m and the higher extreme at V = 23 m/s, L = 32 m, the former shows a marginal elimination of Zone III, as the latter moves towards the omission of Zone II.
As another interesting phenomenon, one can recall the overall supersonic flows fundamentals dictating the higher inclinations of the oblique shockwave towards the wedge surface while increasing the Mach number. However, as the geometry of the approximated rhombic double-wedge obstacle is itself a function of the flow field variables such as velocity and therefore MT (see Equation (37)), the global inclination angle of the first oblique shockwaves undergoes a nonlinear trend. This effect can also be witnessed for other shockwaves, one more evident case of which is the last shockwave of Zone I.
As Zone IV is the least affected zone by the presence of the stationary obstacle ahead on the road, it is also verified herewith that the lower range of MT is correlated with larger areas regarded as Zone IV. The higher the MT, the deeper the effects of the obstacle propagated throughout the further regions of the domain. This can also be seen longitudinally, as the influenced regions in the wake of the obstacle also grow with MT. Generally, the higher the MT, the distribution of the zones is denser further away from the road symmetry line where the obstacle is located, whereas in cases with lower MT, this distribution tends to be near the symmetry line.
Figure 15 (accompanied by an exhaustive list of all cases mentioned in Table 4, as Figure A2 in Appendix A) provides the same sort of information and trends on the flow field solutions as discussed above for Figure 13, but for the autonomous driver cases (τ = 0.5).
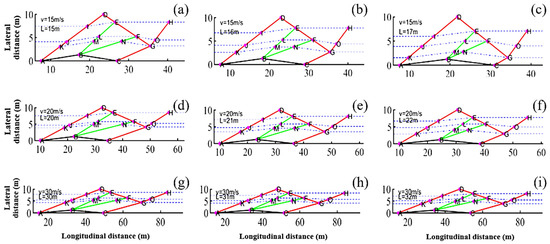
Figure 15.
Equivalent flow field configuration for the cases with τ = 0.5 for autonomous drivers. The capital letters indicate the nodes presented in Figure 5. Full exhaustive case list is presented in Figure A1 in Appendix A (covering the whole range in Table 4). (a) 15 m/s, 15 m. (b) 15 m/s, 16 m. (c) 15 m/s, 17 m. (d) 20 m/s, 20 m. (e) 20 m/s, 21 m. (f) 20 m/s, 22 m. (g) 30 m/s, 30 m. (h) 30 m/s, 31 m. (i) 30 m/s, 32 m.
The simulation model and the control framework described in Section 3 are used to validate the proposed path following methodology in terms of vehicle dynamics feasibility. To perform a comprehensive assessment, we present three comparative simulation sets. In all cases, the initial lateral position of the ego vehicle is set to 1 m, which will represent Zone I in Figure 4 as the most critical zone.
To summarize the certain range of validity of the proposed methodology, the following extreme cases should be emphasized upon as cases outside the primary premises taken into account in the development of the mentioned theory. The most important of these cases are those with such low Mach numbers that a detached shockwave occurs, leading to a region of subsonic flow after the root of the shock, with effects closer to a normal shockwave than an oblique one. The practitioner should be aware of the fact that the results of this theory do not hold for such conditions.
Figure 16 summarizes the up- and downstream lateral positions for all cases presented in Table 4 and for the interface between adjacent zones (I/II, II/III, and III/IV). It is seen that the highest change in the lateral position of the zone interfaces (Figure 16i) occurs for the human driver. Given the main applicability of the proposed trajectories for an autonomous vehicle, with shorter reaction time-scales, this matter is favorable. Also, it is observed that in all cases (Figure 16g–i) that the lateral shift of the zone interfaces is negligible (i.e., near zero or at maximum reaching the width of a lane). This makes the maneuver to return to the original lateral position after the obstacle avoidance trivially manageable. This matter is discussed in the later part of this section.
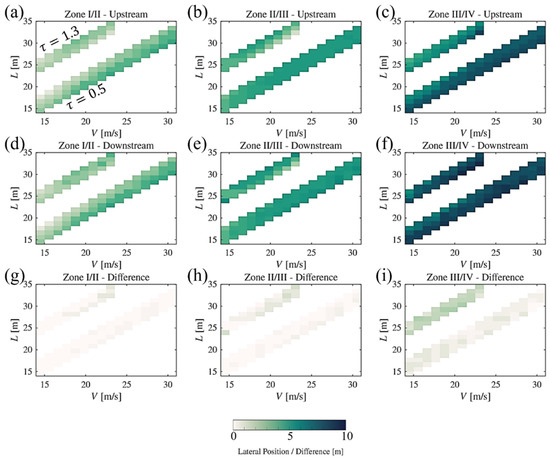
Figure 16.
Up- and downstream lateral position of the zone interfaces. (a,d,g) Interface between Zones I and II. (b,e,h) Interface between Zones II and III. (c,f,i) Interface between Zones III and IV. (a–c) Upstream, (d–f) downstream, (g–i) difference.
Figure 17 presents statistical analysis on the spread of the zone interfaces for different cases and in up- and downstream locations. It is seen that the maximum shift between the mean lateral location of the zone interfaces occurs for the human driver factors (Figure 17c). This, again, strengthens the argument for better handling and applicability of the proposed method to autonomous vehicles. Figure 17f shows the change in spread, which again follows the same pattern.
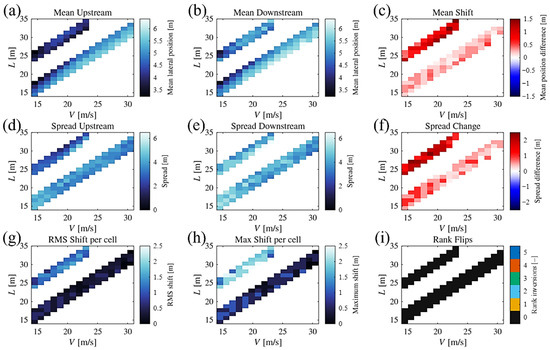
Figure 17.
Statistical analysis of the interface between zones. (a) Mean of all three interfaces (I/II, II/III, III/IV) upstream. (b) Mean of all three interfaces (I/II, II/III, III/IV) downstream. (c) Mean of all three interfaces (I/II, II/III, III/IV) shift between up- and downstream. (d) Upstream spread of the zone interfaces, between different cases. (e) Downstream spread of the zone interfaces, between different cases. (f) Change in spread between up- and downstream. (g) RMS of the shift per interface. (h) Maximum shift of interface location per interface type. (i) Number of times interface intersections flip ranks.
The high RMS shift (the difference in the RMS in the spread of the position of interfaces up- and downstream of the obstacle) in Figure 17g clearly shows a peak for autonomous vehicles which—given the confinement of the route from the top (Figure 4) and the overall shift towards it due to the obstacle being realized on the bottom side (Figure 4)—indicates a better spread towards the original lateral positions.
It was previously mentioned that given the safe longitudinal distance and velocity—set by traffic rules—for a platoon of autonomous vehicles, the global solution for the flow field obtained through the present method will leave no chance for the intersection of the trajectories commanded of different vehicles with different lateral positions. This idea, although intuitive for a fluid flow field, is checked in terms of the number of times the rank between the zone interfaces flips. Figure 17i clearly shows the zero value for this parameter for all cases.
Simulation Set 1: The first simulation set compares the effect of the reaction time on path planning and the feasibility of tracking it. As described earlier, the reaction time plays an important role in the Mach number definition of the traffic, which forms the target path of motion. The effects of using a reaction time based on a human driver () and a computer () are compared in Figure 18a in terms of the target path which, in turn, affects the resulting actual path as well. The dashed lines represent the target path and the solid lines show the actual path after completion of the maneuver. The cases are selected such that both refer to the same Mach number of 2.899 as per Table 4. The initial speed of the vehicle is 20 m/s in both cases, but the value of is for and for . Thus, the severity of the obstacle-avoidance problem is relatively similar in both cases from an aerodynamics standpoint. As observed from the target paths in Figure 15a, if a target path is based on human reaction it will cause a late maneuver compared to a target path based on an autonomous driver, due to more delay in receiving and computing information from the obstacle upfront. The figure also indicates that the actual path of motion of the vehicle shows much more deviation from the target path in the case of ; in other words, late path planning causes a more sudden change of direction and larger tracking errors due to vehicle dynamics latency. Also, a smaller reaction delay shows better path-tracking ability at the beginning of the maneuver which is critical in avoiding an accident with the obstacle. Note that both path trackers are based on the same algorithm, and the reaction time only affects the path-planning stage, not the path-tracking performance. Thus, for the rest of the comparisons, we only keep as the practical case.
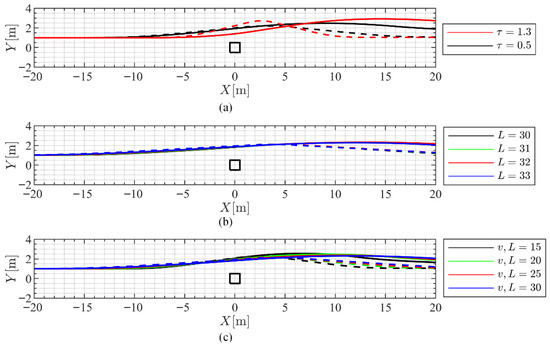
Figure 18.
Target versus actual path of motion: (a) comparing human and autonomous driver values for τ; (b) comparing different values of L in constant velocity of 30 m/s for τ = 0.5 s; (c) comparing different combinations of velocity and L values for τ = 0.5 s.
Simulation Set 2: The second simulation set compares high-speed maneuvers with different values of . The initial vehicle speed is 30 m/s, but the value of changes from 30 to 33 m as per Table 3. Figure 18b and Figure 19a show the target (dashed lines) and the actual (solid lines) paths of motion in all four cases. There are negligible differences between the cases, and in all of them, the beginning of the maneuver shows promising path tracking. The second half of the maneuver also shows reasonable deviation from the target path, considering vehicle dynamics. Hence, the value of has little effect on the system’s performance with .
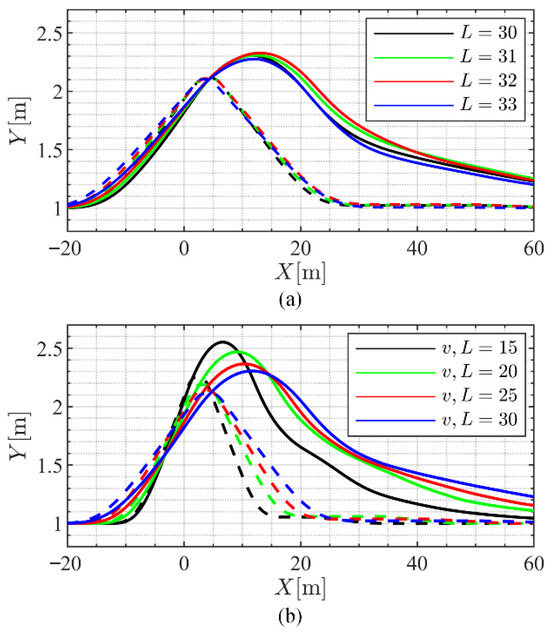
Figure 19.
Comparing paths of motion with unequal scales: (a) different values of L at constant velocity of 30 m/s and τ = 0.5 s; (b) different velocity and L combinations for τ = 0.5 s.
Simulation Set 3: The third simulation set compares the performance of the system at four different speeds ranging from low to high highway speeds. To keep consistency, we take the upper range of values of distance in each velocity, as per Table 4. Thus, the four cases can be summarized to have velocities of 15 m/s, 20 m/s, 25 m/s, and 30 m/s and the corresponding values of are selected as 15 m, 20 m, 25 m, and 30 m, respectively. Figure 18c and Figure 19b show the target and actual paths of motion at these speeds. Comparing the dashed lines in Figure 19b, we observe that the higher the speed, the wider the target path in direction; in other words, the path planner suggests an earlier change of direction and later return when the speed is higher, which is consistent with the physics of the problem. A similar trend in the actual paths of motion is also observable, where vehicles traveling at higher speeds would start avoidance earlier and return later than vehicles traveling at lower speeds. The return phase magnifies the differences as the vehicle needs to overcome the initial lateral momentum gained in the first half of its maneuver.
Figure 20 shows the required inputs to the vehicle at different initial velocities to follow the corresponding target path. The speed seems to mainly affect the phase of the inputs, rather than the magnitudes. Vehicles traveling at higher speeds need earlier control inputs compared to vehicles traveling slower.
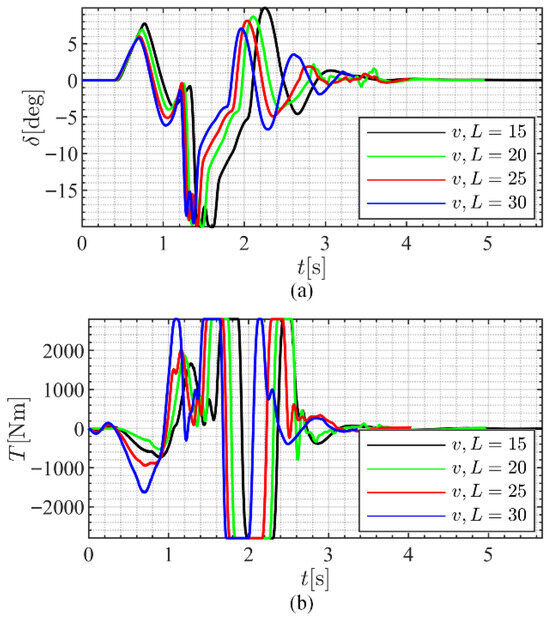
Figure 20.
Vehicle inputs for different combinations of V and L: (a) steering angle; (b) torque.
Figure 21 presents the average lateral tracking error for different values of at a constant vehicle speed of = 30 m/s. The results highlight the sensitivity of the tracking accuracy to the obstacle-spacing parameter, with overall deviations remaining within a small and dynamically acceptable range.
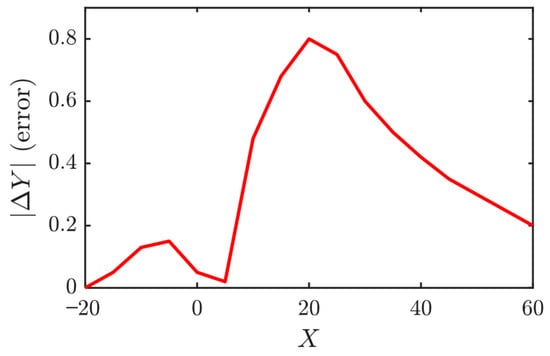
Figure 21.
Average lateral tracking error for different values of L at constant velocity of V = 30 m/s.
To complement the analysis, two additional figures have been included to illustrate the control-energy characteristics for the representative case of = 30 m/s and = 30 m. Figure 22 presents the steering-actuator input power and cumulative energy consumption over time, assuming an average steering-motor torque of 0.8 Nm, steering ratio of 25, and a mechanical efficiency of 90%. Figure 23 shows the corresponding drive-torque input power and energy consumption, calculated using a rolling tire radius of 0.35 m and an overall mechanical efficiency of 85%. These results provide an indicative estimate of the control-effort demand associated with the proposed trajectory-tracking framework.
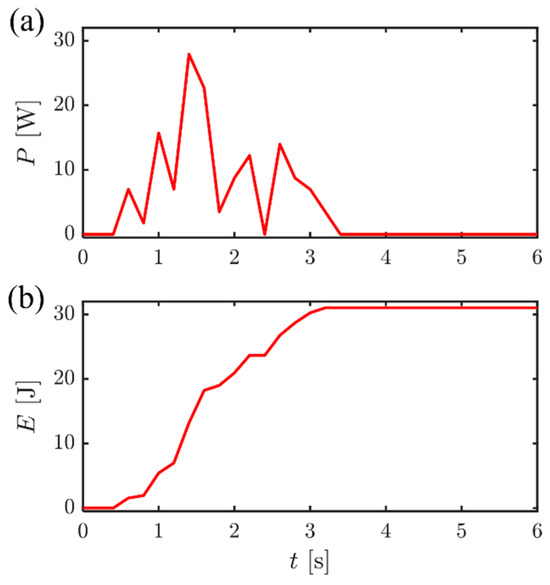
Figure 22.
Control effort power and energy consumption for steering controller with L = 30 m and V = 30 m/s. (a) Control effort power, (b) Energy consumption for steering.
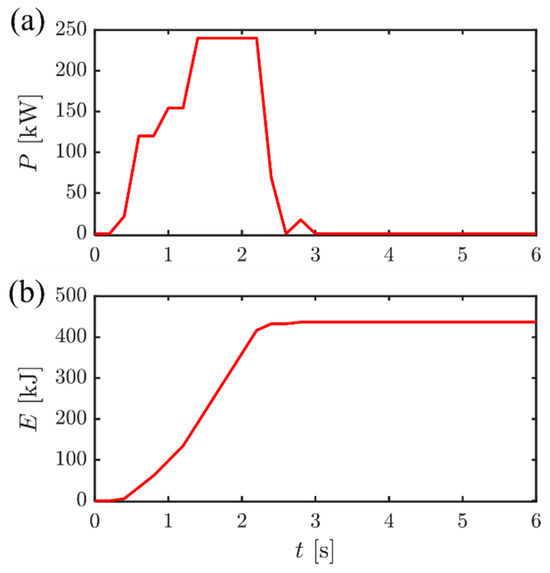
Figure 23.
Control effort power and energy consumption for speed controller with L = 30 m and V = 30 m/s.
The target and the actual velocities for the maneuvers are shown in Figure 24. A reasonable velocity tracking is observable in all cases, validating the use of fluid dynamics in defining a target velocity profile for path planning. Figure 25 shows the position and orientation of the vehicle as it moves past the obstacle at 25 m/s. The vehicle undertakes little deviation from the target path, which is negligible considering the width of the vehicle.
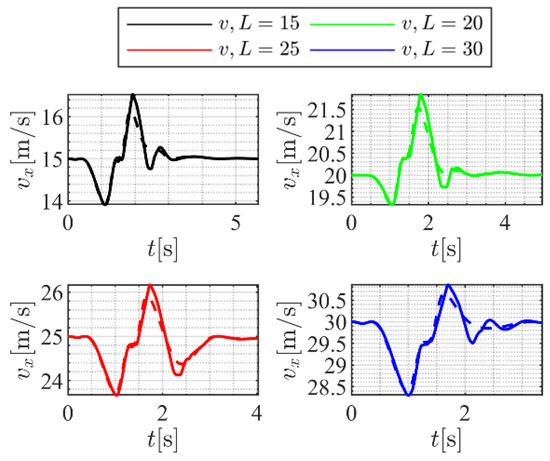
Figure 24.
Target and actual velocities for different combinations of V and L.

Figure 25.
Path of motion and pose of the vehicle avoiding an obstacle at (0,0) at a velocity of 25 m/s with L = 25 m and τ = 0.5 s.
It is worth mentioning that the current model considers a constant reaction time for the sake of unity in the global flow field solutions that each trajectory (of each following vehicle) is a subset of. Therefore, although trivial schemes could be used to personalize the reaction times for each car, and through trained artificial neural networks for each driver, a global statistically obtained worst-case scenario should be the basis of said time-scales for all vehicles involved in a common obstacle configuration, which is the procedure followed in this work (see Figure 1).
There is certainly a tendency toward less optimized handling and maneuverability depending on the road conditions; however, as discussed above (discussions around Figure 18, Figure 19 and Figure 20), the types of maneuvers expected in light of the present model are not outside of the overall performable steering cases expected for the vehicles on the road without the presence of an obstacle. Furthermore, it is needless to say that the present work has targeted the problem at a proof-of-concept level, and further complex configurations (e.g., moving obstacles) are left for follow-up manuscripts. More on this point is discussed in the Conclusions as an outlook for future works.
5. Conclusions
Considering the undeniable analogies in the nature of vehicular traffic flow with that of supersonic compressible flow fields, the non-dimensional group of the traffic Mach number has been defined for the specific case of traffic flow. Having the traffic Mach number gives one the opportunity of going deeper into the modeling and analyzing the flow field dynamics of traffic flow using the governing principles of supersonic compressible fluid flows. However, as the main focus of the current research has been on using the aforementioned similarities just to the point at which a rather logically compatible set of trajectories could be suggested to the traffic flow in specific cases, no claim of such a flawless level of analytical prediction of traffic flow based on the fundamentals of fluid flow is issued within the realm of the current research.
The case chosen and represented in the current manuscript for the sake of a proof-of-concept level investigation of the mathematical/fluid mechanical approach concerns the situation of a multi-lane passage where moving vehicles are suddenly faced with a stationary obstacle, namely a defective vehicle, ahead on the road, and hence the flow forefront/solid obstacle distance required for determination of the traffic Mach number.
The flow field shockwave and expansion-fan system can be consequently configured, resulting in determination of the trajectories bulks of fluid would take, which are primarily suggested to vehicles upstream to avoid colliding with an obstacle. However, the mathematically driven trajectories of macroscopic supersonic compressible fluid flow show discontinuities in speed, acceleration, and direction, which are not practically followable by traffic flow. Therefore, all of the proposed trajectories have been input into the criteria in the field of vehicle dynamics and path planning to check the feasibility of vehicle control in following the trajectories in an approximate fashion, while not deviating from the primary fluid mechanical concerns of the method.
Finally, simulations based on vehicle dynamics with realistic parameters confirmed the feasibility of the proposed analogy for the path planning of autonomous passenger vehicles of future in planar motion and obstacle-avoidance maneuvers.
It should be noted that the current manuscript has addressed the verification and implementation feasibility of the proposed theory for trajectory planning in the case of a stationary obstacle as a more general configuration. This is certainly a simplified version of more complex and realistic cases. In this light, it should be mentioned that the most anticipated steps for the further expansion of the methodology are maneuvers around objects moving at constant velocities, i.e., the simplified case of an overtaking maneuver, and furthermore the case of a transient flow field around time-varying geometric configurations as works expected in the near future. These extensions will provide a more comprehensive evaluation of the framework’s scalability to real-world driving environments. The fundamental structure of the proposed hybrid control scheme, however, is fully compatible with real-time implementation and can be readily adapted for multi-vehicle and dynamic-traffic scenarios.
Here, the target has been to report a proof of concept for the core block of the problem, i.e., collision avoidance via a bypass maneuver performed by moving vehicles noticing a stationary obstacle ahead on the road. An important advantage of our proposed method is that all vehicles obtain a subset (a single trajectory) of a fully consistent global flow field around the obstacle, which is calculated in a decentralized scheme. Therefore, the algorithm proposed in the current work is perfectly applicable for multiple vehicles bypassing a stationary obstacle. A second obstacle can also be addressed with the present method in two scenarios:
- The distance between the obstacles is so short that a trivial refinement on the enveloping geometry of the obstacle system (the rhombus geometry presented in Equation (37)) will consider them as a single obstacle, for which there is no further modification needed on the trajectory or control blocks.
- The second obstacle is just far enough downstream of the first one that the shock system corresponding to the first geometry is already decayed and the second (or third, etc., for that matter) can be inserted into the algorithm.
The problem can, of course, be made more complex through geometric configurations and/or kinematics of the setting. To achieve this, we have designed a series of sub-projects:
- Stationary obstacle (i.e., the present work);
- Obstacle moving with a constant velocity;
- Obstacle accelerating (changing velocity, while the second vehicle is overtaking it).
However, in order to keep the proof of concept separate from such subsets of the problem, we wish to keep the present paper free of such complexities and address them in the works to follow.
Author Contributions
Conceptualization, K.A.; methodology, K.A. and S.M.; software, S.M.; validation, K.A. and S.M.; formal analysis, K.A. and S.M.; investigation, K.A. and S.M.; writing—original draft preparation, K.A. and S.M.; writing—review and editing, K.A. and S.M.; visualization, K.A. and S.M. All authors have read and agreed to the published version of the manuscript.
Funding
This research received no external funding.
Institutional Review Board Statement
Not applicable.
Informed Consent Statement
Not applicable.
Data Availability Statement
The raw data supporting the conclusions of this article will be made available by the authors on request.
Conflicts of Interest
The authors declare that they have no conflicts of interest.
Nomenclature
| Latin Letters | ||
| M | Mach number | - |
| MT | Mach number corresponding the traffic flow | - |
| t | Time | s |
| u | Longitudinal velocity component | m/s |
| v | Lateral velocity component | m/s |
| p | Pressure | N/m2 |
| a | Speed of sound | m/s |
| L | Length—distance between following vehicles | m |
| LV | Vehicle length | m |
| W | Road width | m |
| WV | Vehicle width | m |
| WD | Lateral displacement | m |
| g | Acceleration of gravity | m/s2 |
| T | Temperature | K |
| q | Heat | J |
| h | Enthalpy | J |
| amax | Maximum braking acceleration of the vehicle | m/s2 |
| cp | Specific heat at constant pressure | J/kg·K |
| cv | Specific heat at constant volume | J/kg·K |
| f | Degrees of freedom of a molecule | - |
| D | Diameter | m |
| Cαf/r | Tire cornering stiffness at front/rear | N/rad |
| a’ | Clothoid scaling factor | - |
| X, Y | Global coordinates | m |
| Rotation matrix from frame A to frame B | - | |
| vi* | Desired velocity in section number i | - |
| k | Smoothing parameter | - |
| N | Number of path sections | - |
| m | Vehicle mass | kg |
| vx | Vehicle longitudinal velocity in body-fixed frame | m/s |
| vy | Vehicle lateral velocity in body-fixed frame | m/s |
| r | Vehicle yaw velocity | rad/s |
| Fxi, Fyi, Fzi | Longitudinal/lateral/vertical tire forces on wheel i | N |
| Iz | Vehicle yaw mass moment of inertia | kg·m2 |
| Iw | Wheel moment of inertia | kg·m2 |
| a1 | Distance from mass center to front axle | m |
| a2 | Distance from mass center to rear axle | m |
| l | Vehicle wheelbase | m |
| w | Vehicle track width | m |
| e | Lateral path-tracking error | m |
| s | Sliding surface | m/s |
| k’ | Sliding-mode controller gain | - |
| kP | Proportional controller gain | N |
| kD | Derivative controller gain | Ns |
| Rw | Tire radius | m |
| h | Mass center height | m |
| ax | Vehicle longitudinal acceleration in body-fixed frame | m/s2 |
| ay | Vehicle longitudinal acceleration in body-fixed frame | m/s2 |
| Ti | Input torque on wheel i | Nm |
| Greek Letters | ||
| ʋ | Velocity | m/s |
| ρ | Density | kg/m3 |
| τ | Driver/vehicle reaction time delay | s |
| γ | Poisson constant—ratio of specific heats | - |
| θ | Wedge half angle | deg |
| β | Oblique shockwave angle | deg |
| μ | Friction coefficient | - |
| τw | Shear stress on the wall | N/m2 |
| υ | Prandtl–Meyer function/angle | deg |
| µ1 | First Mach line angle | deg |
| µ2 | Last Mach line angle | deg |
| θc | Clothoid tangent angle | rad |
| ψi | Global orientation of path section i | rad |
| ωi | Angular velocity of wheel i | rad/s |
| δ | Steering angle | rad |
| αi | Slip-angle of tire i | rad |
| βv | Vehicle body side-slip angle | rad |
| Δψ | Vehicle heading angle error | rad |
| λ | Sliding-mode controller parameter | s−1 |
| Φ | Sliding-mode controller parameter | m/s |
| Abbreviations | ||
| SW | Shockwave | |
| NSW | Normal shockwave | |
| OSW | Oblique shockwave | |
| EF | Prandtl–Meyer expansion fan | |
| DOF | Degrees of freedom | |
| PD | Proportional derivative | |
| SMC | Sliding-mode controller | |
| Subscripts | ||
| 1 | Pre-shock state | |
| 2 | Post-shock state | |
| T | Traffic | |
| V | Vehicle | |
| R | Road | |
| char | Characteristic | |
| n | Normal | |
| t | Tangential | |
| T | Traffic flow | |
| ∞ | Free stream, far-field | |
| r | Right-hand of the domain | |
| l | Left-hand of the domain |
Appendix A. Exhaustive Flow Field Results
To complement Figure 14 and Figure 15, which show the flow field and trajectories configuration for a selected number of cases, here exhaustive case configurations are presented based on Table 4 (see also Figure 13).
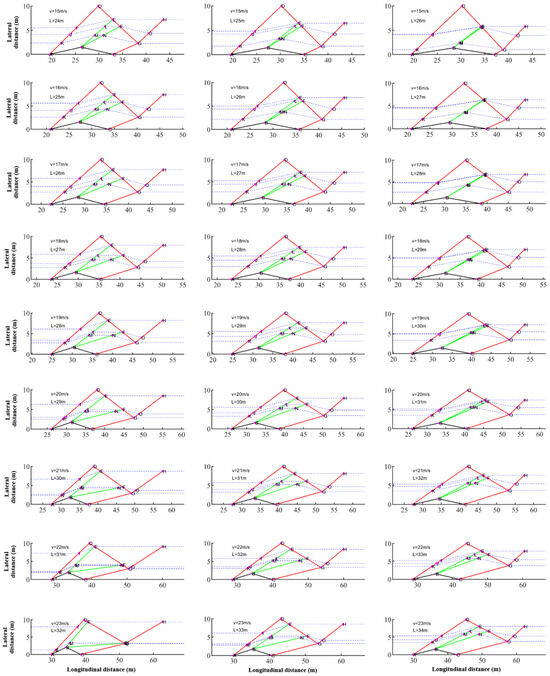
Figure A1.
Equivalent flow field configuration for the cases with τ = 1.3 for human drivers. The capital letters indicate the nodes presented in Figure 5.
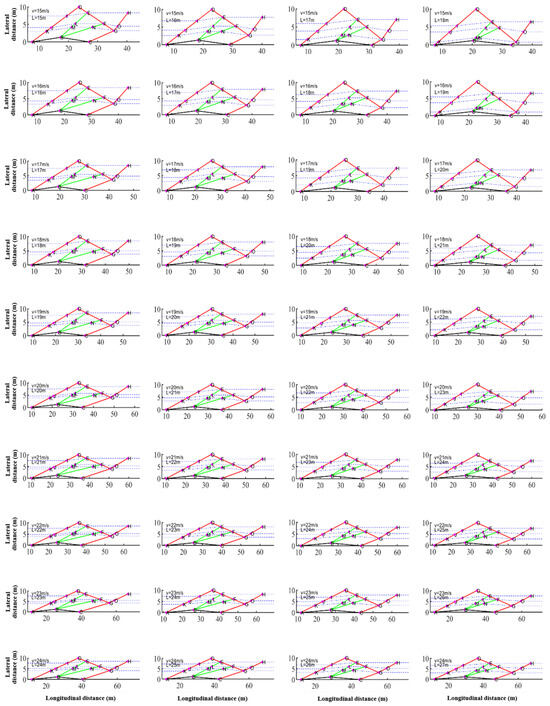
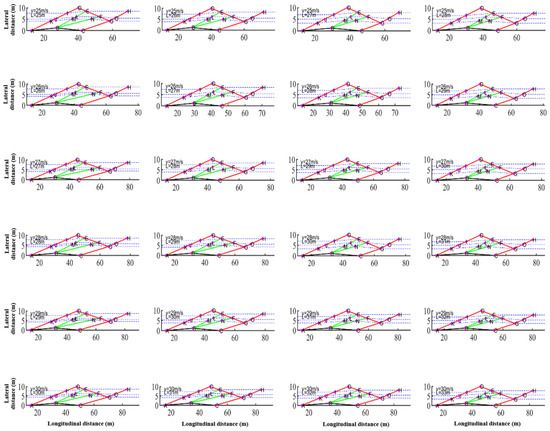
Figure A2.
Equivalent flow field configuration for the cases with τ = 0.5 for autonomous drivers.
References
- Bergenhem, C.; Hedin, E.; Skarin, D. Vehicle-to-vehicle communication for a platooning system. Procedia Soc. Behav. Sci. 2012, 48, 1222–1233. [Google Scholar] [CrossRef]
- Matolak, D.W. Modeling the vehicle-to-vehicle propagation channel: A review. Radio Sci. 2014, 49, 721–736. [Google Scholar] [CrossRef]
- Qu, F.; Wu, Z.; Wang, F.Y.; Cho, W. A security and privacy review of VANETs. IEEE Trans. Intell. Transp. Syst. 2015, 16, 2985–2996. [Google Scholar] [CrossRef]
- Tee, C.A.T.H.; Lee, A.C. Survey of position-based routing for inter-vehicle communication system. In Proceedings of the 2008 First International Conference on Distributed Framework and Applications, Penang, Malaysia, 21–23 October 2008; pp. 174–182. [Google Scholar]
- Ahmed, F.; Deb, K. Multi-objective path planning using spline representation. In Proceedings of the 2011 IEEE International Conference on Robotics and Biomimetics, Phuket, Thailand, 7–11 December 2011; pp. 1047–1052. [Google Scholar]
- Bando, M.; Hasebe, K.; Nakayama, A.; Shibata, A.; Sugiyama, Y. Dynamical model of traffic congestion and numerical simulation. Phys. Rev. E 1995, 51, 1035–1042. [Google Scholar] [CrossRef]
- Berglund, T.; Brodnik, A.; Jonsson, H.; Staffanson, M.; Soderkvist, I. Planning smooth and obstacle-avoiding B-spline paths for autonomous mining vehicles. IEEE Trans. Autom. Sci. Eng. 2009, 7, 167–172. [Google Scholar] [CrossRef]
- Choi, J.W.; Curry, R.; Elkaim, G. Path planning based on Bézier curve for autonomous ground vehicles. In Proceedings of the Advances in Electrical and Electronics Engineering—IAENG Special Edition of the World Congress on Engineering and Computer Science 2008, San Francisco, CA, USA, 22–24 October 2008; pp. 158–166. [Google Scholar]
- Dolgov, D.; Thrun, S.; Montemerlo, M.; Diebel, J. Path planning for autonomous vehicles in unknown semi-structured environments. Int. J. Robot. Res. 2010, 29, 485–501. [Google Scholar] [CrossRef]
- Schouwenaars, T.; De Moor, B.; Feron, E.; How, J. Mixed integer programming for multi-vehicle path planning. In Proceedings of the 2001 European Control Conference (ECC), Porto, Portugal, 4–7 September 2001; pp. 2603–2608. [Google Scholar]
- González, D.; Pérez, J.; Milanés, V.; Nashashibi, F. A review of motion planning techniques for automated vehicles. IEEE Trans. Intell. Transp. Syst. 2015, 17, 1135–1145. [Google Scholar] [CrossRef]
- Han, S.; Choi, B.; Lee, J. A precise curved motion planning for a differential driving mobile robot. Mechatronics 2008, 18, 486–494. [Google Scholar] [CrossRef]
- Montemerlo, M.; Becker, J.; Bhat, S.; Dahlkamp, H.; Dolgov, D.; Ettinger, S.; Haehnel, D.; Hilden, T.; Hoffmann, G.; Huhnke, B.; et al. Junior: The Stanford entry in the urban challenge. J. Field Robot. 2008, 25, 569–597. [Google Scholar] [CrossRef]
- Li, X.; Li, G.; Bian, Z. Research on Autonomous Vehicle Path Planning Algorithm Based on Improved RRT* Algorithm and Artificial Potential Field Method. Sensors 2024, 24, 3899. [Google Scholar] [CrossRef]
- Wang, Z.; Li, P.; Wang, Z.; Li, Z. APG-RRT: Sampling-Based Path Planning Method for Small Autonomous Vehicle in Closed Scenarios. IEEE Access 2024, 12, 25731–25739. [Google Scholar] [CrossRef]
- Yu, J.; Chen, C.; Arab, A.; Yi, J.; Pei, X.; Guo, X. RDT-RRT: Real-time double-tree rapidly-exploring random tree path planning for autonomous vehicles. Expert Syst. Appl. 2024, 240, 122510. [Google Scholar] [CrossRef]
- Lin, Z.; Wu, K.; Shen, R.; Yu, X.; Huang, S. An efficient and accurate A-star algorithm for autonomous vehicle path planning. IEEE Trans. Veh. Technol. 2023, 73, 9003–9008. [Google Scholar] [CrossRef]
- Zohaib, M.; Pasha, S.M.; Javid, N. An Improved Algorithm for Collision Avoidance in Environments Having U and H Shaped Obstacles. Stud. Inform. Control. 2014, 23, 97–106. [Google Scholar] [CrossRef]
- Zohaib, M.; Pasha, S.M.; Javid, N.; Iqbal, J. IBA: Intelligent Bug Algorithm—A Novel Strategy to Navigate Mobile Robots Autonomously. In Proceedings of the International Multi-Topic Conference (IMTIC 2013), Jamshoro, Pakistan, 18–20 December 2013; pp. 291–299. [Google Scholar]
- Jabari, S.E.; Liu, H.X. A stochastic model of traffic flow: Theoretical foundations. Transp. Res. Part B 2012, 46, 156–174. [Google Scholar] [CrossRef]
- Bonzani, I.; Mussone, L. Stochastic modelling of traffic flow. Math. Comput. Model. 2002, 36, 109–119. [Google Scholar] [CrossRef]
- Hoogendoorn, S.P.; van Wageningen-Kessels, F.L.M.; Daamen, W.; Duives, D.C. Continuum modelling of pedestrian flows: From microscopic principles to self-organised macroscopic phenomena. Physica A 2014, 416, 684–694. [Google Scholar] [CrossRef]
- Horiguchi, T.; Sakakibara, T. Numerical simulations for traffic-flow models on a decorated square lattice. Physica A 1998, 252, 388–404. [Google Scholar] [CrossRef]
- Hoogendoorn, S.P.; van Wageningen-Kessels, F.; Daamen, W.; Duives, D.C.; Sarvi, M. Continuum theory for pedestrian traffic flow: Local route choice modelling and its implications. Transp. Res. Procedia 2015, 7, 381–397. [Google Scholar] [CrossRef]
- Leutzbach, W. Introduction to the Theory of Traffic Flow; Springer: Berlin/Heidelberg, Germany, 1988. [Google Scholar]
- Wolfram, S. Theory and Applications of Cellular Automata; World Scientific: Singapore, 1986. [Google Scholar]
- Bellomo, N.; Marasco, A.; Romano, A. From the modelling of driver’s behaviour to hydrodynamic models and problems of traffic flow. Nonlinear Anal. Real World Appl. 2002, 3, 339–363. [Google Scholar] [CrossRef]
- Hueper, J.; Dervisoglu, G.; Muralidharan, A.; Gomes, G.; Horowitz, R.; Varaiya, P. Macroscopic modeling and simulation of freeway traffic flow. In Proceedings of the 12th IFAC Symposium on Transportation Systems, Redondo Beach, CA, USA, 2–4 September 2009. [Google Scholar]
- Cho, H.-J.; Lo, S.-C. Modeling self-consistent multi-class dynamic traffic flow. Physica A 2002, 312, 342–362. [Google Scholar]
- Baykal-Gürsoy, M.; Xiao, W.; Ozbay, K. Modeling traffic flow interrupted by incidents. Eur. J. Oper. Res. 2009, 195, 127–138. [Google Scholar] [CrossRef]
- Marques, W., Jr.; Méndez, A.R. On the kinetic theory of vehicular traffic flow: Chapman–Enskog expansion versus Grad’s moment method. Physica A 2013, 392, 3430–3440. [Google Scholar] [CrossRef]
- Coscia, V.; Delitala, M.; Frasca, P. On the mathematical theory of vehicular traffic flow II: Discrete velocity kinetic models. Int. J. Non-Linear Mech. 2007, 42, 411–421. [Google Scholar] [CrossRef]
- Shi, W.; Lu, W.-Z.; Xue, Y.; He, H.-D. Revised lattice Boltzmann model for traffic flow with equilibrium traffic pressure. Physica A 2016, 443, 22–31. [Google Scholar] [CrossRef]
- Ma, J.; Cui, J. Traffic flow density distribution based on FEM. Phys. Procedia 2012, 25, 939–944. [Google Scholar] [CrossRef][Green Version]
- Li, J.; Wang, H.; Chen, Q.-Y.; Ni, D. Traffic viscosity due to speed variation: Modeling and implications. Math. Comput. Model. 2010, 52, 1626–1633. [Google Scholar] [CrossRef]
- Ugnenko, E.; Uzhvieva, E.; Voronova, Y. Simulation of traffic flows on the road network of urban area. Procedia Eng. 2016, 134, 153–156. [Google Scholar] [CrossRef]
- Lighthill, M.J.; Whitham, G.B. On kinematic waves. II. A theory of traffic flow on long crowded roads. Proc. R. Soc. Lond. Ser. A 1955, 229, 317–345. [Google Scholar]
- Richards, P.I. Shock waves on the highway. Oper. Res. 1956, 4, 42–51. [Google Scholar] [CrossRef]
- Payne, H.J. Models of freeway traffic and control. Math. Models Public Syst. 1971, 1, 51–60. [Google Scholar]
- De Angelis, D. Nonlinear hydrodynamic models of traffic flow modelling and mathematical problems. Math. Comput. Model. 1999, 29, 83–95. [Google Scholar] [CrossRef]
- Zhang, H.M. Driver memory, traffic viscosity and a viscous vehicular traffic flow model. Transp. Res. Part B Methodol. 2003, 37, 27–41. [Google Scholar] [CrossRef]
- Honda, Y.; Horiguchi, T. Self-organization in four-direction traffic-flow model. J. Phys. Soc. Jpn. 2000, 69, 3744–3751. [Google Scholar] [CrossRef]
- Nagatani, T. Self-organized criticality in 1D traffic flow model with inflow or outflow. J. Phys. A Math. Gen. 1995, 28, L119–L124. [Google Scholar] [CrossRef]
- Wang, B.-H.; Wang, L.; Hui, P.M. One-dimensional Fukui–Ishibashi traffic flow model. J. Phys. Soc. Jpn. 1997, 66, 3683–3684. [Google Scholar] [CrossRef]
- Guo, K.; Guan, H. Modelling of driver/vehicle directional control system. Veh. Syst. Dyn. 1993, 22, 141–184. [Google Scholar] [CrossRef]
- Levermore, T.; Ordys, A.; Deng, J. A review of driver modelling. In Proceedings of the 2014 UKACC International Conference on Control (CONTROL), Loughborough, UK, 9–11 July 2014; pp. 296–300. [Google Scholar]
- Summala, H. Brake reaction times and driver behaviour analysis. Transp. Hum. Factors 2000, 2, 217–226. [Google Scholar] [CrossRef]
- Subosits, J.K.; Gerdes, J.C. From the racetrack to the road: Real-time trajectory replanning for autonomous driving. IEEE Trans. Intell. Veh. 2019, 4, 309–320. [Google Scholar] [CrossRef]
- Delaigue, P.; Eskandarian, A. A comprehensive vehicle braking model for predictions of stopping distances. Proc. Inst. Mech. Eng. Part D J. Automob. Eng. 2004, 218, 1409–1417. [Google Scholar] [CrossRef]
- Marzbani, H.; Jazar, R.N.; Fard, M. Better road design using clothoids. In Sustainable Automotive Technologies 2014; Springer: Cham, Switzerland, 2015; pp. 25–40. [Google Scholar]
- Jazar, R.N. Advanced Vehicle Dynamics; Springer: Cham, Switzerland, 2019. [Google Scholar]
- Pacejka, H. Tire and Vehicle Dynamics; Elsevier: Oxford, UK, 2012. [Google Scholar]
- Brennan, S.; Alleyne, A. Robust scalable vehicle control via non-dimensional vehicle dynamics. Veh. Syst. Dyn. 2001, 36, 255–272. [Google Scholar] [CrossRef]
- Jazar, R.N. Mathematical theory of autodriver for autonomous vehicles. J. Vib. Control 2010, 16, 253–279. [Google Scholar] [CrossRef]
- Milani, S.; Marzbani, H.; Khazaei, A.; Jazar, R.N. Vehicles are lazy: On predicting vehicle transient dynamics by steady-state responses. In Nonlinear Approaches in Engineering Applications; Springer: Cham, Switzerland, 2020; pp. 3–38. [Google Scholar]
- Jazar, R.N. Vehicle Dynamics: Theory and Application; Springer: Cham, Switzerland, 2017. [Google Scholar]
- Slotine, J.J.E.; Li, W. Applied Nonlinear Control; Prentice Hall: Englewood Cliffs, NJ, USA, 1991. [Google Scholar]
- Milani, S.; Khayyam, H.; Marzbani, H.; Azad, N.L.; Melek, W.; Jazar, R.N. Smart autodriver algorithm for real-time autonomous vehicle trajectory control. IEEE Trans. Intell. Transp. Syst. 2020, 4, 309–320. [Google Scholar] [CrossRef]
- Liang, Y.; Zhang, D.; Li, G.; Wu, T. Adaptive Chattering-Free PID Sliding Mode Control for Tracking Problem of Uncertain Dynamical Systems. Electronics 2022, 11, 3499. [Google Scholar] [CrossRef]
Disclaimer/Publisher’s Note: The statements, opinions and data contained in all publications are solely those of the individual author(s) and contributor(s) and not of MDPI and/or the editor(s). MDPI and/or the editor(s) disclaim responsibility for any injury to people or property resulting from any ideas, methods, instructions or products referred to in the content. |
© 2025 by the authors. Licensee MDPI, Basel, Switzerland. This article is an open access article distributed under the terms and conditions of the Creative Commons Attribution (CC BY) license (https://creativecommons.org/licenses/by/4.0/).


