Article

A Logit Approach to Study the Attractiveness of DRT Stops Location: The Case Study of Ragusa, Italy

1
Department of Engineering and Architecture, University of Enna Kore, Cittadella Universitaria, 94100 Enna, Italy
2
Department of Engineering Management, Aston University, Aston Street, Birmingham B4 7ET, UK
*
Authors to whom correspondence should be addressed.
Future Transp. 2025, 5(4), 156; https://doi.org/10.3390/futuretransp5040156
Submission received: 20 September 2025 / Revised: 18 October 2025 / Accepted: 20 October 2025 / Published: 1 November 2025

Abstract

Demand-Responsive Transport (DRT) services ensure the implementation of more sustainable transport solutions and focuses on the creation of more flexible and personalised public transport systems. They help to reduce the use of cars, improve service efficiency, and reduce the environmental impact. The attractiveness of DRTs depends on the type of activities served (e.g., schools, hospitals, modal interchange hubs). The attractiveness of a specific stop depends not only on its location but also on proximity to essential services (such as schools). The aim of this study is to identify which categories of activities most influence users’ choice of stops. A conditional logit model is developed to analyse drop-off stop selection, based on the location and configuration of key stops and major attraction points in the monitored case study in Ragusa, Sicily (southern Italy). Accessibility to different attraction points from stops is considered as the main independent variable. The results show that proximity to sports facilities and schools strongly influence users’ choice of stops, along with nearby modal interchange stations and shopping-related activities. Conversely, stops near health centres tended to be less attractive in the study area. Furthermore, sports facilities exert the strongest attraction, while travel patterns to health services deviate from existing literature, likely reflecting the limited availability of complementary transport options.

1. Introduction

Agenda 2030 places a strong emphasis on sustainable cities and communities, as reflected in Goal 11: “Make cities and human settlements inclusive, safe, resilient, and sustainable.” Target 11.a specifically calls for “Supporting positive economic, social, and environmental links between urban, peri-urban, and rural areas by strengthening national and regional development planning” [1]. Strengthening these connections supports not only economic development but also social cohesion and environmental sustainability across regions. Effective planning and integration between urban, peri-urban, and rural areas can enhance accessibility, reduce inequalities, and promote the efficient use of resources, thereby contributing to the broader objectives of Agenda 2030. Similarly, Goal 9 “Build resilient infrastructure, promote inclusive and sustainable industrialization and foster innovation” is characterised by indicator 9.1.1 “Develop quality, reliable, sustainable and resilient infrastructure, including regional and transborder infrastructure, to support economic development and human well-being, with a focus on affordable and equitable access for all”. The goal related to urban sustainability and infrastructure and innovation highlights the key challenge of the new millennium: accessibility and use of infrastructure.
Reducing private vehicle use is closely linked to the attractiveness of alternative forms of transport, particularly local public transport.
The attractiveness of local public transport depends on qualitative and quantitative factors, such as frequency and reliability of the service, the extent of the network and the accessibility to destinations, vehicle and stations comfort, and integration with other forms of transportation (intermodally).
Additionally influencing its attractiveness are safety, service costs and the ease of obtaining tickets, and information. The urban structure of a city, with its density and mixed land use, influences demand and public transport attractiveness [2,3].
The development of local public transportation is ideal for large areas with high transportation demand. These areas implement strategies to improve user training and information, as well as policies to reduce transportation costs [4,5].
These objectives are particularly important in low-demand areas, which are characterised by low population density, limited transport services, and distance from essential infrastructure [6,7].
In certain contexts, it may be more useful to rely on more flexible services. Demand-Responsive Transport (DRT) services emerge in this regard, which the literature describes as “an intermediate form of public transport, halfway between a regular service route using small, low-floor buses with variable routes, and highly personalized transport services offered by taxis” [8]. These services generally feature semi-rigid routes and flexibility with respect to demand; this is especially important in rural areas, where low population density and limited demand make conventional public transport inefficient [9,10,11]. This mode of transportation promotes sustainability by offering flexible mobility that adapts to users’ needs, reducing reliance on private cars and complementing conventional public transport services. It optimises resources, respects public spaces, and provides a more widespread service, particularly in peripheral or low-demand areas. This contributes to greater environmental sustainability and social inclusiveness [12,13]. DRT services are useful in a wide range of market niches [9]; this article focuses on analysing the potential travel goals of rural DRT users, in a case where the service operates primarily outside of daily peak hours, with the aim of determining which activity categories are most attractive to users. To this end, Random Utility Theory is considered, which allows the relating of the attributes of alternatives to user choices [14,15].
This paper proposes a framework for studying services most affected by on-demand transportation. Section 2 provides background information on these services, the types of activities they serve, and demand studies conducted on users of on-demand services, with a particular focus on discrete choice models. Section 3 describes the methodological elements used to highlight the supply and demand systems, emphasising the functional structure of the conditional logit model, as well as describing the main elements of the case study. Section 4 shows calibration and validation of the proposed model. Section 5 discusses the main results and theoretical implications of the model. Finally, Section 6 summarises the conclusions and future developments of the study.

2. Background

As defined in the introduction, DRT services primarily serve contexts with low demand where conventional services are absent or poorly distributed. Ryley et al. [16] have identified various market niches that DRT services can target. The authors highlight rural connections, shopping destinations, and modal interchange hubs, such as railway stations and airports, as existing solid markets. They indicate urban areas with sporting events and entertainment as growth markets.

2.1. Factors Affecting DRT

The first/last mile problem in urban transport services refers to limited connectivity and accessibility to high-capacity commuter lines.
This problem is often encountered in low-density residential areas, where the inflexibility and limited resources of traditional public transport systems result in reduced service coverage. DRTs offer an alternative for providing first/last mile connection services to low-density areas, thanks to their flexibility in adapting to different demand patterns [17].
DRTs can be useful to serve a variety of activities. The benefits of DRTs depend on both infrastructure- and service-related aspects (i.e., booking methods, type of stops) and demand-related aspects (type of users).
There is no doubt that the configuration of the system and the interaction solutions for potential travellers, as well as their preferences regarding the use of DRT, play a fundamental role in making DRTs more attractive [18].
In particular, with regard to public transport and on-demand transport services: in recent years, various cities, both in Italy and abroad, have begun to look for ways to encourage people to use public transport to reduce pollution and traffic. The incentive that has often been used is to lower the cost of season tickets or single-journey tickets, but this is not the only way: a new study shows that the design and functionality of stops are also factors that should not be underestimated [19].
The distribution of virtual stops impacts the performance of a ride-pooling service. Stops can be distributed based on passenger walking distances and demand by comparing location characteristics and using public transportation stops and/or locations at major intersections. It should be noted that differences in demand and population density play an important role [20].
Some studies analyse spatial clusters where demand is insufficient yet concentrated enough to support DRT operations. These studies offer ideas for planning and designing preliminary DRT service areas, which supports strategic planning [21].
The characterisation also changes depending on the user groups to be served. In some cases, such as markets referred to as “Rural, General Public”, services may be aimed at all users. In other cases, services are reserved for specific clusters of the population in the concerned area. (i.e., “mobility impaired”).
Scientific literature further emphasises that DRT services can be useful for specific population clusters, such as the elderly.
In fact, in research conducted by the authors in [22] concerning the importance of social influence, it is emphasised that designing a good service is not enough; it is also necessary to consider communication and dissemination.
Older adults can acquire information through face-to-face consultations about the use of DRT, as well as reports from family members and friends. This enables operators and policymakers to take actions to promote the use of DRT among older adults by emphasising social influence [18].
Similarly, research conducted by the authors in [23] highlights the fundamental role of trust and service quality in shaping public attitudes toward DRT services, as well as the importance of personal innovation and subjective norms in promoting its adoption. At the same time, this research highlights the need to address perceived risk to foster acceptance. Therefore, these findings have theoretical and practical implications that guide policymakers and operators in improving DRTs in the context of evolving transportation systems, such as in China.
The study conducted by the authors in [24] highlights that both waiting time and ease of access increase the satisfaction of DRT customers. Other research also indicates that satisfaction levels can vary according to factors such as gender, age, and income [25,26].
Mobility in rural areas requires greater attention, not only because of the high percentage of the population that live there but also because of the specific difficulties and needs that characterise these areas, their inhabitants, and visitors.
DRT services can bridge the gap in terms of flexible and sustainable public transport in rural areas. However, as most studies conducted in the past have focused on the urban context, there is still a lack of knowledge about the factors determining the use of these systems.
The research conducted in Austria by the authors in [27] has analysed and compared a service characterised by fixed schedules and stops that serve mainly sub-urban areas and a door-to-door service, also with fixed schedules, but mainly for the local population and tourists. Results suggest that most DRT users are women. However, results from different user groups and services suggest that no single factor, among user characteristics, usage cases, and the determinants of satisfaction with such services, unanimously influences the likelihood of travelling by DRT. Overall satisfaction was found to be related to satisfaction with trip-level attributes and system design characteristics.
Among the case studies in the Mediterranean area, the Baltic region is a pioneer in the adoption of flexible DRT systems [28]. On-demand services have increased over the last 10 years and are becoming relatively popular, especially in Norway, where they are integrated with local public transport. In Estonia, on the other hand, they are still in the development phase and operate on a small scale. In Denmark, the on-demand service is well-centralised and -developed and is almost used as an alternative to local public transport, except in rural areas where only a small part of the lines is concessioned to the on-demand service operator. In Sweden, on the other hand, the lack of management and monitoring of the service according to a single regulatory framework means that services with different characteristics are offered, with different routes and departure points for different user clusters.
The model applied to the case of a residential area in Athens [17], in Greece, highlights how the service needs modern infrastructure and equipment in order to function efficiently. Only by introducing simple but effective solutions can the quality of service in the areas concerned be improved.
On-demand transport services have also seen significant growth in Spain. From analysis of the research in [29], it has emerged that in order to make the service efficient and enhance its effectiveness, it would be necessary to make traditional transport regulations more flexible and allow the activation of occasional DRT services with different pricing.
Table 1 provides a summary of recent literature, highlighting the usefulness of DRT services in specific market niches. In order to provide an example, for each market niche, two significant contributions from the literature are included.
Contributions on rural topics are the most numerous; this is linked to certain intrinsic characteristics of rural areas which, due to their low population density and distance from activities, have the typical characteristics of low-demand areas targeted by DRT services.
Less evidence is available for healthcare services such as hospitals; however, the literature highlights the potential in this area, especially regarding non-emergency healthcare trips. Regarding the leisure category, it should be noted that several services target night-time activities and are intended to be comparable to public transport. DRT services have also shown wide applicability for commuting, both for home–work and home–study journeys.
As shown in Table 1, modal interchange hubs are interested by DRT; scientific literature has shown great interest in the possibility of using on-demand services to access long-distance transport systems, such as railway stations and airports.

2.2. Modelling Approaches for DRTs

Random Utility Models are useful because they allow researchers to study user discrete choices based on the attributes of alternatives, users, and choice situations. Since the first contributions on the topic [38,39], these models have been particularly well-suited to modelling transportation problems, particularly modal choice. The assumption that individuals choose the alternative with maximum utility is the basis of RUM models and is still a reference hypothesis in modelling; the proposed framework, in which user utility can be defined as the sum of a systematic component and a random component, remains an effective assumption for describing choice problems.
Main contributions on the use of discrete choice models in the choice of DRT services are shown. The contributions analysed are mainly aimed at studying the preferences between DRT and other transport modes. Logit models to understand differences among users in DRT adoption compared to other transport modes are relevant in the literature: models were calibrated by the data in [16] in order to analyse choices between buses, cars, and DRT services, and similarly, the data in [40] highlighted the propensity and attributes that most determine the use of a DRT service, in order to compare fixed-route and demand-responsive public light bus services; the comparison of transit-integrated ride-sourcing with other transport modes available through the calibration of different models (linear multinomial logit, linear mixed-logit, part-worth mixed-logit, and final mixed-logit models) is also the topic of the work in [41].
There are several relevant examples where these analyses are conducted in urban contexts: Ref. [42] analyse metropolitan demand-responsive transit (M-DRT) in Seoul by integrating psychological aspects; this service was compared with bus, private car, and rail; both multinomial logit and latent class models were developed, while the authors in [43] compared customised bus services with urban railways based on user attitudes and sociodemographic attributes. In both studies, DRT services and urban railways are both alternatives of the choice set. Some works are specifically focused on the rural context, such as [44], which used a multinomial logit model to estimate preferences in a rural Hungarian context to compare demand-responsive bus with cycling, walking, and use of private car.
There are also studies in which the area of residence of the students (city or suburb) is considered as one of the attributes of the choice of DRT: this is the case in [33], which calibrated binary logit models to assess possibility that students would use DRT service in Trieste, Italy, according to destination, time slot, and day of the week.
Other proposed models are focused on the analysis of frequencies or repeatability of DRT choice, then on the analysis of differences among DRT and other modes of transport. Ref. [45] studies the repeatability of choosing a micro-transit service; the difference between travel time with the service and by car, the walking distance from stops, whether the ride is free, and whether it is the first experience, which significantly influences the propensity to repeated use; while the frequency of DRT usage in rural area is the topic of [46], which developed an ordered logit model.
As these contributions demonstrate, most calibrated models focus mainly on user’s attributes. This research focuses on evaluating attributes that influence the attractiveness of DRT services stop locations, in terms of closeness to activity system. The research highlights that there are no models in the literature that calibrate choices according to destinations.
This study aims to provide an initial evaluation of this methodology by considering the attractiveness of each activity or class of activities in relation to a “hybrid” DRT service that does not focus on serving a specific location. This evaluation is applied to a specific target case study in the context of an Italian island. These results help to evaluate if methodology can assess the attractiveness of different activities in relation to a DRT service.

3. Materials and Methods

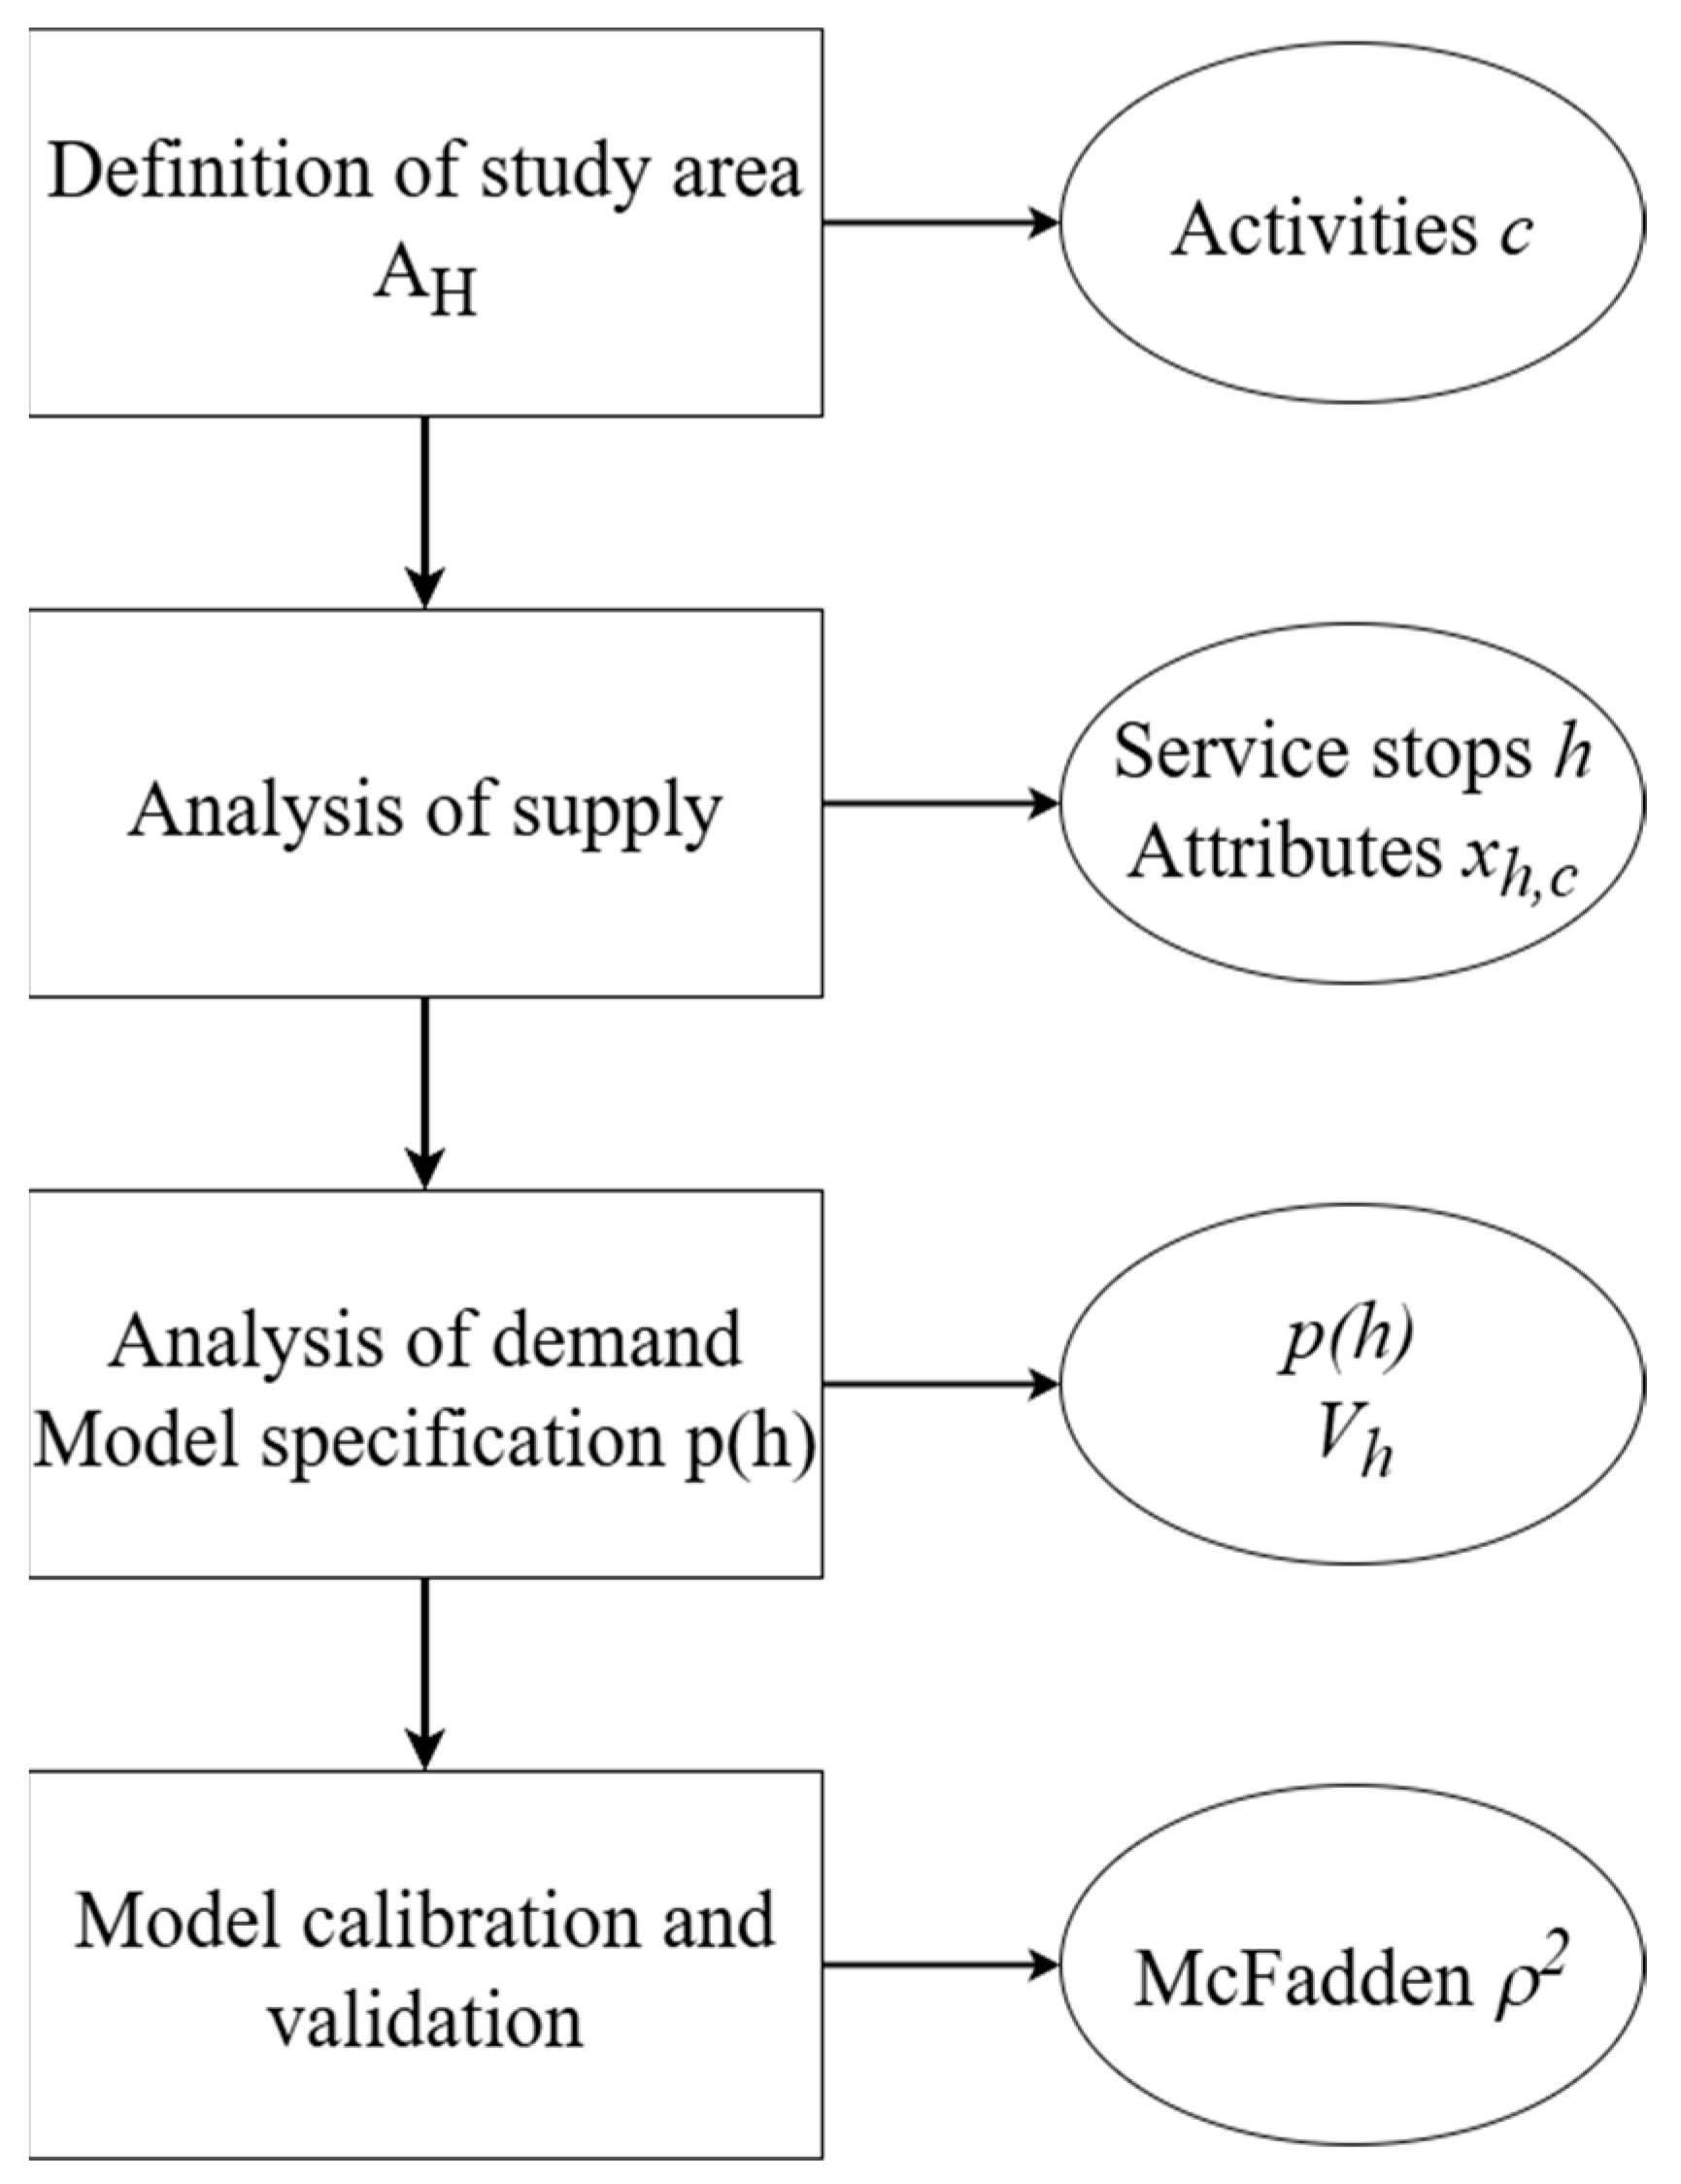
This section describes the general methodology adopted to analyse the attractiveness of stops in a case study. The proposed methodology is summarised in the flowchart in Figure 1. The first step presents the study area and the main characteristics of the analysed context. The second step describes the data used for the analysis. Finally, the third step shows the key elements relating to the modelling.

3.1. Case Study Description

The service operates within the municipality of Ragusa, in Sicily (southern Italy). Ragusa is a city of about 70,000 inhabitants, one of the main cities in southern Sicily [47]. It is the hub of the entire area, where are the main services (schools, sports facilities, railway stations, hospitals) are located. Ragusa is 20 km from the nearest airport, Comiso Airport, and 100 km from the city of Catania, the main urban centre in eastern Sicily.
The Ragusa area is a natural centre of attraction for nearby municipalities, particularly that north of the main urban area, located in mountainous territory. Ragusa is home to various healthcare facilities, educational institutions of various types and levels, sports facilities, and shopping centres. It also has two modal interchange hubs of local and regional importance: the bus station, from which sub-urban connections depart for the nearby airports of Comiso and Catania and for other cities, and the train station, which connects Ragusa with Syracuse, Catania, and other provincial capitals [47].
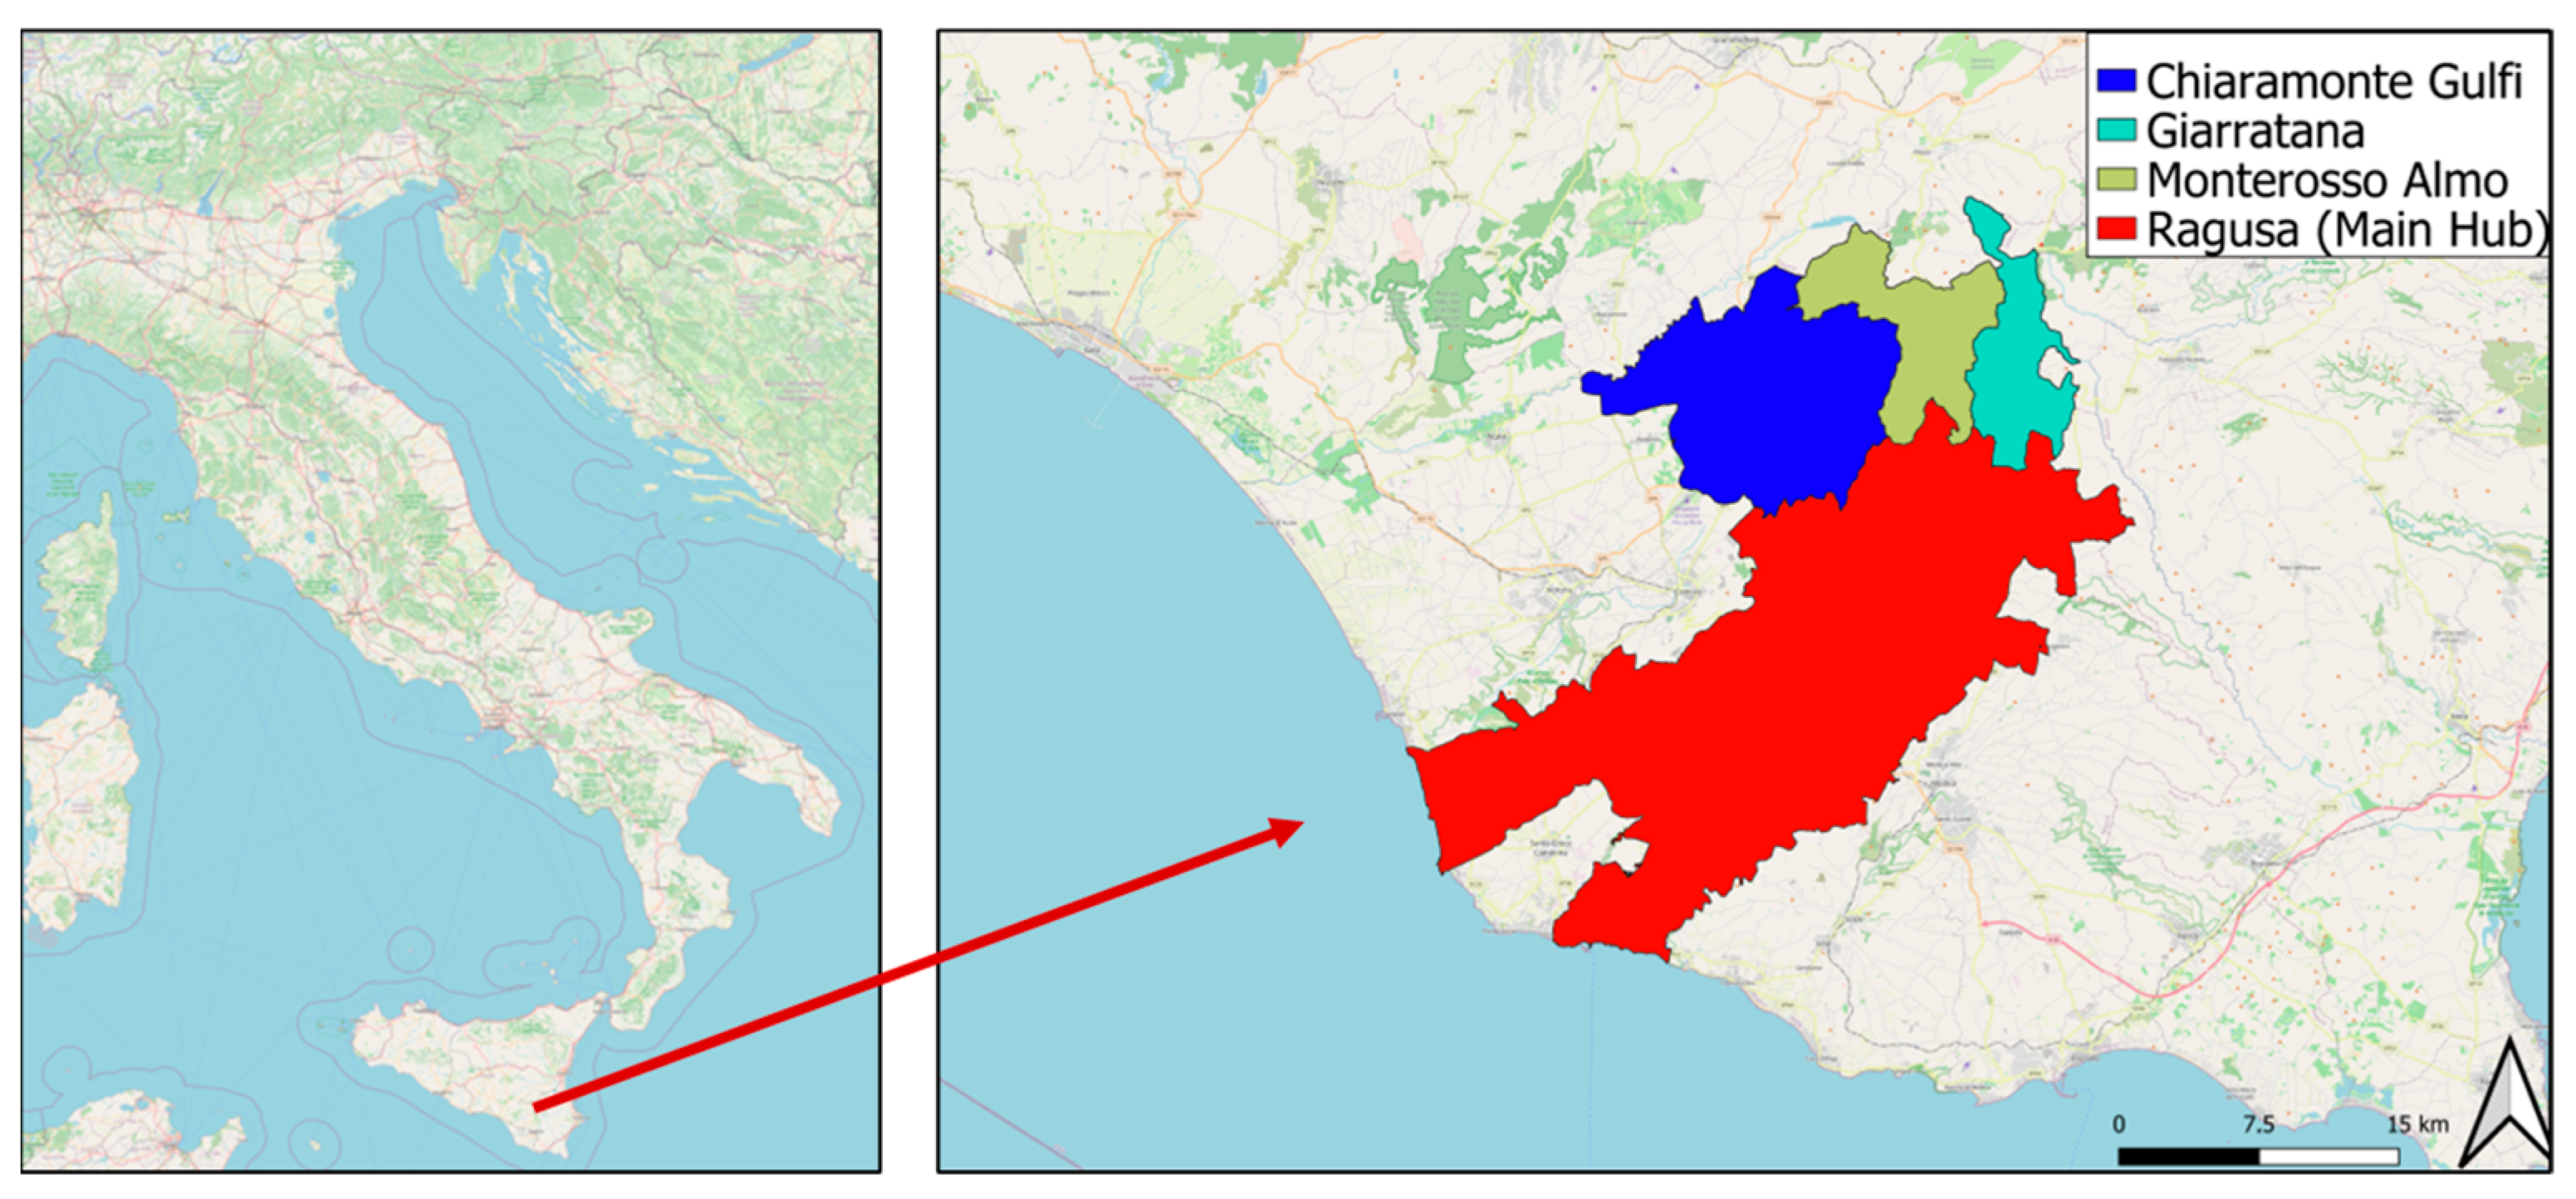
The service analysed connects the municipality of Ragusa with three mountain municipalities in the area: Chiaramonte Gulfi, Giarratana, and Monterosso Almo. The three peripheral areas are characterised by predominantly mountainous terrain and an ageing population [47]. As seen, the city of Ragusa represents the main hub, since most of the activities and services in the area are concentrated there.
Figure 2 shows the location of the four municipalities concerned within Italy and the region of Sicily.
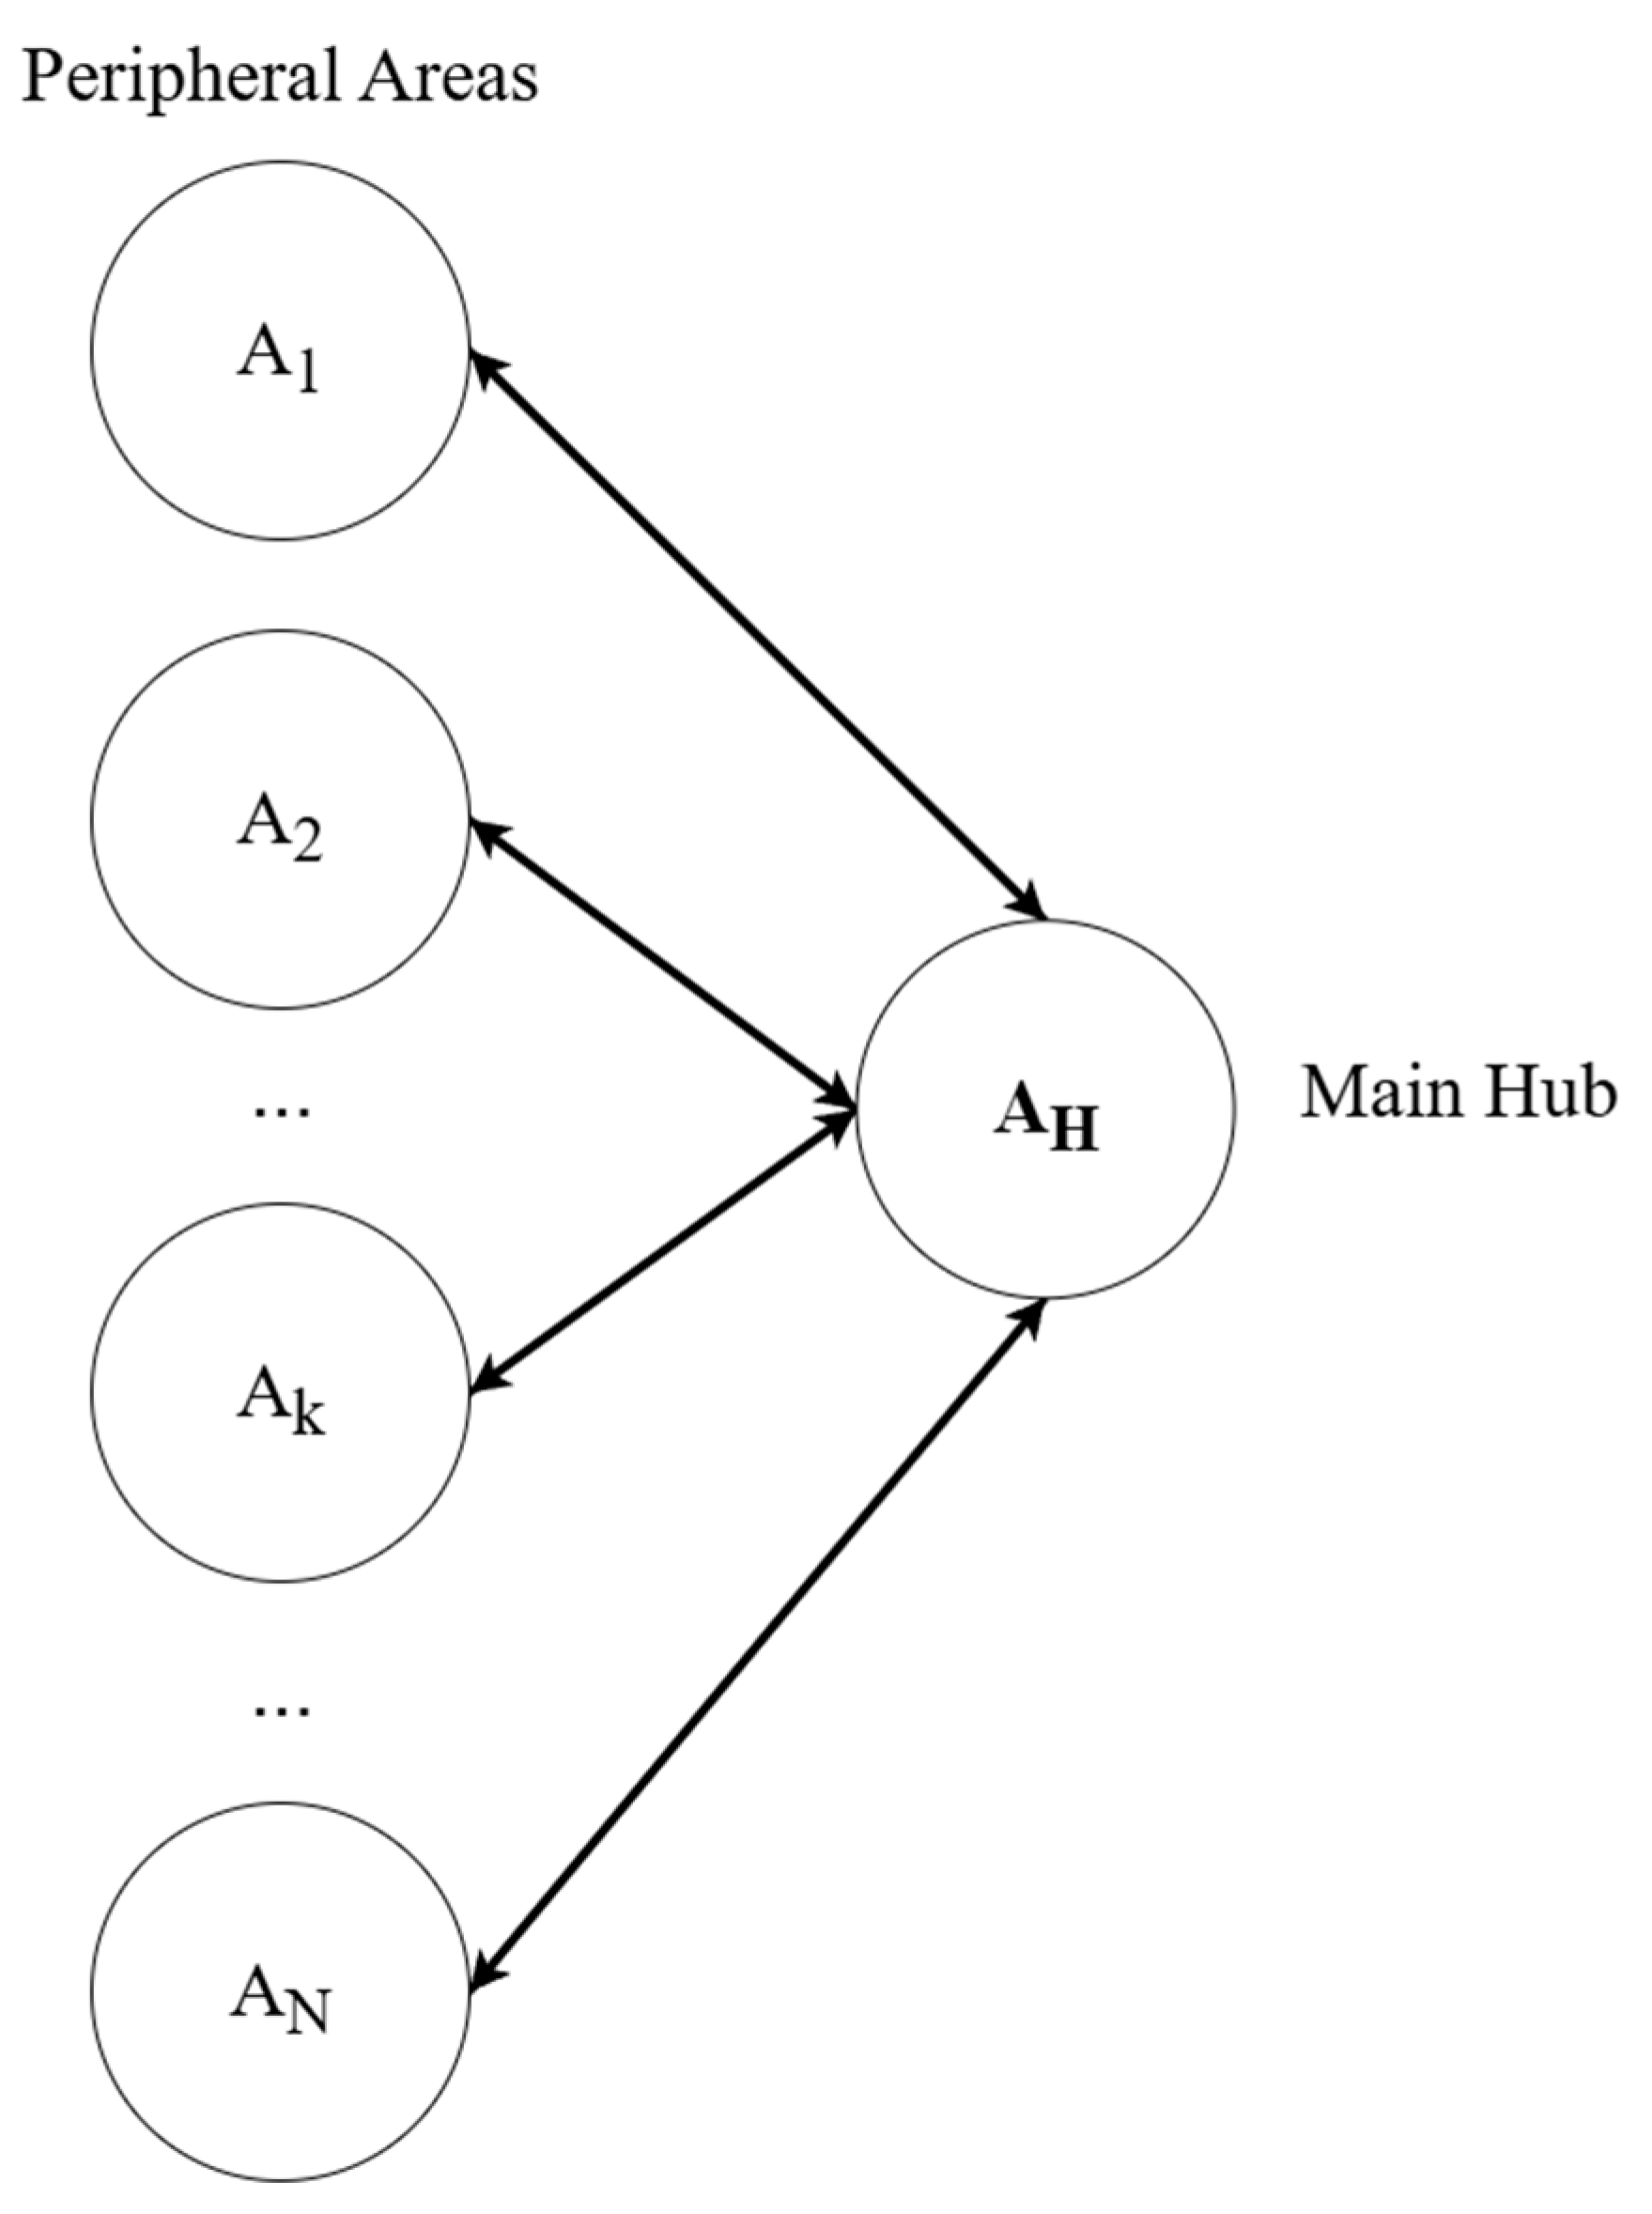
The service studied provides a set of stops in each of the three municipalities and a set of stops in the municipality of Ragusa; each user can choose a stop in one of the smaller municipalities as their departure stop and a stop in the main hub as their destination stop; the reverse is also possible, but trips from one smaller municipality to another are not possible.
The service is therefore partially scheduled. Users can choose their origin and destination stops from a finite set of possibilities; based on the reservations made, the vehicle routing is modified to satisfy all requests.
Given the characteristics defined, the paper analyses trips originating in one of the three mountain municipalities and ending in the main area; consistent with the objectives of the paper, it is necessary to analyse the attractiveness of each of the activities. The service analysed operates connections for six hours a day, from 3:00 p.m. to 9:00 p.m., five days a week, Monday through Friday (i.e., the frequency of the service varies, with a schedule ranging from 30 to 60 min).
The time slot is determined by the operator to avoid overlap with the existing public transport service for the same routes; it is less frequent in the afternoon time slots, while it serves the municipalities concerned in the morning time slots, especially for home–school mobility.

3.2. Data Acquisition

Starting from assessments of the characteristics of the study area, and from preliminary evaluation of potential system users and analysis of best practices of the main public transport operator, five classes of activities potentially affected by the services were identified: sports, instruction, healthcare, shopping and leisure, and modal interchange.
The choice of activities is primarily related to the evaluation of the type of afternoon activities that users can engage in, with reference to the school and sports facilities widely distributed in the destination urban area. Both instruction and sports services were rarely available in the users’ municipalities of origin. For shopping, three medium-to-large commercial areas were identified. Hospitals and other health facilities present in the area were indicated as potential destinations for non-emergency healthcare trips; some of them have dedicated stops. Finally, the two modal interchange hubs (bus station and train station) offer the possibility of reaching the region’s airports and larger cities. The activities in the study area are represented in Figure 3.
The data relating to the trips made have been described in Table 2.
The data obtained can therefore be used to analyse journeys in terms of departure and arrival times, pick-up points and municipalities, and drop-off points and municipalities. Due to the nature of the service, if a pick-up takes place in one of the three smaller municipalities, the drop-off must take place in Ragusa, and vice versa.
The aim of the study is to analyse the relationship between the activity system and drop-off bookings. The focus is on bookings with a destination in the city of Ragusa. A total of 88 completed trips originating from smaller surrounding municipalities and ending in Ragusa were analysed.

3.3. Modelling

The work focuses on the modelling of a point-to-point DRTs connecting several peripheral areas to a central area. The study area is divided into a main hub, AH, and several peripheral zones, A1, A2, …, Ak, …, AN. The service connects each peripheral zone with the main hub, and vice versa.
It is assumed that there are a set of stops inside the Main Hub with h { 1,2 , , H } be the generic service stop in the Main Hub.
The generic user can choose h as the destination for the trip with the on-demand service. Each vehicle tour, from the generic Ak to AH, is organised based on the reservations made.
The general operating scheme of the service is shown in Figure 4.
It is assumed that the AH is characterised by a system of activities.
With
c 1,2 , , C as the generic class of activities studied.
g 1,2 , , g c as the generic accommodation facility in the territory belonging to the generic c.
For each stop h , an attribute is defined x h , c
x h , c = f d h , c
where d h , c is a distance between stop h and the nearest accommodation facility g belonging to activity system c.
The modelling assumes that, similarly to all local public transport services, the user will choose a drop-off stop that minimises the walking distance from the destination of the trip. Since this is an on-demand service, it is assumed that the user will choose the stop closest to the destination.
The purpose of this contribution is to assess whether the choice of stop is influenced by specific characteristics of the territory. To assess this, we can determine the probability of choosing a stop by calibrating a conditional logit model. Referring to McFadden and to consolidated transportation demand literature [14,15,38,39], it is possible to define utility of the alternative h I , with I being the choice set of user i , as
U i h = V i h + ϵ i h
where V i , h is the systematic component of the utility and ϵ i , h is the random residual.
Probability of user i of choosing alternative h is expressed as
p h = e V i h k I i e V i k
The study focuses on evaluating alternative attributes that can represent the activity system and demonstrate users’ interest in the activity class considered. To achieve this, an accessibility-based attribute determination system is hypothesised, which highlights the relationship between the stop and the surrounding activity system.
To evaluate the attractiveness of a specific class of activities and correlate it with user choice, gravity models can be used. Gravity models are widely used in the study of transportation demand, as they allow for the expression of relationships between system attributes and user choice; this relationship is expressed in terms of attractiveness parameters (positive) and impedance parameters (negative) [14,49]. The proposed model can be classified as a logit model in a gravitational form, in which the utility of each stop can be expressed as a linear combination of the attractiveness of the activities located in its proximity.
Given x h , c , the corresponding parameter is defined as the parameter β c , as the weight of the attribute x h , c . From them, it is possible to define the systematic utility of the alternative c in Equation (4)
V h = c β c x h , c
The term x h , c has been described by Equation (1) as a generic distance function between h and h . In the following, N h , c is specifically defined as a distance attribute. Given the generic class of activity c (school, sports, etc.), the attribute N h , c is defined as a dummy variable whose value is 1 if there is at least one accommodation facility g referring to activity c in the pedestrian area of the 200 m stop.
N h , c = 1 , d h , c 200 0 , o t h e r w i s e
Given the attribute N h , c , the corresponding parameter is defined as β c . From these, it is possible to define the systematic utility of the alternative c in Equation (6).
V h = c β c N h , c
  • The evaluation was carried out considering the five groups of activities:
    • Instruction, c = i n s
    • Healthcare, c = s a
    • Modal interchange, c = m i
    • Sports, c = s p
    • Shopping, c = s h
  • The specification of the systematic utility is reported in Equation (7).
V h = β i n s N h , i n s + β s a N h , s a + β m i N h , m i + β s p N h , s p + β s h N h , s h
To avoid model instability and calibration uncertainty, the linear correlation between the attributes was tested. Following McFadden, Ben–Akiva [38,39], the model is informally and formally validated. In particular, the elements presented for informal evaluation are the study of the sign; formal validation involves the study of the statistical significance of the attributes through the z-test and the analysis of McFadden ρ 2 .
Figure 5 summarises the flowchart of the proposed modelling.
The flowchart in Figure 5, illustrating the proposed model developed for this study, presents the methodological framework designed to support the model and underpins the results discussed in the following chapter.

4. Results

In this section, the results of applying the modelling proposed in Section 3.3 to the presented case study are discussed. N h , c is analysed for each c activity in the study area. The Pearson coefficients are shown in Table 3.
As shown in Table 3, there are no strong linear correlations between the attributes. The absence of collinearity between the analysed attributes allows the indicated specification to be validated. The model was calibrated on R [50,51].
Results of calibrations are reported in Table 4. The calibration of the proposed conditional logit model is carried out, and the results are reported in Table 4. For each of the five groups of activities c considered, the corresponding value of the calibrated parameter β c and the significance value are indicated in terms of z-value.
The z-values indicate that some relationships are statistically significant—for example, for sports-related trips and N h , s p (z = 7.49, p < 0.01), suggesting that certain variables do exhibit significant associations despite the overall low correlations. The result for the McFadden ρ 2 suggests a good fitness value for the proposed calibration. Figure 6 shows the values of probability among different stops. The stop choice probabilities then focus on three stops, each of which has a choice probability greater than 0.2.

5. Discussion

Of the five activities studied, four show positive signs and high significance. Sports centres have, overall, the highest estimated parameter value: β s p = 2.55 , with a p-value < 0.01. This aspect is connected to the consistent presence of sports facilities and confirms some of the design assumptions made by the operator when defining the service: most users are young people living in smaller towns who are potentially interested in this service to travel to the main hub, where the sports facilities are located.
The service’s operating hours encourage these users to make this choice.
With a calibrated parameter of 2.11, educational centres are also among the most attractive. The result is also statistically significant, with a p-value lower than 0.01. Again, the reasons for this can be found in the type of activities they host: often educational, recreational, or leisure activities in the afternoon, consistent with the service’s operating hours.
These two activities significantly increase the user’s utility in choosing a specific group of stops.
The distance from modal interchange hubs (only two in the study area considered) has a positive value ( β m i = 2.24 ) and slightly lower statistical significance, but with p-value also lower than 0.01. While this indicates a lower impact than sports hubs ( β s p = 2.55 ), it should be noted that these two points exert a considerable attraction despite their small number. Furthermore, the two modal interchange hubs are different from each other: one is the railway station, from which trains depart to other cities on the network (other small-to-medium-sized towns and the nearby city of Syracuse), the other is the bus station, from which connections depart for the airports of, among others, Catania and Comiso.
The identified shopping centres exert a reduced but still significant attraction, with β s h = 1.56 and p-value < 0.01; they remain positive but with reduced statistical significance, thus indicating a lower impact that should be verified with further studies. In this context, positioning stops near individual commercial centres is still valid, with reference to the shopping centre in the southern part of the study area.
Finally, the most relevant case appears to be related to healthcare activities. The parameter associated with them is negative ( β s a = 0.51 ), indicating a possible counterintuitive effect compared to the established literature on the subject.
The results obtained allow us to make an initial assessment of the extent to which the various activities may interest DRT users, thus suggesting that service managers consider removing stops corresponding to unattractive locations, or modifying the current offerings, introducing new stops in uncovered areas, which, at the same time, are characterised by potential attractive activities. The four categories of activities considered are all interesting: school and sports activities highlight how the public is most interested in afternoon recreational activities. This finding is clearly useful for integrating the service with existing public transport. The results regarding multimodal hubs are also worth further commenting on these hubs demonstrate high attractiveness, despite there being only two within the study area—a train station and a bus station. This demonstrates that there is scope for growth and strengthening of DRT for rural users who intend to use it to access a medium-to-long-distance transport system. The shopping results suggest that these types of businesses, particularly shopping malls, are also potentially beneficial. Finally, the most interesting result concerns healthcare facilities.
The negative value indicates that, on average, stops associated with healthcare centres are chosen less often or even avoided. The lack of statistical significance (p-value ≈ 0.35) shows an uncertain effect of this attribute on the probability. This result certainly deserves further comment. The system includes several stops specifically dedicated to healthcare facilities and therefore has a non-zero value for the N h , s a attribute. At the same time, some of these facilities are in isolated locations, where there are no facilities belonging to other categories. Most healthcare facilities were chosen only a few times, if at all, as alternatives by system users. This last result may be indicative of two elements of the service and the area of study:
  • The first is directly related to the service’s operating hours, which are in the afternoon. It is possible that most of these healthcare facilities operate in the morning for non-emergency cases.
  • The second is related to some users’ details; this element could indicate greater reluctance on the part of users to use the service for personal reasons such as health. This element deserves the attention of the operator and future research, focused on user characteristics and tendencies.
The significance of the attributes and the results obtained are consistent with the operator’s design assumptions and are confirmed in the literature analysed [52,53,54].
The assessment of multimodal stops highlights the usefulness of DRT in completing longer journeys. The main hub’s modal interchange connects Ragusa with other large urban areas, such as Catania, Palermo, and Syracuse, as well as the airports of eastern Sicily, particularly Comiso Airport, which is less than an hour away by road. Therefore, DRT could also be useful for integrating long-distance modal interchange chains.

6. Conclusions and Future Development

This paper investigates the relationship between demand-responsive transit (DRT) use and activity systems, with a focus on user choices within these systems. The need for this article arises from the characterisation of generic DRT services, which offer connections to an urban area rather than to a specific destination, such as a modal interchange point. DRT stop positioning is difficult because demand for on-demand services is often low, in line with the niche markets these services target. The Conditional Logit Model proposed in this paper is a preliminary methodological step toward understanding which activities are most attractive to users in an operational service. Therefore, the novelty of the research lies in its integration of a well-established methodology, conditional logit, with an innovative transportation method, DRT, to study the attractiveness of individual stops.
The proposed model is a conditional logit model, which is well-suited to analysing discrete choices based on the attributes of alternatives. The proposed analysis focuses on the relationship between user choices and the accessibility of activities from service stops. For the analysed case study, the model considered five types of activities and showed that most of them are significantly attractive, except for healthcare facilities. The results are statistically significant, with four of the five calibrated attributes have p-values less than 0.01. It also demonstrates a good fit, with a McFadden ρ 2 of 0.28, confirming some of the service operator’s design assumptions and assumptions in the literature.
Notably, sports activities and modal interchange points emerged as the most attractive elements in the study area. The calibrated model correctly reads user characteristics and shows good stop positioning. Additionally, the model confirms some of the service operator’s design assumptions.
The research has some limitations: the conditional logit model is certainly useful for modelling systems, such as the one proposed, in which the main aim is to evaluate the characteristics of the alternative; the model does not consider user attributes or the choice situation; subsequent studies also intend to extend the assessments carried out, using multinomial and hierarchical logit models, which can integrate the sociodemographic attributes of users. This represents a limitation of the research that will be addressed in subsequent studies, with the aim of verifying how sociodemographic and behavioural attributes can influence the choice of stop. Furthermore, the model focuses entirely on the choice of destination stops; in the future, it would be useful to also consider an integrated model that considers the origin stops and the choice of time slot. Furthermore, the size of the dataset may limit the applicability of the methodology. Among future developments, the study will include more extensive data across different time periods.
The research is clearly useful for multiple stakeholders. Managers of on-demand services or fixed public transport can benefit from a clear methodology and some clear considerations on the activities to be served; researchers can explore the theoretical implications of applying logit models to on-demand mobility, and policymakers can use the findings to inform travel planning and the development of Sustainable Urban Mobility Plans, highlighting practical opportunities to enhance urban transport systems.

Author Contributions

A.R.: conceptualization, methodology, formal analysis, data collection, model design, interpretation, writing, original draft. T.C.: methodology supervision, data collection, writing, review and editing, supervision, validation of results. C.S.: formal analysis, data collection, model design, interpretation, writing, original draft. G.T. (Guilhermina Torrao): writing, review and editing, supervision. G.T. (Giovanni Tesoriere): supervision, funding acquisition. All authors have read and agreed to the published version of the manuscript.

Funding

The authors declare that no funding was received from any public, private, or not-for-profit organisation for the research, authorship, and publication of this article.

Institutional Review Board Statement

Not applicable.

Informed Consent Statement

Not applicable.

Data Availability Statement

The data that support the findings of this study are available from the corresponding author due to privacy and legal reason.

Acknowledgments

The authors would like to acknowledge the support provided by the MUR (Italian Ministry of University and Research) through SMART3R-FLITS: SMART Transport for Travellers and Freight Logistics Integration Toward Sustainability (Project protocol:2022J38SR9_03, CUP Code: J53D23009330008), linked to the PRIN 2022 (Research Projects of National Relevance) programme. The authors thank SVIMED’s PulMi’ project, https://www.svimed.eu/website/portfolio/pulmi/ (accessed on 1 September 2025), for providing some of the data in this research paper.

Conflicts of Interest

The authors declare that they have no conflicts of interest.

References

  1. Statistics, U.N. Global indicator framework for the sustainable development goals and targets of the 2030 agenda for sustainable development. In Developmental Science and Sustainable Development Goals for Children and Youth; SDG: New York, NY, USA, 2019; p. 439. [Google Scholar]
  2. Zhang, C.; Wang, M.; Dong, J.; Lu, W.; Liu, Y.; Ni, A.; Yu, X. Factors and mechanism affecting the attractiveness of public transport: Macroscopic and microscopic perspectives. J. Adv. Transp. 2022, 2022, 5048678. [Google Scholar] [CrossRef]
  3. Göransson, J.; Andersson, H. Factors that make public transport systems attractive: A review of travel preferences and travel mode choices. Eur. Transp. Res. Rev. 2023, 15, 32. [Google Scholar] [CrossRef]
  4. Cruz, I.S.; Katz-Gerro, T. Urban public transport companies and strategies to promote sustainable consumption practices. J. Clean. Prod. 2016, 123, 28–33. [Google Scholar] [CrossRef]
  5. Silva, C.; Cadima, C.; Castro, N.; Tennøy, A. Public transport strategy. J. Transp. Land Use 2021, 14, 1275–1294. [Google Scholar] [CrossRef]
  6. Nourbakhsh, S.M.; Ouyang, Y. A structured flexible transit system for low demand areas. Transp. Res. Part B Methodol. 2012, 46, 204–216. [Google Scholar] [CrossRef]
  7. Yan, X.; Zhao, X.; Han, Y.; Van Hentenryck, P.; Dillahunt, T. Mobility-on-demand versus fixed-route transit systems: An evaluation of traveler preferences in low-income communities. Transp. Res. Part A Policy Pract. 2021, 148, 481–495. [Google Scholar] [CrossRef]
  8. Brake, J.; Nelson, J.D.; Wright, S. Demand responsive transport: Towards the emergence of a new market segment. J. Transp. Geogr. 2004, 12, 323–337. [Google Scholar] [CrossRef]
  9. Davison, L.; Enoch, M.; Ryley, T.; Quddus, M.; Wang, C. Identifying potential market niches for Demand Responsive Transport. Res. Transp. Bus. Manag. 2012, 3, 50–61. [Google Scholar] [CrossRef]
  10. Brost, M.; Klötzke, M.; Kopp, G.; Deißer, O.; Fraedrich, E.M.; Karnahl, K.; Sippel, T.; Müller, A.; Beyer, S. Development, implementation (pilot) and evaluation of a demand-responsive transport system. World Electr. Veh. J. 2018, 9, 4. [Google Scholar] [CrossRef]
  11. Campisi, T.; Spadaro, C.; Russo, A.; Tesoriere, G.; Torrao, G. The Development of Integrated Public Transport and on Demand Services (PTs-DRTs) for Greater Flexibility and Complementarity of Transport Mode Choices. In International Conference on Computational Science and Its Applications; Springer Nature: Cham, Switzerland, 2025; pp. 48–64. [Google Scholar]
  12. Musolino, G. Sustainable Mobility as a Service: Demand analysis and case studies. Information 2022, 13, 376. [Google Scholar] [CrossRef]
  13. Campisi, T.; Canale, A.; Ticali, D.; Tesoriere, G. Innovative solutions for sustainable mobility in areas of weak demand. Some factors influencing the implementation of the DRT system in Enna (Italy). In AIP Conference Proceedings; AIP Publishing LLC: Melville, NY, USA, 2021; Volume 2343, p. 090005. [Google Scholar]
  14. Cascetta, E. Transportation Systems Engineering: Theory and Methods; Springer Science & Business Media: Berlin/Heidelberg, Germany, 2013; Volume 49. [Google Scholar]
  15. Pratelli, A. Ingegneria Dei Sistemi Di Trasporto; Pitagora: Roma, Italy, 1998. [Google Scholar]
  16. Ryley, T.J.; Stanley, P.A.; Enoch, M.P.; Zanni, A.M.; Quddus, M.A. Investigating the contribution of Demand Responsive Transport to a sustainable local public transport system. Res. Transp. Econ. 2014, 48, 364–372. [Google Scholar] [CrossRef]
  17. Charisis, A.; Iliopoulou, C.; Kepaptsoglou, K. DRT route design for the first/last mile problem: Model and application to Athens, Greece. Public Transp. 2018, 10, 499–527. [Google Scholar] [CrossRef]
  18. Jevinger, Å.; Svensson, H. On Demand-Responsive Transport Configurations, Traveller Interaction and Preferences: A Survey from the Perspective of Older People; Public Transport: Singapore, 2025; pp. 1–40. [Google Scholar]
  19. Cartenì, A.; Henke, I.; Picone, M. The value of waiting spaces: Tourists’ willingness to pay for high-quality bus terminals. Transp. Res. Interdiscip. Perspect. 2024, 26, 101129. [Google Scholar] [CrossRef]
  20. Tamleh, D.; Schlenther, T.; Nagel, K. Investigating the impact of stop network designs on drt operation. Procedia Comput. Sci. 2024, 238, 742–748. [Google Scholar] [CrossRef]
  21. Mahfouz, H.; Morgan, M.; Heinen, E.; Lovelace, R. Delineating potential DRT operating areas: An origin–destination clustering approach. J. Urban Mobil. 2025, 8, 100135. [Google Scholar] [CrossRef]
  22. Kato, H.; Yoh, K. Acceptance and use of demand-responsive transport by older people in old new town: Evidence from Senboku new Town. Transp. Res. Interdiscip. Perspect. 2025, 29, 101295. [Google Scholar]
  23. Hu, S.; Li, C.; Wu, W.; Yang, Y. Exploring the determinants of demand-responsive transit acceptance in China. Transp. Policy 2025, 165, 150–163. [Google Scholar] [CrossRef]
  24. Avermann, N.; Schlüter, J. Determinants of customer satisfaction with a true door-to-door DRT service in rural Germany. Res. Transp. Bus. Manag. 2019, 32, 100420. [Google Scholar] [CrossRef]
  25. Russo, A.; Campisi, T.; Tesoriere, G.; Spadaro, C.; Torrao, G. DRT and Social Exclusion: A Literature Review on Gender, Age and Income Impact. In International Conference on Computational Science and Its Applications; Springer: Cham, Switzerland, 2026; pp. 157–174. [Google Scholar]
  26. Guo, J.; Mishra, S.; Brakewood, C. Analyzing gender and age differences in travel patterns and accessibility for demand response transit in small urban areas: A case study of Tennessee. J. Transp. Land Use 2024, 17, 675–706. [Google Scholar] [CrossRef]
  27. Gkavra, R.; Susilo, Y.O.; Klementschitz, R. Determinants of usage and satisfaction with demand responsive transport systems in rural areas. Transp. Res. Rec. 2024, 2678, 667–680. [Google Scholar]
  28. Kirsimaa, K.; Suik, K. Demand-Responsive Transport (Drt) in the Baltic Sea Region and Beyond; ClimaResponse: Stockholm, Sweden, 2020. [Google Scholar]
  29. Available online: http://acco.gencat.cat/ (accessed on 1 September 2025).
  30. Schasché, S.E.; Wankmüller, C.; Hampl, N. Understanding the behavioral intention of the rural population to use demand-responsive transport services. Transp. Res. Interdiscip. Perspect. 2023, 22, 100984. [Google Scholar] [CrossRef]
  31. Pavanini, T.; Liimatainen, H.; Sievers, N.; Heemsoth, J.P. The role of DRT in European urban public transport systems—A comparison between Tampere, Braunschweig and Genoa. Future Transp. 2023, 3, 584–600. [Google Scholar]
  32. Goto, Y.; Sanko, N. Quantifying the economic value of reservation deadlines in demand-responsive transport. Transp. Plan. Technol. 2024, 48, 1442–1453. [Google Scholar] [CrossRef]
  33. Caramuta, C.; Grosso, A.; Longo, G.; Ricchetti, C.; Rotaris, L. Design, implementation and monitoring of a Demand Responsive Transport service for student leisure transfers: The case study of University of Trieste. Transp. Eng. 2025, 20, 100345. [Google Scholar] [CrossRef]
  34. Gilibert, M.; Ribas, I.; Rosen, C.; Siebeneich, A. On-demand shared ride-hailing for commuting purposes: Comparison of Barcelona and Hanover case studies. Transp. Res. Procedia 2020, 47, 323–330. [Google Scholar]
  35. Parmaksizoglou, I.A.; Bombelli, A.; Sharpanskykh, A. Design of a Demand Responsive Transport service using Distributed Constraint Optimization for airport access. In Proceedings of the 2023 8th International Conference on Models and Technologies for Intelligent Transportation Systems (MT-ITS), Nice, France, 14–16 June 2023; IEEE: New York, NY, USA, 2023; pp. 1–6. [Google Scholar]
  36. Fan, Y.; Wu, Z.; Liu, S. Examining the Factors Influencing the Choice of Rail Transit Connection Mode Considering Demand-Responsive Transport. In ICRT 2024; ASCE: Reston, VA, USA, 2024; pp. 554–562. [Google Scholar]
  37. Attard, M.; Camilleri, M.P.; Muscat, A. The technology behind a shared demand responsive transport system for a university campus. Res. Transp. Bus. Manag. 2020, 36, 100463. [Google Scholar] [CrossRef]
  38. McFadden, D. Conditional Logit Analysis of Qualitative Choice Behavior; Academic Press: New York, NY, USA, 1972. [Google Scholar]
  39. Ben-Akiva, M.E.; Lerman, S.R. Discrete Choice Analysis: Theory and Application to Travel Demand; MIT Press: Cambridge, MA, USA, 1985; Volume 9. [Google Scholar]
  40. Wong, R.C.P.; Yang, L.; Szeto, W.Y. Comparing passengers’ satisfaction with fixed-route and demand-responsive 634 transport services: Empirical evidence from public light bus services in Hong Kong. Travel Behav. Soc. 2023, 32, 100583. [Google Scholar]
  41. Terry, J.; Bachmann, C. Estimating suburban preferences for integrated public transit and ridesourcing services through a revealed-preference/stated-preference survey. J. Public Transp. 2023, 25, 100047. [Google Scholar] [CrossRef]
  42. Park, J.; Choi, S.; Kim, G.; Jo, H. Provision of metropolitan demand responsive transit and attitude’s role in modechoice. Transp. Res. Part D Transp. Environ. 2025, 140, 104640. [Google Scholar] [CrossRef]
  43. Lao, X.; Shen, Y.; Cao, J.; Ji, Y.; Du, Y. Does implicit attitude affect travel mode choice behaviors? A study of customized bus attraction to urban railway riders. Transp. Lett. 2025, 17, 1399–1413. [Google Scholar] [CrossRef]
  44. Tordai, D.; Lieszkovszky, J.P.; Munkácsy, A. Preferences of Rural Travelers Towards Demand Responsive Transport. In Transport Research Arena Conference; Springer Nature: Cham, Switzerland, 2024; pp. 66–71. [Google Scholar]
  45. He, J.; Ma, T.Y. Examining the factors influencing microtransit users’ next ride decisions using Bayesian networks. Eur. Transp. Res. Rev. 2022, 14, 47. [Google Scholar] [CrossRef]
  46. Wang, C.; Quddus, M.; Enoch, M.; Ryley, T.; Davison, L. Exploring the propensity to travel by demand responsive transport in the rural area of Lincolnshire in England. Case Stud. Transp. Policy 2015, 3, 129–136. [Google Scholar] [CrossRef]
  47. Istat. Basi Territoriali e Variabili Censuarie (Istat.It); Istat: Rome, Italy, 2025. [Google Scholar]
  48. OpenStreetMap. About OpenStreetMap. 2025. Available online: https://wiki.openstreetmap.org/wiki/About_OpenStreetMap (accessed on 1 September 2025).
  49. Erlander, S.; Stewart, N.F. The Gravity Model in Transportation Analysis: Theory and Extensions; Vsp: Rancho Cordova, CA, USA, 1990; Volume 3. [Google Scholar]
  50. Croissant, Y. Estimation of random utility models in R: The mlogit package. J. Stat. Softw. 2020, 95, 1–41. [Google Scholar] [CrossRef]
  51. R Core Team. R: A Language and Environment for Statistical Computing; R Foundation for Statistical Computing: Vienna, Austria, 2025; p. 650. Available online: https://www.R-project.org/ (accessed on 1 September 2025).
  52. Savant, S.; Sharma, N.; Baghel, A.S. Demand Responsive Public Transport System in Airport Travel: Case Study of Delhi. In Conference on Sustainable Urban Mobility; Springer International Publishing: Cham, Switzerland, 2020; pp. 42–55. [Google Scholar]
  53. Mageean, J.; Nelson, J.D. The evaluation of demand responsive transport services in Europe. J. Transp. Geogr. 2003, 11, 255–270. [Google Scholar] [CrossRef]
  54. Davison, L.; Enoch, M.; Ryley, T.; Quddus, M.; Wang, C. A survey of demand responsive transport in Great Britain. Transp. Policy 2014, 31, 47–54. [Google Scholar] [CrossRef]
Figure 1. Steps of the analysis.
Futuretransp 05 00156 g001
Figure 2. Study area: the municipality of Ragusa (right figure) in Italy (left figure).
Futuretransp 05 00156 g002
Figure 3. Activities in study area (Source [47,48]).
Futuretransp 05 00156 g003
Figure 4. Service structure.
Futuretransp 05 00156 g004
Figure 5. Modelling flowchart.
Futuretransp 05 00156 g005
Figure 6. Values of probability among different stops.
Futuretransp 05 00156 g006
Table 1. Literature contributions (market niches).
MarketReferences
Rural[30,31]
Sanitary[16,32]
Shopping and leisure[33,34]
Modal interchange[35,36]
Work/Instruction[34,37]
Table 2. Service data.
Datum NameExplanation
Booking IDThis data represents the booking ID. Some bookings were made but then cancelled. The corresponding IDs have been removed from the study.
Pick-up TimeThis represents the exact time at which the pick-up took place at the location indicated by the user.
Pick-up PointThis represents the point where the pick-up took place, as indicated by the user, from among the set of possible points offered by the company.
Drop-off TimeThis represents the exact time when the drop-off took place at the point indicated by the user.
Drop-off PointThis represents the point where the drop-off took place, from among the set of possible points offered by the company.
Table 3. Pearson correlation coefficient.
Attribute N h , i n s N h , s a N h , m i N h , s p N h , s h
N h , i n s 1
N h , s a −0.321
N h , m i −0.33−0.251
N h , s p −0.16−0.240.091
N h , s h 0.050.15−0.140.091
Table 4. Calibration results.
NameAttributeParameterEstimatez-ValueMcFadden ρ2
Instruction N h , i n s β i n s 2.114.72 *0.28
Healthcare N h , s a β s a −0.51−0.879
Modal N h , m i β m i 2.244.71 *
Sport N h , s p β s p 2.557.49 *
Shopping N h , s h β s h 1.563.64 *
* -> Significance at 0.01 level.
Disclaimer/Publisher’s Note: The statements, opinions and data contained in all publications are solely those of the individual author(s) and contributor(s) and not of MDPI and/or the editor(s). MDPI and/or the editor(s) disclaim responsibility for any injury to people or property resulting from any ideas, methods, instructions or products referred to in the content.