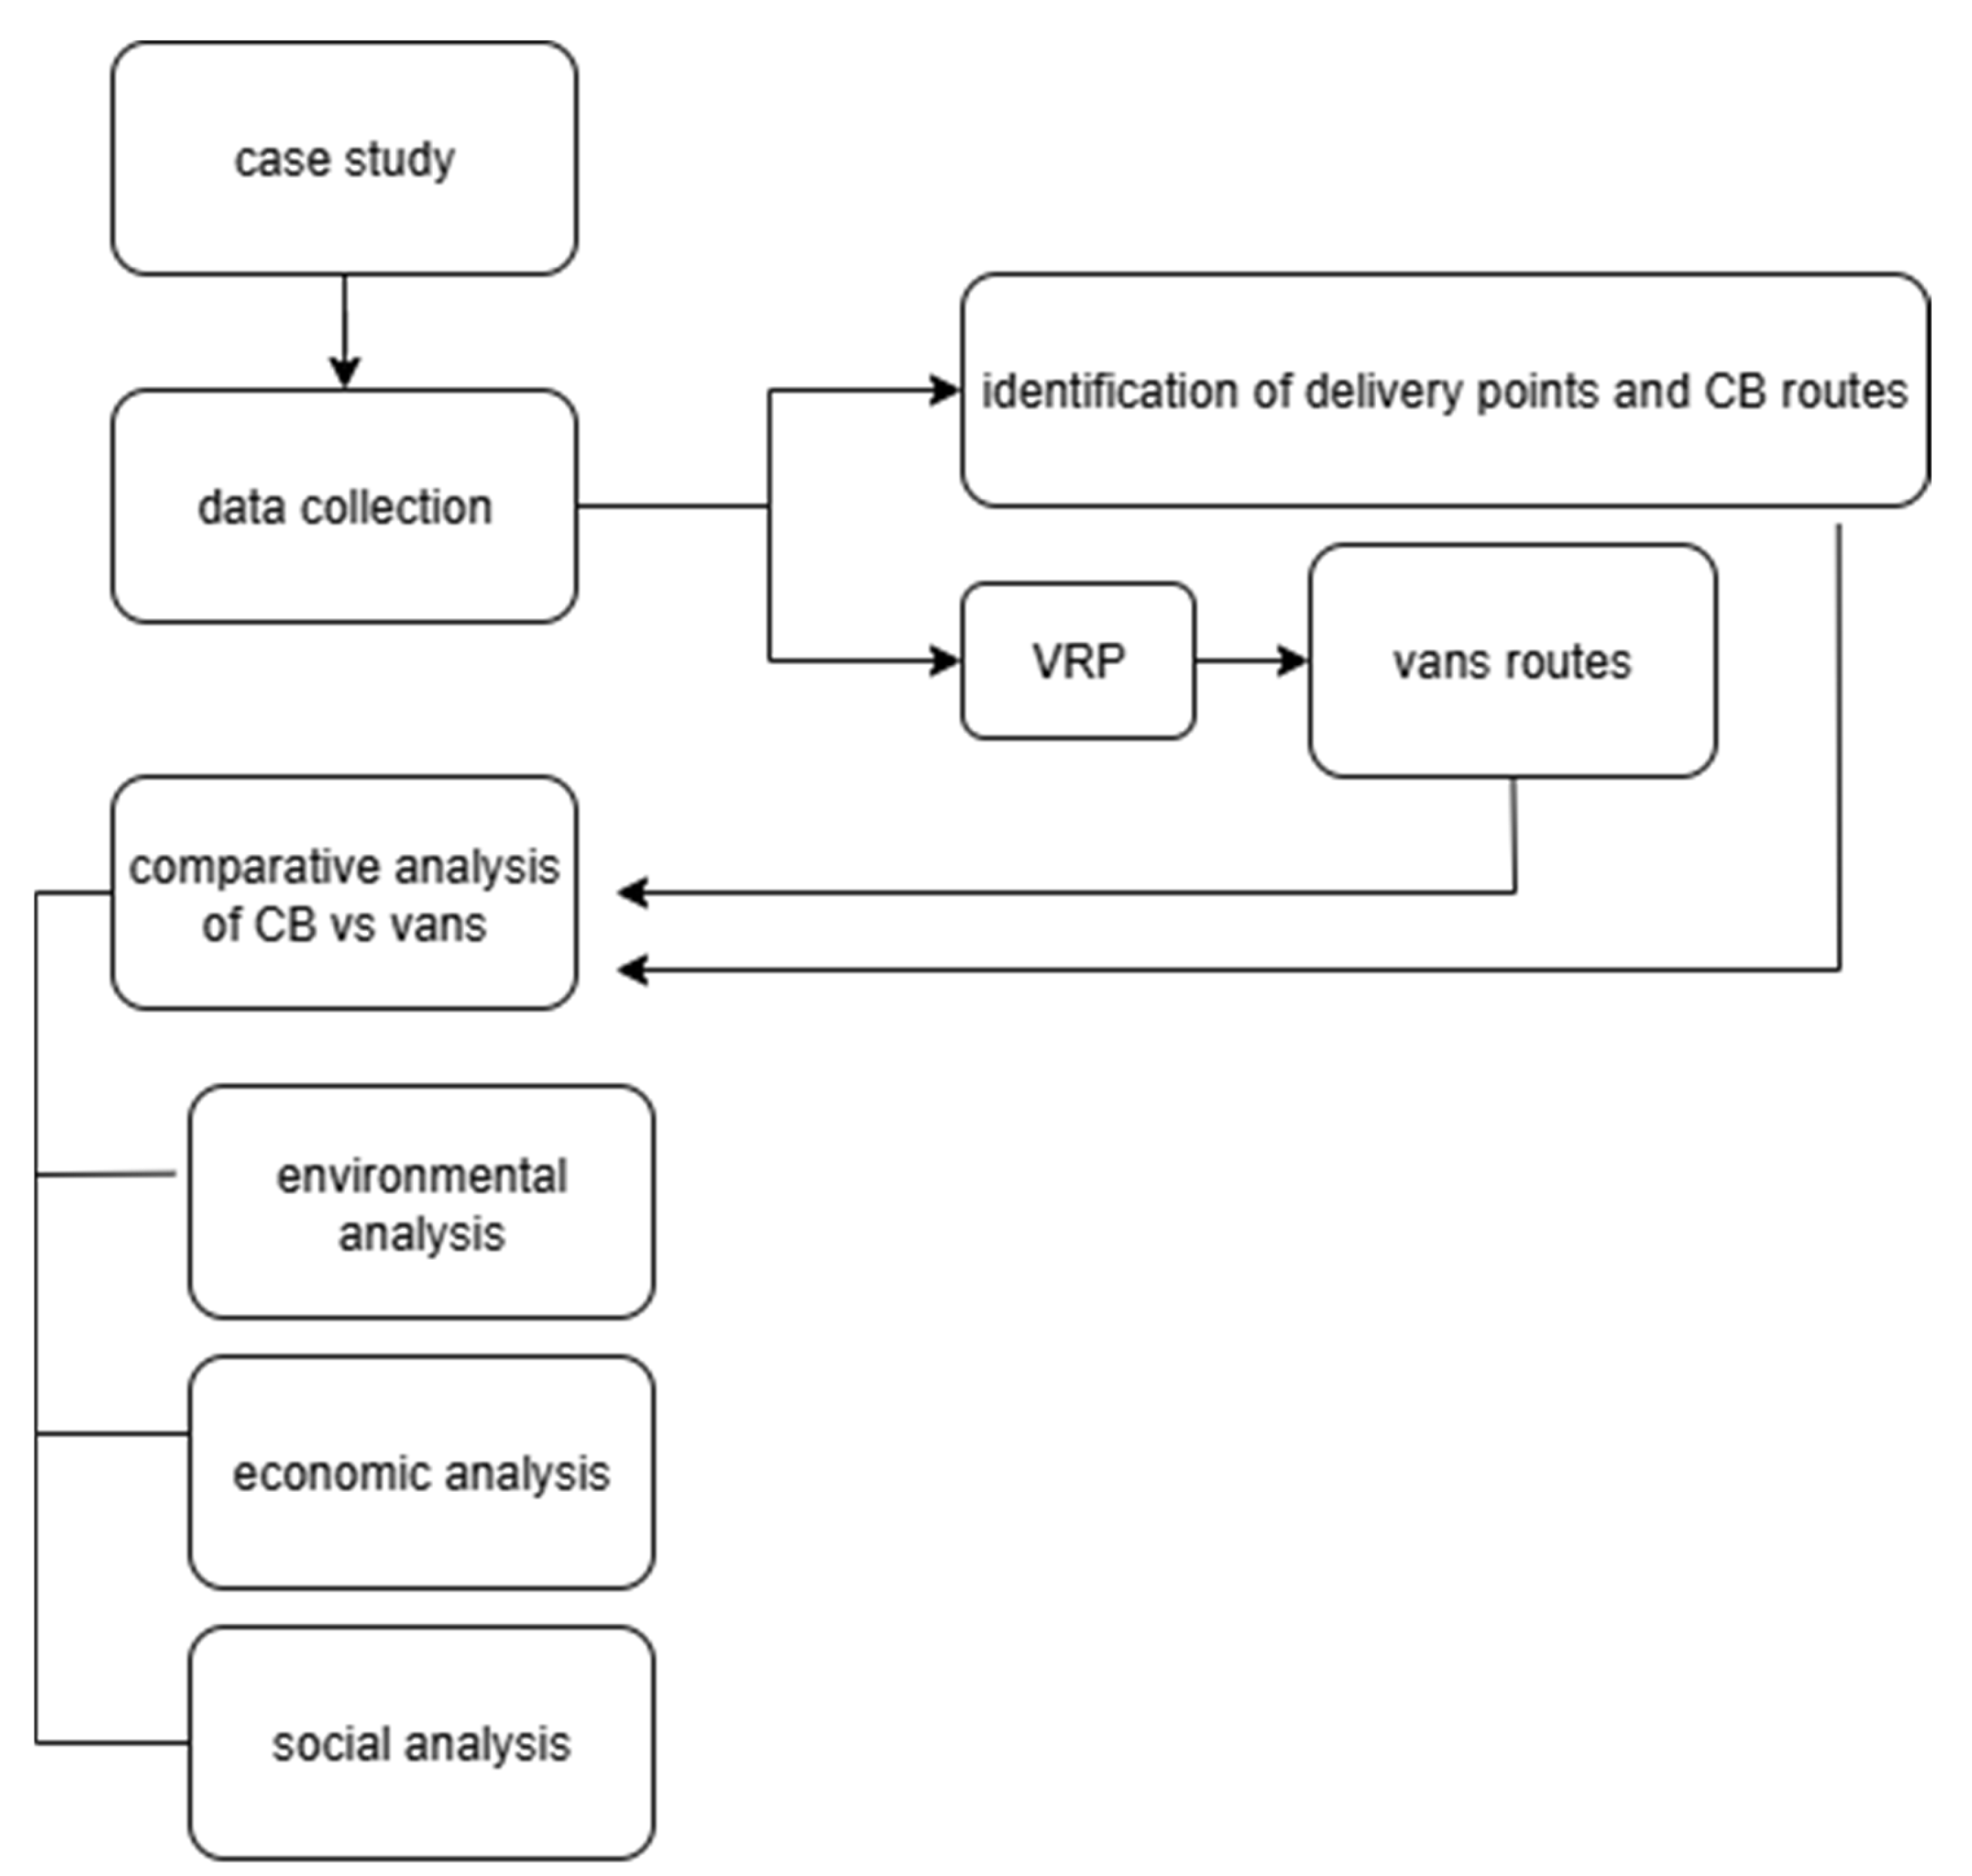
This section illustrates the methodology this paper uses, focusing on the case study analyzed.
The process begins with data collection, where real-life operational data from Corro Corrieri Roma (CCR) were gathered through direct collaboration with the company. This included detailed courier shift records over a representative workweek in June 2024, containing objective data on deliveries, times, and package characteristics. Next, the identification of delivery points and CB routes was performed by organizing and reconstructing courier tours, using mapping tools to fill in missing route information and determine start times and distances. The same delivery addresses were then input into a Vehicle Routing Problem (VRP) solver to simulate van routes that could replicate the CB deliveries, considering vehicle load capacities and fixed stop durations. This allowed for a comparative analysis of cargo bikes and vans, focusing on environmental, economic, and social impacts.
3.1. Ideal Research Approach and Operational Constraints
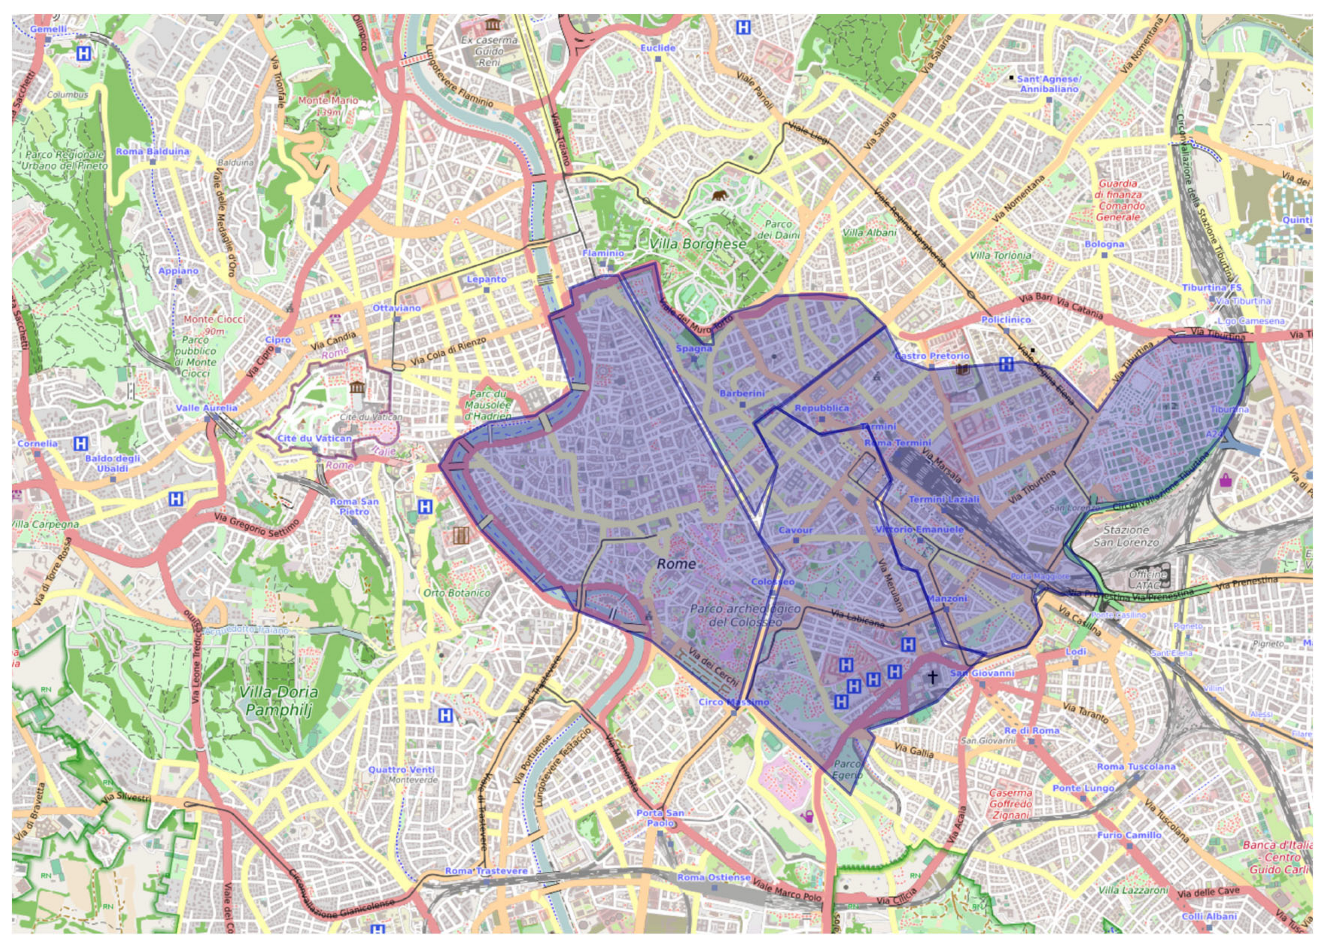
This research focuses on a city center characterized by high population density, significant commercial activity, and well-developed cycling infrastructure. The selected area should have documented freight transport data and a mix of traditional diesel van and CB operations. Factors such as road congestion levels, air quality, and urban logistics policies should also be considered. Additionally, historical data on delivery patterns and urban traffic regulations could be incorporated to provide a comprehensive understanding of the freight ecosystem. To ensure a robust comparison, data should be collected from multiple sources, including vehicle tracking and routing data, delivery efficiency metrics, and environmental and economic data.
In principle one should acquire vehicle tracking and routing data; then, one should define delivery efficiency metrics such as the number of stops per trip. Next, one should obtain environmental and economic data such as fuel consumption and CO2 emissions from diesel vans. One could also administer surveys and interviews that could be conducted with logistics companies, delivery drivers, and urban planners to gather insights into operational challenges and preferences with the intent of detecting customer satisfaction data. Finally, focus group discussions could be held with business owners to understand the perceived benefits and drawbacks of each delivery method.
While this would be the ideal approach, one has to consider the time and resource constraints that have induced this research group to focus more on comparing the load capacities of CBs and vans, the distances traveled, and the time required to deliver the same number of packages. This study also analyzed the emissions saved by using CBs, based on a simulation of the emissions that would have been produced by vans under similar delivery conditions. Additionally, the operational costs and the overall delivery service costs of both methods were compared to assess their economic feasibility.
In fact, in our case the data available and used include deliveries performed with CBs over one week in the selected area, the maximum load capacity of both CBs and vans, a simulated estimate of the distance and time required for vans to complete the same routes as CBs, and the operational and service costs of both CBs and vans. While we acknowledge the limitations of our approach, at the same time, we would like to underline the high quality of the data used and their realism.
3.3. Data Collection
This paper adopts a comparative analysis of real-life CB tours with “most likely” van alternatives needed to perform the same deliveries. The experimental analysis in Rome uses real-life data on CB deliveries. CCR provided a sample of operational data. A dedicated meeting was organized with the CEO and with the head of the supply chain of CCR. The authors of this paper actively participated in the meeting to determine a commonly accepted data structure to extract from CCR’s databases to perform the actual comparison, to determine which data to include, and to establish the key performance indicators to use in this research.
The data based on CCR’s internal operational records were shared with the authors directly from the head of the supply chain of CCR. No self-determined or subjective data from CCR was used in the analysis. The dataset provided by CCR included only objective operational data, such as the number of deliveries performed, the corresponding time slots, and the working hours, all recorded by the couriers during their actual work shifts. While the data contained an estimation of the CO2 saved by the CCR deliveries, the authors calculated them independently using established emission factors and standardized assumptions regarding fuel consumption and vehicle performance.
The analysis considered data for a full workweek, from Monday, 17 June 2024 to Friday, 21 June 2024. The period was selected upon the company’s suggestion as being representative of a business-as-usual delivery scenario, without unusual peaks or variations in daily operations.
The investigation refers to the deliveries of a single delivery service, chosen because it was the only service systematically including data on package dimensions (see
Table 1). Additionally, courier shifts with fewer than four deliveries in a single day were excluded to avoid underestimating the total number of deliveries compared to the number of CBs used.
CCR provided two Excel files for each workday to analyze. The first file contained all deliveries made by all couriers on that day. The second file included only deliveries from the selected services. The two files were merged to match the delivery addresses and the excess deliveries; those not belonging to the chosen service were filtered out. The deliveries were then grouped by courier and arranged in chronological order. Below is an example of the final dataset structure, with courier names anonymized for privacy protection.
To estimate the departure time from CCR’s headquarters (Via Panfilo Castaldi 7, Rome) to the first delivery address, Google Maps’ Directions feature was used, selecting “bicycle” as the mode of transport. Since the company’s dataset did not include the headquarters, but only the first delivery, this step was necessary to reconstruct the full delivery tour. By combining this information with the timestamps provided in Corro’s delivery files, it was also possible to approximate the overall duration of each courier’s shift, indicating the time of the first and last deliveries.
With the obtained data, the total shift duration for each courier was estimated. This method provided a solid basis for evaluating logistical efficiency in terms of time and mileage per load.
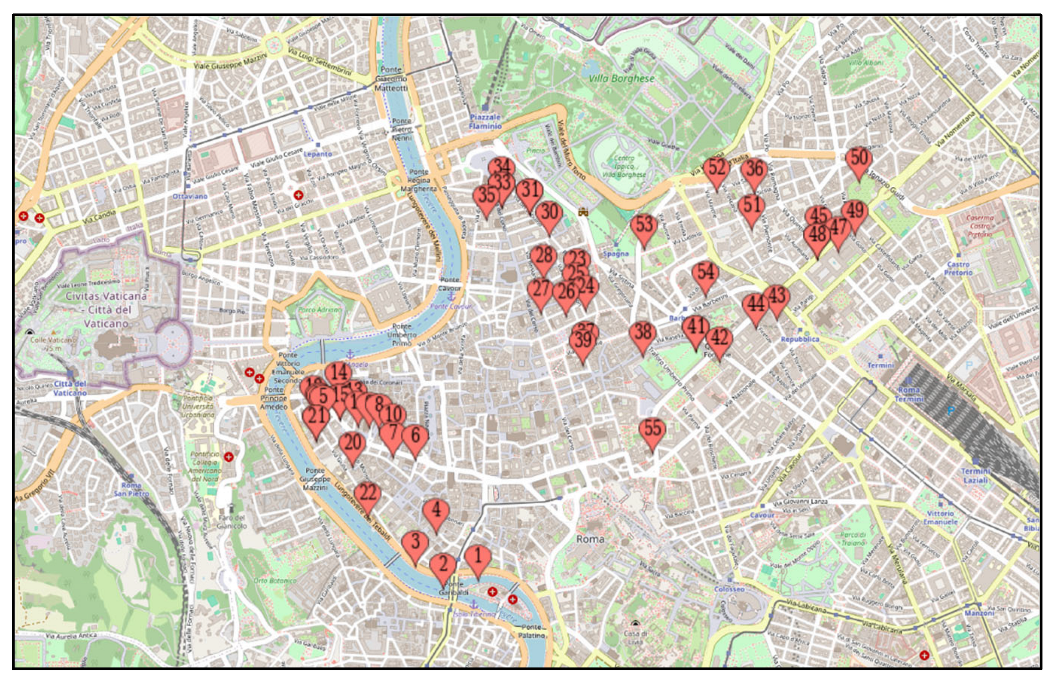
Figure 3 shows a map of the city of Rome, reporting the deliveries performed during a single courier’s shift of approximately seven hours, from those analyzed, on 19 June.
To compare CBs with commercial vehicles, the delivery addresses serviced by CBs were re-entered into Google Maps to identify the coordinates of the delivery points to input them into the VRP Spreadsheet Solver [
36,
37,
38], where van routes were simulated considering the maximum load capacity of each van. This enabled the estimation of the total time required, the distance traveled, and the number of trips or vehicles needed to complete the same deliveries performed by the CBs, following the same stop sequence. A fixed stop time of 5 min per delivery was included in the simulation.
Next, the hypothetical emissions of the three most frequently used motor vehicle models were calculated for these deliveries. The vehicle models considered were the ones analyzed in the study by Temporelli et al. [
39]: the Nissan e-NV200 (Nissan, Barcellona, Spain), Ford Transit Connect (Ford, Wayne-Louiseville, KY, USA), and Renault Megane plug-in hybrid (Renault, Villamuriel De Cerrato, Spain).
To compare the loading capacities of CBs and commercial vehicles, the loading capacity of each vehicle model was retrieved from the official website of the producers (Nissan, Ford, and Renault) to calculate how many CBs would be needed to match the capacity of the commercial vehicles.
The initial investments for CBs and the three commercial vehicle models were retrieved from official websites of the manufacturers (Nissan, Ford, Renault, and Harry vs. Larry) [
40,
41,
42,
43].
Concerning the operative costs, data on fuel consumption for motorized vehicles were obtained from the official websites of their respective manufacturers (Nissan, Ford, and Renault). Meanwhile, the average fuel prices in Rome for the selected week in June 2024 were retrieved from the Federtrasporto [
44] website.
Next, we added more detailed data on fixed costs—retrieved from the Ceccato et al. [
45] study, such as insurance and necessary infrastructure (e.g., the distribution center and micro-hub)—and variable costs, such as fuel, tires, maintenance, and labor for delivery and transshipment.
Regarding delivery service costs for customers, CCR’s CB delivery rates were compared with the prices of other traditional motorized delivery service providers, such as GLS, Poste Italiane, and Paccofacile, retrieved from the official website of each service [
46,
47,
48,
49]. The comparison highlights that CBs help lower delivery costs, being economically more convenient than regular commercial vehicles alone [
50].
Lastly, for the social impact analysis, we considered qualitative data from the literature.
These include the reduced physical strain experienced by CB couriers compared to traditional cyclists, the weather-related vulnerability associated with courier work, and the greater accessibility to delivery jobs for individuals without a driver’s license, which can foster inclusivity and local employment opportunities. The literature also discusses safety-related issues, highlighting a reduction in accidents involving heavy vehicles but also the emergence of new risks for cyclists and pedestrians, which require appropriate infrastructure such as dedicated lanes. Furthermore, the adoption of CBs contributes to the company’s public image, reinforcing its commitment to environmental sustainability, technological innovation, improved urban livability, and community-oriented logistics.


