Abstract
Efficient detection of road surface defects is vital for timely maintenance and traffic safety. This study introduces a novel AI-powered web framework, TriRoad AI, that integrates multiple versions of the You Only Look Once (YOLO) object detection algorithms—specifically YOLOv8 and YOLOv11—for automated detection of potholes and cracks. A user-friendly browser interface was developed to enable real-time image analysis, confidence-based prediction filtering, and severity-based geolocation mapping using OpenStreetMap. Experimental evaluation was conducted using two datasets: one from online sources and another from field-collected images in Ankara, Turkey. YOLOv8 achieved a mean accuracy of 88.43% on internet-sourced images, while YOLOv11-B demonstrated higher robustness in challenging field environments with a detection accuracy of 46.15%, and YOLOv8 followed closely with 44.92% on mixed field images. The Gemini AI model, although highly effective in controlled environments (97.64% detection accuracy), exhibited a significant performance drop of up to 80% in complex field scenarios, with its accuracy falling to 18.50%. The proposed platform’s uniqueness lies in its fully integrated, browser-based design, requiring no device-specific installation, and its incorporation of severity classification with interactive geospatial visualization. These contributions address current gaps in generalization, accessibility, and practical deployment, offering a scalable solution for smart infrastructure monitoring and preventive maintenance planning in urban environments.
1. Introduction
1.1. Background
Maintaining the structural integrity of road infrastructure plays a pivotal role in ensuring transportation safety, minimizing vehicle maintenance costs, and improving the overall quality of mobility for both private and public transport users [1,2]. As there has been a trend around the entire globe toward urbanization, rising densities of populations, and accelerated vehicular flows, road networks have been subjected to added pressures and thus accelerated deterioration of pavement [3,4]. Surface defects such as potholes, longitudinal and transverse cracks, rutting, and surface deformations pose serious risks not only by reducing driving comfort but also by increasing accident probability, vehicle wear and tear, and traffic congestion [5,6]. In developing regions, these issues are often exacerbated due to limited budgets for infrastructure maintenance and inconsistent inspection routines.
Traditionally, road damage assessment has been based on manual visual surveys by field inspectors and semi-automated vehicle surveys. Although these methods are effective when applied locally, they are time-consuming, labor-intensive, and limited by their spatial coverage and frequency [7,8]. Additionally, the subjective nature of human evaluation introduces inconsistencies in damage classification and severity estimation, often leading to delayed or misprioritized maintenance activities. These inefficiencies underline the necessity for automated, accurate, and scalable damage detection systems that can operate reliably under varied environmental and lighting conditions [9,10].
Advances in computer vision and artificial intelligence (AI) have brought rather promising solutions to these issues. Convolutional neural networks (CNNs) have achieved excellent performance for object detection, classification, and semantic segmentation tasks across numerous domains such as medical imaging, security surveillance, agriculture, and transportation. Within the transportation sector, AI-driven image analysis is increasingly being applied to automate the detection of road surface anomalies [11,12].
Perhaps the most successful real-time object detection AI framework is the You Only Look Once (YOLO) algorithm. Redmon et al. originally presented YOLO [13], and YOLO brought a new perspective to object detection by processing entire images in real time, enabling simultaneous classification and localization with high speed and accuracy. Over its evolution from YOLOv1 to YOLOv11, the framework has incorporated anchor-free detection, Cross-Stage Partial Networks (CSPNet), path aggregation networks (PANet), attention mechanisms, and segmentation modules. These improvements have made modern YOLO versions particularly effective for detecting small, irregular, and low-contrast objects like pavement cracks and faded potholes where traditional methods often fail [13].
In this context, developing a practical and efficient AI-based detection framework using YOLO becomes a vital step toward enabling intelligent infrastructure monitoring, enhancing maintenance decision making, and supporting smart city initiatives worldwide.
1.2. Problem Statement
Despite significant advancements in deep learning and object detection algorithms, the practical implementation of AI-based road damage detection systems still faces considerable challenges. Many existing solutions are either confined to research environments or are embedded in device-specific mobile applications that require extensive permissions, high computational power, or user expertise, factors that hinder scalability and public adoption. Furthermore, while models such as YOLOv8 and YOLOv11 demonstrate high accuracy on benchmark datasets, their reliability drops noticeably when exposed to complex field scenarios involving variable lighting, shadow effects, diverse surface textures, and image noise. This raises concerns about their generalization capability and field robustness [14,15,16].
A major gap in current tools is the absence of integrated geospatial visualization, which is essential for translating detection outcomes into actionable maintenance strategies. Most existing frameworks also struggle with robustness in uncontrolled outdoor settings (e.g., lighting variation, occlusions, and texture noise), which limits their generalizability beyond benchmark environments.
To address these issues, this study proposes a lightweight web-based platform—TriRoad AI—that eliminates device dependency, supports multiple AI models, provides real-time detection capabilities, and integrates severity-based geospatial mapping via OpenStreetMap. This comprehensive functionality enables municipal agencies and urban planners to move from reactive to preventive infrastructure management using accessible and scalable technology.
1.3. Study Objectives
This study aims to address these gaps by developing and evaluating an AI-based web platform for automated road damage detection and geospatial mapping. The main objectives of this research are as follows:
- To implement and compare multiple YOLO models (YOLOv8 and YOLOv11) for detecting potholes and cracks in both online-sourced and field-collected road images.
- To design and deploy a browser-based interface that enables users to upload images, receive real-time predictions, and visualize damage severity on interactive maps using OpenStreetMap.
- To analyze and compare the detection performance of YOLO models with Gemini AI in both controlled environments and complex field settings.
- To categorize damage severity and integrate this classification into a geospatial system to support maintenance planning and resource prioritization.
Through this work, the study contributes to the development of scalable, user-centric tools for intelligent infrastructure management and smart city applications.
2. Literature Review
AI and deep learning have significantly transformed the field of infrastructure monitoring by providing effective tools to automatically identify road damage with precision and efficiency [17]. There has been an increasing volume of research investigating the utilization of object detection algorithms—notably, but not limited to, the You Only Look Once (YOLO)) series of models and alternatives such as RetinaNet, Faster R-CNN, SSD, and transformer-based networks—to identify surface defects such as cracks, deformations, and potholes. The YOLO framework has evolved over time from YOLOv1 to the most recent YOLOv11, with each version introducing improvements in speed, detection accuracy, attention modules, and real-time capability. Early studies predominantly employed YOLOv3 and YOLOv4, while later research explored more robust architectures such as YOLOv7, YOLOv8, and YOLOv9 to handle complex road conditions. The most recent advancements—including YOLOv10 and YOLOv11—focus on lightweight design, better generalization, and enhanced detection of small-scale and overlapping damage patterns. The methodology of these investigations ranges from real-time detection and semi-supervised learning to ensemble modeling and GAN-based data augmentation. Additionally, complementary integration of geospatial information, mobile platforms, and new technologies such as blockchain and digital twins indicates the advancement of the field toward scalable and practical applications for smart cities [18,19,20]. A detailed summary of key studies—including their objectives, methodologies, datasets, and findings—is presented in Table 1, providing a chronological overview of research efforts from 2018 to 2025.

Table 1.
Summary of key AI-based road damage detection studies (2018–2025).
Despite advances in AI-driven road damage detection, notable limitations remain. Many studies depend on static datasets or controlled environments, reducing real-world performance under varying lighting and surface conditions. Research often prioritizes detection accuracy but overlooks usability for municipal authorities and the public. Few implement browser-based platforms for real-time detection without device or login constraints. Additionally, while models perform well on benchmark datasets, limited comparative analysis exists on YOLO variants and Gemini AI across online and field-collected images. Finally, integrating severity-based classification with geospatial visualization in practical, deployable systems remains largely underexplored in the literature.
This paper bridges these gaps by developing and evaluating a fully functional, browser-based AI framework that supports real-time road damage detection using YOLOv8 and YOLOv11. The system enables users to upload images directly through a custom web interface and instantly receive prediction results along with severity classifications. Unlike earlier studies, our platform includes OpenStreetMap-based geospatial mapping, allowing users to visualize damage locations and their intensity using color-coded pins. Moreover, we conducted a comprehensive performance comparison between different YOLO models and Gemini AI using both internet-sourced and field-collected images, highlighting the variability in model generalization. By addressing limitations in usability, field adaptability, and data visualization, our study offers a scalable and inclusive solution for intelligent road infrastructure monitoring, directly supporting smart city initiatives and preventive maintenance strategies.
3. Methodology
3.1. Methodology Overview
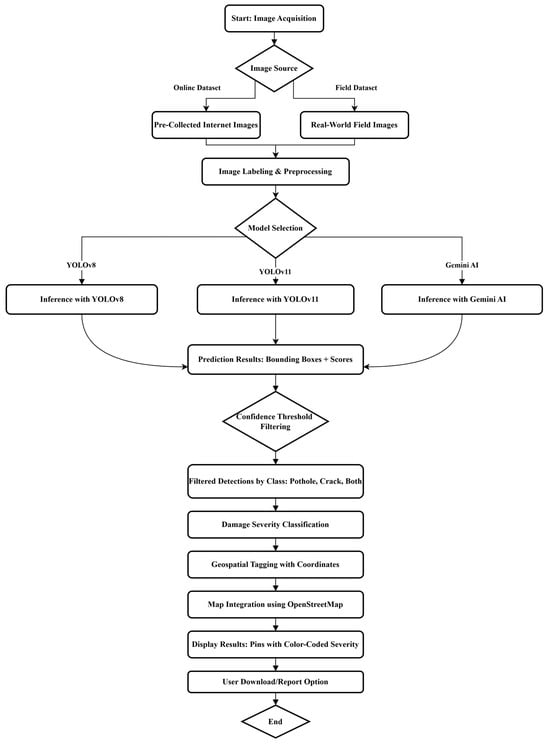
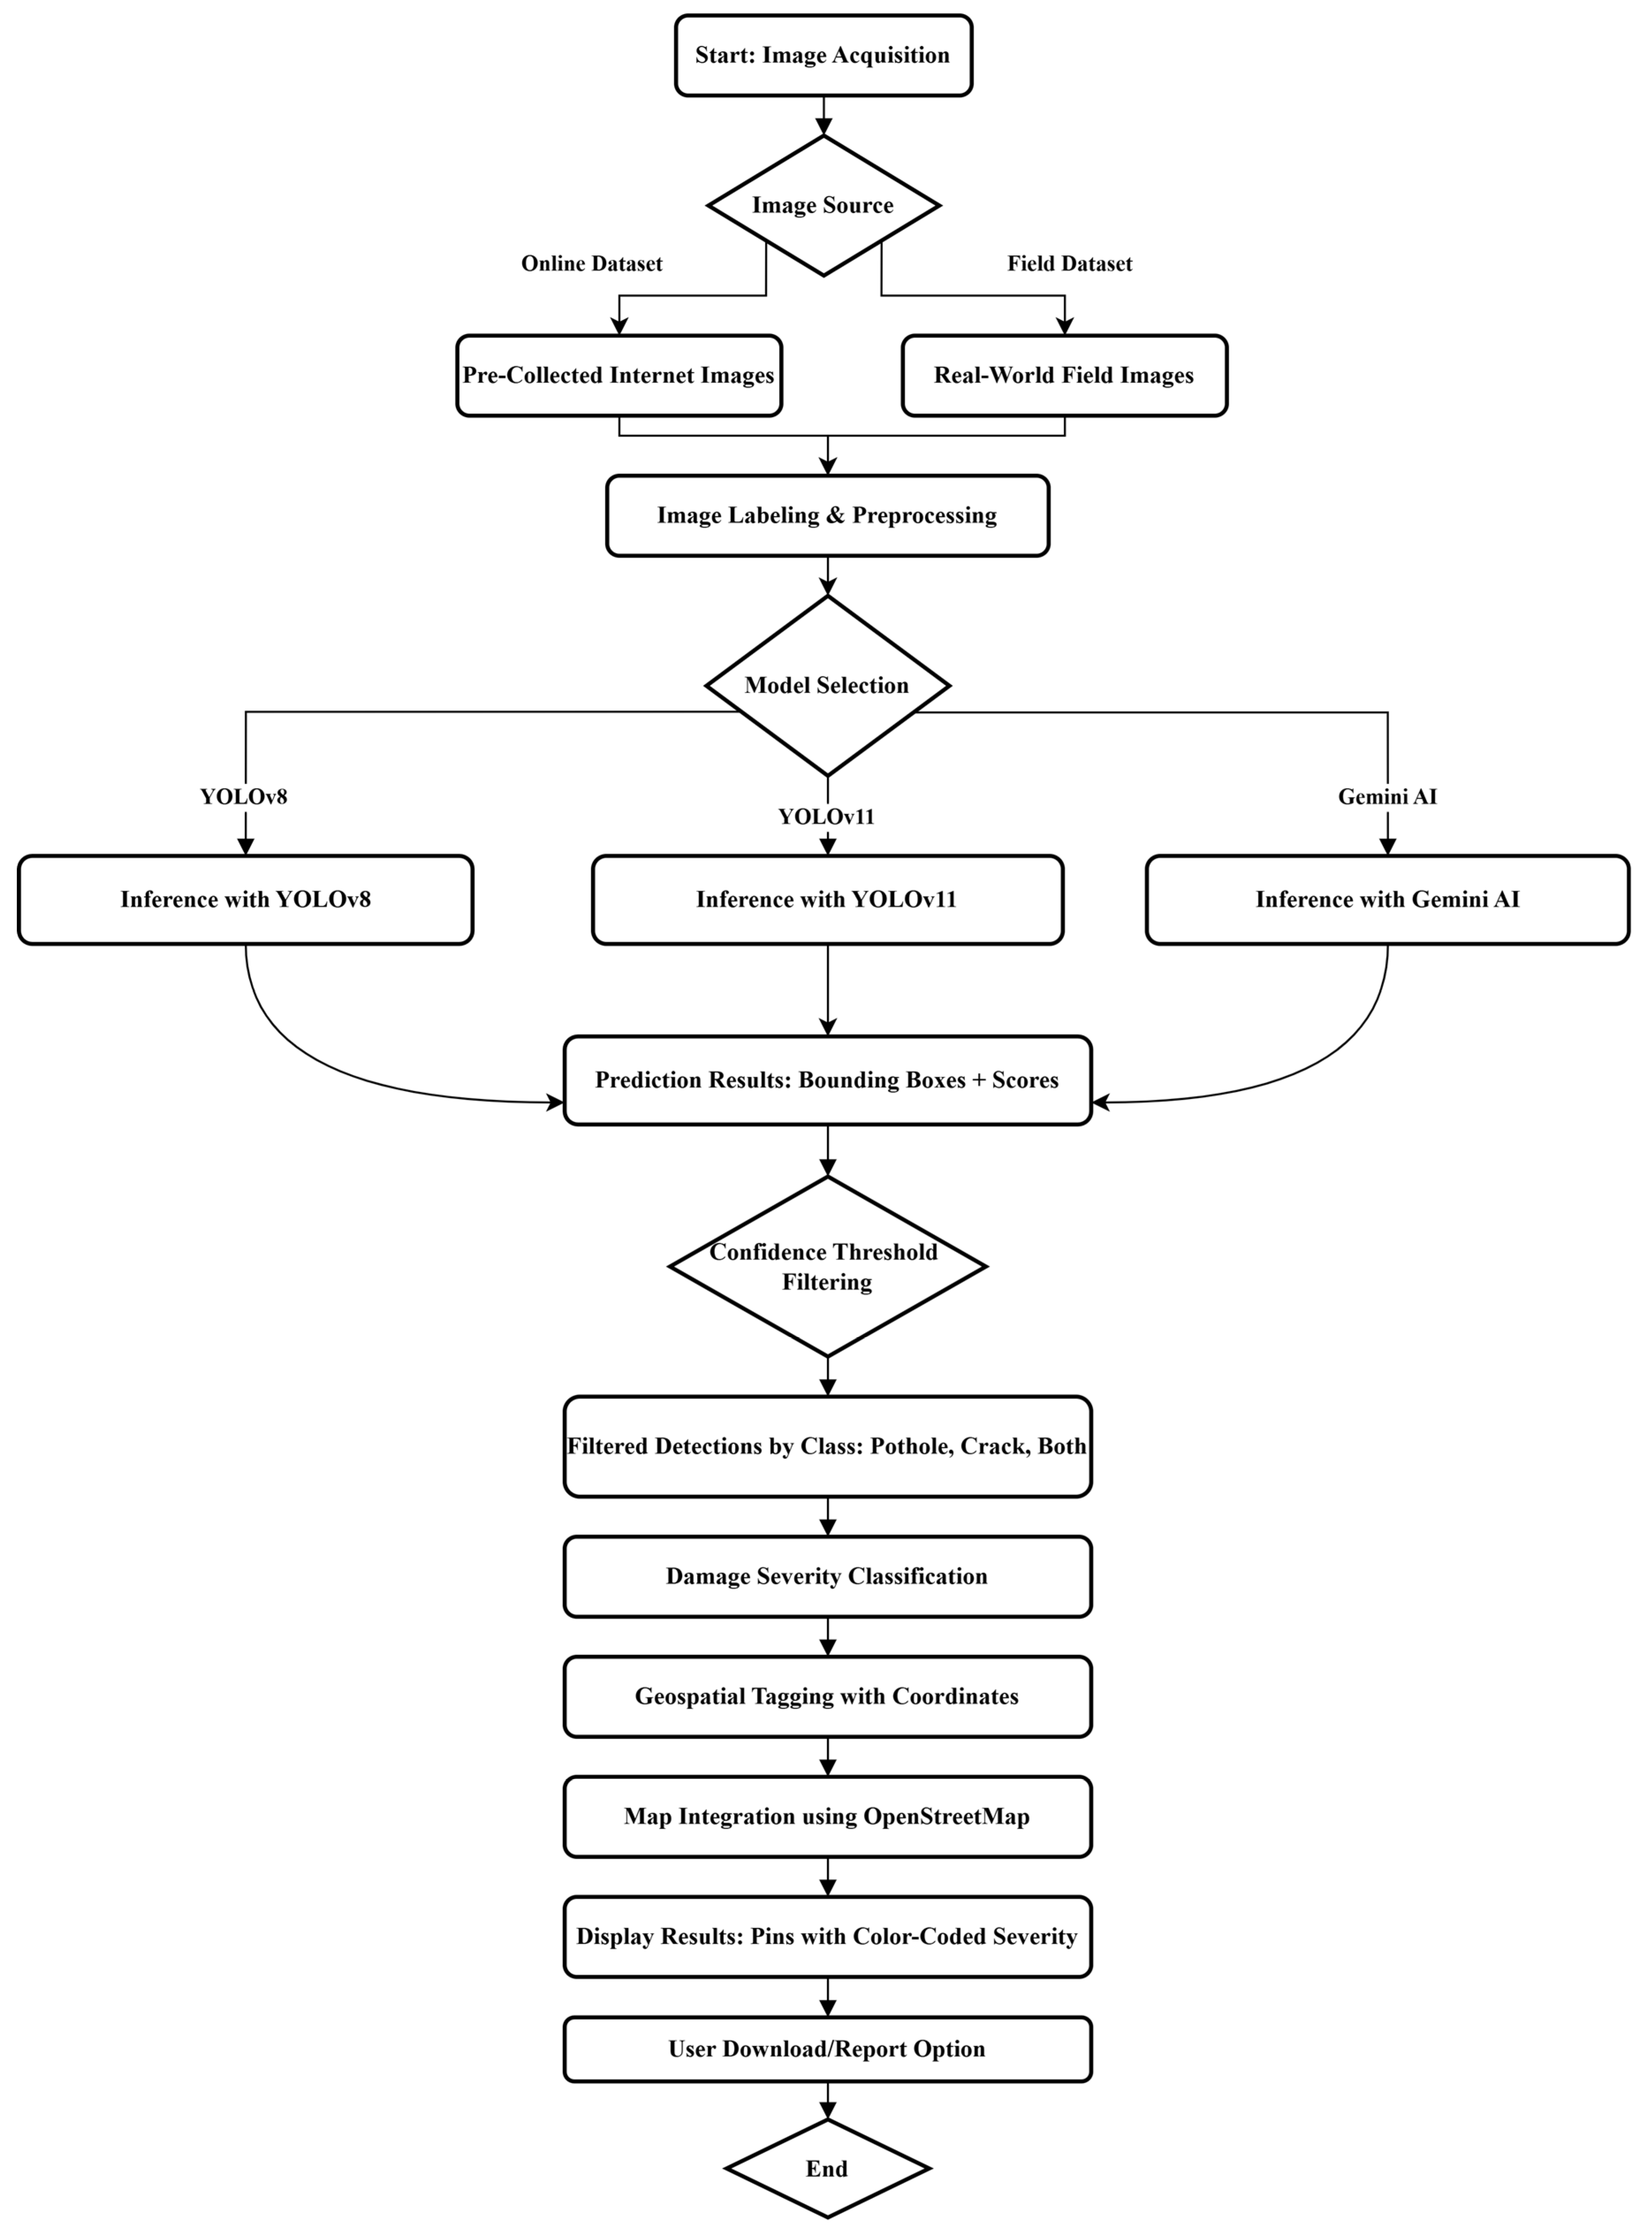
This study proposes a multi-stage AI-based framework for automated road damage detection, classification, and geospatial mapping. The system integrates deep learning models with a web-based interface to allow users to upload images, obtain predictions, and visualize road damage severity on a map. The workflow consists of six major components: (1) data acquisition from both online repositories and on-site field conditions; (2) image labeling and preprocessing; (3) model selection and inference using YOLOv8, YOLOv11, or Gemini AI; (4) filtering of prediction outputs based on confidence thresholds; (5) severity classification and damage type identification; and (6) geospatial tagging and result visualization using OpenStreetMap.
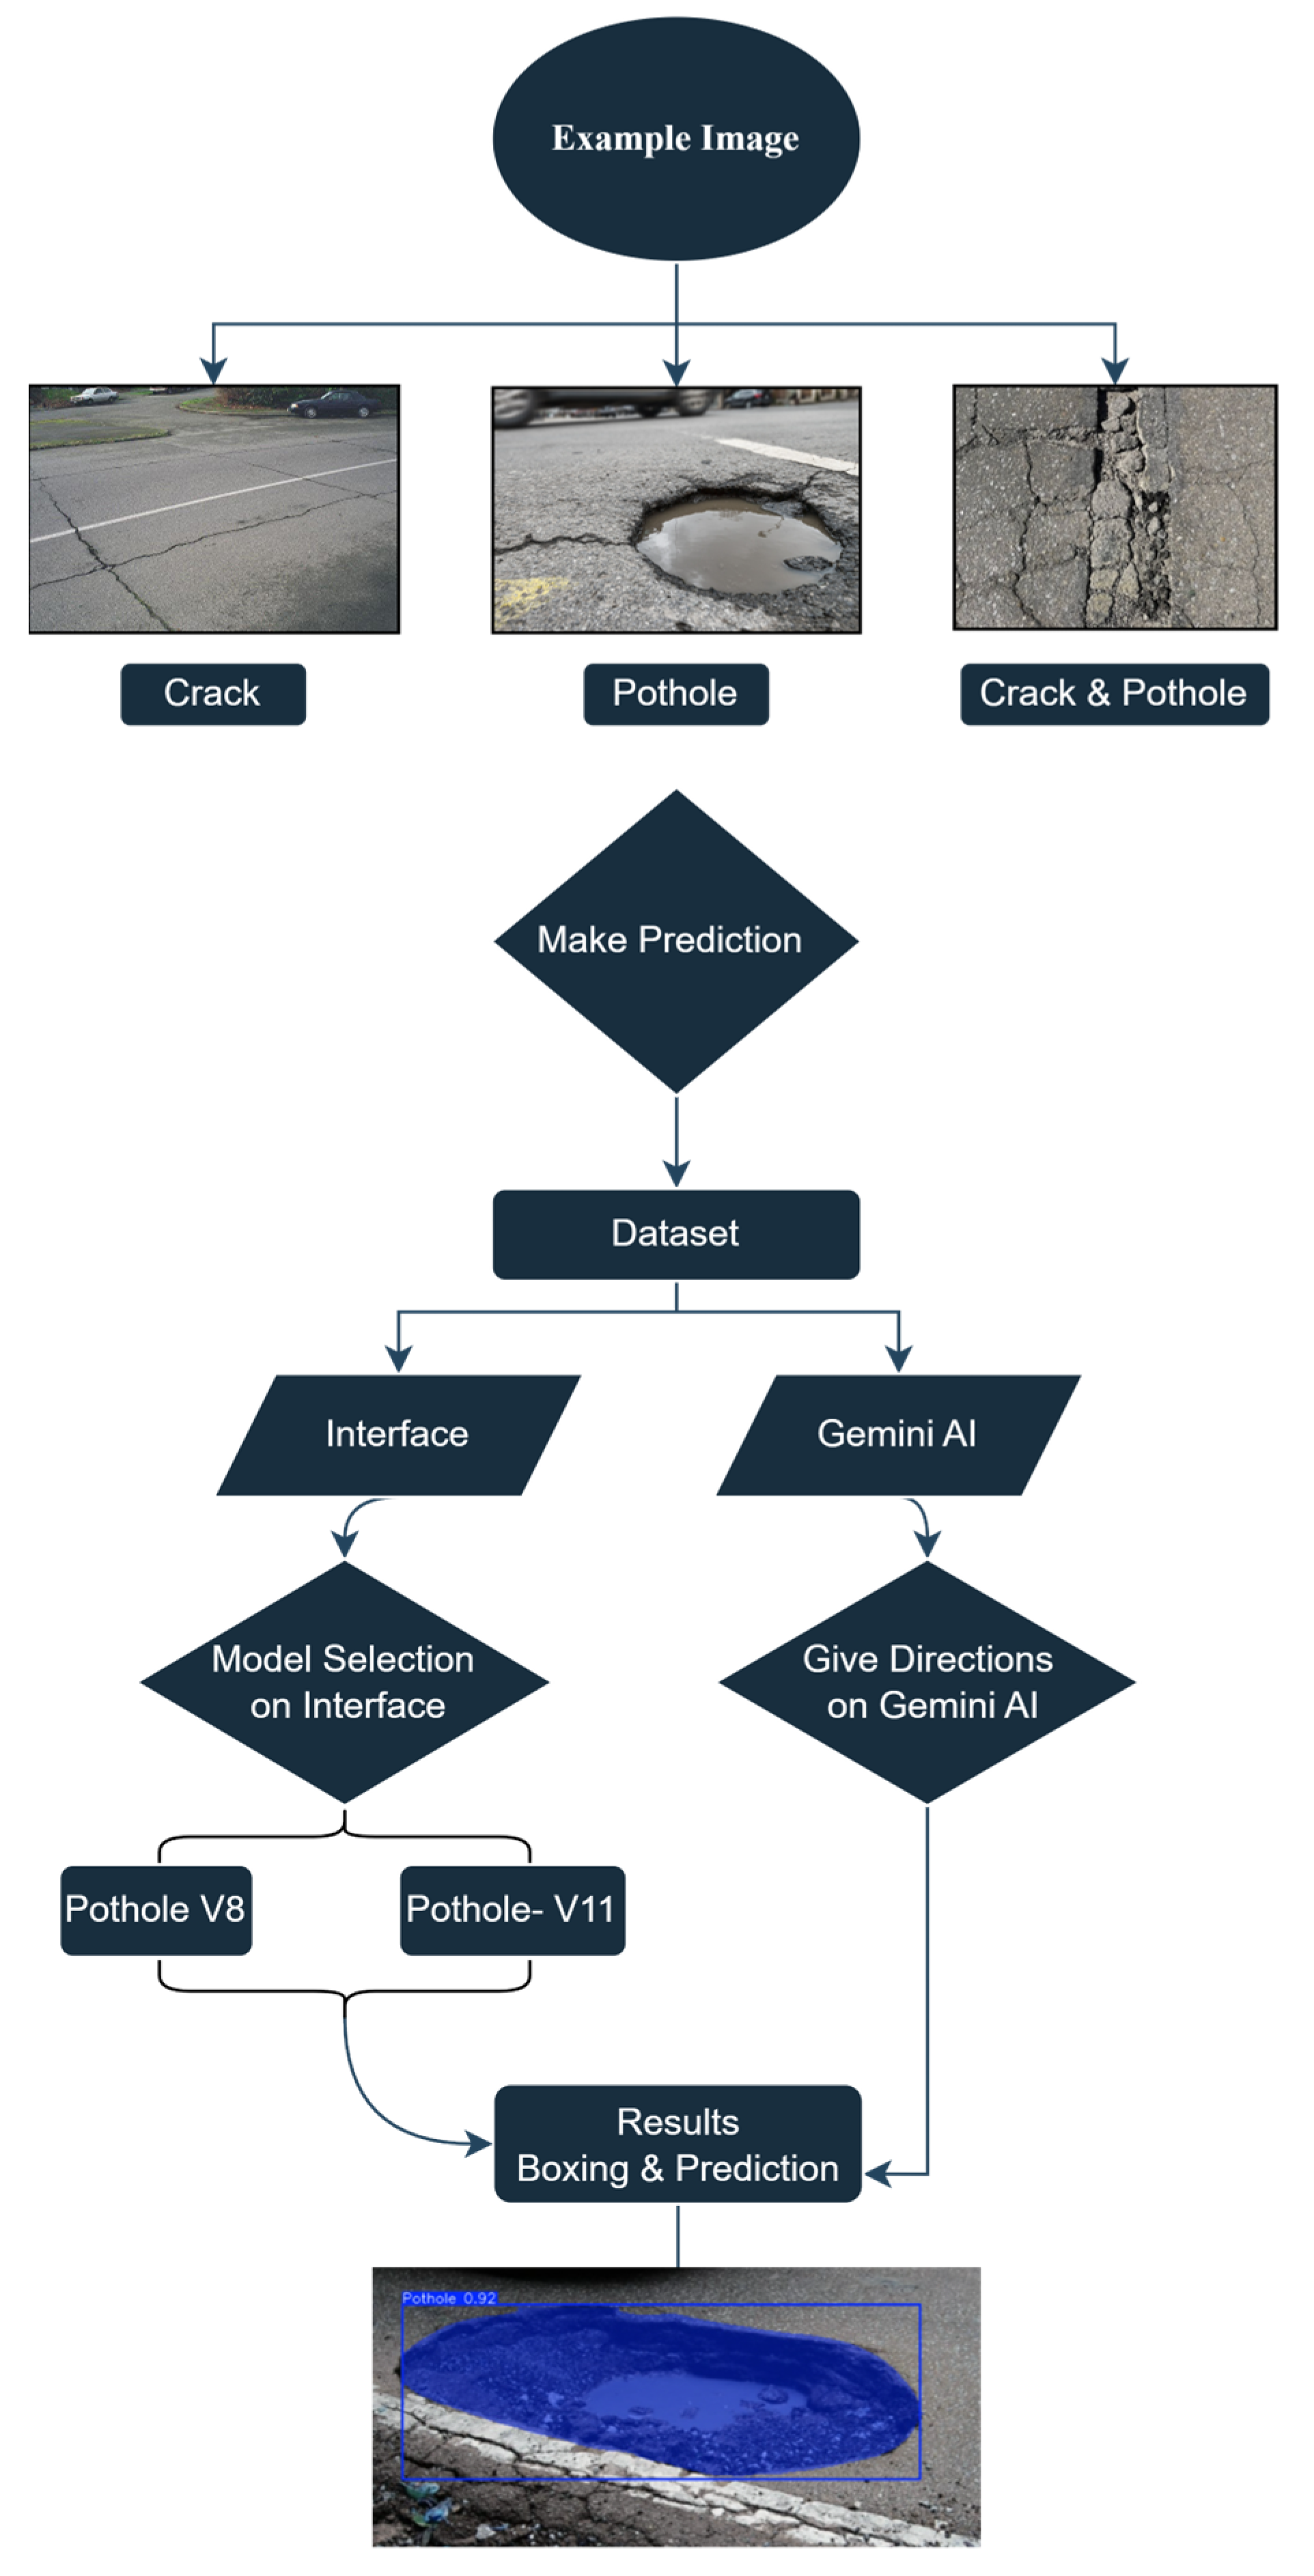
A detailed flow of this framework is illustrated in Figure 1. The process begins with image acquisition, followed by preprocessing steps such as annotation and formatting. Based on user selection, the system invokes one of the integrated models for inference. The resulting bounding boxes and confidence scores are filtered and categorized into damage types such as pothole, crack, or both. Detected objects are then classified by severity (low, moderate, or high) and geotagged using coordinate metadata. The results are visualized through a map interface that enables intuitive understanding and export functionality for municipal applications.
Figure 1.
Overview of the proposed AI-based framework for real-time road damage detection and mapping.
3.2. Dataset Collection and Preprocessing
3.2.1. Data Sources
To ensure robust training and testing of the detection models, the dataset was compiled from two primary sources: publicly available internet images and field-collected data. The internet-sourced dataset was curated from open repositories and included high-resolution images of various road damages captured under controlled conditions. These images predominantly feature clear backgrounds, centered targets, and ideal lighting conditions, making them useful for initial model calibration and comparative benchmarking (Table 2).
Table 2.
Summary of internet-sourced pothole images used for benchmarking and model evaluation [53,54,55,56,57,58,59,60].
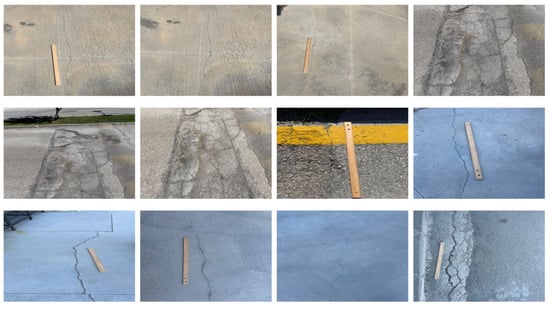
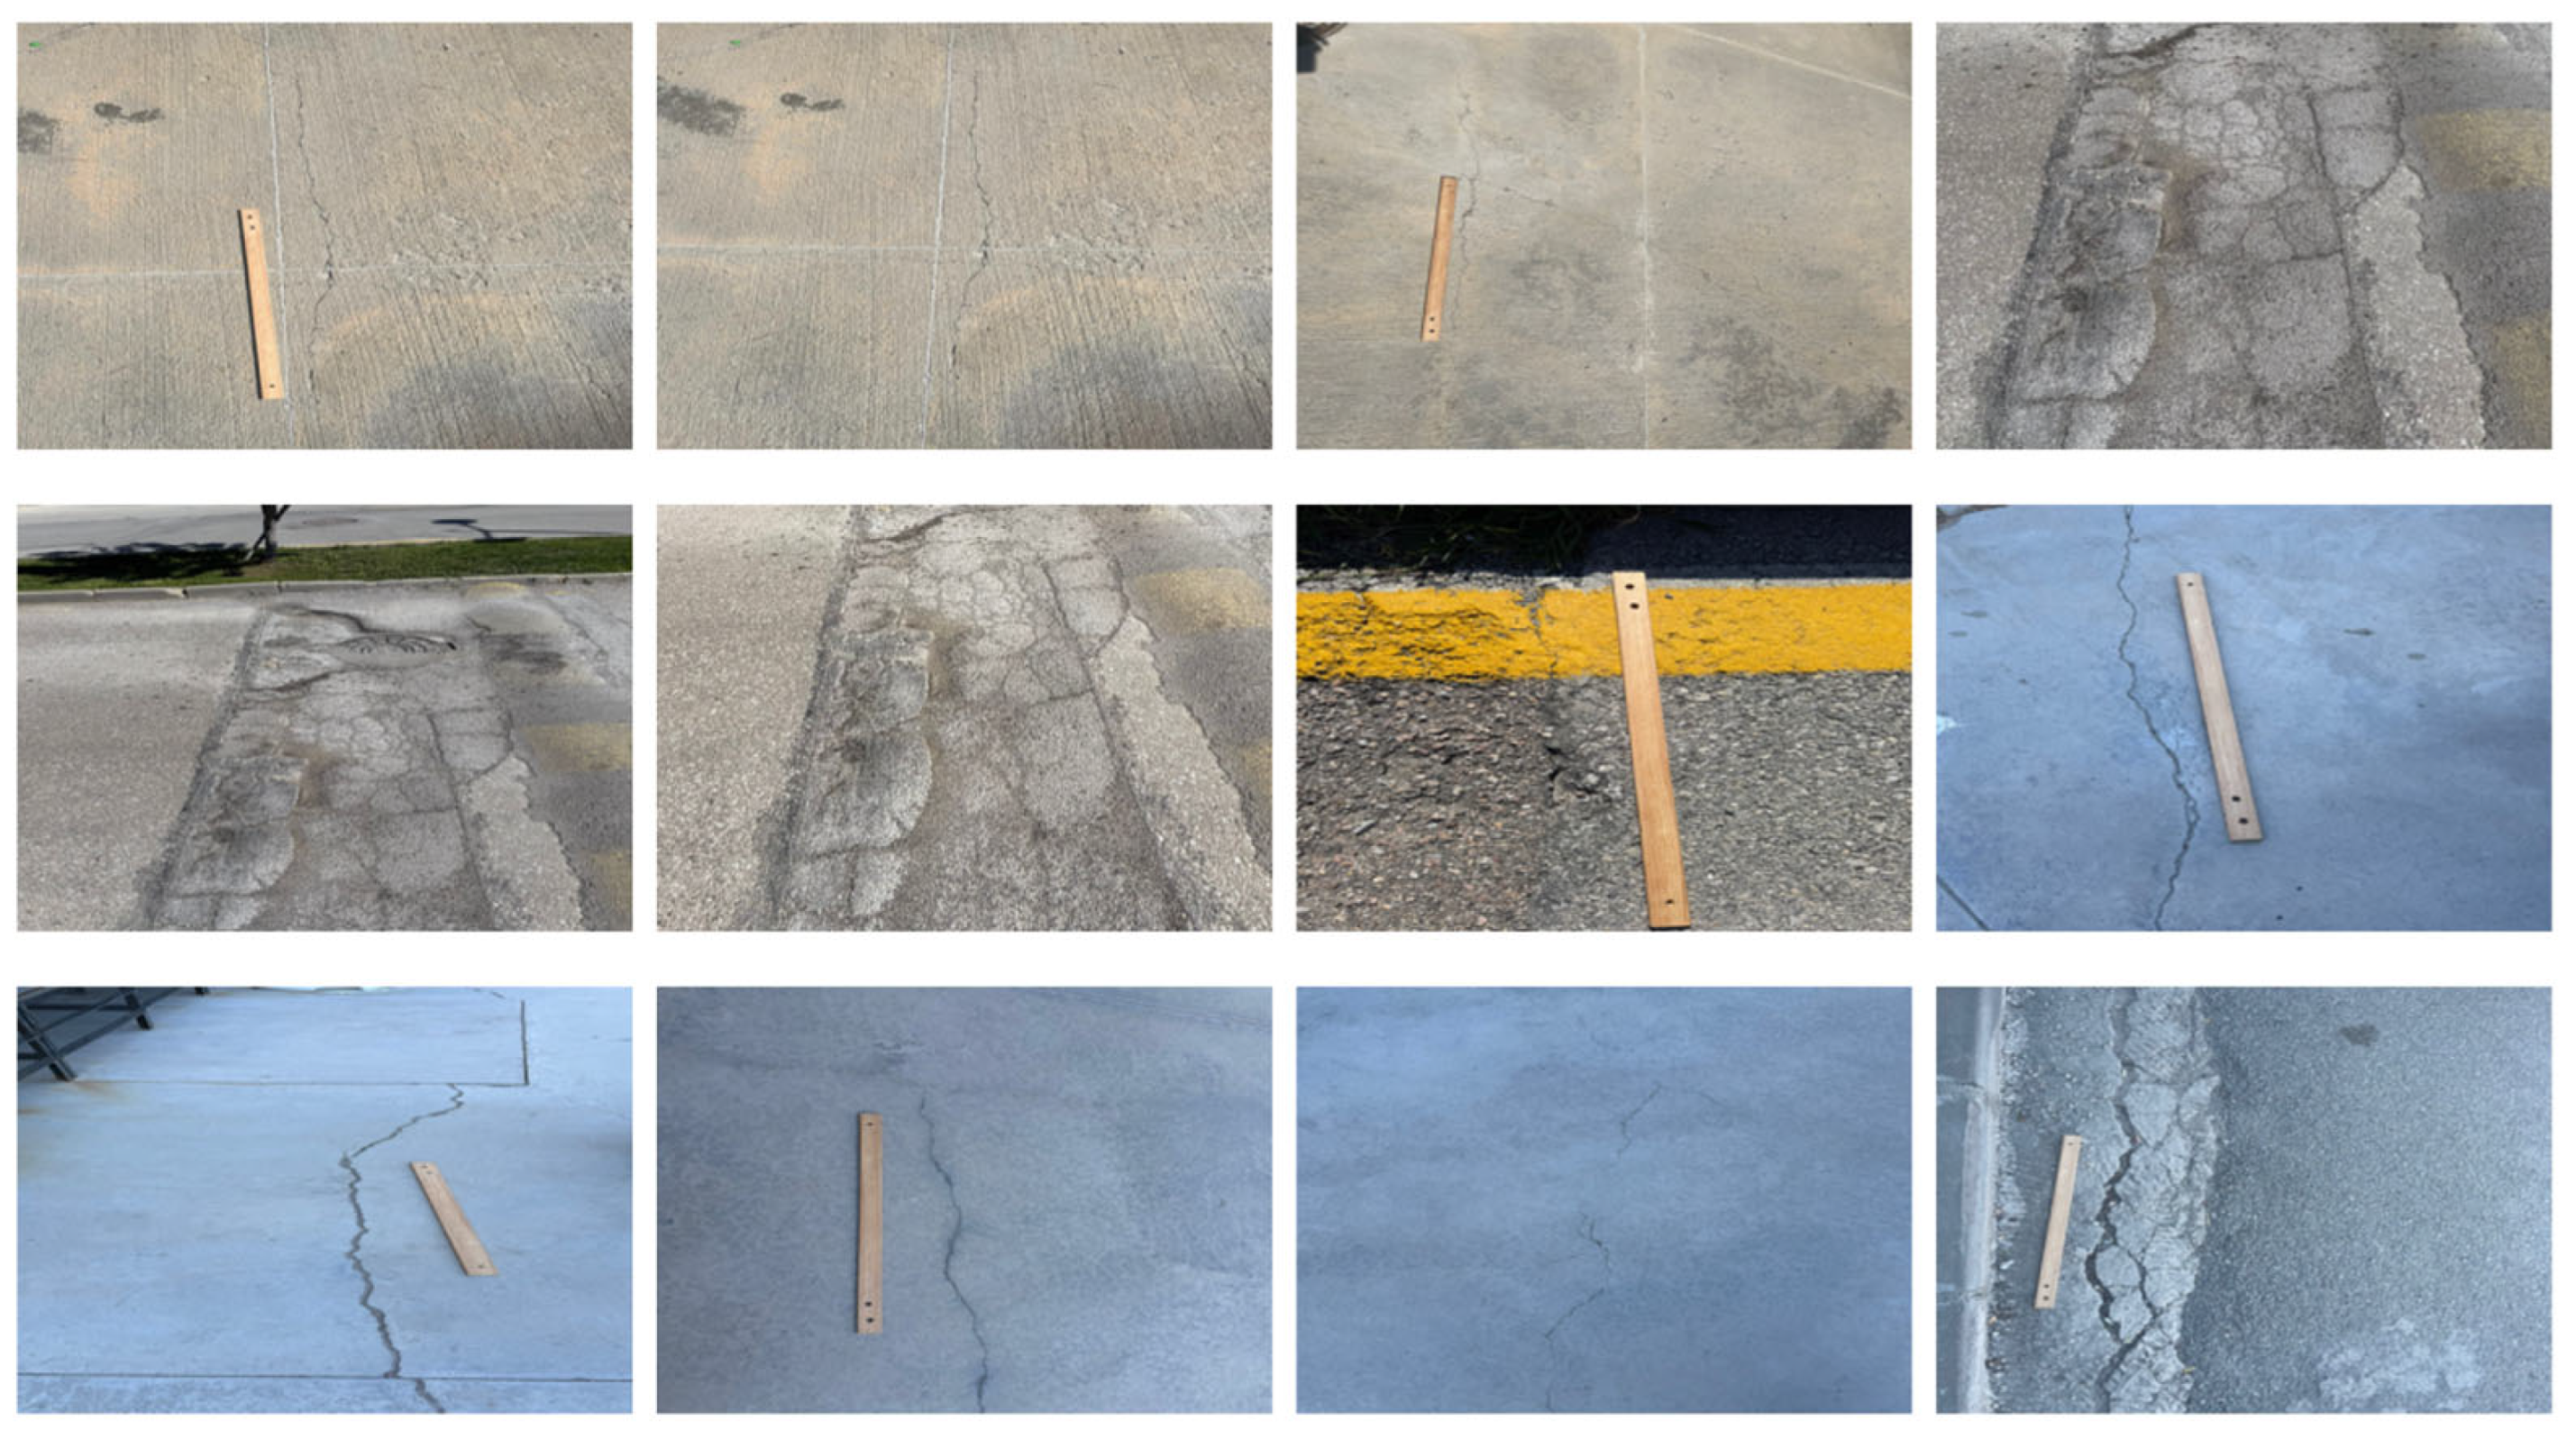
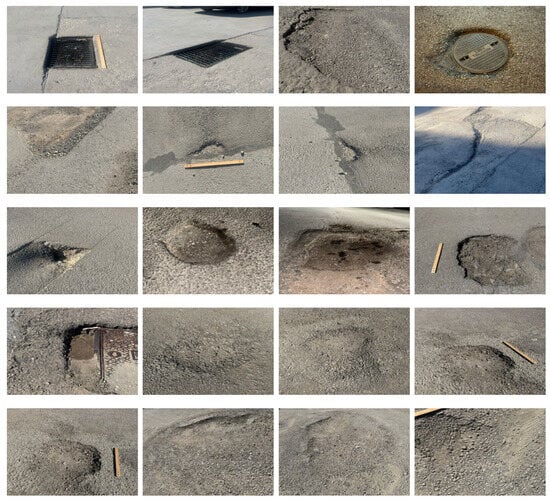
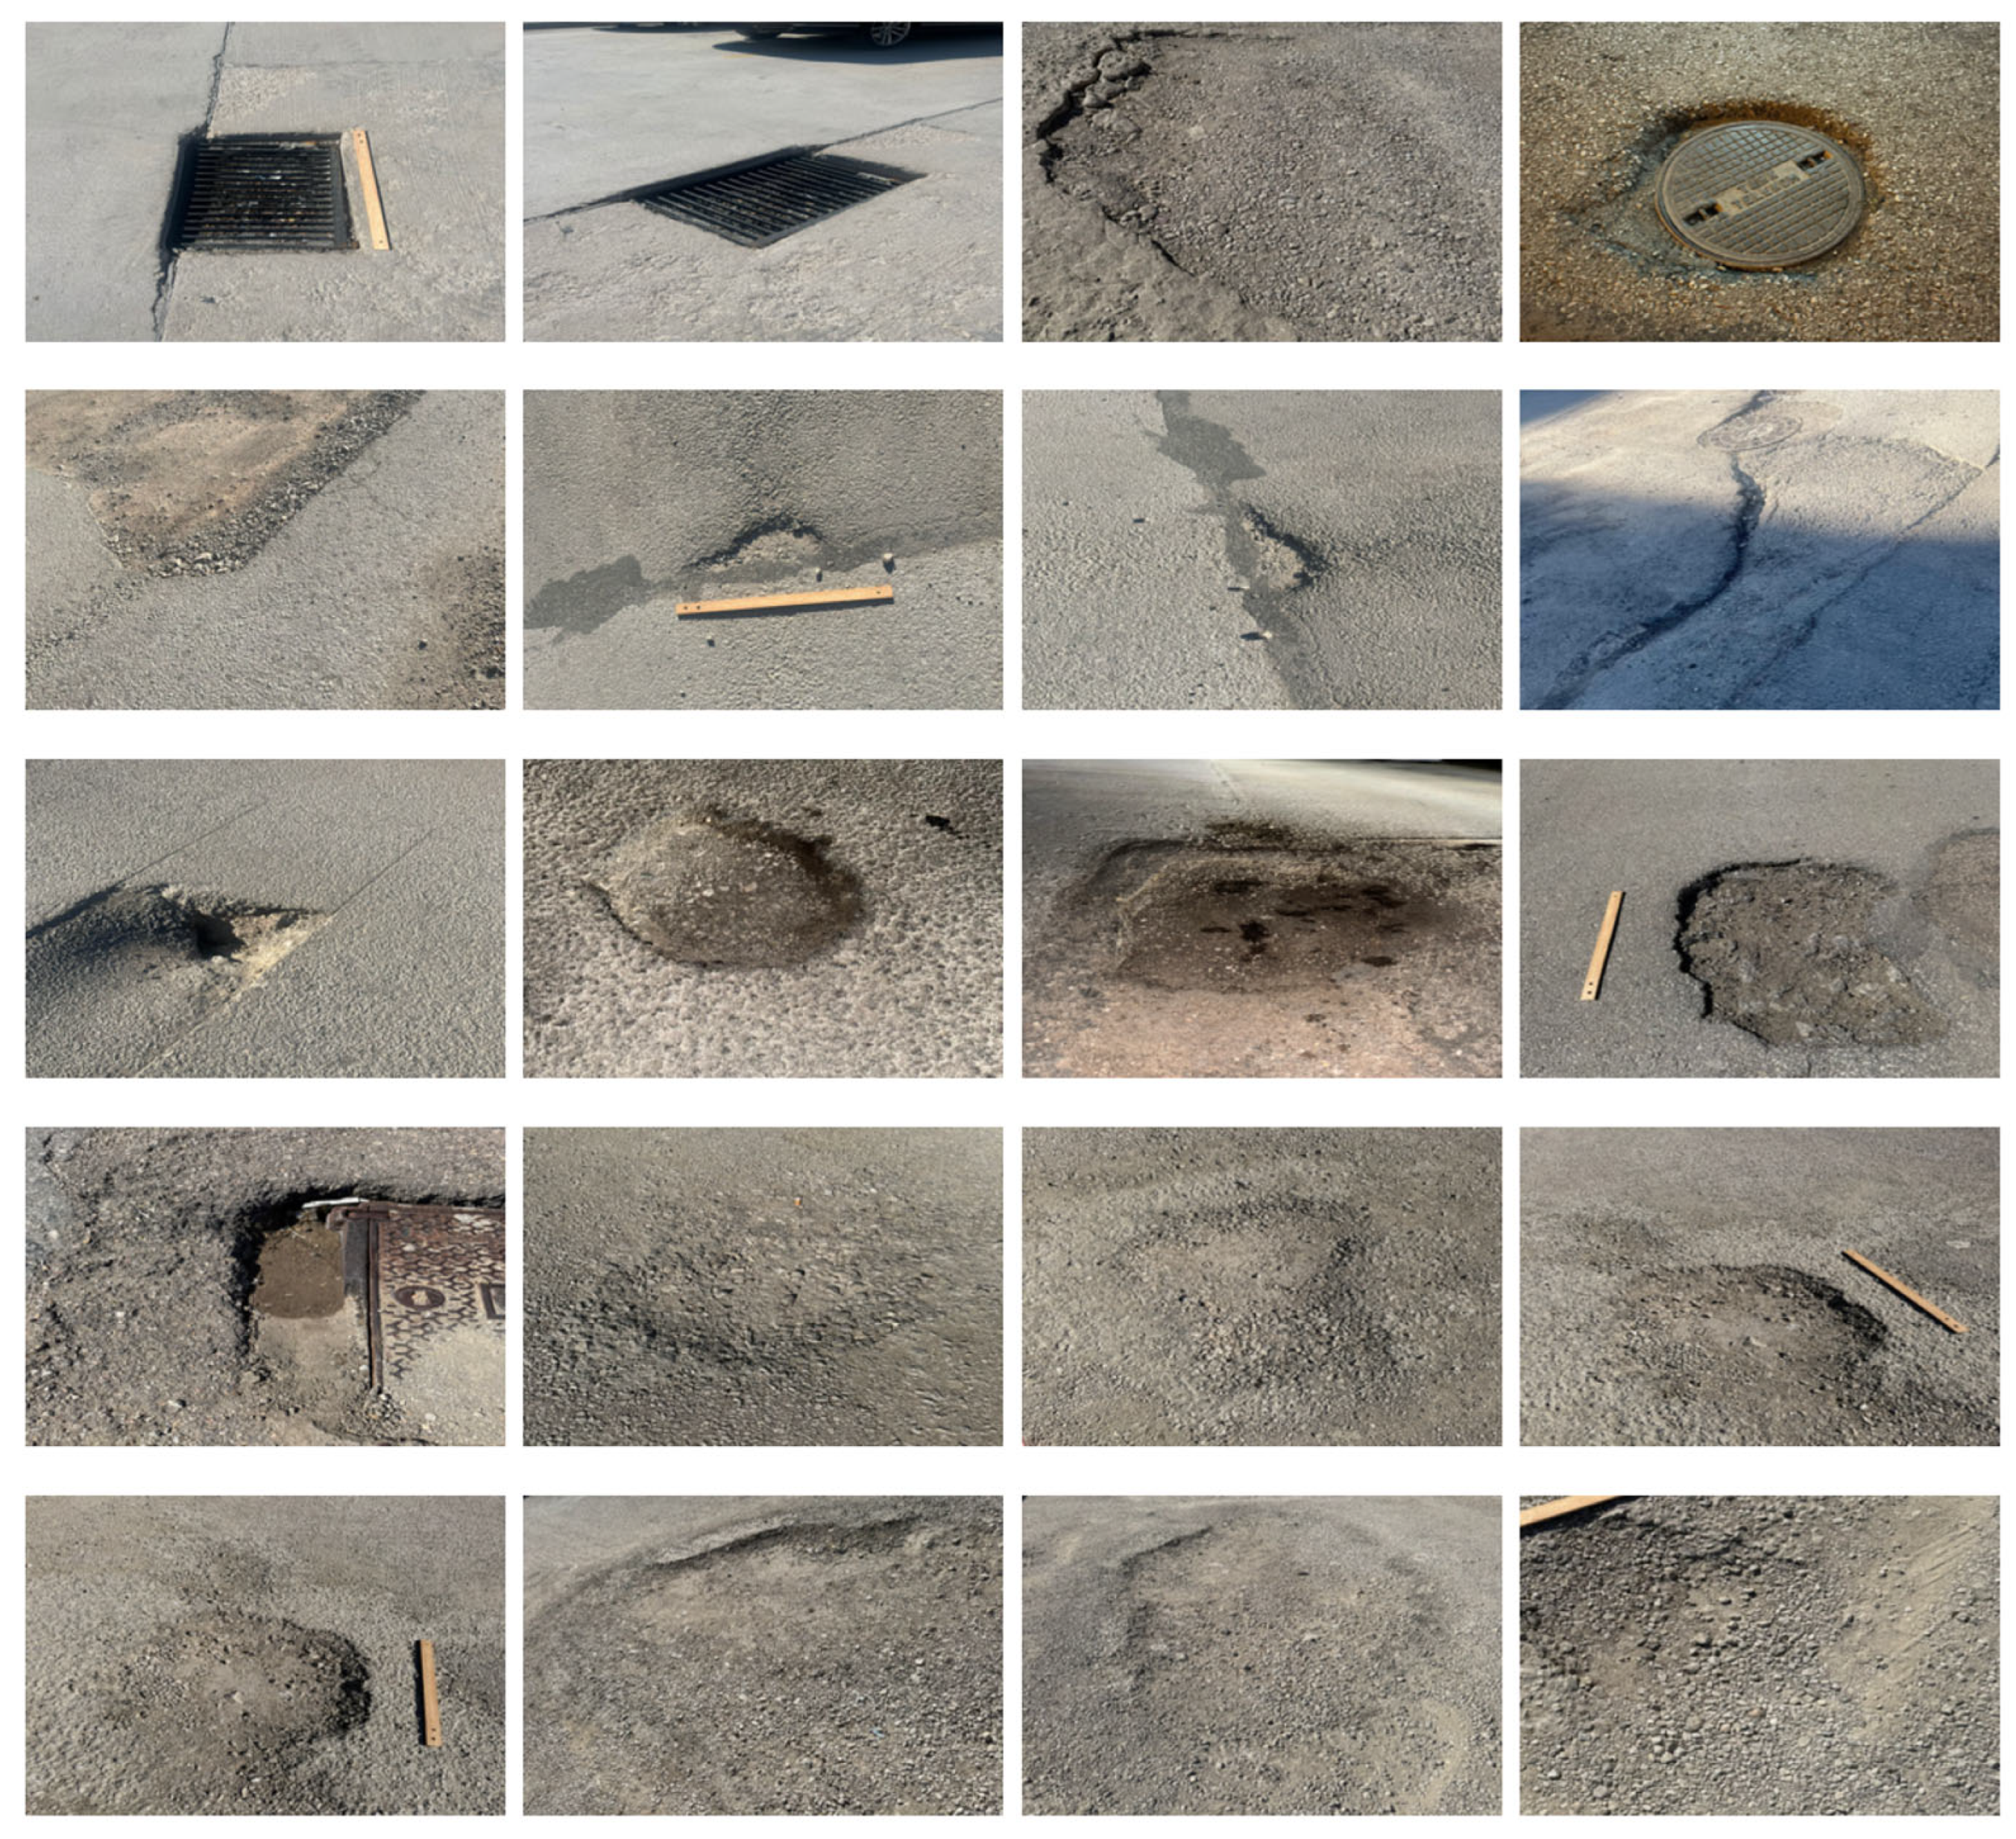
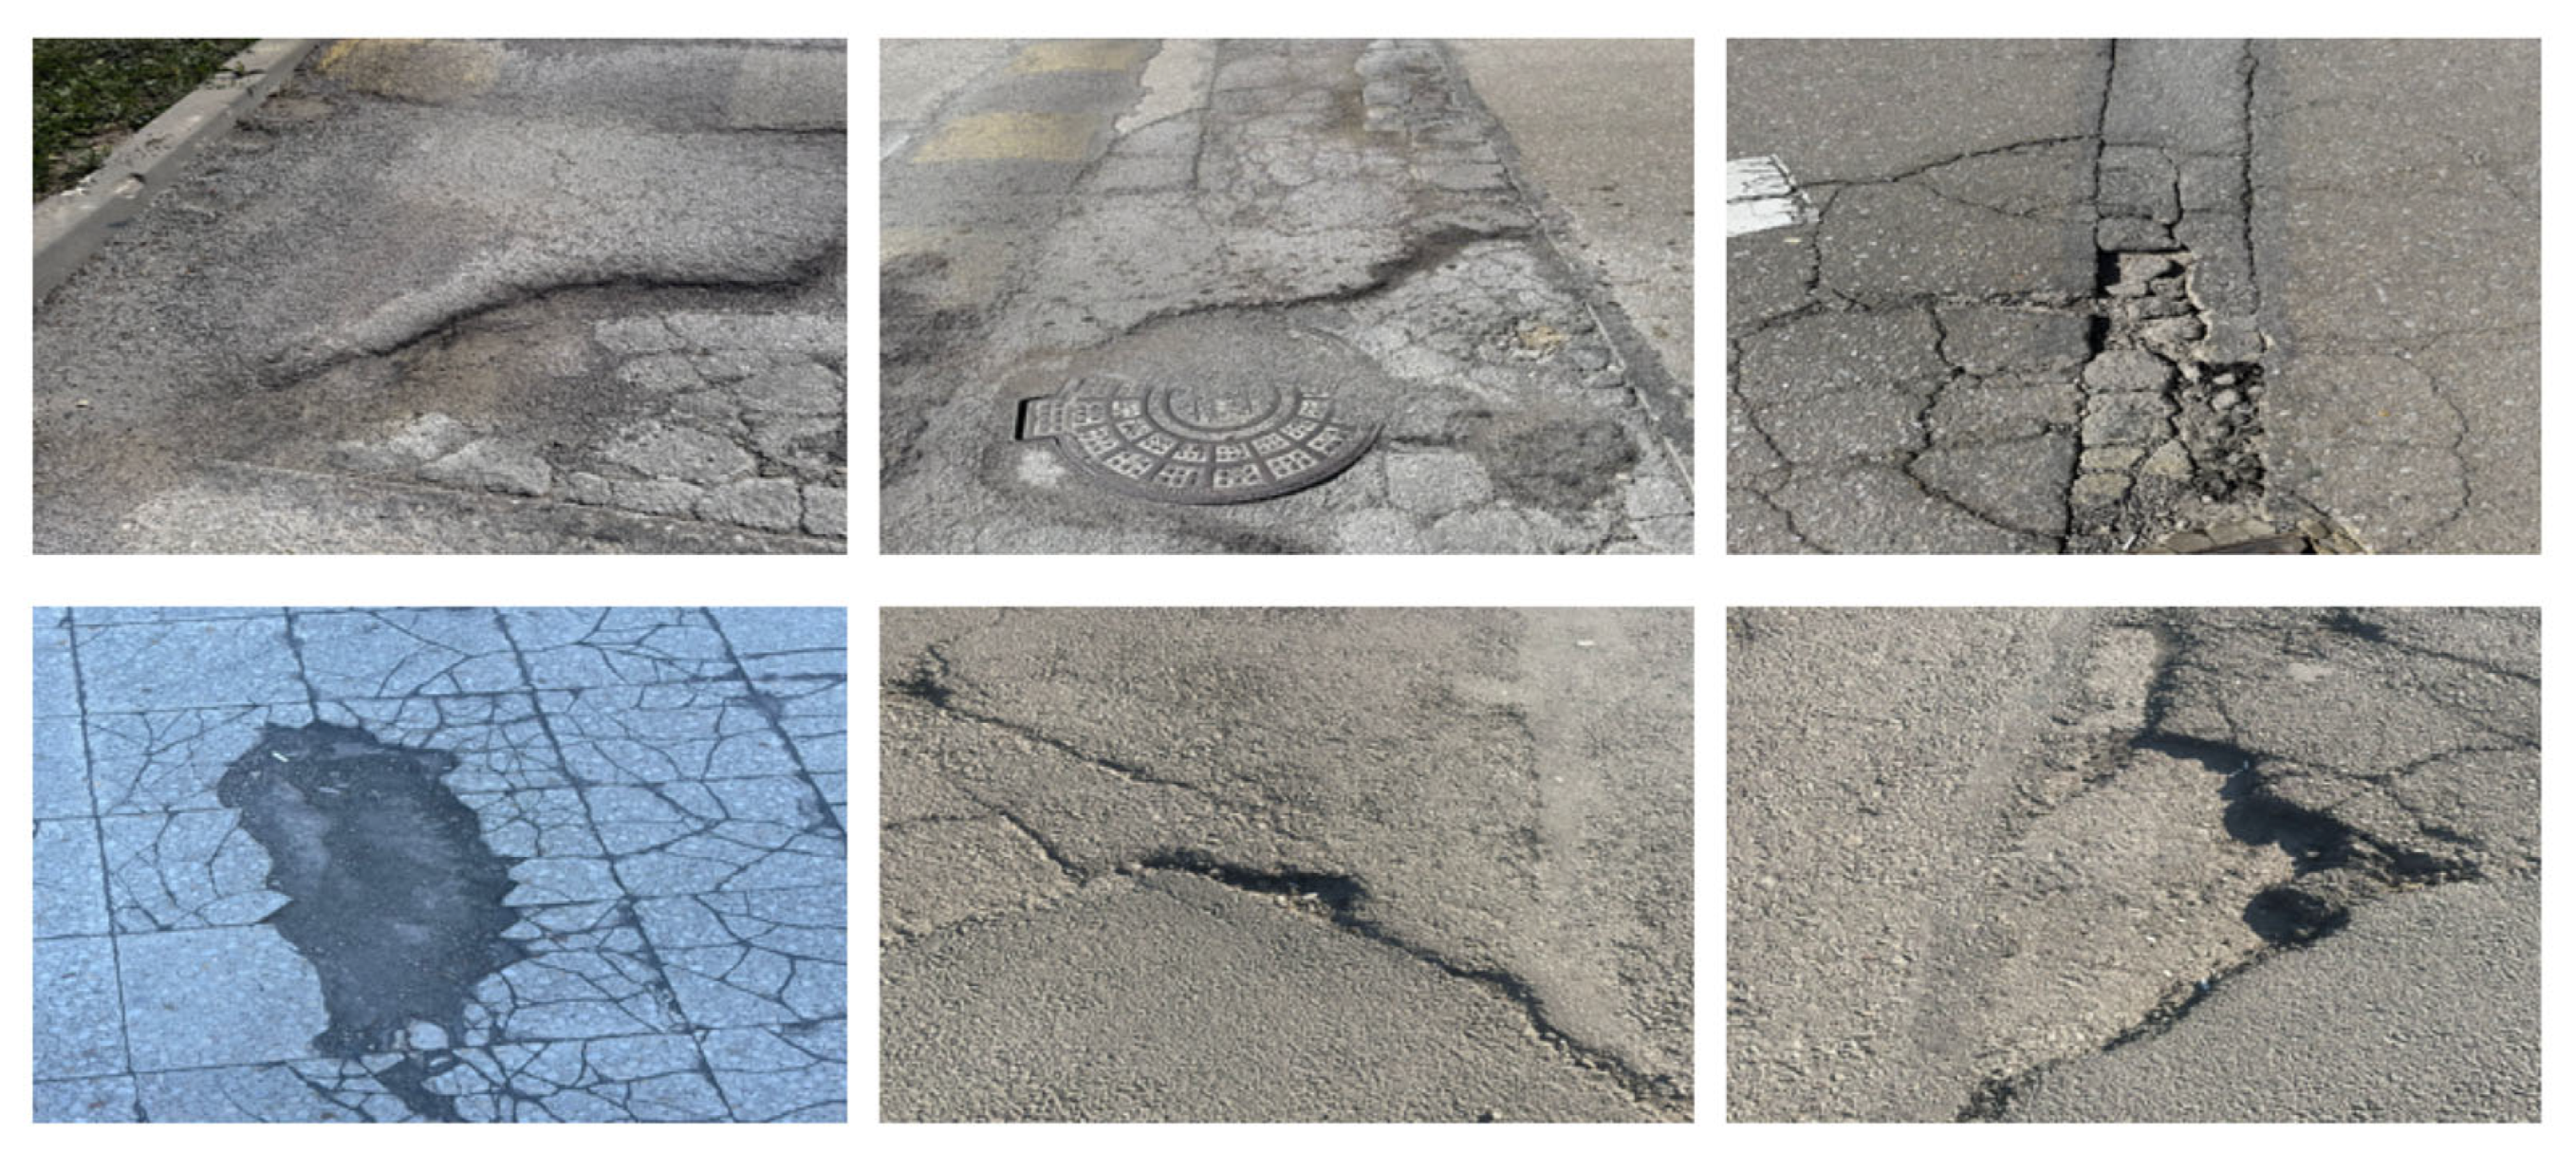
In contrast, the field dataset was collected locally in Ankara, Turkey using mobile device cameras under varying lighting angles, shadows, occlusions, and diverse surface textures. This dataset was essential to evaluate the models’ generalization ability and robustness in practical deployment scenarios. The field images were manually categorized into three main classes based on visible damage type: (1) cracks (Figure 2), (2) potholes (Figure 3), and (3) combined damage exhibiting both potholes and cracks (Figure 4). This classification enabled balanced sampling and focused evaluation across multiple model versions.
Figure 2.
Field-collected images showing typical road surface cracks under natural lighting.
Figure 3.
Field-collected images displaying isolated potholes captured in urban environments.
Figure 4.
Field-collected images with combined road damages: coexisting potholes and cracks.
3.2.2. Labeling and Augmentation
All image samples were annotated using the open-source tool LabelImg, which supports YOLO-compatible annotation formats. Each object of interest was manually enclosed within bounding boxes, and the corresponding class labels (pothole, crack, and both) were assigned. To maintain consistency and compatibility with the YOLO framework, images were resized to standard input dimensions (e.g., 640 × 640 pixels), and annotations were saved in .txt format alongside the corresponding image files.
Preprocessing included format conversion to .jpg, resolution normalization, and correction of aspect ratio distortions. Although no automated augmentation pipeline was employed during training in the current version, the diversity introduced by combining internet- and field-sourced images served as a form of natural augmentation, exposing models to various angles, surface conditions, and environmental noise. Future iterations of the framework may incorporate formal augmentation techniques such as random flipping, brightness shifts, and Gaussian noise to further improve model robustness.
3.3. Model Selection and Configuration
This study leveraged advanced deep learning models for automated road damage detection, specifically YOLOv8, YOLOv11, and Gemini AI. These models were selected for their high detection accuracy, fast inference speeds, and compatibility with real-time, web-based deployment. YOLOv8 and YOLOv11 are one-stage object detectors designed for rapid inference and spatial precision, making them ideal for applications that require lightweight integration and responsive performance in browser environments.
The selection of YOLOv8 and YOLOv11 was further guided by their open-source availability, compatibility with freely distributed pre-trained weights, and strong community support. These factors were crucial for our browser-based deployment, which targeted cost-effective and scalable solutions without extensive custom training.
In this study, no fine-tuning or retraining was performed on the YOLO models. All models (YOLOv8, YOLOv11-A, YOLOv11-B, and Combined V8) were used in their pre-trained form, downloaded from open-source repositories [61,62,63], and directly integrated into our custom-built interface for inference only. As such, training-related parameters (e.g., learning rate, batch size, epochs, and dataset configurations) were not applicable. All inference operations were conducted using Google Colab.
YOLOv11-A represents the baseline YOLOv11 architecture using its standard layers and training pipeline. In contrast, YOLOv11-B incorporates additional Convolutional Block Attention Modules (CBAMs) within its feature extraction layers to enhance the focus on small and overlapping damage patterns.
Gemini AI, a general-purpose vision-language model, was also included to evaluate its capabilities in a prompt-based detection context. Although it is not integrated into the web interface in the same way as the YOLO models, it serves as a comparative benchmark to understand how large-scale, pretrained vision models perform in specialized infrastructure monitoring tasks.
In contrast, alternatives such as Faster R-CNN (FRCNN) use a two-stage architecture that, while highly accurate, demands greater computational resources and longer inference times, making them less suitable for interactive systems or platforms lacking GPU acceleration. Furthermore, YOLO models offer greater flexibility for frontend confidence threshold adjustments and are optimized for seamless web embedding, which aligns closely with the system’s usability and performance goals.
The implementation workflow begins with image classification into one of three damage types: potholes, cracks, or combined forms. After preprocessing, users select their preferred model through a web interface, which handles inference and displays prediction results. A detailed overview of this workflow is illustrated in Figure 5, showcasing the decision-making logic, model options, and resulting outputs.
Figure 5.
Prediction workflow using YOLOv8, YOLOv11, and Gemini AI for road damage detection.
YOLOv8, developed by Ultralytics, was chosen for its anchor-free architecture, real-time processing capabilities, and multi-task functionality (detection, classification, and segmentation). YOLOv11 incorporates additional features such as attention-enhanced feature refinement and improved object localization, making it suitable for more complex surface textures and low-contrast imagery. Both YOLO models were executed in Python (version 3.13.5) environments using Google Colab Pro+ and Jupyter Notebooks, leveraging an NVIDIA Tesla T4 GPU with 25 GB of RAM. The models were trained using an input resolution of 640 × 640, a batch size of 16, a learning rate of 0.001, and 100 epochs. Pretrained weights from the COCO dataset were used as a base for transfer learning. Confidence thresholds were adjustable via the interface, and the output included bounding boxes, class labels, and confidence scores for each detected object.
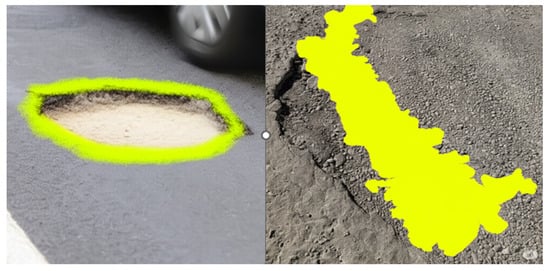
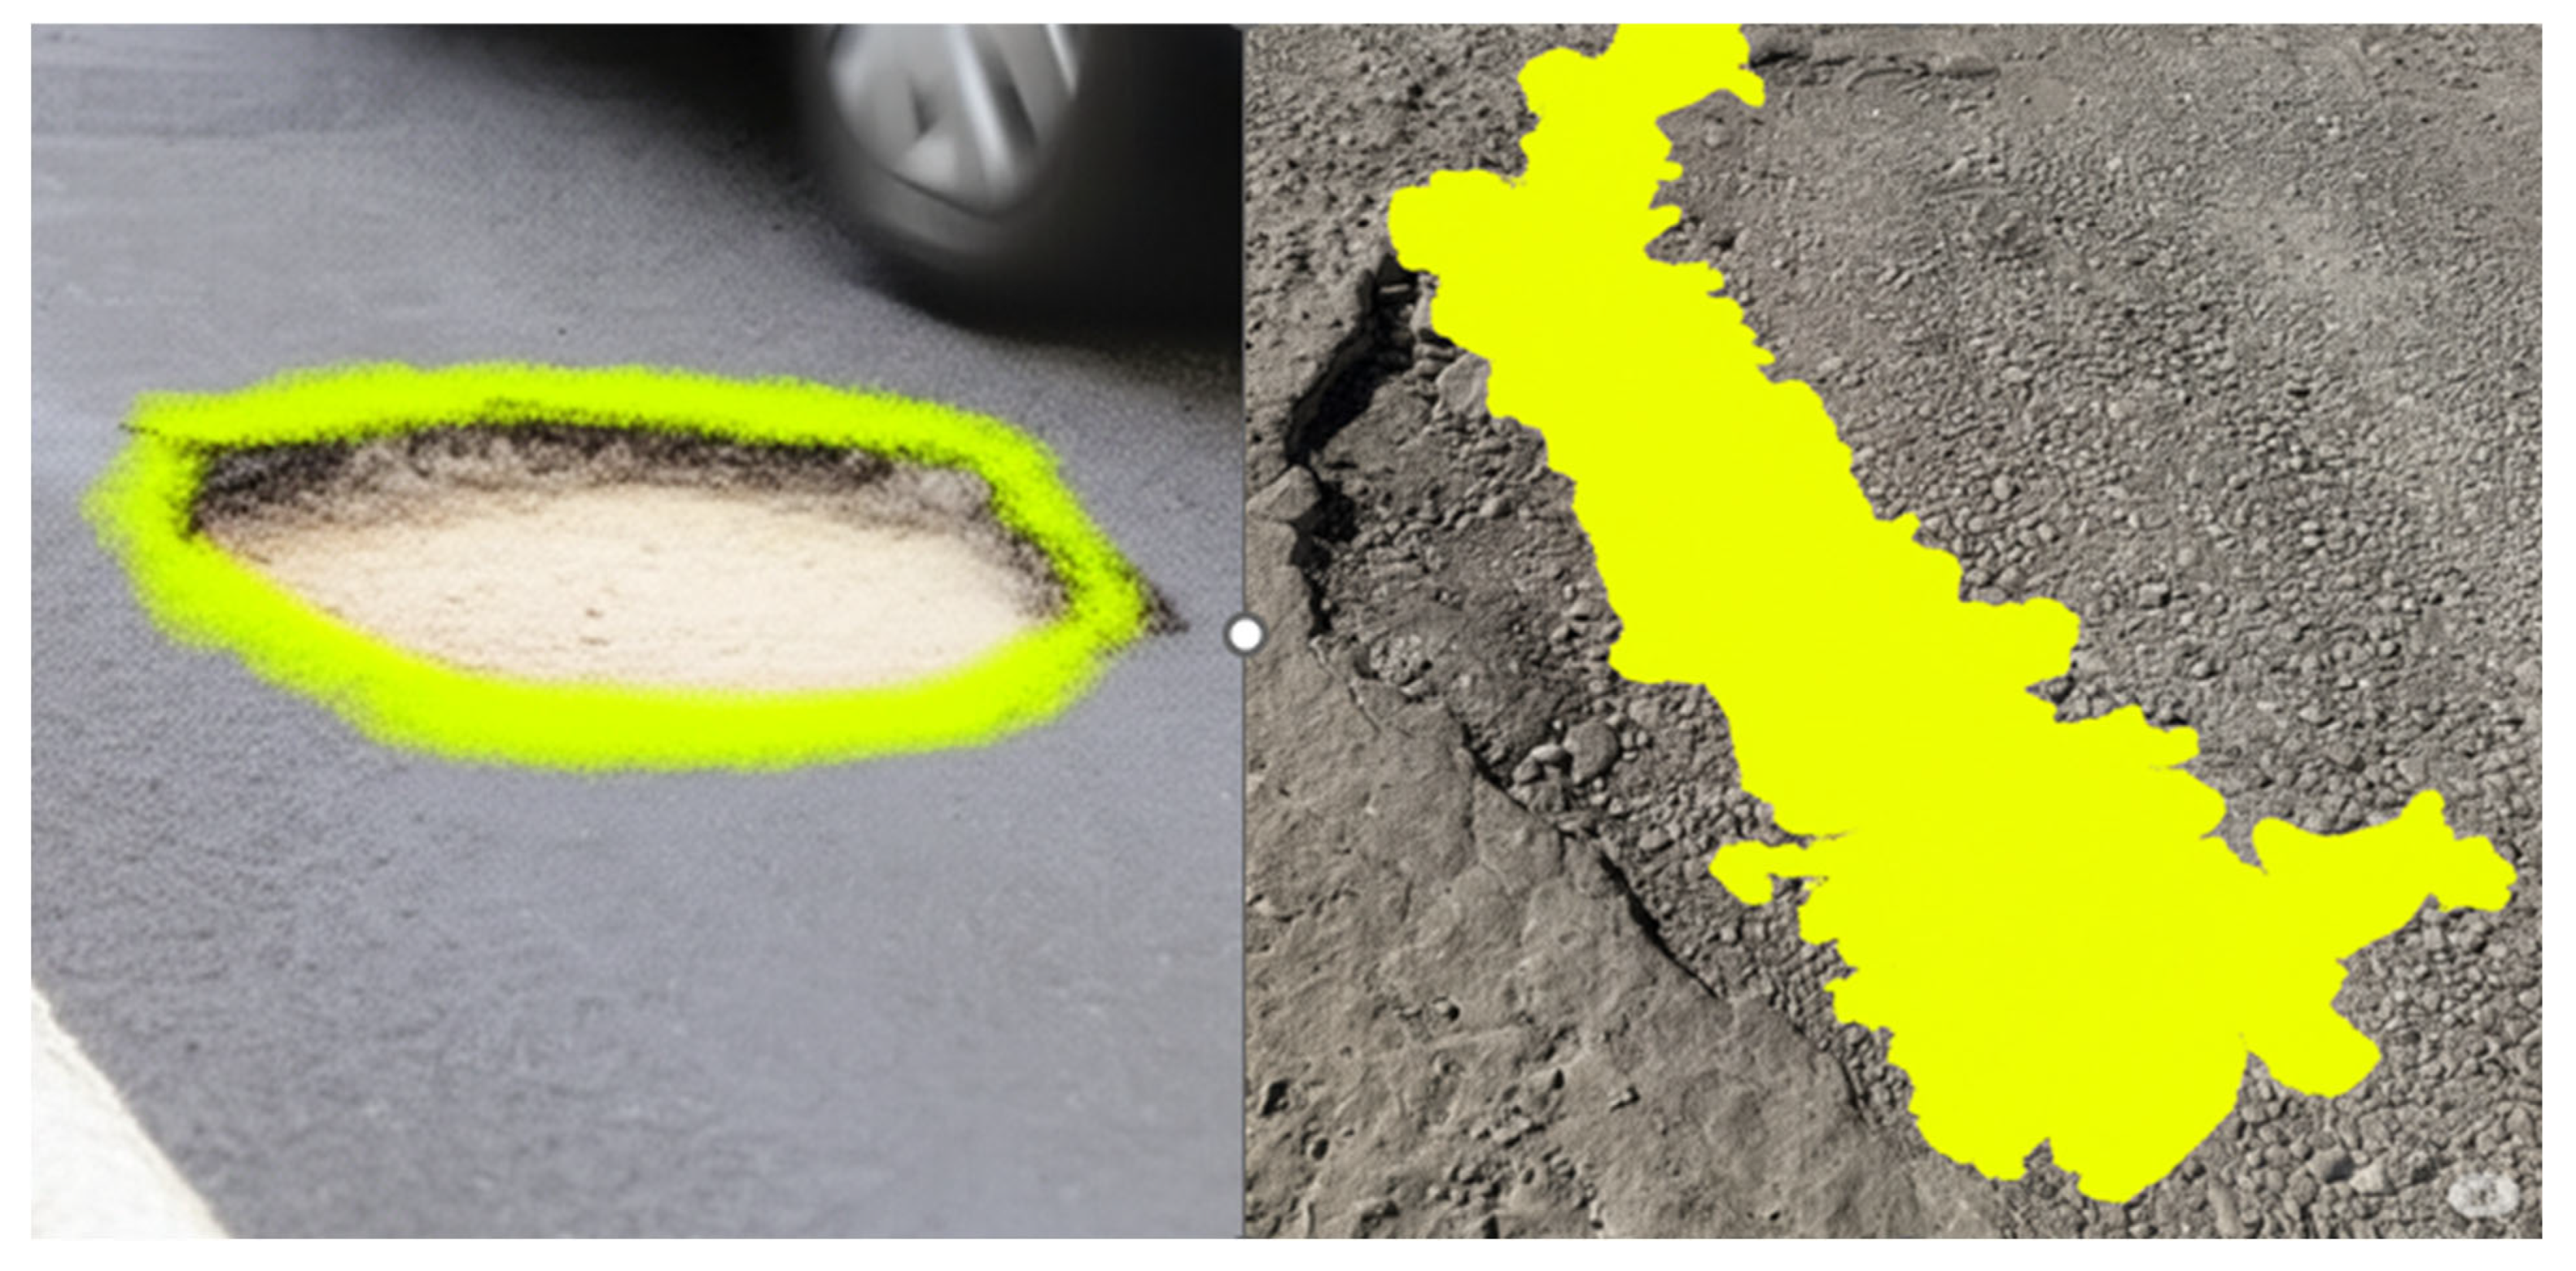
To support broader benchmarking, Gemini AI was also integrated as an external tool, as shown in Figure 6. Unlike YOLO models, Gemini AI operates through prompt-based input and is not directly embedded into the platform, though its results were included for comparative evaluation. It should be noted that the yellow shading in Figure 6 reflects Gemini AI’s raw segmentation output, which may appear imprecise due to its lack of edge refinement, and it is presented here solely to illustrate the tool’s detection capability within our benchmarking.
Figure 6.
Prediction using Gemini AI for road damage detection.
The comparison among the three models is summarized in Table 3, highlighting their deployment types, detection coverage, output formats, and integration levels. YOLOv8 and YOLOv11 were fully embedded into the web-based interface, enabling seamless interaction and real-time visual feedback. In contrast, Gemini AI required manual input and lacked direct integration, though it proved useful in evaluating performance under idealized conditions.
Table 3.
Comparison of integrated detection models by deployment type, damage coverage, and output capabilities.
3.4. Model Deployment and Platform Integration
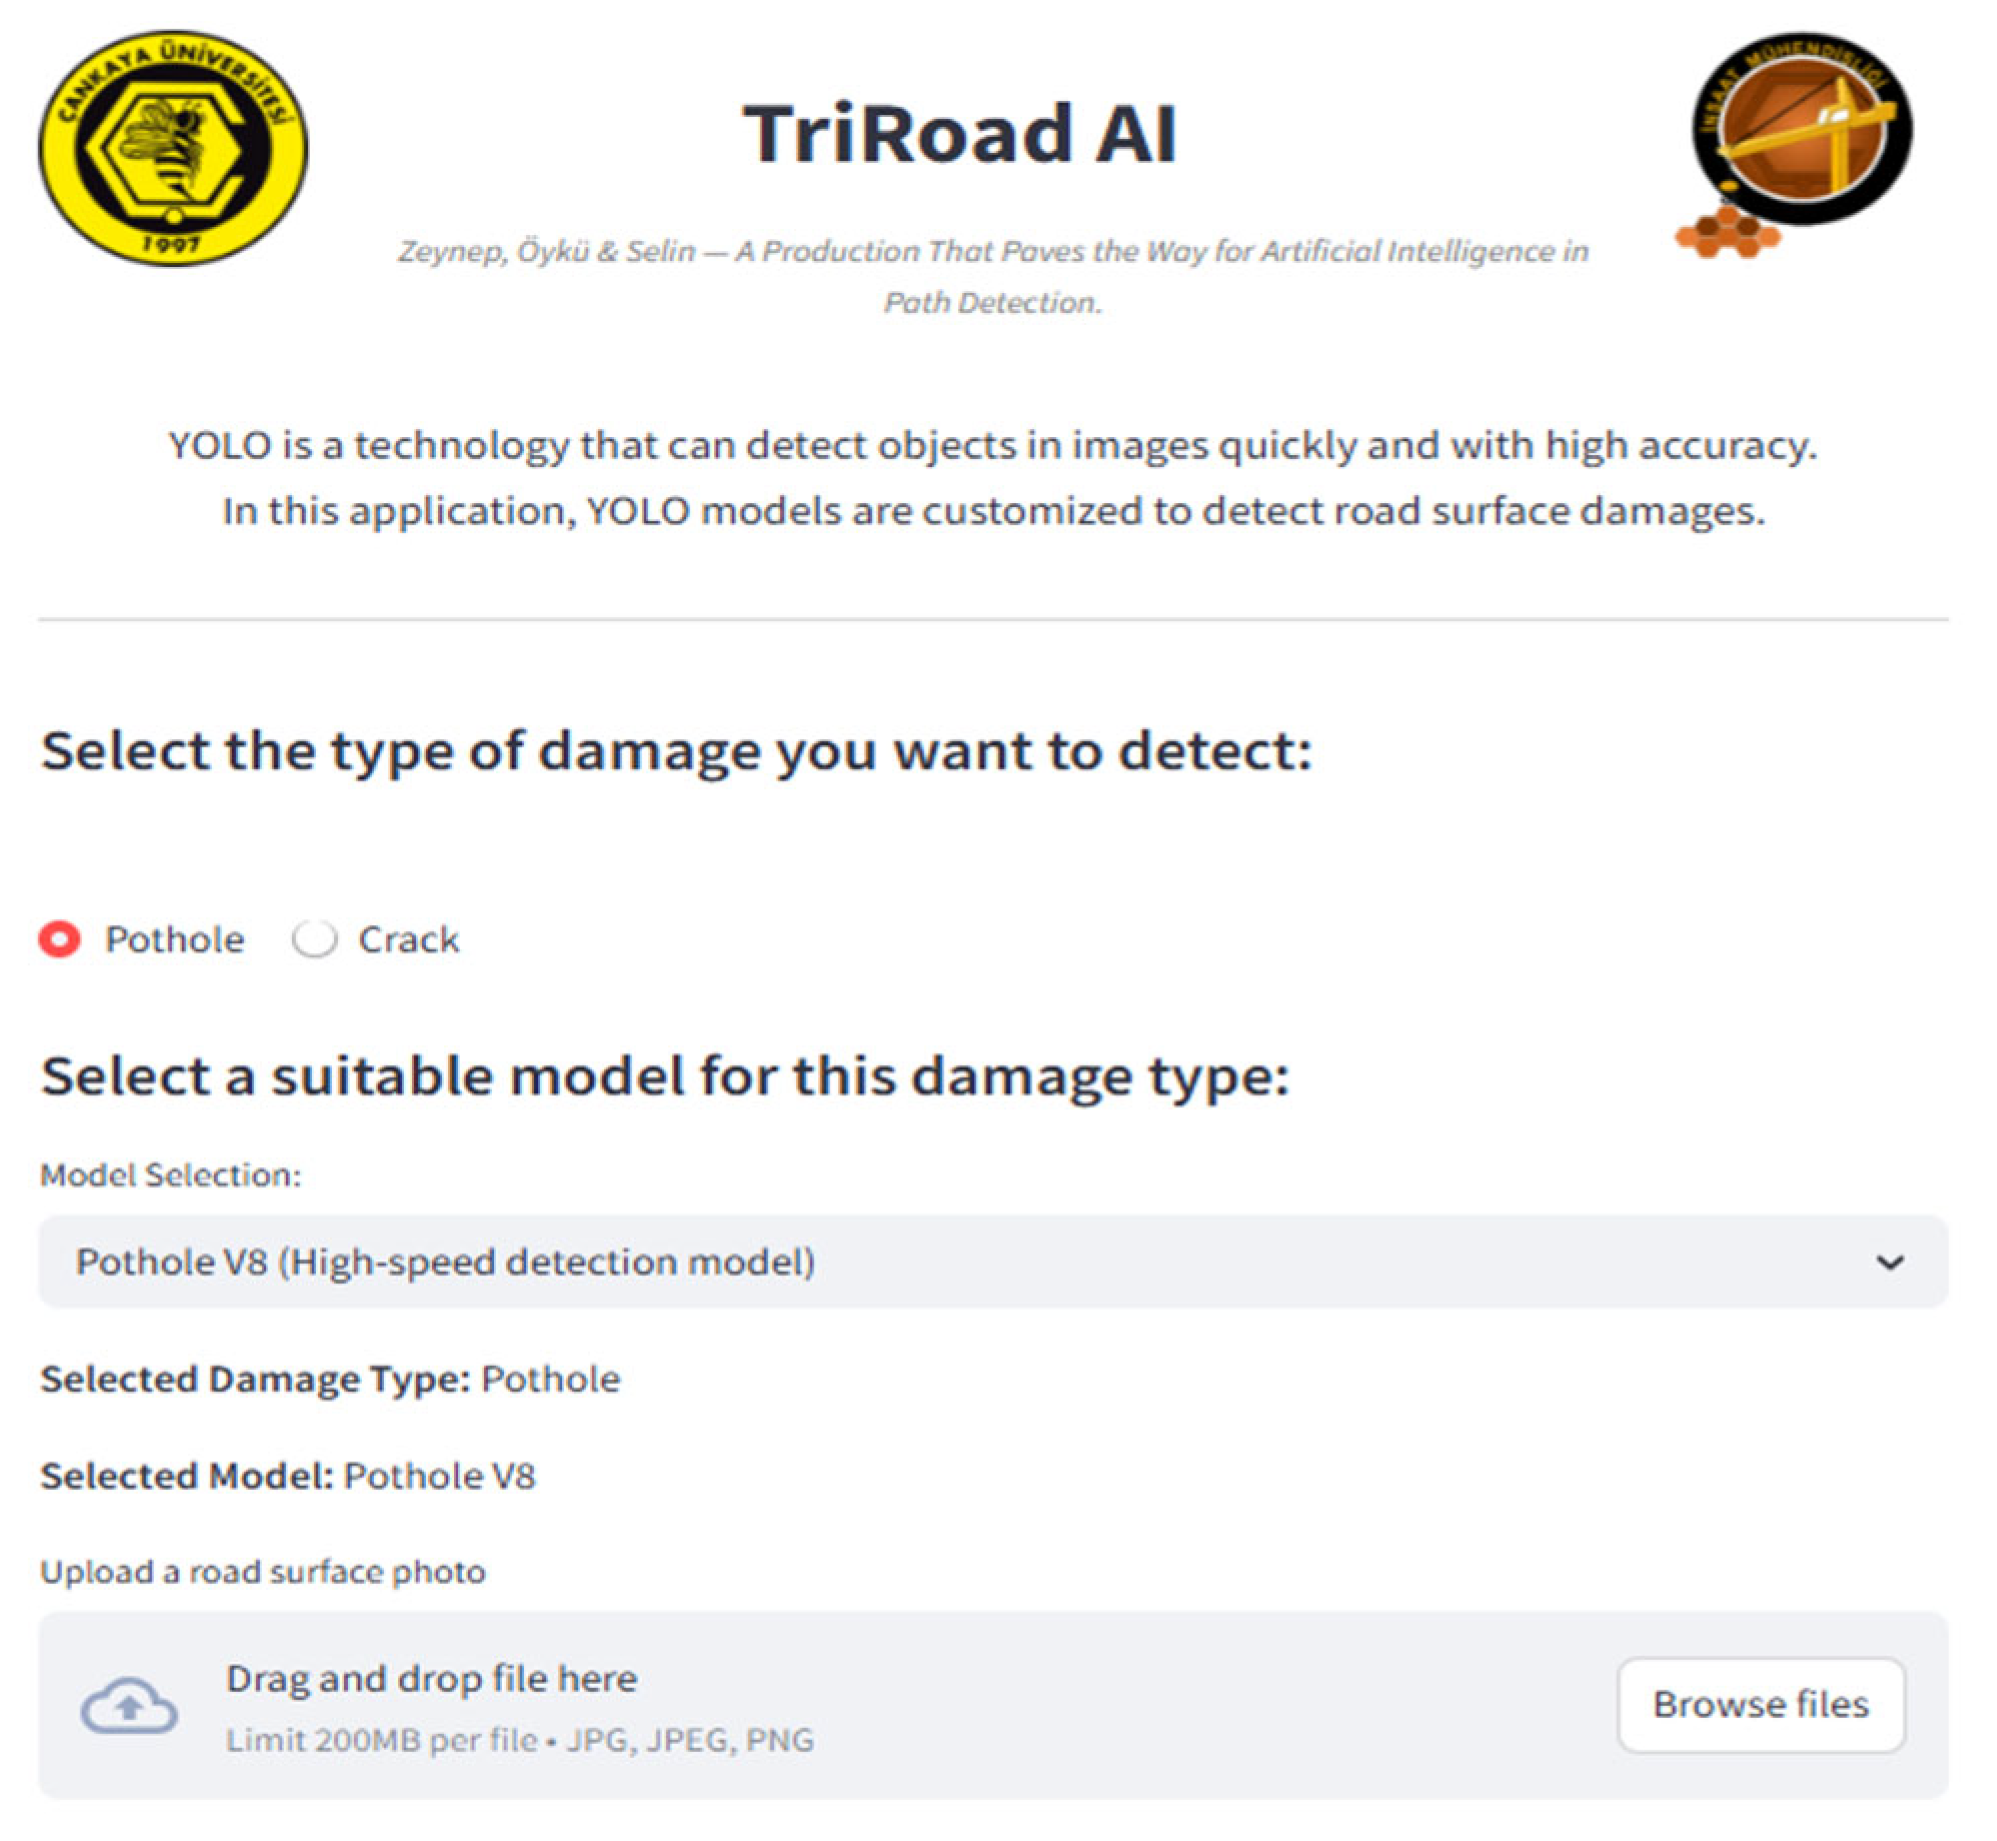
To facilitate real-time, user-friendly interaction with the deployed AI models, a custom web-based interface named TriRoad AI was developed. The goal was to create an accessible, intuitive platform that enables users, including municipal staff, civil engineers, and the public, to detect and classify road damage without needing specialized hardware, software, or programming knowledge.
3.4.1. Platform Design and Functionality
The interface was designed using modern web technologies to ensure responsive performance and cross-platform compatibility, as shown in Figure A1. Upon accessing the interface, users are prompted to upload a road image and select one of the pre-integrated models: YOLOv8, YOLOv11, or Gemini AI. Once the image is submitted, the system executes an inference routine and overlays detection results directly on the image, including the following:
- Bounding boxes identifying road defects;
- Class labels (e.g., pothole or crack);
- Confidence scores for each detection.
A confidence threshold slide allows users to fine-tune the sensitivity of detections nearly in real time. This interactive feature supports practical use cases where over- or under-detection may need to be balanced, such as in crowded urban environments or faded pavement conditions. The system typically processes uploaded images within 1–2 s, offering a responsive experience for static image analysis. While the current version is limited to image-based input, future iterations aim to incorporate live video stream processing for full real-time detection capabilities.
3.4.2. Geospatial Mapping and Export Features
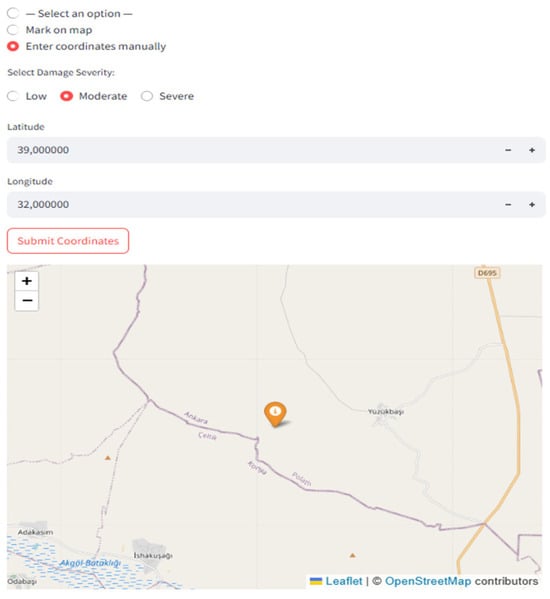
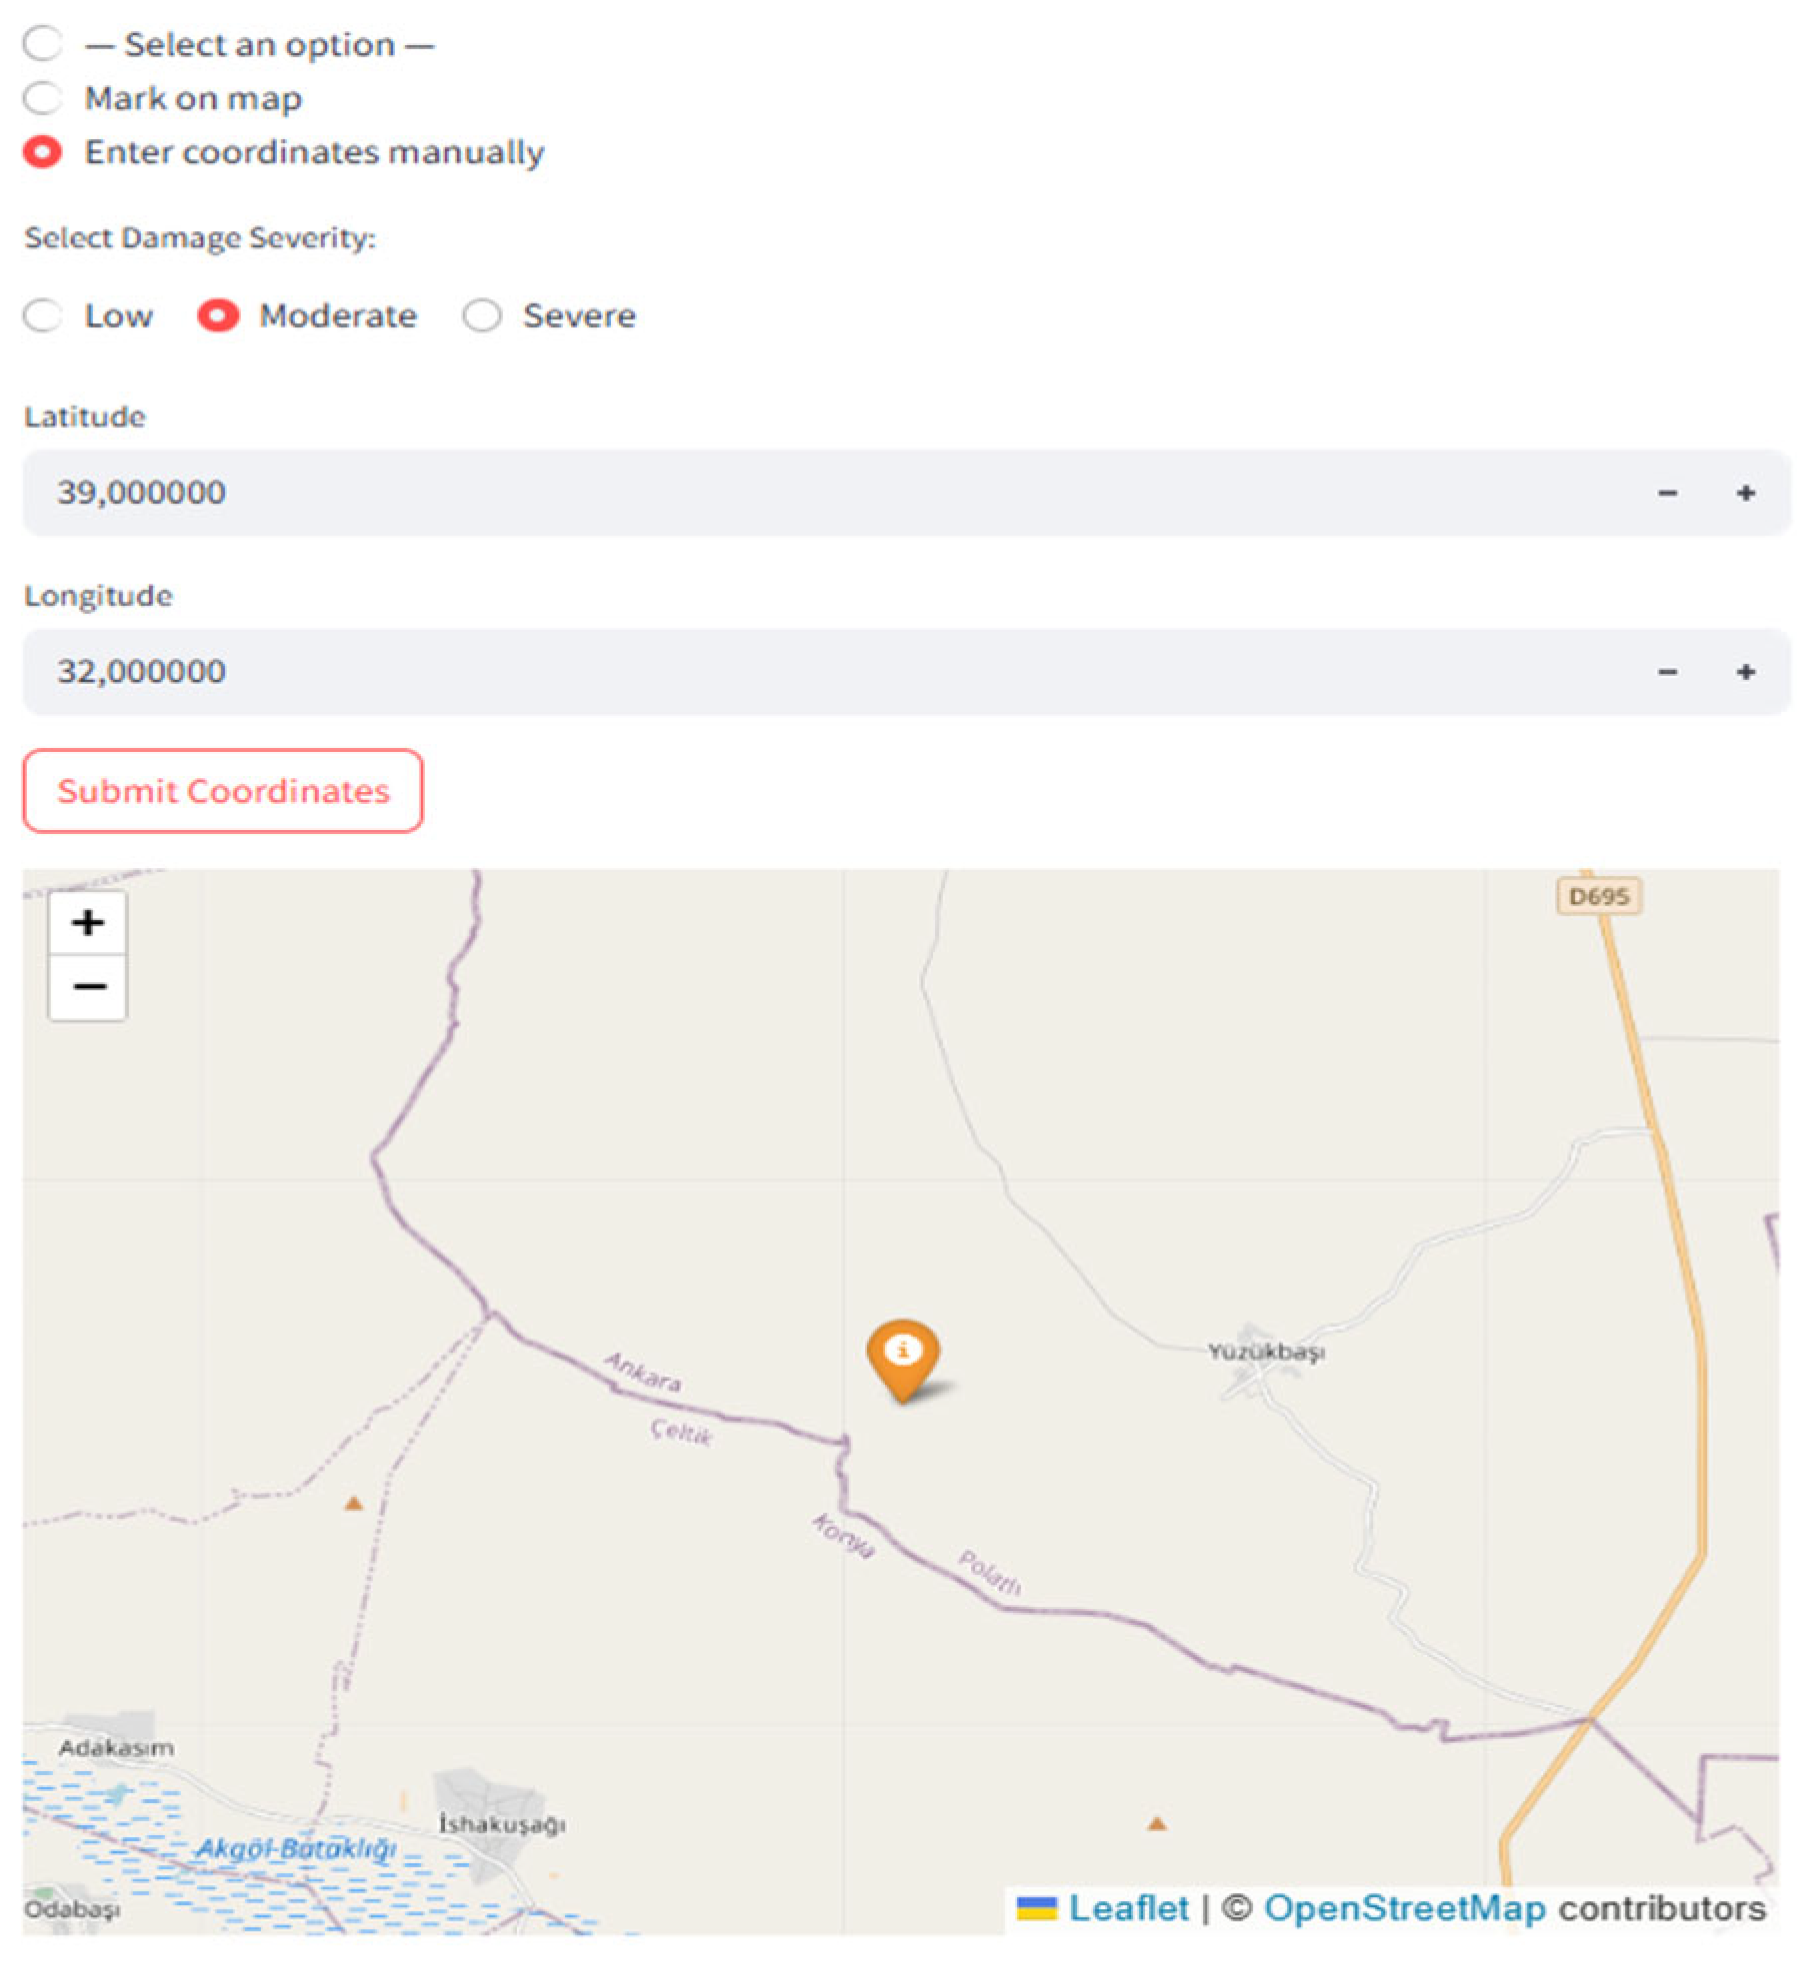
In addition to image-based feedback, the platform offers a geospatial integration feature using OpenStreetMap (OSM). Users can assign geographical coordinates (manually or automatically if GPS metadata is present) as shown in Figure 7 and Figure 8, enabling the visualization of road damage on an interactive map. Each damage point is color-coded based on severity level (e.g., green for low, yellow for moderate, and red for high), aiding in prioritization for road maintenance planning.
Figure 7.
Severity-based damage localization interface with manual coordinate entry and OpenStreetMap integration.
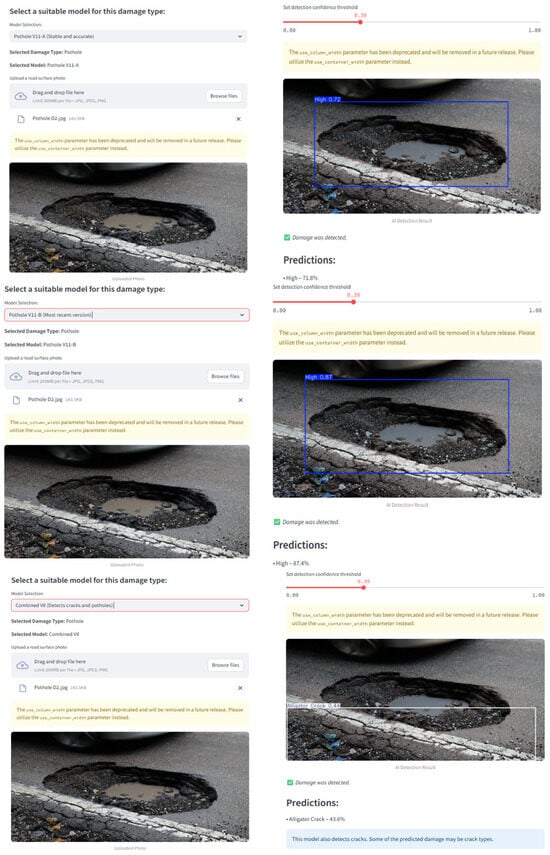
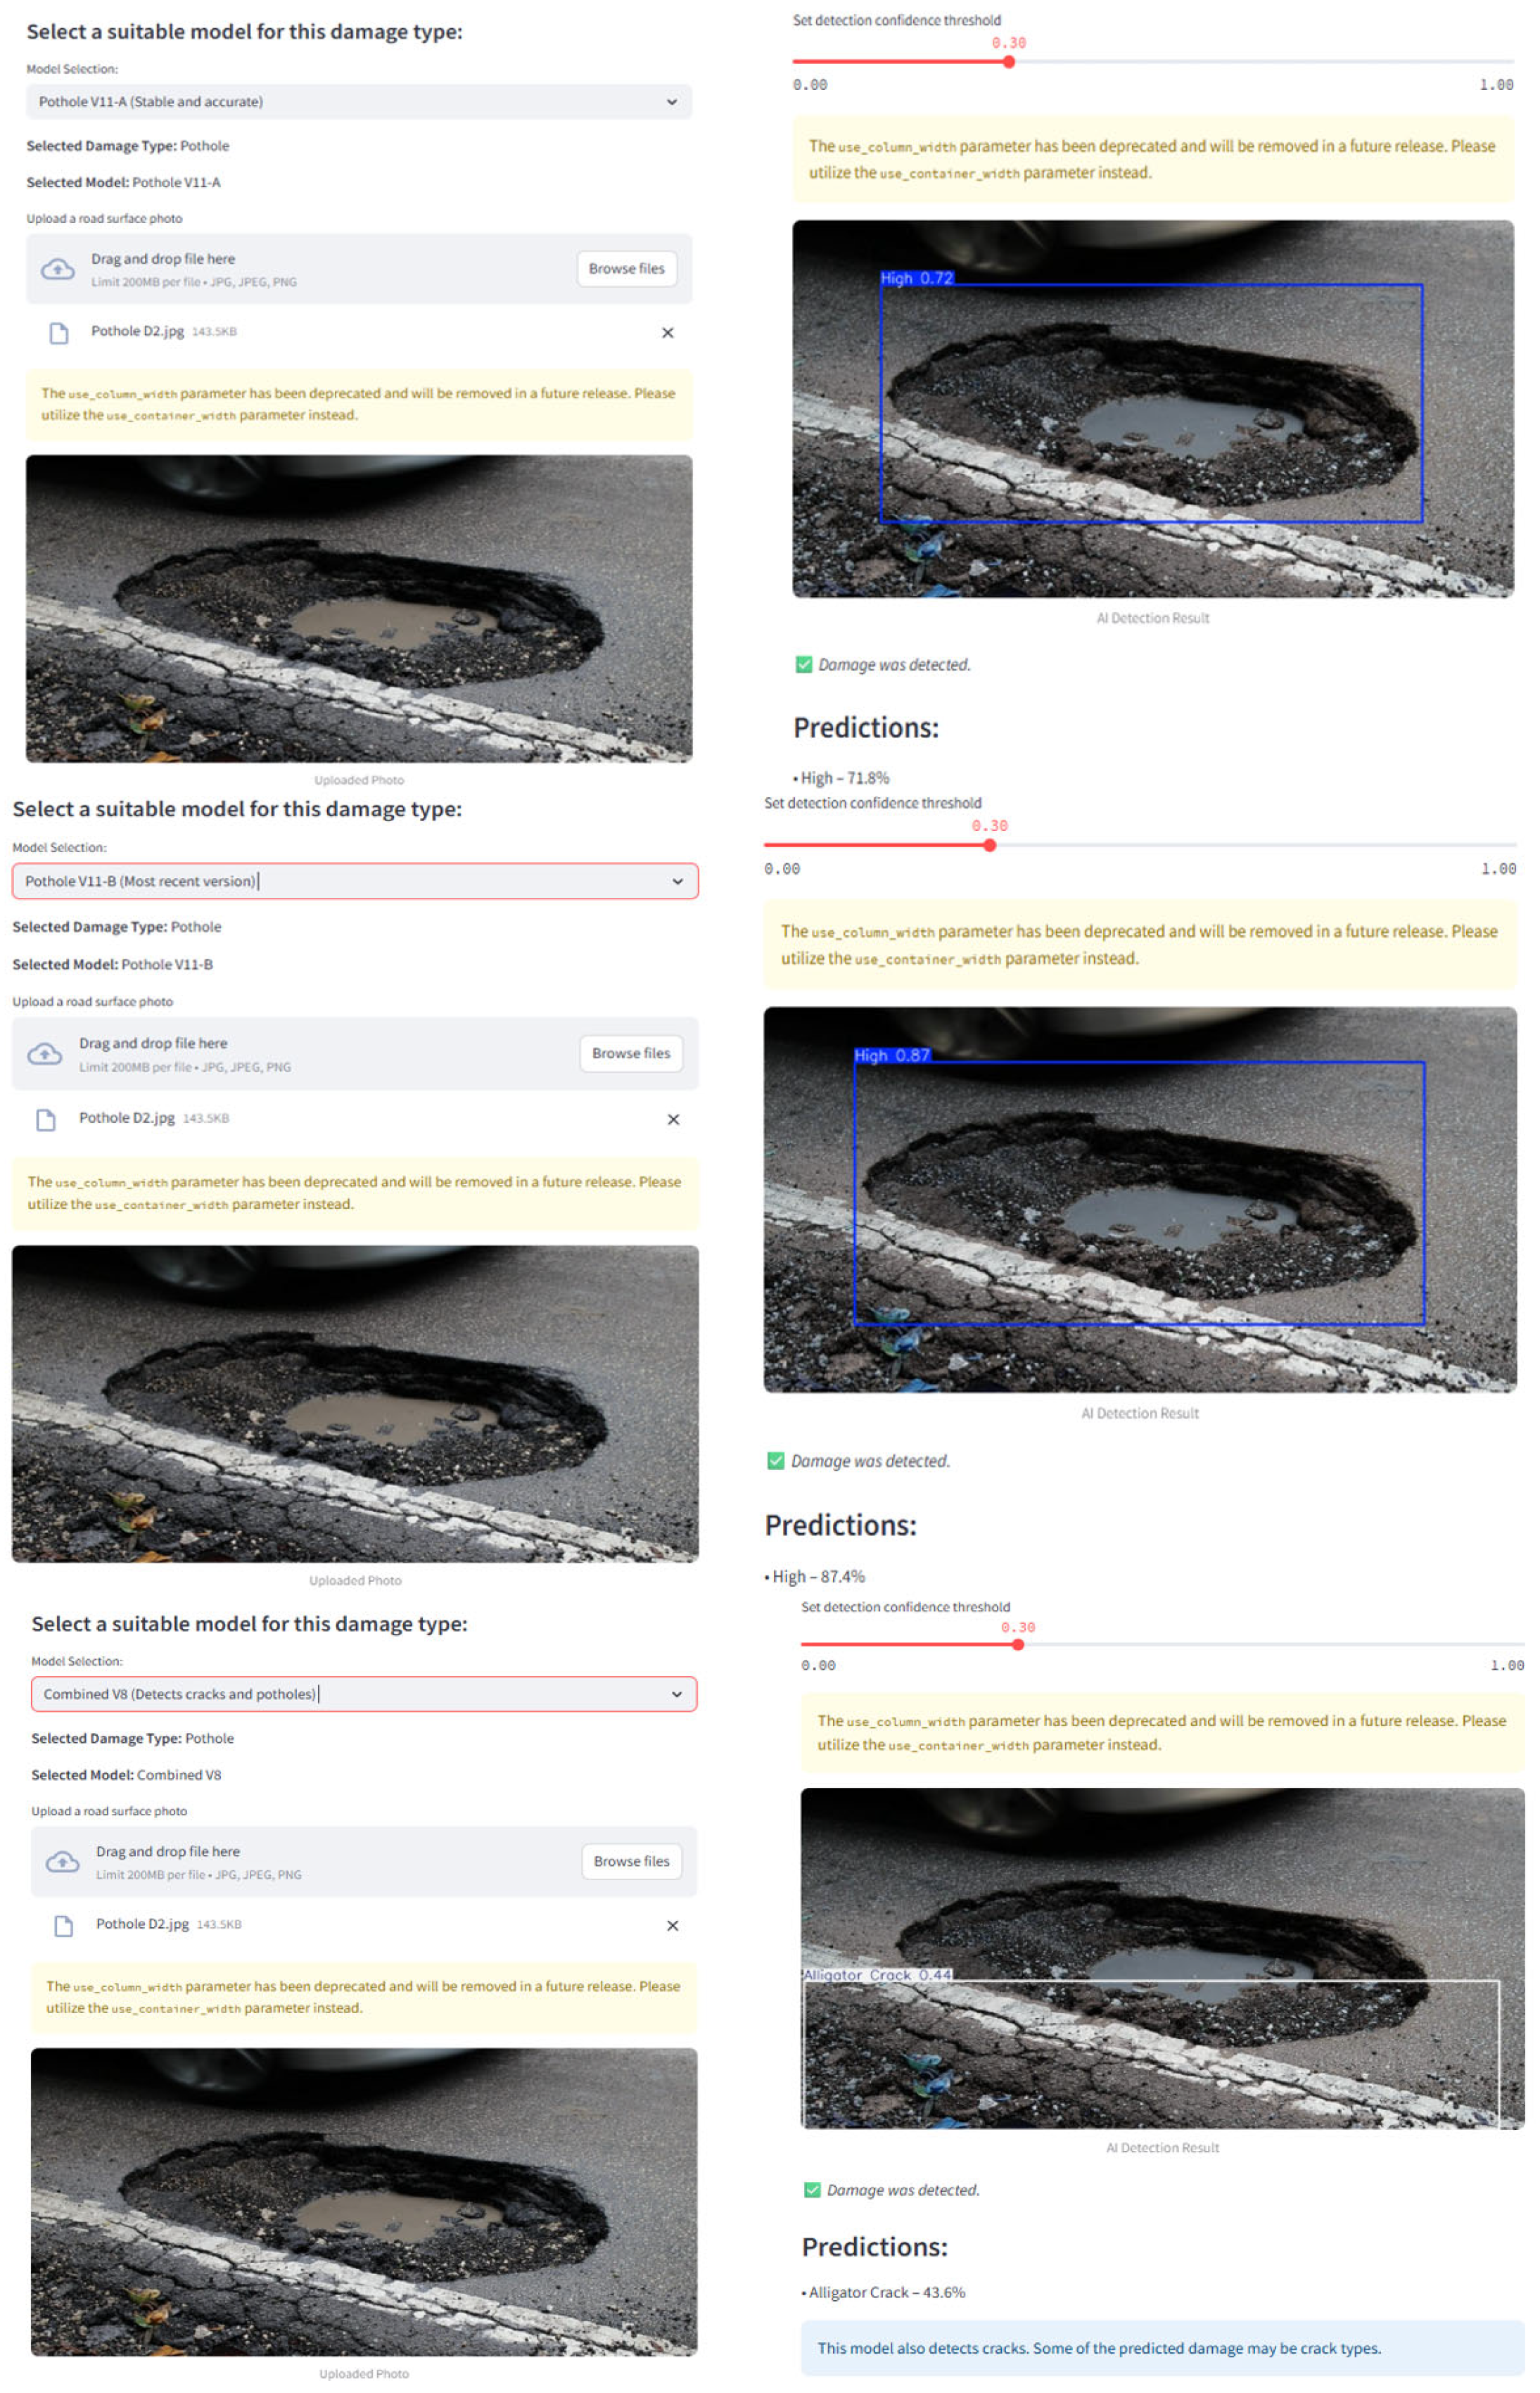
Figure 8.
TriRoad AI interface demonstration using three detection models: YOLOv11-A, YOLOv11-B, and Combined YOLOv8.
Users also have the option to download results, including the following:
- The annotated image;
- Detection metadata in. json or .csv format;
- A mapped report showing identified damage locations.
This interface bridges the gap between AI model outputs and practical infrastructure management by offering a fully functional, lightweight, and scalable tool for intelligent road monitoring.
3.5. Performance Evaluation Strategy
To assess the reliability and practical applicability of the proposed framework, a structured performance evaluation was conducted using two primary approaches: model-wise analysis and condition-based testing. The objective was to determine how effectively each AI model performed across different image sources and benchmark their comparative strengths and weaknesses.
The evaluation process began with users uploading sample images to the interface and selecting a suitable model for prediction (e.g., YOLOv8, YOLOv11, or Gemini AI). The system then executed inference operations, visualizing the detected road damage with bounding boxes, labels, and confidence scores. A confidence threshold slider enabled users to control the sensitivity of predictions dynamically (see Figure A1, Figure 7 and Figure 8).
Each model was evaluated based on detection accuracy, confidence levels, and robustness in handling image complexity. To clarify the evaluation process, detection scores were calculated as follows. All test images were manually verified to contain a damage type (pothole, crack, or both). Each model then predicted a class label and associated confidence score for each image. If the predicted class matched the manually verified ground truth, its confidence score was recorded as the detection score. Otherwise, the detection score was set to zero. The average detection score for each model was then computed using Equation (1):
where N is the total number of test images and Si is the detection score for image i (confidence if correct and zero if incorrect).
While Gemini AI achieved near-perfect classification results with controlled internet images, it struggled significantly with field data, achieving only 62.06% accuracy. In contrast, YOLOv8 delivered consistent performance across both data types, with an average accuracy of 88.43% for clean images and notably better robustness than Gemini AI under field conditions.
Model integration types, output formats, and use-case fit were compared systematically. A summary of this comparison is presented in Table 3, showing that only YOLO-based models (v8 and v11) were seamlessly integrated into the web interface, being capable of producing bounding boxes, class labels, and confidence scores in real time. Gemini AI, while useful for classification, lacked spatial prediction features and real-time integration.
3.6. Severity Classification and Mapping
To enhance the practical utility of the road damage detection system for infrastructure planning and maintenance prioritization, a post-detection module was integrated to classify damage severity and visualize the results spatially. This feature transforms raw AI output into actionable insights for urban planners, maintenance teams, and transportation authorities.
3.6.1. Severity Classification
Following the object detection stage, each identified damage instance—whether a pothole, crack, or combined form—is quantitatively assessed and classified into one of three severity levels based on established thresholds from standard references [64]:
- Low Severity: Minor, shallow cracks or small potholes with low structural risk.
- Moderate Severity: Damage with moderate depth or size and a visible surface impact but not immediately hazardous.
- High Severity: Deep, wide, or extensive damage posing safety threats requiring urgent intervention.
Field measurements of crack widths, patterns, and pothole depths were manually collected for classification. Crack severity was assessed based on width, edge deterioration, and pattern structure, as shown in Table 4. Pothole severity classification was determined using depth measurements, as shown in Table 5. These measurements ensured accurate categorization of damage types for analysis and model evaluation. The systematic field data collection process supported the development of a reliable benchmark for testing detection models under realistic road conditions.
Table 4.
Crack types and severity levels [64].
Table 5.
Pothole severity classification [64].
Detailed field measurements for potholes, cracks, and combined damage were collected, and they are summarized in Table 6, Table 7, and Table 8, respectively, providing a clear reference for analysis and validation.
Table 6.
Field measurements for potholes.
Table 7.
Field measurements for cracks.
Table 8.
Field measurements for combined pothole and crack damage.
3.6.2. Geospatial Mapping Using OpenStreetMap
Each detected and classified damage instance is tagged with geographic coordinates, either extracted from image metadata (EXIF GPS tags) or manually entered by the user. These coordinates are used to dynamically place markers on an interactive OpenStreetMap (OSM) layer embedded within the system’s web interface.
The markers have the following characteristics:
- Color-coded by severity (e.g., green = low, yellow = moderate, and red = high);
- Labeled with the damage type and confidence score;
- Clickable, showing image thumbnails and model detection details.
This mapping functionality allows users to visualize the spatial distribution of road damage across neighborhoods, identify hotspots, and generate data-driven maintenance reports. The export feature enables downloading mapped results in formats suitable for integration into municipal GIS systems or transportation management platforms.
4. Results and Discussion
This section presents the performance outcomes of various models tested under different data conditions, including field images and online datasets. The results are categorized based on dataset type and damage composition (potholes, cracks, and mixed), followed by comparative insights and AI-based testing outcomes.
4.1. Detection Performance on Field Pothole Images
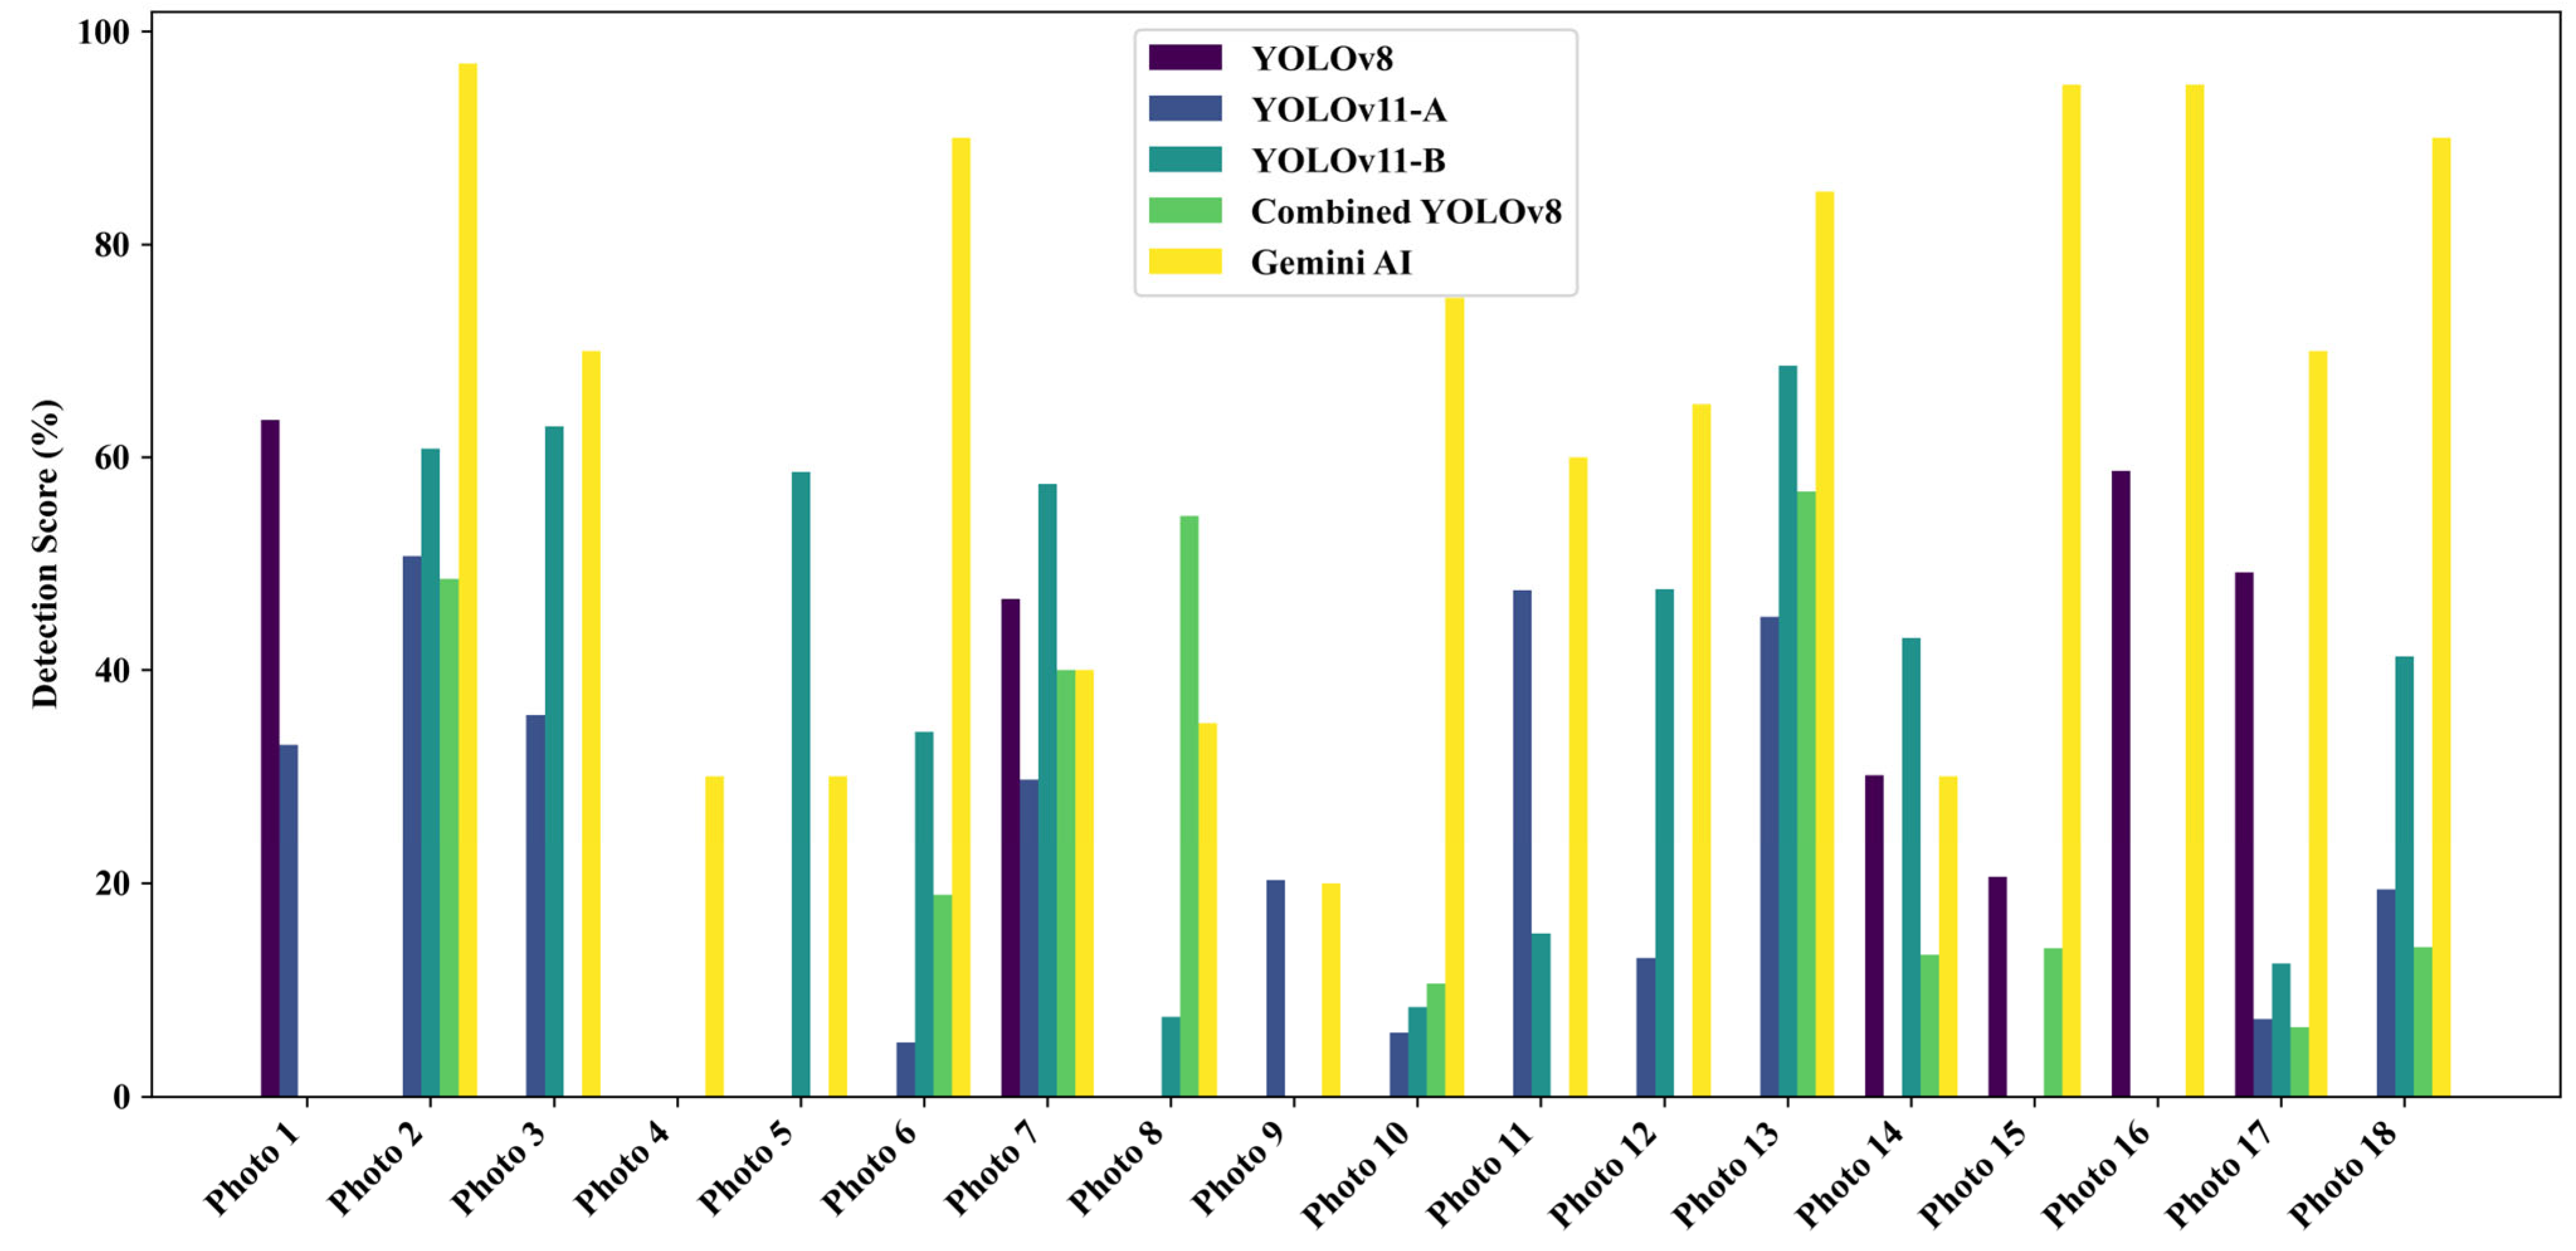
A total of 18 field-captured pothole images from Ankara were analyzed to evaluate the detection performance of five models: four YOLO-based architectures (YOLOv8, YOLOv11-A, YOLOv11-B, and Combined YOLOv8) and Gemini AI. The individual detection scores across the 18 images are presented in Figure 9, while the mean detection accuracy for each model is summarized in Figure 10.
Figure 9.
Detection scores by model for field-captured pothole images.
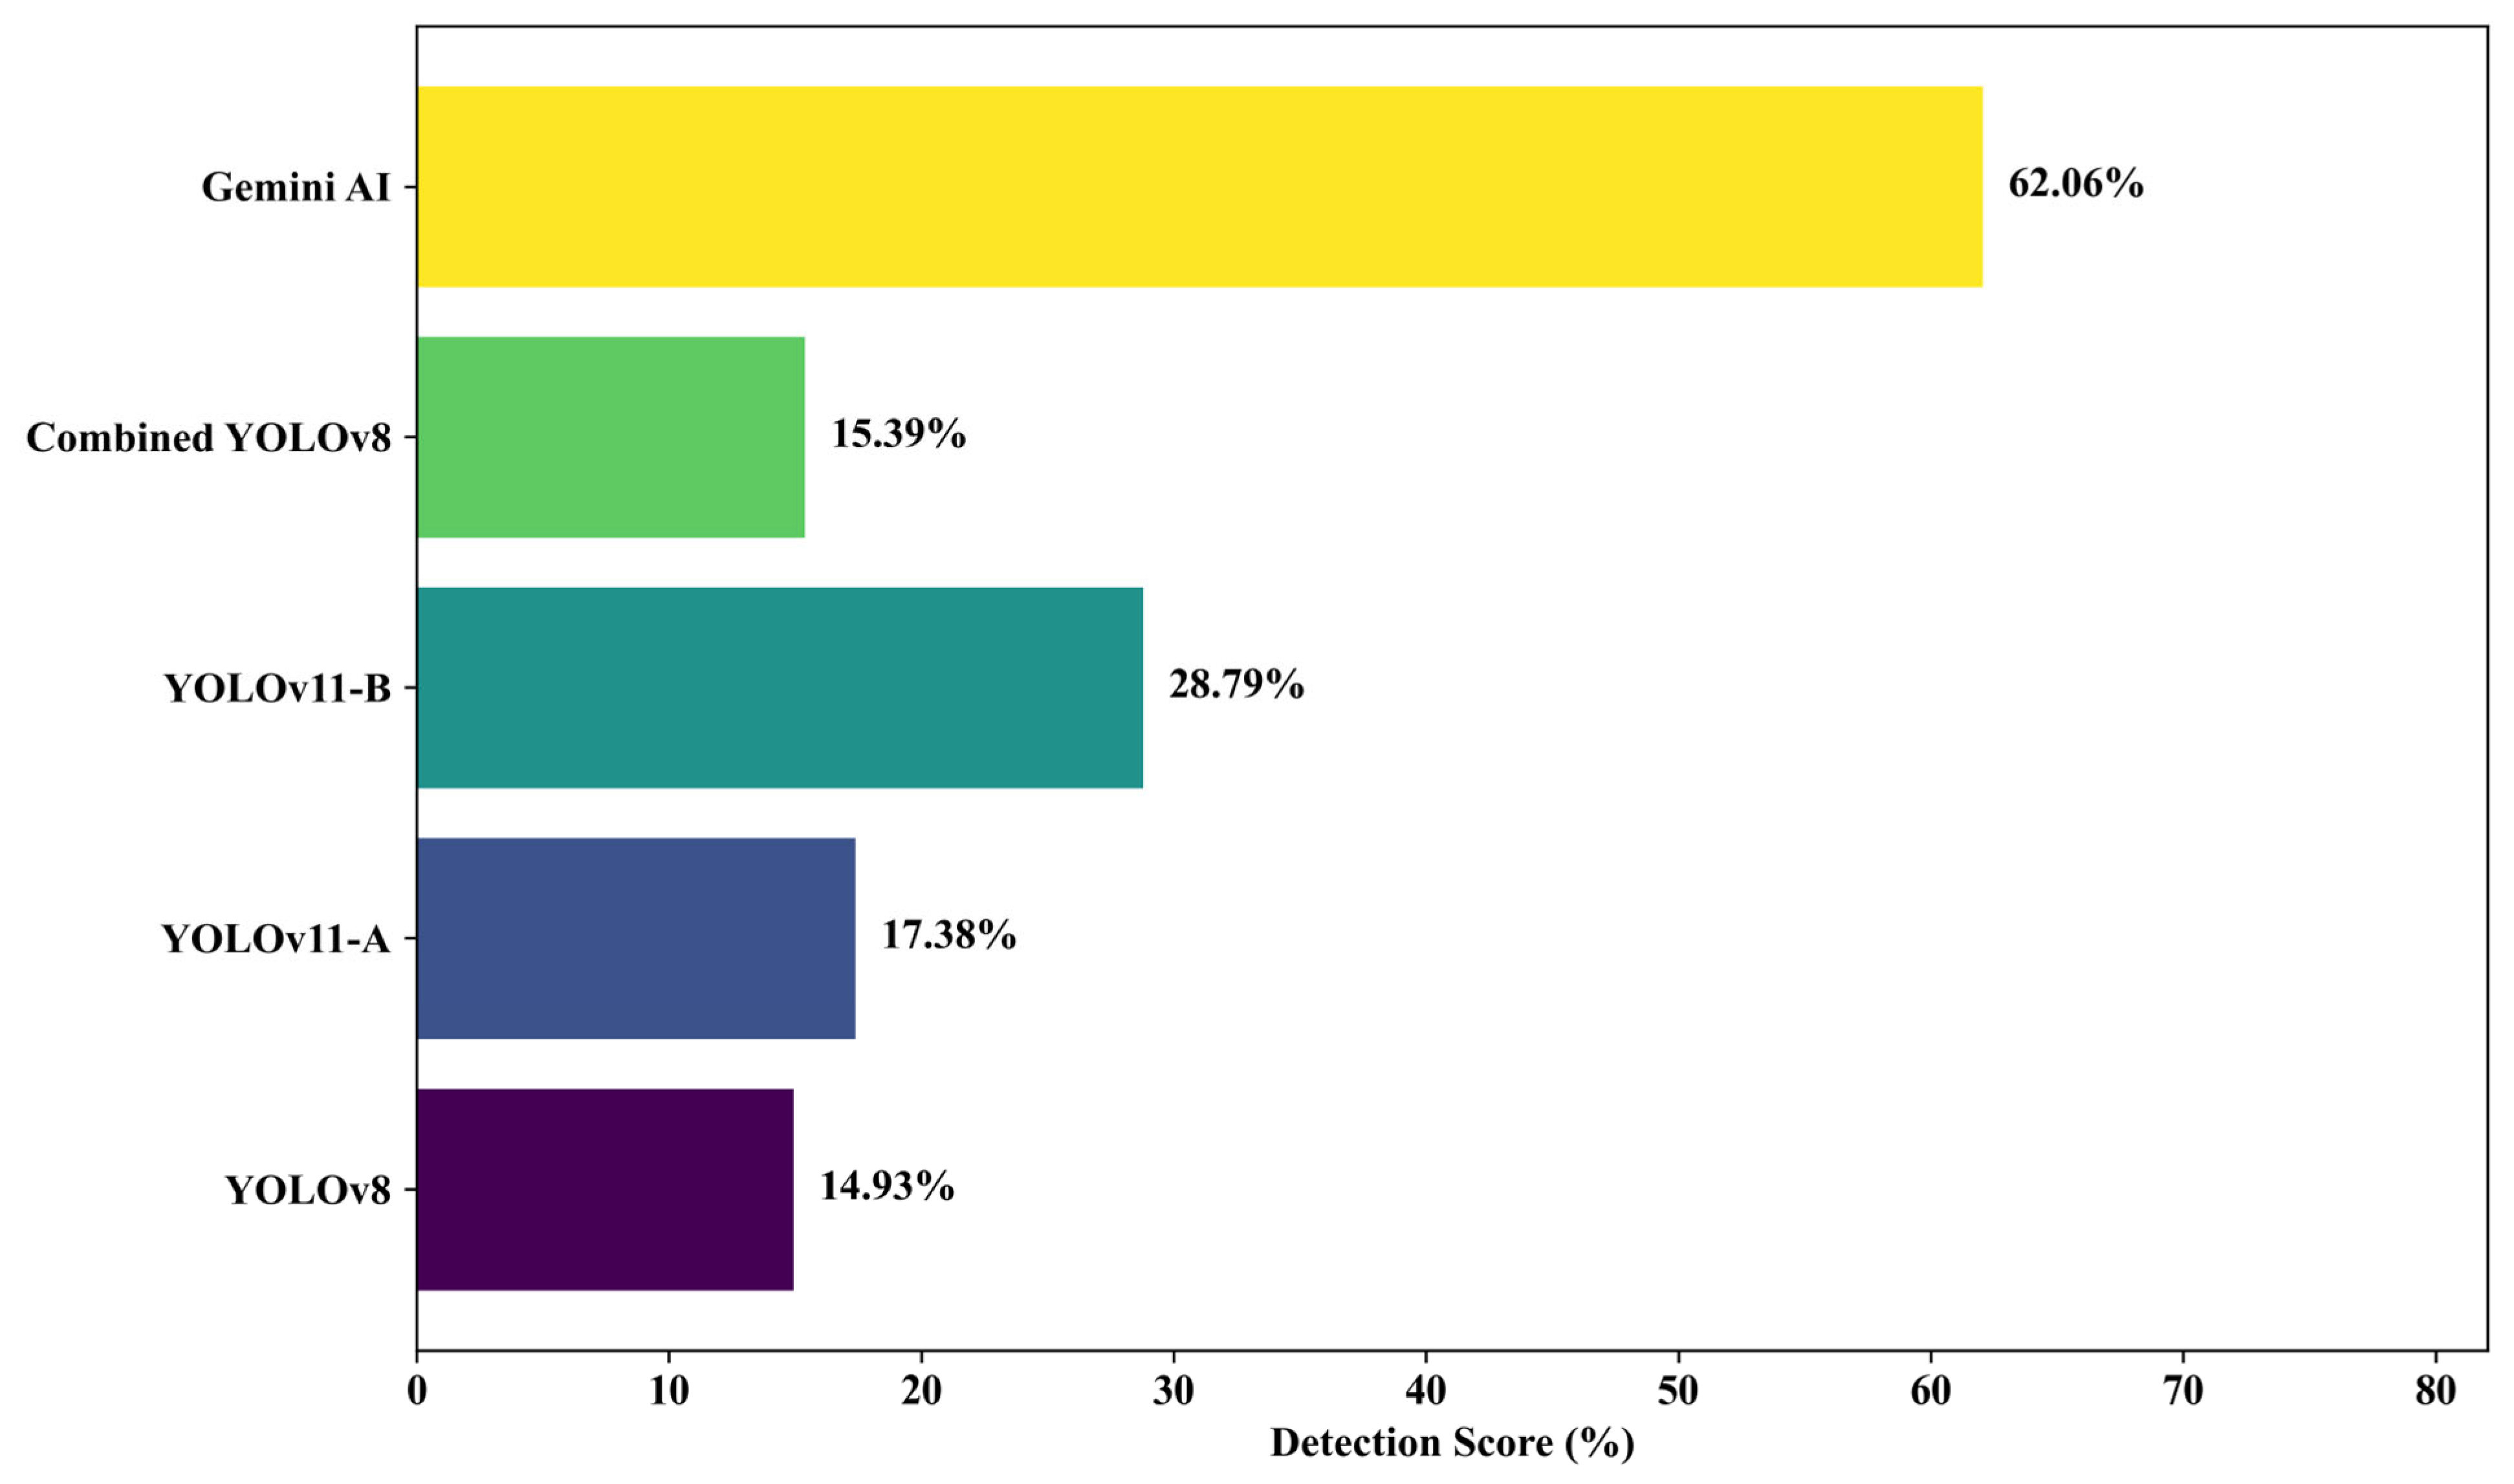
Figure 10.
Average detection accuracy for pothole images collected from the field.
Among the tested models, Gemini AI recorded the highest average detection score of 62.06%, substantially outperforming all YOLO-based models. YOLOv11-B followed with an average score of 28.79%, while YOLOv11-A achieved 17.38%. Combined YOLO v8 and YOLOv8 recorded lower averages of 15.39% and 14.93%, respectively. Notably, YOLOv11-B demonstrated a 92.8% improvement in mean detection accuracy over the baseline YOLOv8, reinforcing the impact of its architectural refinements—such as advanced feature enhancement modules—on detection robustness in complex environments.
Visual inspection of Figure 9 reveals that Gemini AI achieved near-perfect scores for select images (e.g., 97% for Photo 2) but suffered sharp declines in less favorable scenarios (e.g., 0% for Photo 1). In contrast, YOLOv11-B exhibited greater resilience, maintaining consistent moderate-to-high scores across challenging conditions, such as occlusion, shadowing, and low contrast (e.g., Photo 3 and Photo 13). YOLOv11-A, while showing moderate stability, underperformed in severely degraded contexts (e.g., Photo 6 and Photo 10). Combined YOLOv8 and YOLOv8, although occasionally achieving competitive scores, displayed high variability and lower reliability overall.
These results are consistent with the findings of Li et al. [65], who enhanced YOLOv8 with attention and convolutional modules to improve its performance in detecting diverse road damages under varying conditions. Similarly, Zhong et al. [66] emphasized the importance of robust feature extraction by integrating YOLOv8 with point cloud data, thereby enhancing detection accuracy in complex field environments. The relative success of YOLOv11-B in this study reinforces its potential for practical deployment in urban roadway inspection, where lighting conditions and pavement textures often vary unpredictably.
Interestingly, Gemini AI often exhibited high individual image scores (e.g., up to 97% for Photo 2). However, its overall consistency faltered in less ideal settings (e.g., Photo 1, where the detection was 0%), confirming its limitation in generalizing to field use and noisy images, an issue not uncommon in generalized AI models lacking domain-specific fine-tuning.
In summary, while Gemini AI offers superior accuracy under ideal conditions, its limited robustness in practical deployment settings reduces its standalone applicability. YOLOv11-B emerged as the most balanced and reliable model, offering high detection accuracy with improved consistency across diverse field conditions, thereby making it a strong candidate for real-time deployment in urban road maintenance applications.
4.2. Detection Performance for Internet-Sourced Pothole Images
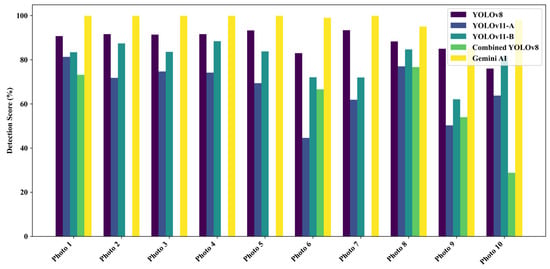
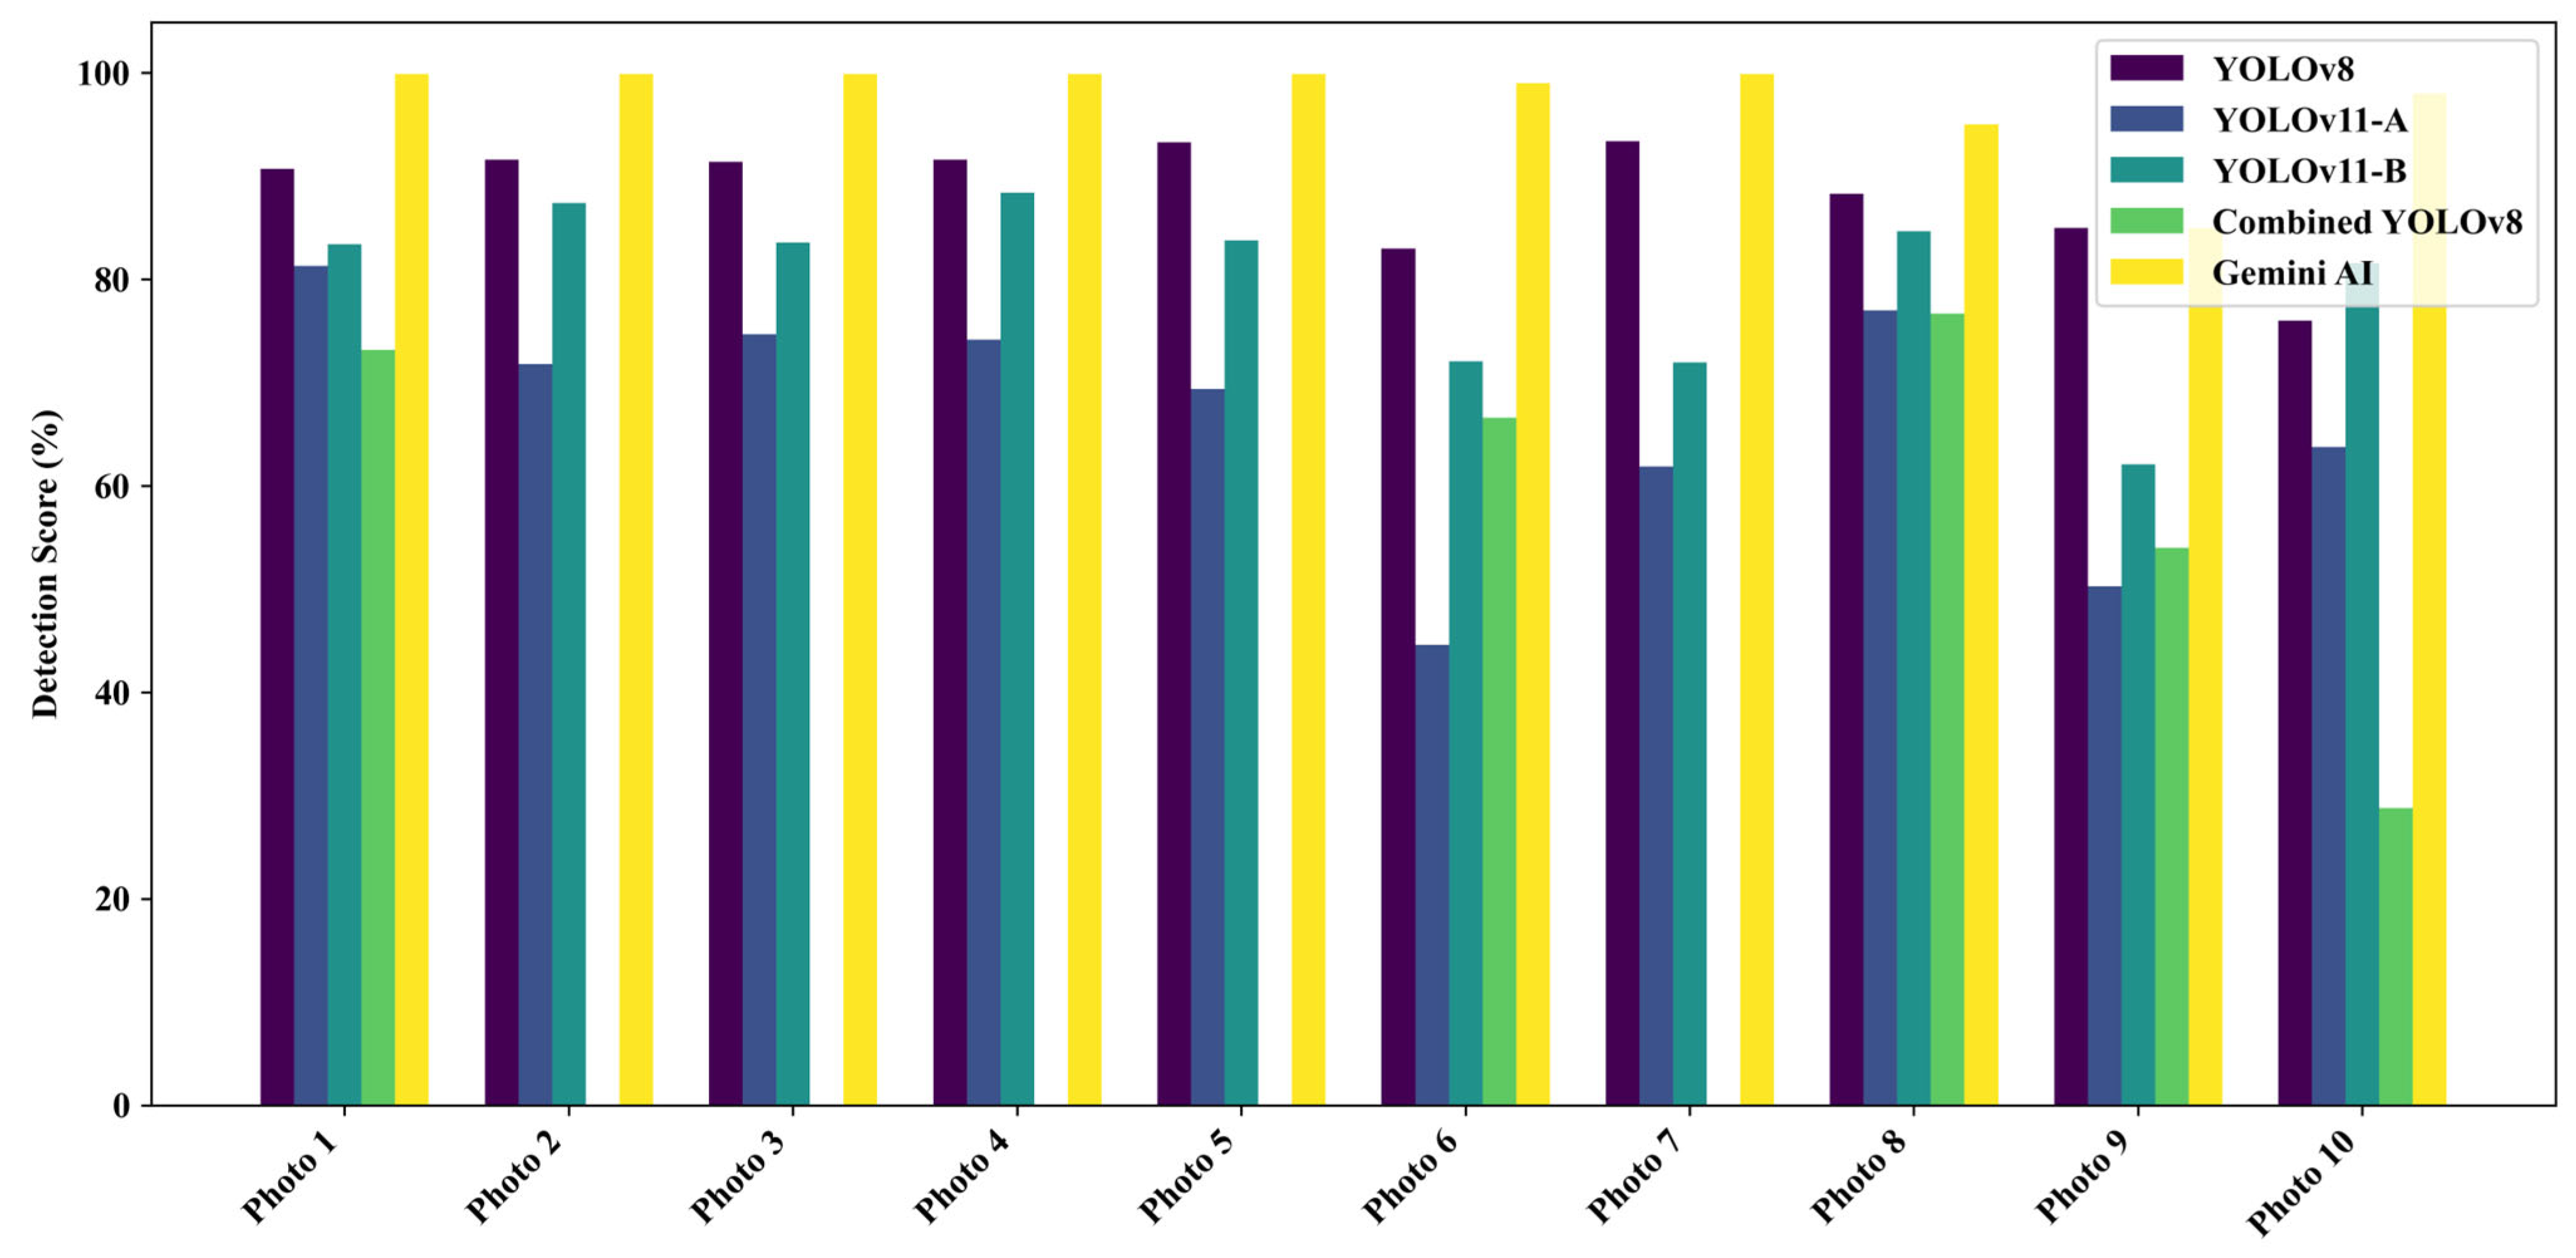
Ten high-resolution pothole images sourced from publicly available datasets were evaluated using five detection models. The detection scores per image are shown in Figure 11, and the average detection performance across all models is summarized in Figure 12.
Figure 11.
Detection scores by model for internet-sourced trial photos.
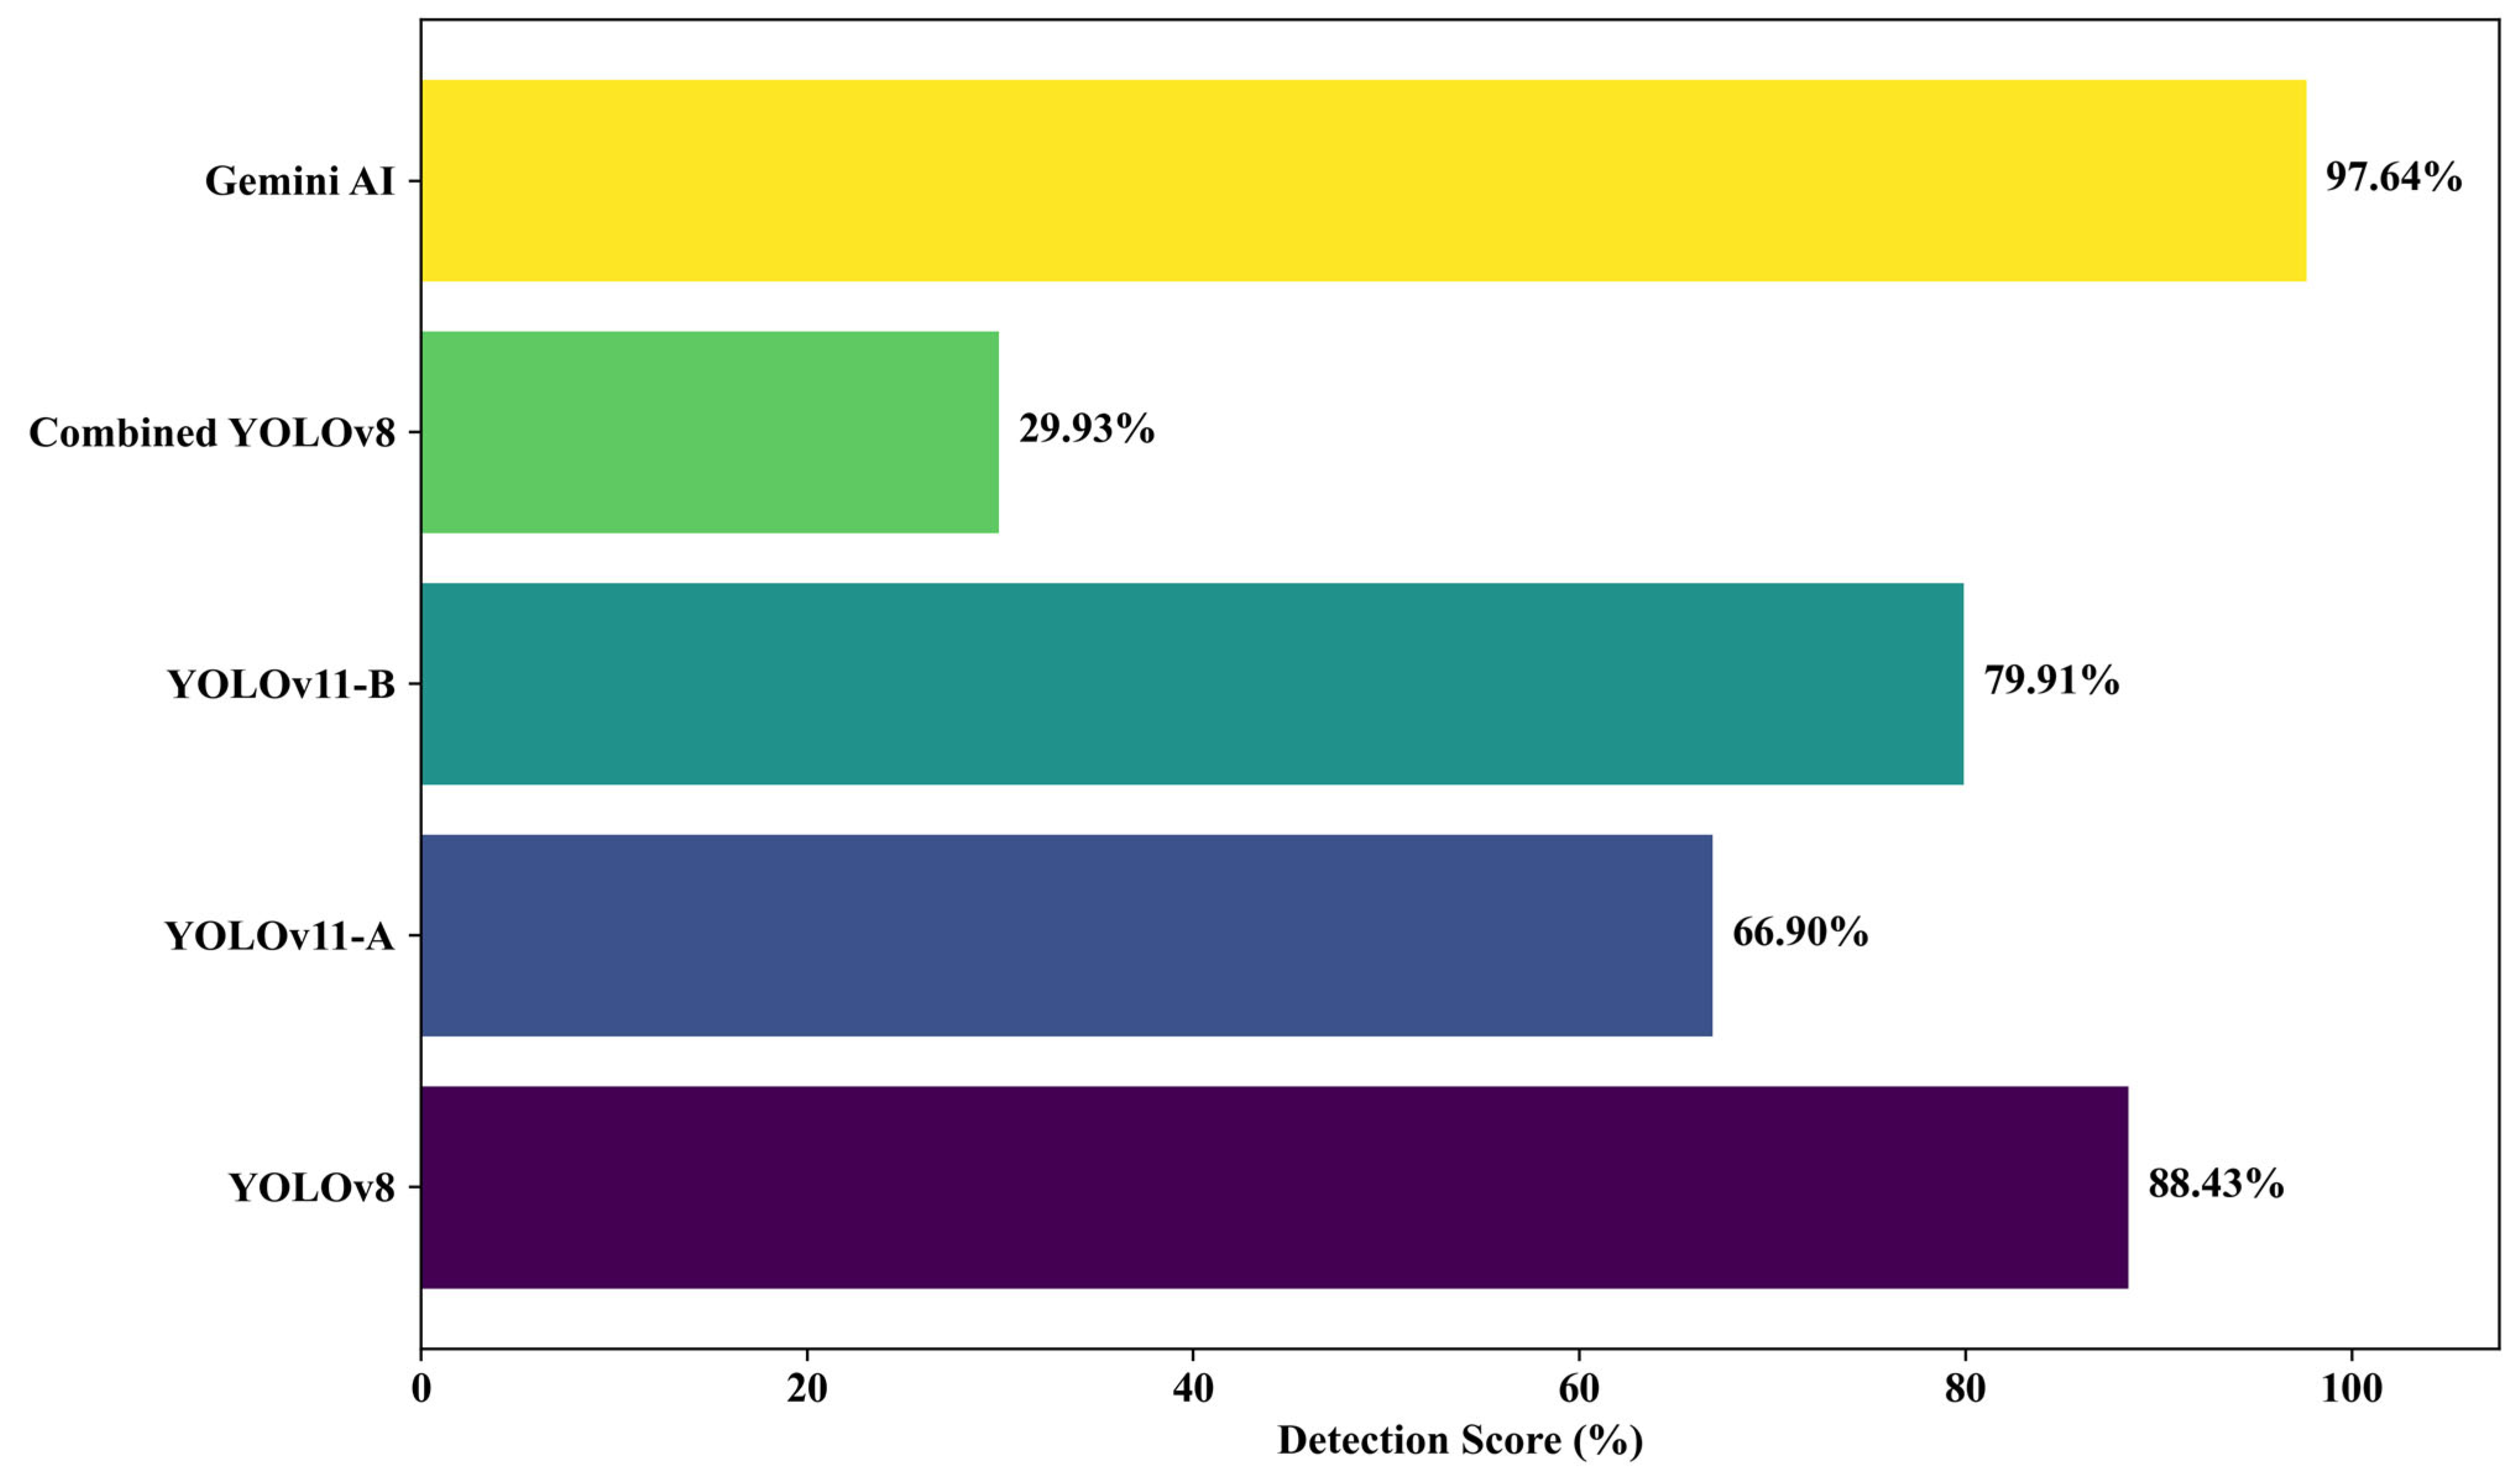
Figure 12.
Average detection accuracy for internet-sourced trial photos.
The results clearly indicate that Gemini AI outperformed all models, achieving a near-perfect average detection score of 97.64%, followed by YOLOv8 at 88.43% and YOLOv11-B at 79.91%. The performance of YOLOv11-A was lower at 66.90%, while the Combined YOLOv8 model lagged significantly, with a mean accuracy of just 29.93%. Gemini AI consistently scored above 99% in most of the test images, with only a minor drop in one image (Photo 9: 85%), demonstrating its strong reliability under ideal conditions.
The superior performance of Gemini AI can be attributed to the controlled nature of the dataset, which featured well-lit, high-contrast images with clear background separation. This aligns with the Gemini AI architecture, which is optimized for object classification in clean, structured environments. In contrast, YOLO models, although trained for real-time detection, exhibit slight reductions in accuracy due to their simultaneous localization and classification demands.
YOLOv8’s strong average score of 88.43% reinforces its reputation as an efficient, anchor-free detection model capable of maintaining both speed and accuracy. YOLOv11-B, which incorporates refined feature layers and attention modules, further closed the performance gap with Gemini AI, outperforming YOLOv11-A by 13.01 percentage points, suggesting better feature generalization.
The observations are consistent with existing surveys. For example, Zeng and Zhong [67] presented YOLOv8-PD, an improved YOLOv8n model based on attention mechanisms and light modules, which provides enhanced detection precision and reliability when applied to fine-quality road damage datasets. Similarly, Yurdakul and Tasdemir [68] proposed an enhanced YOLOv8 model utilizing RGB-D data, which demonstrated superior performance in detecting and measuring potholes with high precision and recall.
Overall, Gemini AI has superior detection precision when dealing with carefully controlled datasets, while YOLOv8 and YOLOv11-B strike a balance between performance and field adaptability that is generally preferred for deployment in changing urban conditions.
4.3. Detection Performance for Field Mixed-Damage Images
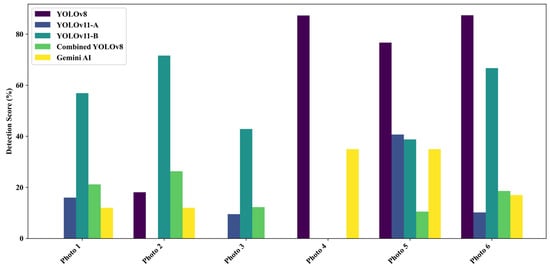
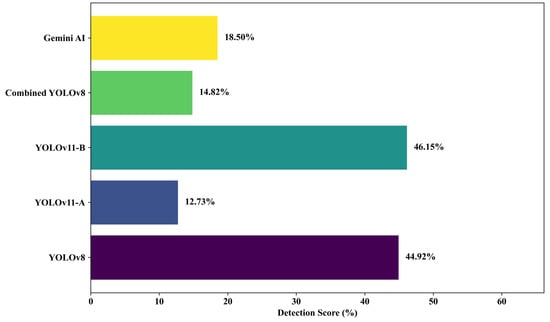
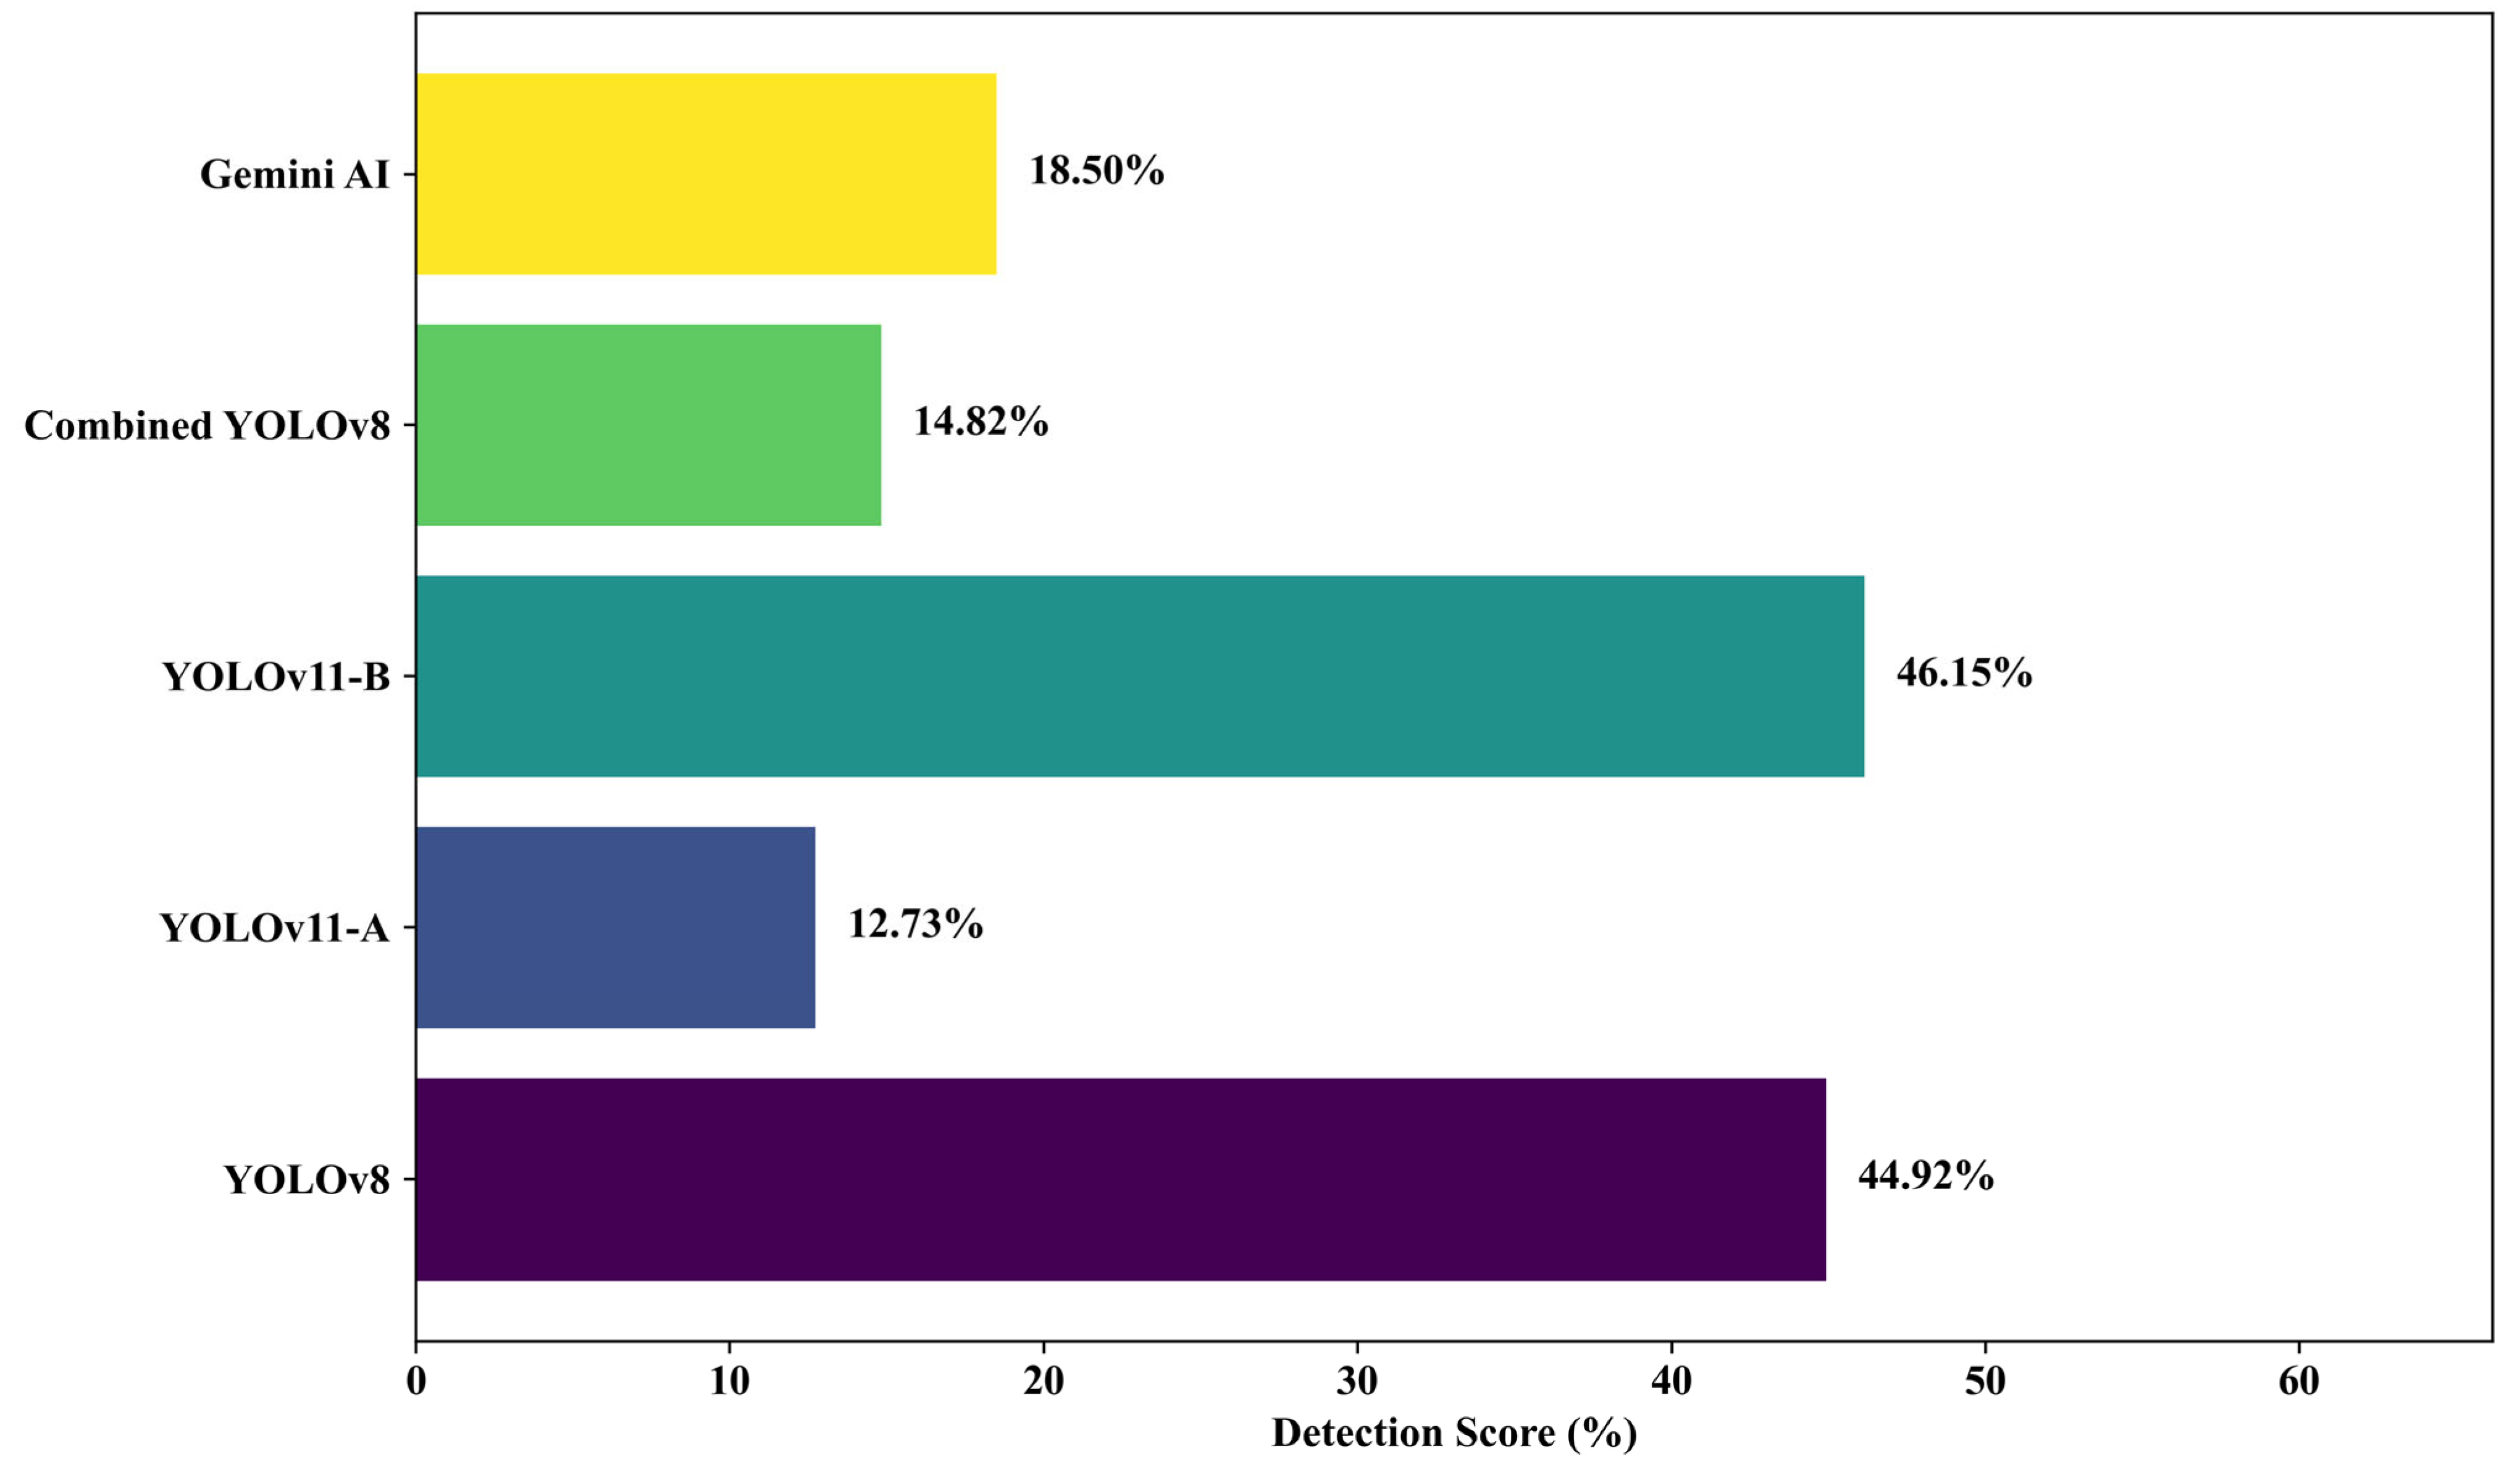
To evaluate model robustness in complex field conditions, six field images containing both cracks and potholes were tested. YOLOv11-B achieved the highest average detection rate (46.15%), followed by YOLOv8 (44.92%). Gemini AI’s accuracy dropped significantly to 18.50%, highlighting its limitations in detecting overlapping defects. YOLOv11-A and Combined YOLOv8 also underperformed in these scenarios, with averages of 12.73% and 14.82%, respectively (see Figure 13 and Figure 14).
Figure 13.
Detection scores for field potholes and crack images.
Figure 14.
Average model performance for field-collected pothole and crack images.
The superior results of YOLOv11-B and YOLOv8 suggest enhanced feature extraction, which is particularly valuable in complex visual environments. Recent advancements, such as attention-based enhancements to YOLOv8 and lightweight YOLOv9 variants [69,70], reinforce the effectiveness of incorporating attention mechanisms for improved detection in field applications.
To ensure a fair comparison despite architectural differences, Gemini AI was evaluated using the same dataset and detection prompts as the embedded YOLO models. While YOLOv8 and YOLOv11 were directly integrated into the web interface for seamless inference and bounding box output, Gemini AI operated through a prompt-based interface and required manual output extraction. Performance metrics, including accuracy and robustness under mixed-damage conditions, were uniformly applied to all models. However, we acknowledge that differences in integration and interaction modes—particularly the lack of bounding box precision and real-time feedback in Gemini AI—may affect direct comparability. These differences are further discussed in the limitations section.
Conversely, Gemini AI’s diminished performance for this subset further highlights the limitations of general-purpose AI models applied to intricate, domain-specific tasks that are not specifically trained or fine-tuned.
4.4. Detection Performance on Real Crack Images
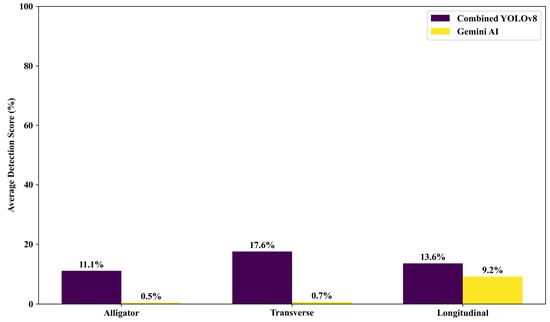
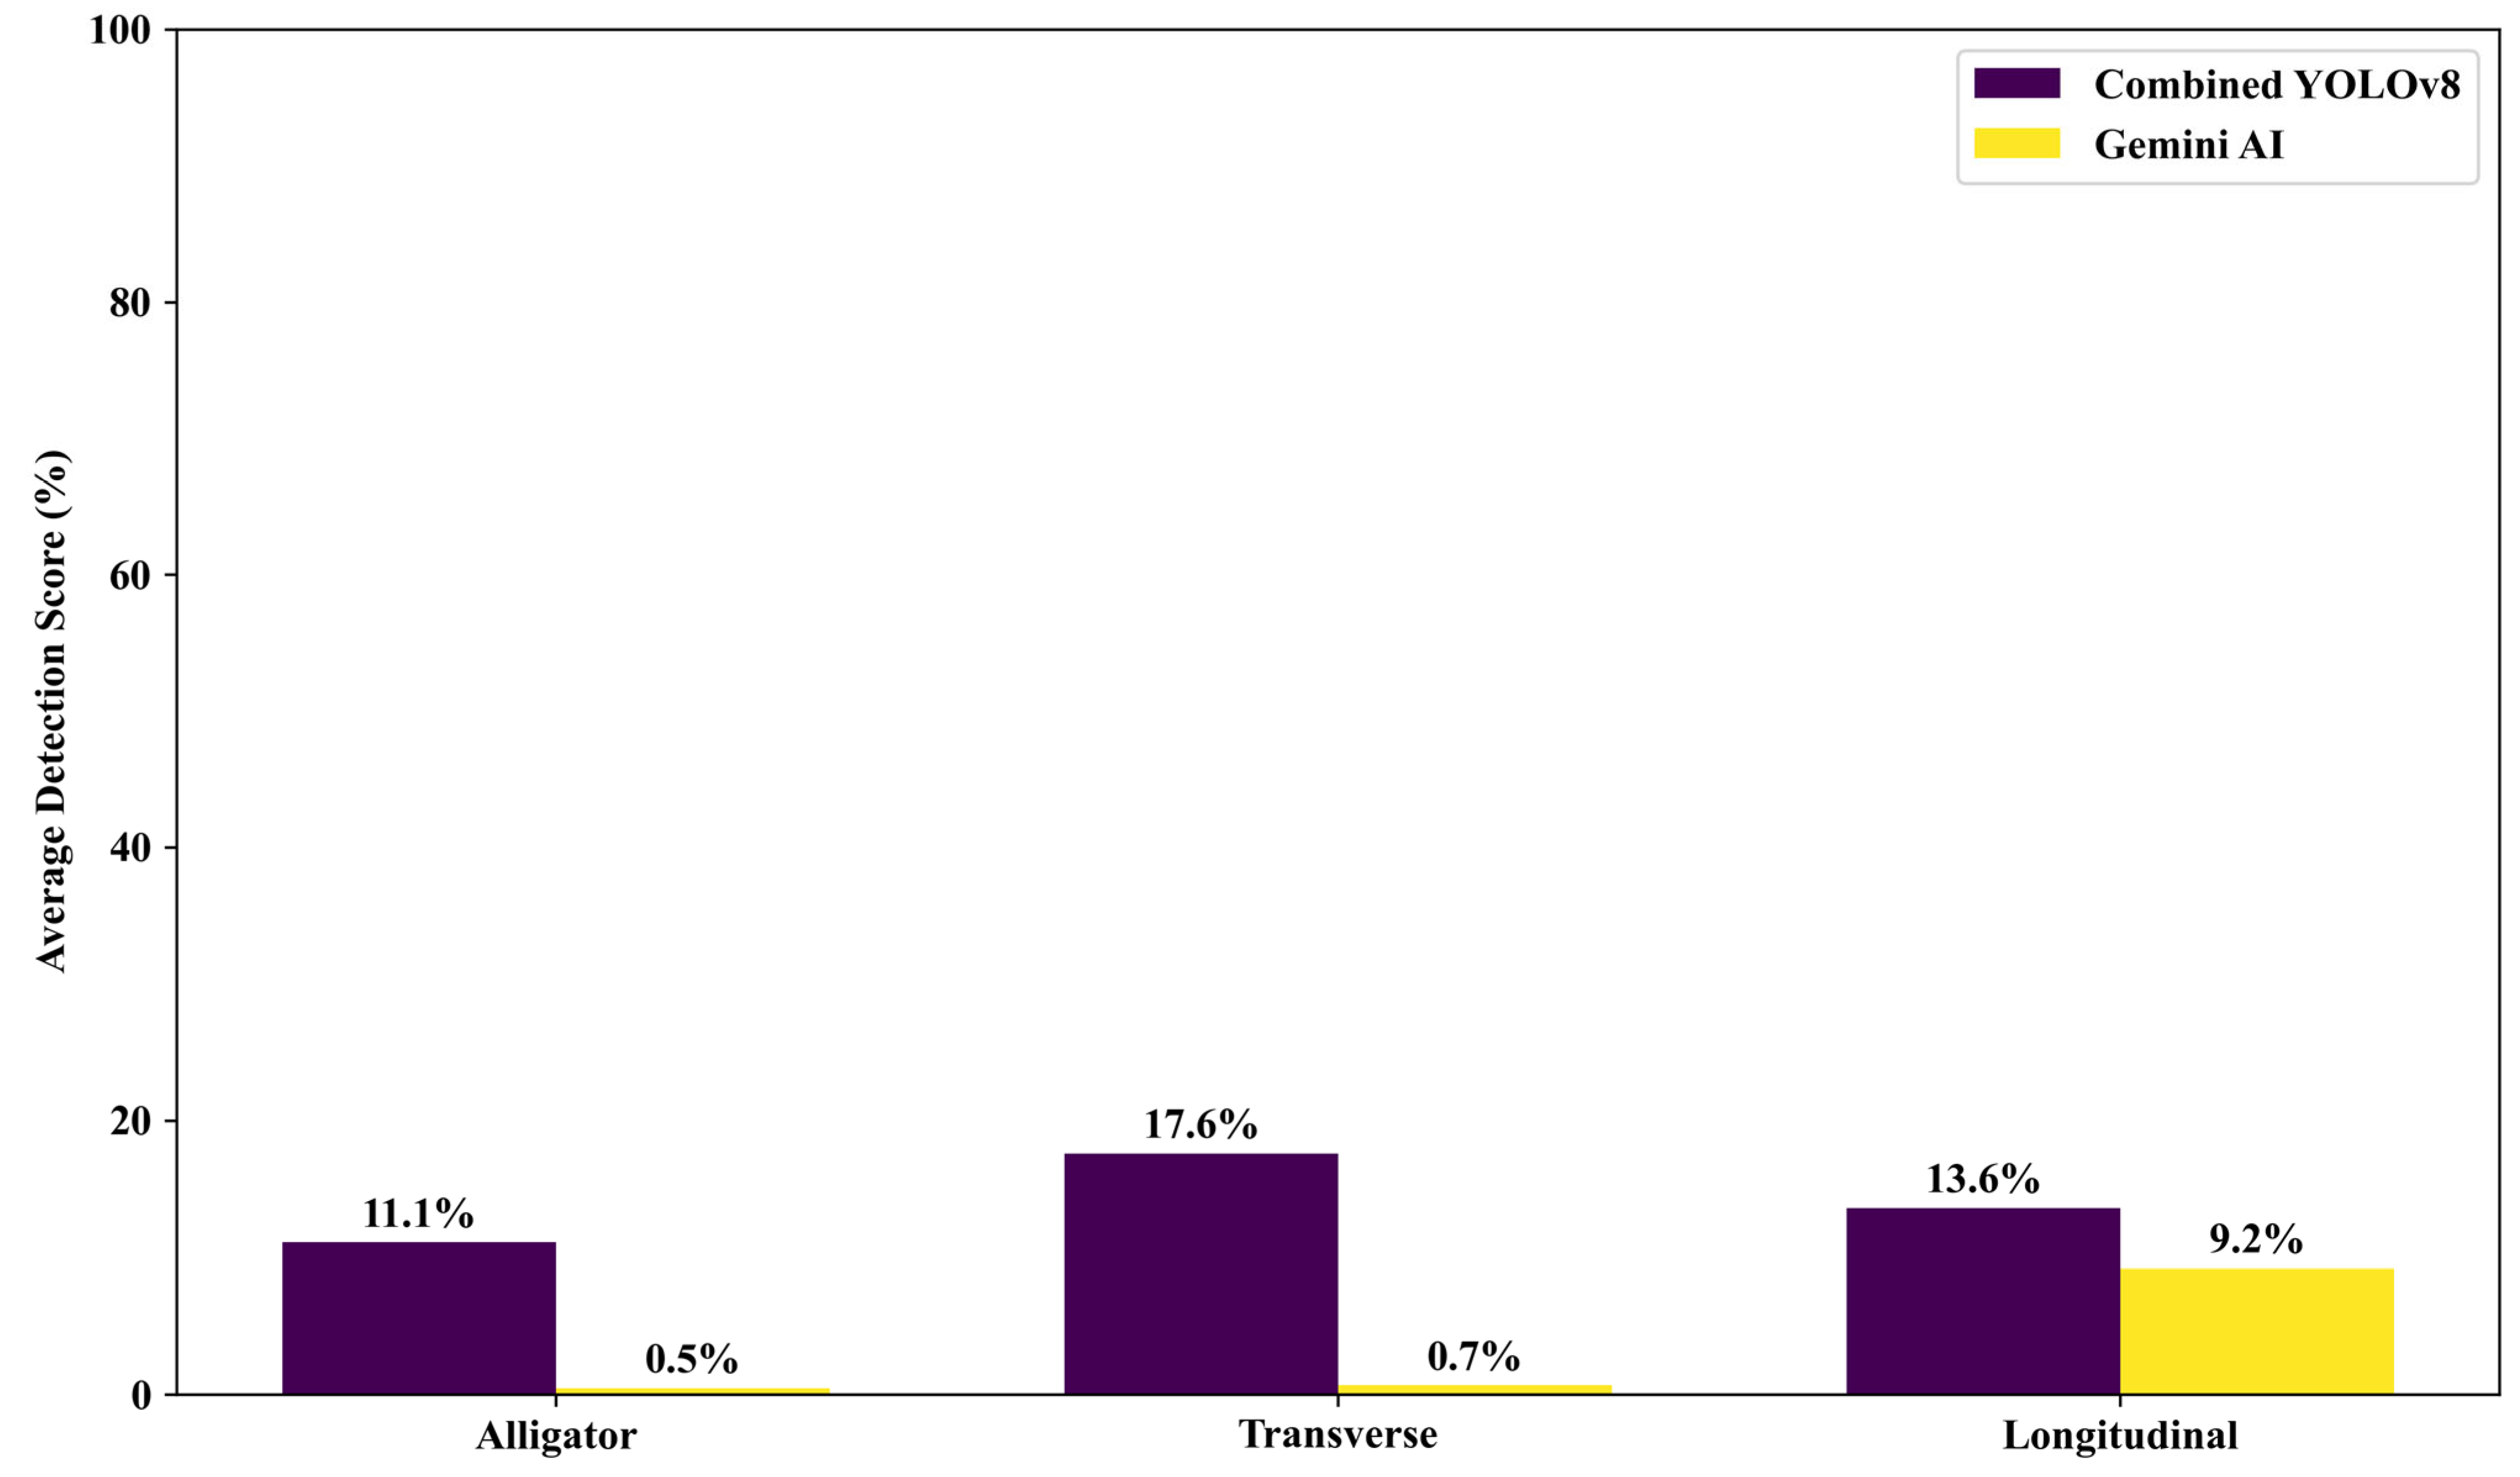
To assess performance for specific crack types, Combined YOLOv8 and Gemini AI were tested on alligator, transverse, and longitudinal cracks (see Figure 15). Combined YOLOv8 consistently outperformed Gemini AI, achieving the highest detection accuracy for transverse cracks (17.6%), followed by longitudinal (13.6%) and alligator cracks (11.1%). Gemini AI’s scores were significantly lower: 0.5%, 0.7%, and 9.2%, respectively.
Figure 15.
Crack detection performance across different damage types.
This performance gap underscores Combined YOLOv8’s stronger ability to extract features from complex crack patterns. Conversely, Gemini AI’s poor results illustrate the limitations of general-purpose models in specialized tasks without domain-specific training.
4.5. Comparative Model Analysis and Gemini AI Observations
Comparative evaluation across various image types—web-sourced, field, mixed-damage, and crack-specific—revealed that YOLOv11-B and YOLOv8 consistently outperformed other models under field conditions. Gemini AI achieved near-perfect results for clean, high-resolution web images (97.64%) but suffered substantial performance drops in field scenarios, averaging 18.50% for mixed-damage inputs and as low as 0.5–9.2% for crack-specific images.
These findings highlight Gemini AI’s limited adaptability to complex, noisy environments due to its general-purpose architecture and lack of task-specific tuning. In contrast, YOLOv11-B demonstrated the strongest field robustness (46.15% for mixed-damage images), while YOLOv8 maintained reliable accuracy across all datasets. Notably, YOLOv11-A underperformed despite its similarity to YOLOv11-B, emphasizing the importance of architectural refinement and dataset alignment.
Overall, the YOLO-based models, particularly YOLOv11-B and YOLOv8, proved more resilient and suitable for real-time road monitoring applications, while Gemini AI may be better suited for controlled, desktop-based analysis.
5. Conclusions
This article describes the design and validation of an AI-based web platform for detecting and geospatially visualizing road damage through the integration of YOLOv8, YOLOv11 variants, and Gemini AI. The framework demonstrated strong performance in detecting potholes, cracks, and mixed damage across a variety of static images. Among all of the tested models, YOLOv11-B and YOLOv8 proved to be most suitable for practical deployment, while Gemini AI performed best under ideal, controlled conditions but fared poorly in dynamic, unstructured environments. Despite these promising results, this study has some limitations. The validation was based on a limited set of static images and did not incorporate video stream analysis or multi-frame temporal information, which could enhance detection reliability and reduce false positives. In addition, the field test was limited to only 18 images, which is insufficient to fully demonstrate robustness and generalization and should be expanded in future studies. Moreover, severity classification was based on visual assessment without using depth information or structural metrics, which may limit accuracy in prioritizing maintenance needs.
For future work, the following is recommended:
- Extend the system to support video-based detection, enabling real-time monitoring and damage tracking across sequences.
- Integrate depth sensors or 3D imaging (e.g., LiDAR) to improve the precision of severity classification.
- Possibly explore semi-supervised or federated learning to improve model adaptability across different geographic and environmental conditions.
- Include multi-modal data sources such as traffic volume, weather, or vehicle telemetry to contextualize damage severity and urgency.
- Enhance mobile compatibility and edge deployment to enable field operability without reliance on cloud infrastructure.
Although the platform supports core interactive features such as image uploading, model selection, confidence adjustment, and geospatial visualization, this study did not conduct formal usability testing or structured user research. Future work will involve evaluating the interface through standard usability assessment methods (e.g., SUS scores and task completion rates) to refine the system’s design for practical deployment.
Author Contributions
Conceptualization, Z.D., Ö.P. and A.A.; methodology, Z.D., Ö.P. and A.A.; software, Z.D., S.T.N., Ö.P., S.S. and M.A.; validation, Z.D., S.T.N., Ö.P., M.A. and A.A.; formal analysis, Z.D., Ö.P., S.S., M.A. and A.A.; investigation, Z.D., S.T.N., Ö.P. and S.S.; resources, S.T.N., S.S. and A.A.; data curation, Z.D., Ö.P., S.S. and M.A.; writing—original draft preparation, Z.D., S.T.N., Ö.P. and M.A.; writing—review and editing, S.T.N., S.S. and A.A.; visualization, Z.D., Ö.P. and A.A.; supervision, S.S. and A.A.; funding acquisition, S.T.N., S.S. and A.A. All authors have read and agreed to the published version of the manuscript.
Funding
This research received no external funding.
Institutional Review Board Statement
Not applicable.
Informed Consent Statement
Not applicable.
Data Availability Statement
The data presented in this study are available in the article.
Conflicts of Interest
The authors declare no conflicts of interest.
Appendix A

Figure A1.
Overview of the TriRoad AI web interface workflow for road damage detection and visualization.
Figure A1.
Overview of the TriRoad AI web interface workflow for road damage detection and visualization.
References
- Almusawi, A.; Nasraldeen, S.T.; Albdairi, M.; Norri, H.H. Viscoelastic and Fatigue Performance of Modified Bitumen Using Polymer and Bio-Based Additives: A Comparative Study. Buildings 2025, 15, 306. [Google Scholar] [CrossRef]
- Almusawi, A.; Nasraldeen, S.T.N. Advanced Rheological Characterization of Asphalt Binders Modified with Eco-Friendly and Polymer-Based Additives Under Dynamic Loading. Appl. Sci. 2025, 15, 5552. [Google Scholar] [CrossRef]
- Albdairi, M.; Almusawi, A. Examining the Influence of Autonomous Vehicle Behaviors on Travel Times and Vehicle Arrivals: A Comparative Study Across Different Simulation Durations on the Kirkuk-Sulaymaniyah Highway. Int. J. Automot. Sci. Technol. 2024, 8, 341–353. [Google Scholar] [CrossRef]
- Asad, M.H.; Khaliq, S.; Yousaf, M.H.; Ullah, M.O.; Ahmad, A. Pothole Detection Using Deep Learning: A Real-Time and AI-on-the-Edge Perspective. Adv. Civil Eng. 2022, 2022, 9221211. [Google Scholar] [CrossRef]
- Rathee, M.; Bačić, B.; Doborjeh, M. Automated Road Defect and Anomaly Detection for Traffic Safety: A Systematic Review. Sensors 2023, 23, 5656. [Google Scholar] [CrossRef] [PubMed]
- Berhanu, Y.; Alemayehu, E.; Schröder, D. Examining Car Accident Prediction Techniques and Road Traffic Congestion: A Comparative Analysis of Road Safety and Prevention of World Challenges in Low-Income and High-Income Countries. J. Adv. Transp. 2023, 2023, 6643412. [Google Scholar] [CrossRef]
- Mandirola, M.; Casarotti, C.; Peloso, S.; Lanese, I.; Brunesi, E.; Senaldi, I. Use of UAS for damage inspection and assessment of bridge infrastructures. Int. J. Disaster Risk Reduct. 2022, 72, 102824. [Google Scholar] [CrossRef]
- Xu, S.; Wang, J.; Wu, P.; Shou, W.; Wang, X.; Chen, M. Vision-Based Pavement Marking Detection and Condition Assessment—A Case Study. Appl. Sci. 2021, 11, 3152. [Google Scholar] [CrossRef]
- Harirchian, E.; Aghakouchaki Hosseini, S.E.; Jadhav, K.; Kumari, V.; Rasulzade, S.; Işık, E.; Wasif, M.; Lahmer, T. A review on application of soft computing techniques for the rapid visual safety evaluation and damage classification of existing buildings. J. Build. Eng. 2021, 43, 102536. [Google Scholar] [CrossRef]
- Khajwal, A.B.; Noshadravan, A. An uncertainty-aware framework for reliable disaster damage assessment via crowdsourcing. Int. J. Disaster Risk Reduct. 2021, 55, 102110. [Google Scholar] [CrossRef]
- Nife, N.I.; Mahmood, Z.K.; Hammood, L.; Ghazi, A.; Aldawoodi, A.; Albdairi, M. Self-Supervised Learning Approach for Early Detection of Rare Neurological Disorders in MRI Data. J. Internet Serv. Inf. Secur. 2025, 15, 153–169. [Google Scholar] [CrossRef]
- Almusawi, A.; Albdairi, M.; Qadri, S.S.S.M. Integrating Autonomous Vehicles (AVs) into Urban Traffic: Simulating Driving and Signal Control. Appl. Sci. 2024, 14, 8851. [Google Scholar] [CrossRef]
- Redmon, J.; Divvala, S.; Girshick, R.; Farhadi, A. You only look once: Unified, real-time object detection. In Proceedings of the IEEE Conference on Computer Vision and Pattern Recognition, Las Vegas, NV, USA, 27–30 June 2016; pp. 779–788. Available online: https://www.cv-foundation.org/openaccess/content_cvpr_2016/html/Redmon_You_Only_Look_CVPR_2016_paper.html (accessed on 12 July 2025).
- Chakurkar, P.S.; Vora, D.; Patil, S.; Mishra, S.; Kotecha, K. Data-driven approach for AI-based crack detection: Techniques, challenges, and future scope. Front. Sustain. Cities 2023, 5, 1253627. [Google Scholar] [CrossRef]
- Putriani, O.; Fudholi, D.H.; Heryadi, P.; Dananjaya, A.T.; Sita, T.; Kurniawan, R. pindAI: An AI-Driven Comprehensive Solution for Road Damage Detection in Road Asset Management. In IOP Conference Series: Earth and Environmental Science; IOP Publishing: Bristol, UK, 2025; p. 012080. [Google Scholar]
- Olugbade, S.; Ojo, S.; Imoize, A.L.; Isabona, J.; Alaba, M.O. A Review of Artificial Intelligence and Machine Learning for Incident Detectors in Road Transport Systems. Math. Comput. Appl. 2022, 27, 77. [Google Scholar] [CrossRef]
- Inam, H.; Islam, N.U.; Akram, M.U.; Ullah, F. Smart and Automated Infrastructure Management: A Deep Learning Approach for Crack Detection in Bridge Images. Sustainability 2023, 15, 1866. [Google Scholar] [CrossRef]
- Ghasemi, Y.; Jeong, H.; Choi, S.H.; Park, K.-B.; Lee, J.Y. Deep learning-based object detection in augmented reality: A systematic review. Comput. Ind. 2022, 139, 103661. [Google Scholar] [CrossRef]
- Kaur, J.; Singh, W. Tools, techniques, datasets and application areas for object detection in an image: A review. Multimed. Tools Appl. 2022, 81, 38297–38351. [Google Scholar] [CrossRef]
- Yao, H.; Fan, Y.; Liu, Y.; Cao, D.; Chen, N.; Luo, T.; Yang, J.; Hu, X.; Ji, J.; You, Z. Development and optimization of object detection technology in pavement engineering: A literature review. J. Road Eng. 2024, 4, 163–188. [Google Scholar] [CrossRef]
- Ale, L.; Zhang, N.; Li, L. Road Damage Detection Using RetinaNet. In Proceedings of the 2018 IEEE International Conference on Big Data (Big Data), Seattle, WA, USA, 10–13 December 2018; pp. 5197–5200. [Google Scholar] [CrossRef]
- Wang, Y.J.; Ding, M.; Kan, S.; Zhang, S.; Lu, C. Deep Proposal and Detection Networks for Road Damage Detection and Classification. In Proceedings of the 2018 IEEE International Conference on Big Data (Big Data), Seattle, WA, USA, 10–13 December 2018; pp. 5224–5227. [Google Scholar] [CrossRef]
- Chun, C.; Ryu, S.-K. Road Surface Damage Detection Using Fully Convolutional Neural Networks and Semi-Supervised Learning. Sensors 2019, 19, 5501. [Google Scholar] [CrossRef]
- Doshi, K.; Yilmaz, Y. Road Damage Detection using Deep Ensemble Learning. In Proceedings of the 2020 IEEE International Conference on Big Data (Big Data), Atlanta, GA, USA, 10–13 December 2020; pp. 5540–5544. [Google Scholar] [CrossRef]
- Zhang, X.; Xia, X.; Li, N.; Lin, M.; Song, J.; Ding, N. Exploring the Tricks for Road Damage Detection with A One-Stage Detector. In Proceedings of the 2020 IEEE International Conference on Big Data (Big Data), Atlanta, GA, USA, 10–13 December 2020; pp. 5616–5621. [Google Scholar] [CrossRef]
- Naddaf-Sh, S.; Naddaf-Sh, M.M.; Kashani, A.R.; Zargarzadeh, H. An Efficient and Scalable Deep Learning Approach for Road Damage Detection. In Proceedings of the 2020 IEEE International Conference on Big Data (Big Data), Atlanta, GA, USA, 10–13 December 2020; pp. 5602–5608. [Google Scholar] [CrossRef]
- Liu, Y.; Zhang, X.; Zhang, B.; Chen, Z. Deep Network For Road Damage Detection. In Proceedings of the 2020 IEEE International Conference on Big Data (Big Data), Atlanta, GA, USA, 10–13 December 2020; pp. 5572–5576. [Google Scholar] [CrossRef]
- Yin, J.; Qu, J.; Huang, W.; Chen, Q. Road damage detection and classification based on multi-level feature pyramids. KSII Trans. Internet Inf. Syst. (TIIS) 2021, 15, 786–799. [Google Scholar] [CrossRef]
- Fassmeyer, P.; Kortmann, F.; Drews, P.; Funk, B. Towards a Camera-Based Road Damage Assessment and Detection for Autonomous Vehicles: Applying Scaled-YOLO and CVAE-WGAN. In Proceedings of the 2021 IEEE 94th Vehicular Technology Conference (VTC2021-Fall), Norman, OK, USA, 27–30 September 2021; pp. 1–7. [Google Scholar] [CrossRef]
- Liao, K. Road Damage Intelligent Detection with Deep Learning Techniques. In Proceedings of the 2022 IEEE 5th International Conference on Information Systems and Computer Aided Education (ICISCAE), Dalian, China, 23–25 September 2022; pp. 795–799. [Google Scholar] [CrossRef]
- Saha, P.K.; Sekimoto, Y. Road Damage Detection for Multiple Countries. In Proceedings of the 2022 IEEE International Conference on Big Data (Big Data), Osaka, Japan, 17–20 December 2022; pp. 6431–6438. [Google Scholar] [CrossRef]
- Pham, V.; Nguyen, D.; Donan, C. Road Damage Detection and Classification with YOLOv7. In Proceedings of the 2022 IEEE International Conference on Big Data (Big Data), Osaka, Japan, 17–20 December 2022; pp. 6416–6423. [Google Scholar] [CrossRef]
- Mehajabin, N.; Ma, Z.; Wang, Y.; Tohidypour, H.R.; Nasiopoulos, P. Real-Time Deep Learning based Road Deterioration Detection for Smart Cities. In Proceedings of the 2022 18th International Conference on Wireless and Mobile Computing, Networking and Communications (WiMob), Thessaloniki, Greece, 10–12 October 2022; pp. 321–326. [Google Scholar] [CrossRef]
- Heitzmann, P. A computer vision-assisted approach to automated real-time road infrastructure management. arXiv 2022, arXiv:2202.13285. [Google Scholar] [CrossRef]
- Zhang, H.; Wu, Z.; Qiu, Y.; Zhai, X.; Wang, Z.; Xu, P.; Liu, Z.; Li, X.; Jiang, N. A New Road Damage Detection Baseline with Attention Learning. Appl. Sci. 2022, 12, 7594. [Google Scholar] [CrossRef]
- Wang, N.; Shang, L.; Song, X. A Transformer-Optimized Deep Learning Network for Road Damage Detection and Tracking. Sensors 2023, 23, 7395. [Google Scholar] [CrossRef]
- Sasmito, B.; Setiadji, B.H.; Isnanto, R. Deteksi Kerusakan Jalan Menggunakan Pengolahan Citra Deep Learning di Kota Semarang. TEKNIK 2023, 44, 7–14. [Google Scholar] [CrossRef]
- Ren, M.; Zhang, X.; Chen, X.; Zhou, B.; Feng, Z. YOLOv5s-M: A deep learning network model for road pavement damage detection from urban street-view imagery. Int. J. Appl. Earth Obs. Geoinf. 2023, 120, 103335. [Google Scholar] [CrossRef]
- Popli, R.; Kansal, I.; Verma, J.; Khullar, V.; Kumar, R.; Sharma, A. ROAD: Robotics-Assisted Onsite Data Collection and Deep Learning Enabled Robotic Vision System for Identification of Cracks on Diverse Surfaces. Sustainability 2023, 15, 9314. [Google Scholar] [CrossRef]
- Fakhri, S.A.; Mehran, S.A.; Hamzeh, Z.; Alireza, S.; Fakhri, A. Pavement crack detection through a deep-learned asymmetric encoder-decoder convolutional neural network. Int. J. Pavement Eng. 2023, 24, 2255359. [Google Scholar] [CrossRef]
- Jeong, J.; Cho, J.; Lee, J.G. Optimized Road Damage Detection Using Enhanced Deep Learning Architectures for Improved Inference Speed and Accuracy. In Proceedings of the 2024 IEEE International Conference on Big Data (BigData), Washington, DC, USA, 15–18 December 2024; pp. 8453–8459. [Google Scholar] [CrossRef]
- Guo, C.; Su, Y.; Zuo, C. A Heterogeneous Semi-Supervised Learning Network for Road Damage Detection. In Proceedings of the 2024 9th International Conference on Intelligent Computing and Signal Processing (ICSP), Xi’an, China, 19–21 April 2024; pp. 1596–1599. [Google Scholar] [CrossRef]
- Dutta, D.; Banerjee, R. Indian Road Damage Detection Using Deep Learning. In Advancements in Intelligent Process Automation; IGI Global: Hershey, Pennsylvania, 2025; pp. 223–262. [Google Scholar] [CrossRef]
- Joseph, A.E.; Ashraf, D.; Abraham, R.A.; Thakadipurath, T.T.; Joseph, N. Revolutionizing Road Damage Assessment with YOLOv8-based Deep Learning and Computer Vision Techniques. In Proceedings of the 2024 1st International Conference on Trends in Engineering Systems and Technologies (ICTEST), Kochi, India, 11–13 April 2024; pp. 1–6. [Google Scholar] [CrossRef]
- Wei, Y.; Zhou, Y.; Lu, M.; Han, S.; Xie, M.; Gao, L. Road Disease Damage Detection Based on Improved CenterNet. In Proceedings of the 2024 39th Youth Academic Annual Conference of Chinese Association of Automation (YAC), Dalian, China, 7–9 June 2024; pp. 939–944. [Google Scholar] [CrossRef]
- Yoo, J.; Shtaiwi, R.E.; Yasin, M.; Trivedi, D.; Alfarrarjeh, A.; Jabal, A.A.; Kim, S.H. Towards Real-world Deployment of Deep Learning Solutions for Global Road Damage Detection and Classification. In Proceedings of the 2024 IEEE International Conference on Big Data (BigData), Washington, DC, USA, 15–18 December 2024; pp. 8485–8494. [Google Scholar] [CrossRef]
- Wang, F.; Wei, J.; Zhang, N.; Watanabe, Y.; Watanabe, S.; Suzuki, G.; Tan, Z. Road Damage Detection with Models Learning from Each Other. In Proceedings of the 2024 IEEE International Conference on Big Data (BigData), Washington, DC, USA, 15–18 December 2024; pp. 8479–8484. [Google Scholar]
- Mythili, M.; Janani, D.; Madhumitha, D.S.; Mangala Madhumita, V.; Nandhini, R. A Framework For Precise Road Damage Detection Using Deep Learning. In Proceedings of the 2024 2nd International Conference on Artificial Intelligence and Machine Learning Applications Theme: Healthcare and Internet of Things (AIMLA), Namakkal, India, 15–16 March 2024; pp. 1–5. [Google Scholar] [CrossRef]
- El-Din Hemdan, E.; Al-Atroush, M.E. A Review Study of Intelligent Road Crack Detection: Algorithms and Systems. Int. J. Pavement Res. Technol. 2025, 7, 1–31. [Google Scholar] [CrossRef]
- Arconzo, V.; Gorga, G.; Gutierrez, G.; Omar, A.; Rangisetty, M.A.; Ricciardi Celsi, L.; Santini, F.; Scianaro, E. On the Application of DiffusionDet to Automatic Car Damage Detection and Classification via High-Performance Computing. Electronics 2025, 14, 1362. [Google Scholar] [CrossRef]
- Souei, W.B.S.; Bachir, N.G.G.A.; Djemaa, R.B. A Blockchain-Based Fraud Detection and Vehicle Damage Assessment System Using Machine Learning and Computer Vision. In Proceedings of the 27th International Conference on Enterprise Information Systems, Porto, Portugal, 4–6 April 2025; SciTePress: Setúbal, Portugal, 2025; pp. 1123–1130. [Google Scholar] [CrossRef]
- Kim, H.; Kim, E.; Ahn, S.; Kim, B.; Kim, S.J.; Sung, T.K.; Zhao, L.; Su, X.; Dong, G. KRID: A Large-Scale Nationwide Korean Road Infrastructure Dataset for Comprehensive Road Facility Recognition. Data 2025, 10, 36. [Google Scholar] [CrossRef]
- UK, M. How Do Potholes Form? Available online: https://meonuk.com/blogs/news/how-do-potholes-form (accessed on 12 July 2025).
- Insurance, C. The Pothole Nightmare. Available online: https://www.connect-insurance.uk/the-pothole-nightmare (accessed on 12 July 2025).
- Lee, S. A Pothole Can Damage Your Vehicle, Your Passengers, and You. Available online: https://www.attorneystevelee.com/blog/car-accidents/a-pothole-can-damage-your-vehicle-your-passengers-and-you/ (accessed on 12 July 2025).
- News, W.N. The Hidden Hazards: How Potholes Can Damage Your Vehicle. Available online: https://wells.nub.news/motors/news/the-hidden-hazards-how-potholes-can-damage-your-vehicle-2966 (accessed on 12 July 2025).
- AA, T. Pothole Damage: How to Claim. Available online: https://www.theaa.com/breakdown-cover/advice/pothole-damage-how-to-claim (accessed on 12 July 2025).
- Yik, Y.K.; Alias, N.E.; Yusof, Y.; Isaak, S. A Real-Time Pothole Detection Based on Deep Learning Approach. In Proceedings of the Journal of physics: Conference series; IOP Publishing: Bristol, UK, 2021; p. 012001. [Google Scholar] [CrossRef]
- Solicitors, M. Pothole Accident Claims. Available online: https://www.mooneerams.com/blog/pothole-accident-claims/ (accessed on 12 July 2025).
- Materials, U.P. What Causes Potholes in Asphalt Streets and Driveways? Available online: https://www.uniquepavingmaterials.com/what-causes-potholes-asphalt-streets-driveways/ (accessed on 12 July 2025).
- Racl, O. Road Damage Detection. Available online: https://github.com/oracl4/RoadDamageDetection (accessed on 12 July 2025).
- INV, D. Pot-Hole-Detection-System-Using-AI-ML. Available online: https://github.com/DeepakINV123/Pot-Hole-Detection-System-using-AI-ML (accessed on 12 July 2025).
- Nekouee, F. YOLOv8 Pothole Segmentation Road Damage Assessment. Available online: https://github.com/FarzadNekouee/YOLOv8_Pothole_Segmentation_Road_Damage_Assessment (accessed on 12 July 2025).
- Malaysia, J.K.R. A Guide to the Visual Assessment of Flexible Pavement Surface Conditions (JKR 20709-2060-92); Public Works Department: Kuala Lumpur, Malaysia, 1992; Available online: https://www.scribd.com/document/364279106/73083060-A-Guide-to-the-Visual-Assessement-of-Flexible-Pavement-Surface-Conditions-JKR-20709-2060-92-pdf (accessed on 12 July 2025).
- Li, Y.; Yin, C.; Lei, Y.; Zhang, J.; Yan, Y. RDD-YOLO: Road Damage Detection Algorithm Based on Improved You Only Look Once Version 8. Appl. Sci. 2024, 14, 3360. [Google Scholar] [CrossRef]
- Zhong, J.; Kong, D.; Wei, Y.; Pan, B. YOLOv8 and point cloud fusion for enhanced road pothole detection and quantification. Sci. Rep. 2025, 15, 11260. [Google Scholar] [CrossRef] [PubMed]
- Zeng, J.; Zhong, H. YOLOv8-PD: An improved road damage detection algorithm based on YOLOv8n model. Sci. Rep. 2024, 14, 12052. [Google Scholar] [CrossRef] [PubMed]
- Yurdakul, M.; Tasdemir, Ş. An Enhanced YOLOv8 Model for Real-Time and Accurate Pothole Detection and Measurement. arXiv 2025, arXiv:2505.04207. [Google Scholar] [CrossRef]
- Zuo, H.; Li, Z.; Gong, J.; Tian, Z. Intelligent road crack detection and analysis based on improved YOLOv8. arXiv 2025, arXiv:2504.13208. [Google Scholar] [CrossRef]
- Youwai, S.; Chaiyaphat, A.; Chaipetch, P. YOLO9tr: A lightweight model for pavement damage detection utilizing a generalized efficient layer aggregation network and attention mechanism. J. Real-Time Image Process. 2024, 21, 163. [Google Scholar] [CrossRef]


Disclaimer/Publisher’s Note: The statements, opinions and data contained in all publications are solely those of the individual author(s) and contributor(s) and not of MDPI and/or the editor(s). MDPI and/or the editor(s) disclaim responsibility for any injury to people or property resulting from any ideas, methods, instructions or products referred to in the content. |
© 2025 by the authors. Licensee MDPI, Basel, Switzerland. This article is an open access article distributed under the terms and conditions of the Creative Commons Attribution (CC BY) license (https://creativecommons.org/licenses/by/4.0/).