
Research on the Increase in Commuter Use Immediately After the Opening of LRT Using IC Card Data


Abstract
1. Introduction
1.1. Background and Objectives
1.2. Review of Existing Research
1.2.1. Discrepancies Between Forecasted and Actual Ridership
1.2.2. Using Public Transportation IC Cards
1.2.3. Post-Opening Surge in Ridership on Newly Introduced Public Transportation Systems
1.2.4. Behavior Changes When Light Rail Opens
1.3. Positioning of the Study
2. Materials and Methods
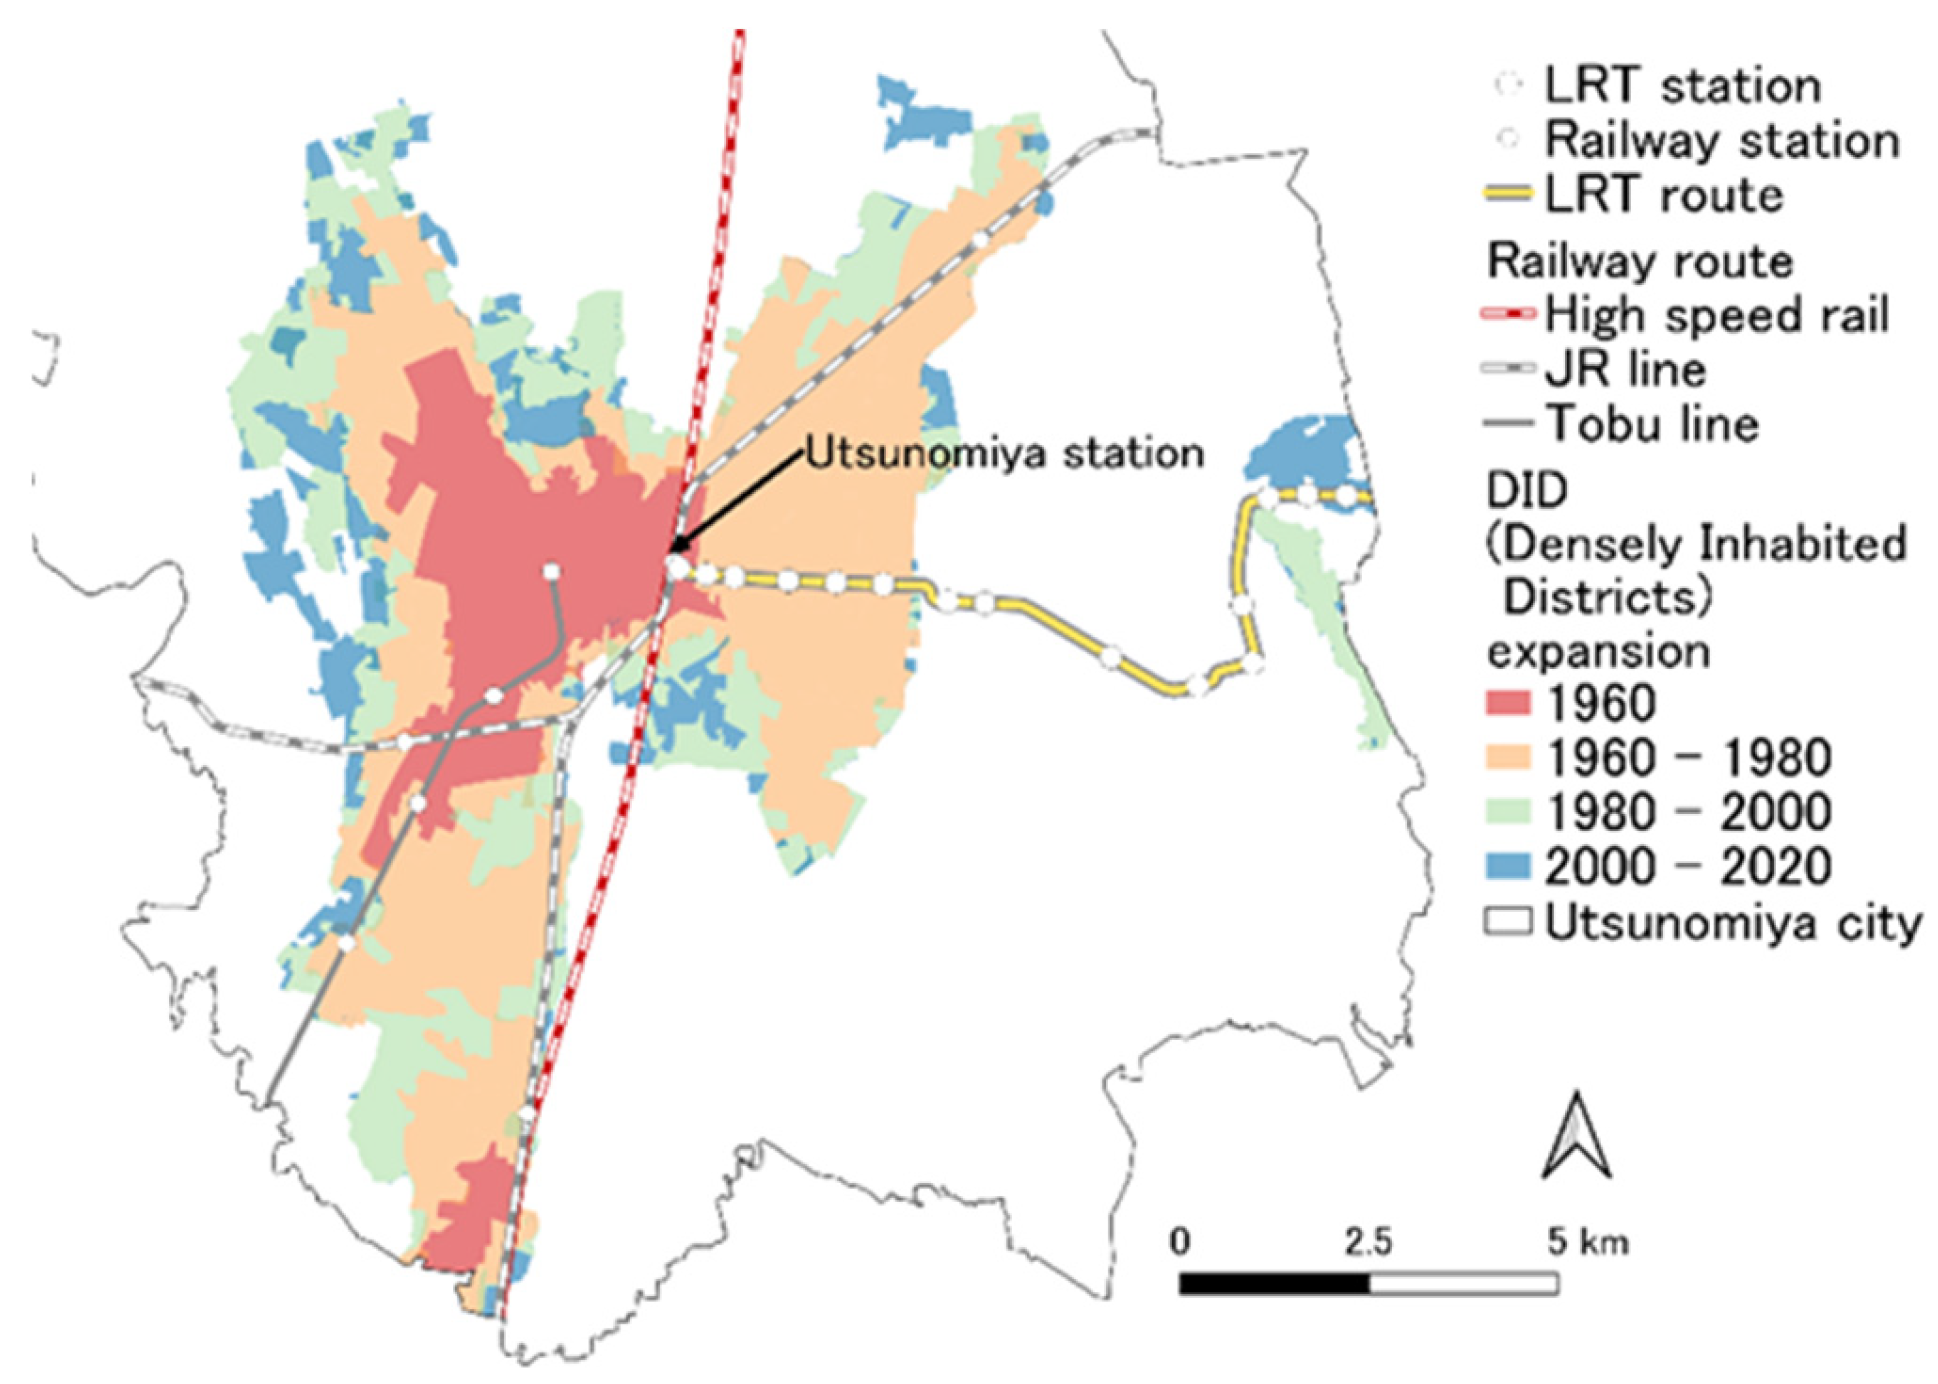
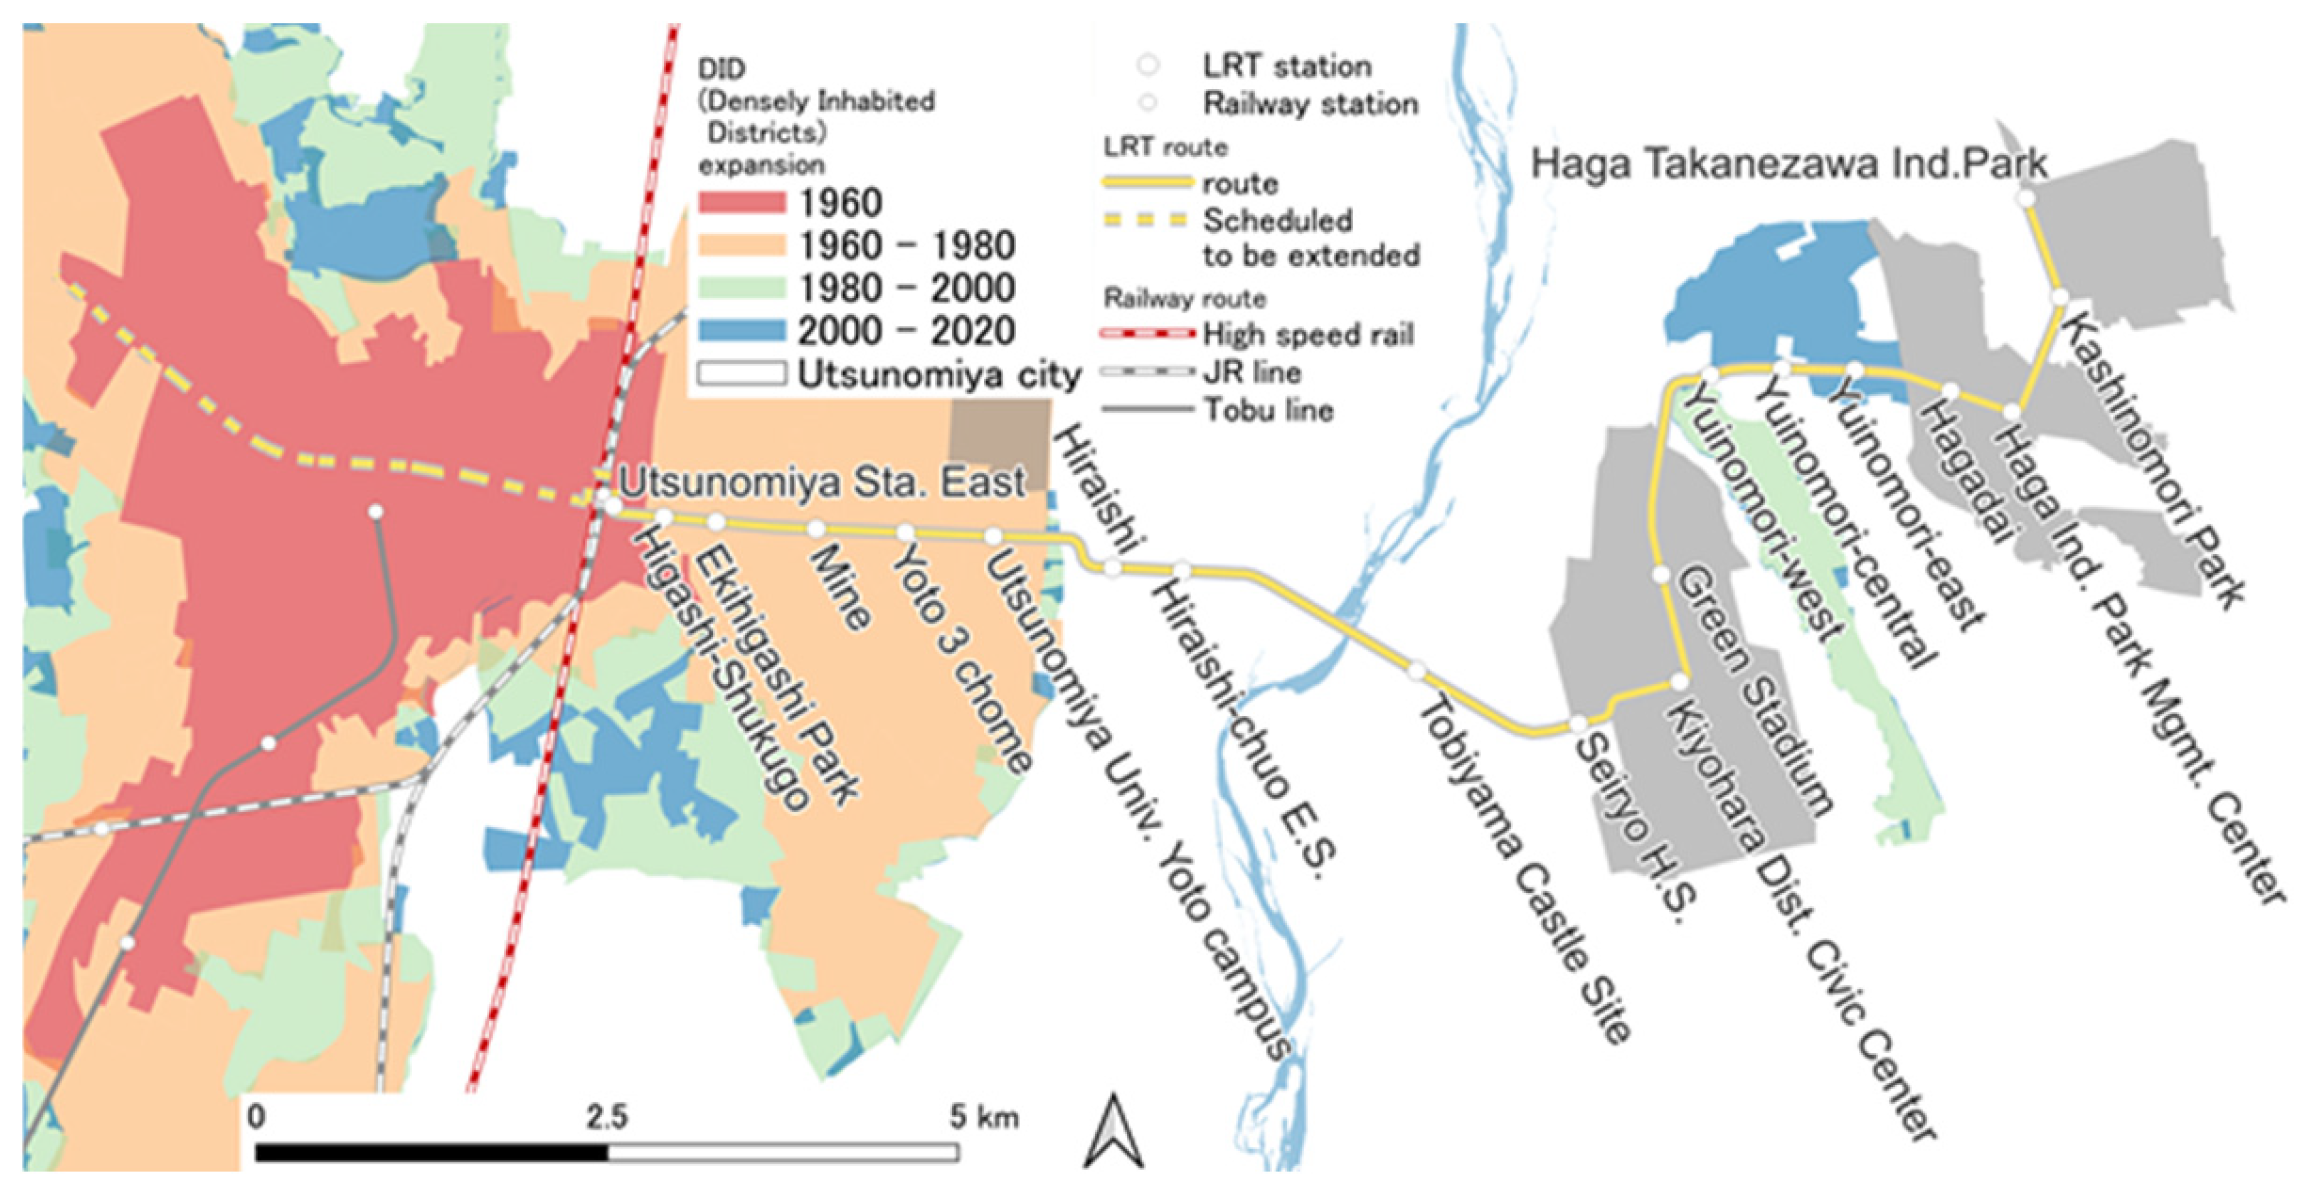
2.1. Target Area
2.2. Overview of Haga Utsunomiya LRT
2.3. IC Card Data
- ⋅
- Date of Operation: The date at the time of the first departure. Even if the date crosses over, it is the same date of operation until the last train.
- ⋅
- Destination Stop: The stop where the individual gets off the train, except for the last use on the individual’s date of operation.
- ⋅
- Duration of stay: The time difference between the individual’s disembarkation time and the next boarding time. However, it is not calculated for the last use on the date of operation. If an individual is transferring from one line to another and gets off at a stop that can be reached only at the transfer destination, the time spent at the transfer destination is used. Note that this study does not cover one-way users who ride only once a day.
- ⋅
- Frequency: The number of days an individual used the destination stop during the month of boarding and the subsequent two months.
2.4. National PT Data
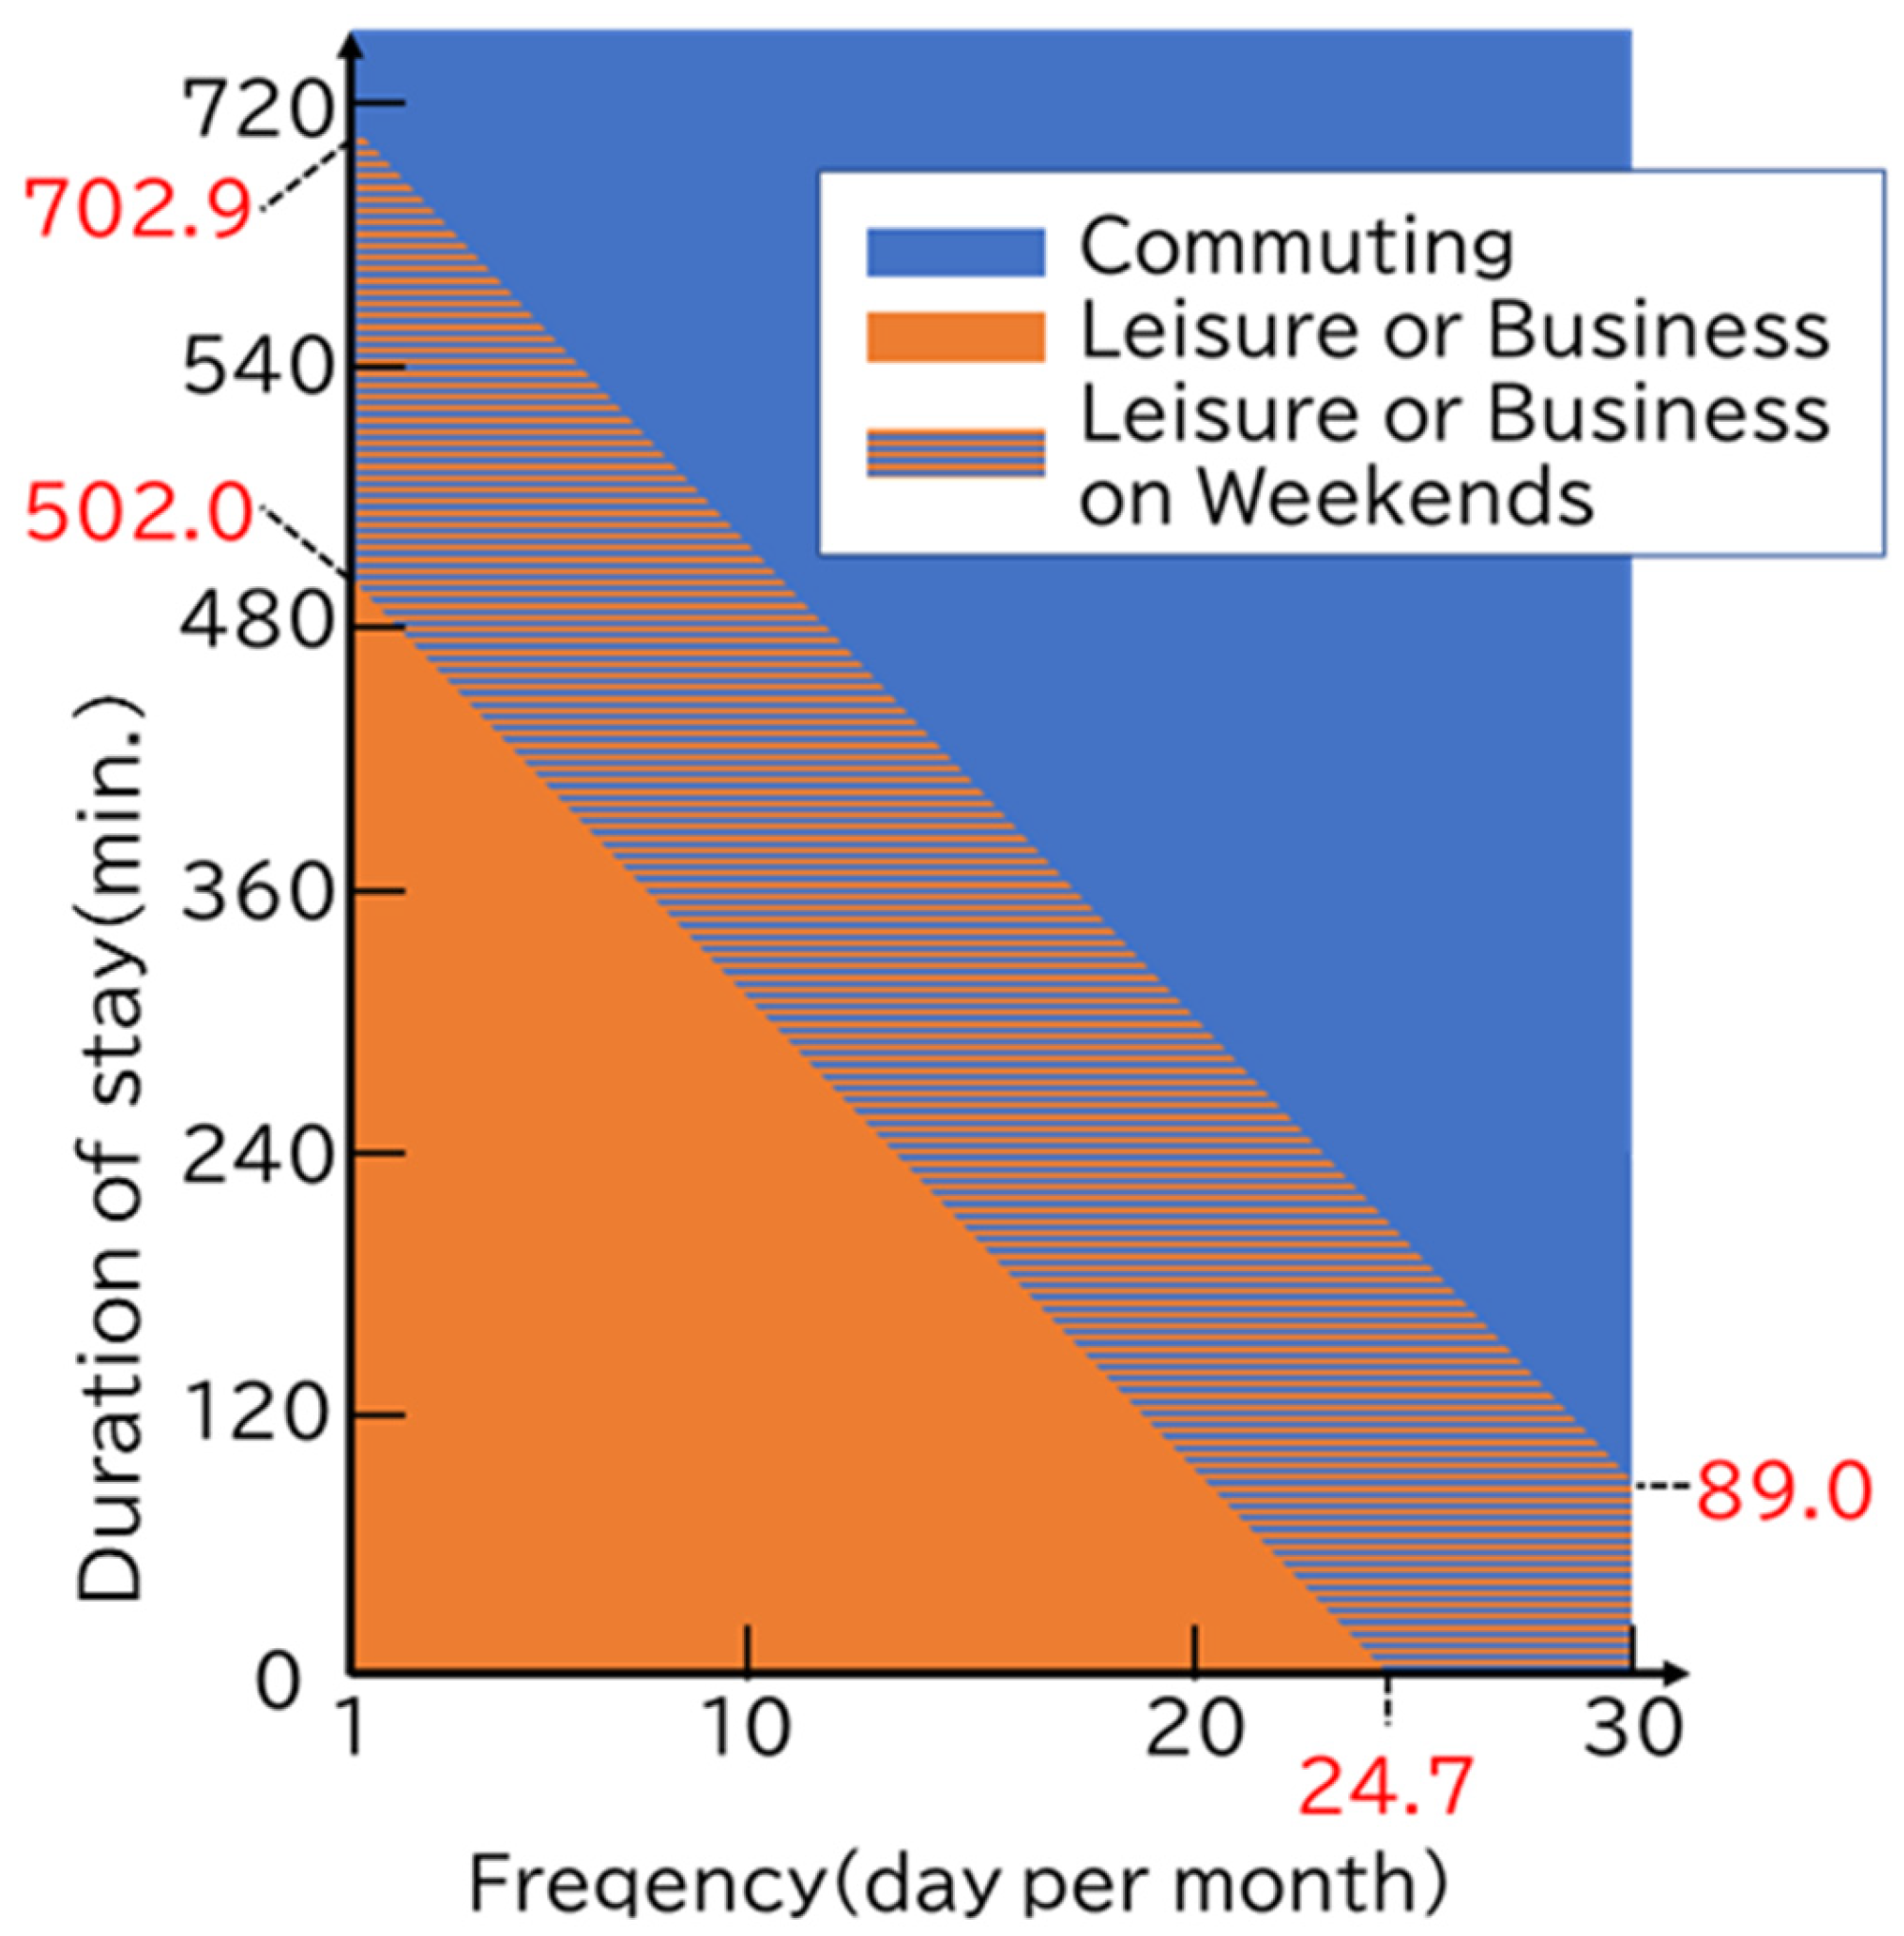
2.5. Purpose Prediction Method
2.6. Methods for Predicting Future Commuter Ridership
3. Results
3.1. Predicicting the Purpose of IC Card Data
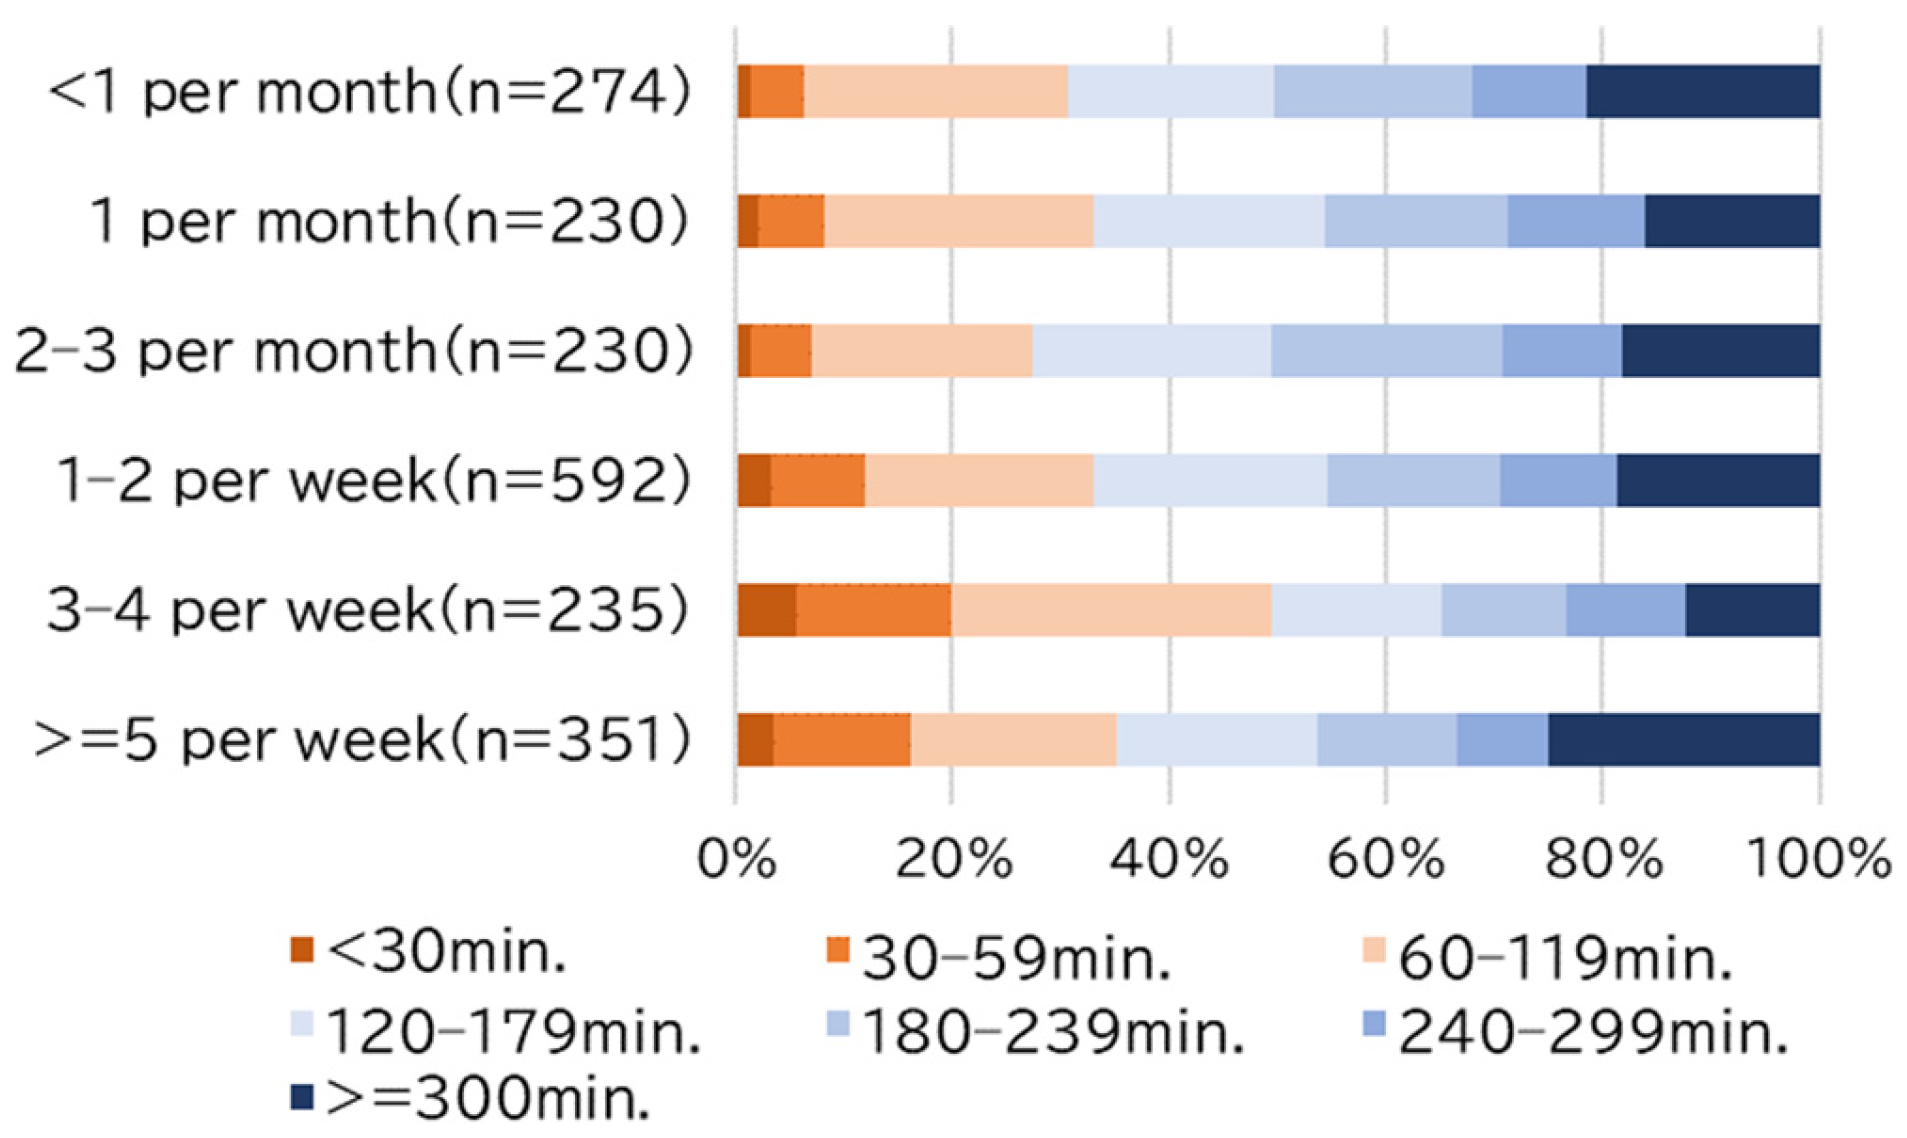
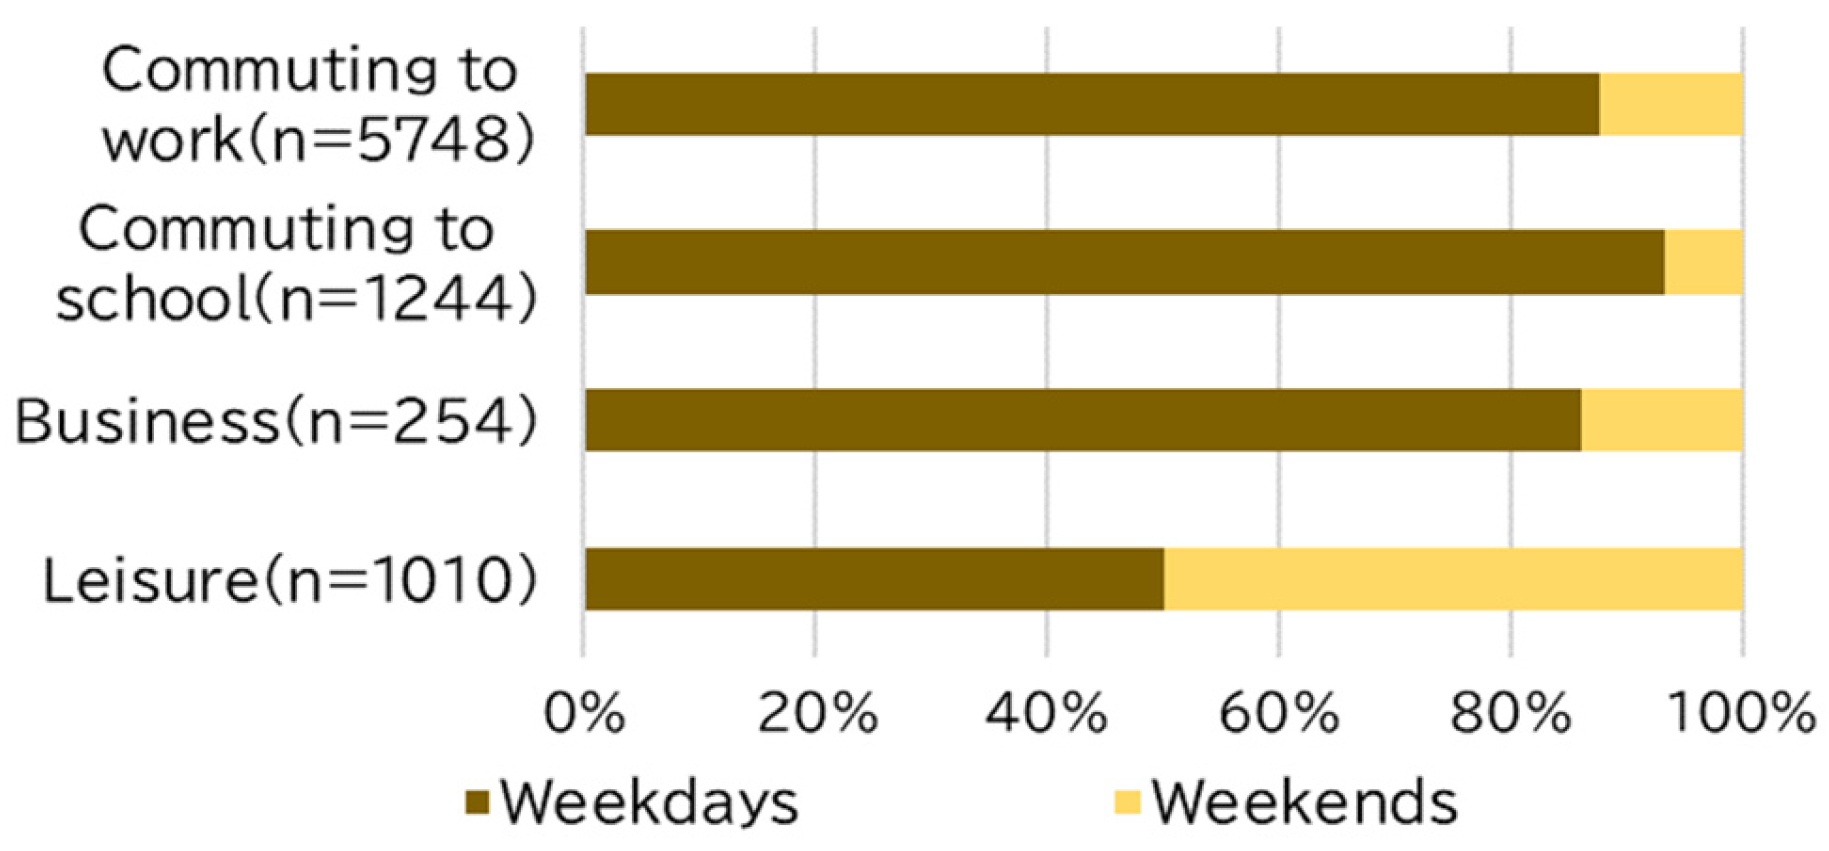
3.1.1. Duration of Stay, Frequency of Use, and Percentage of Use on Weekends in National PT
3.1.2. Linear Discriminant Analysis
3.1.3. Comparison of IC Card Data and User Survey
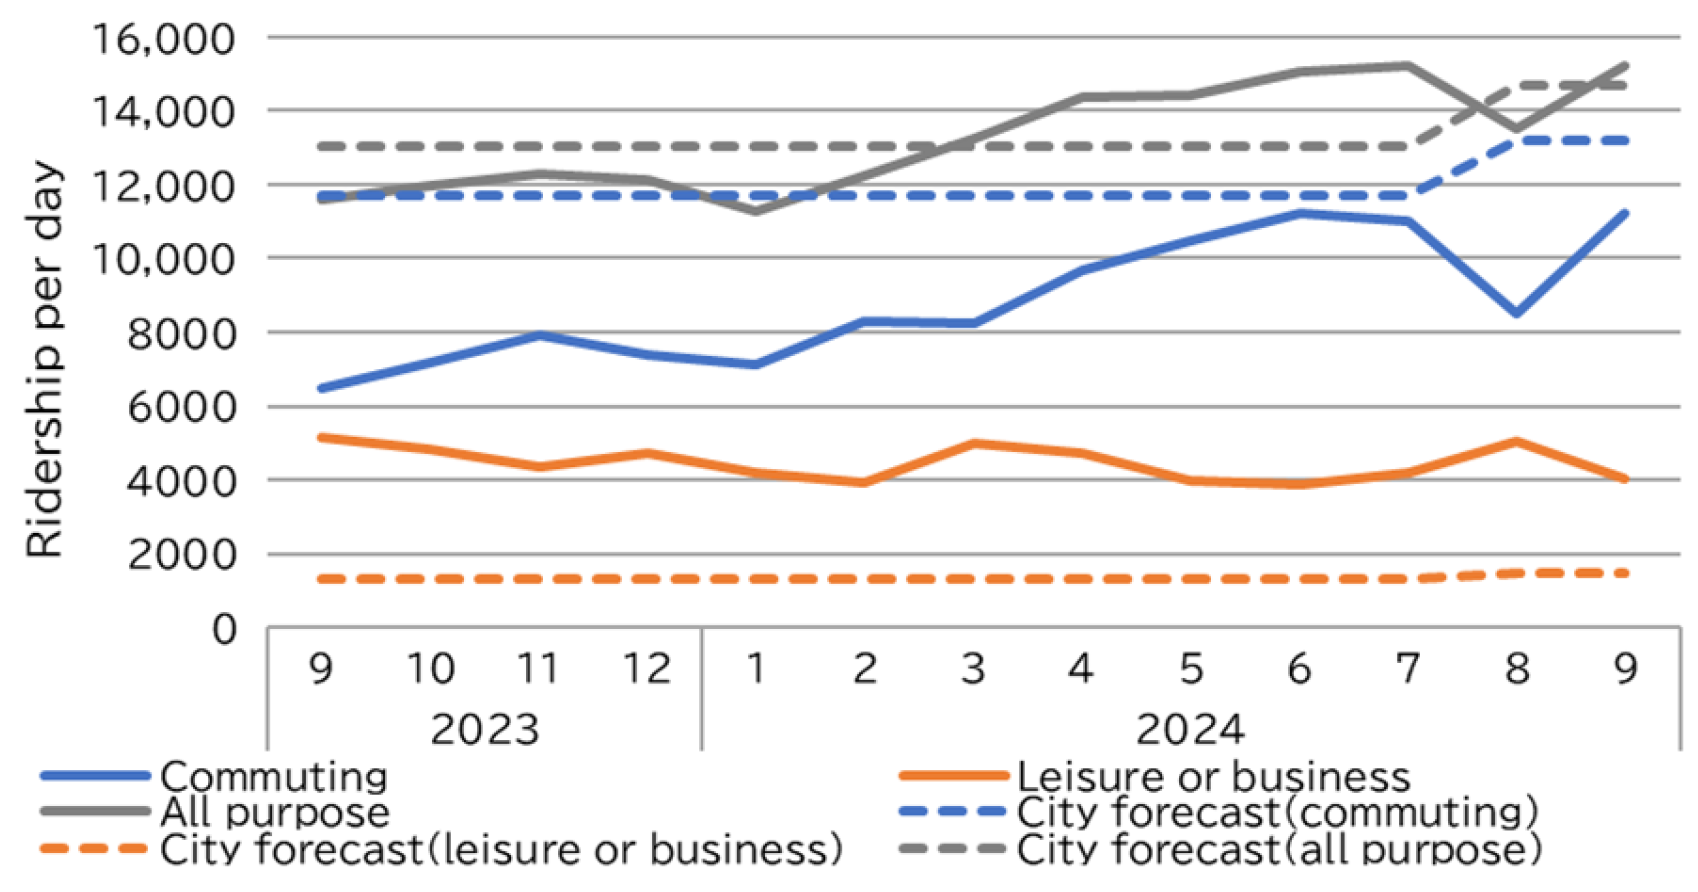
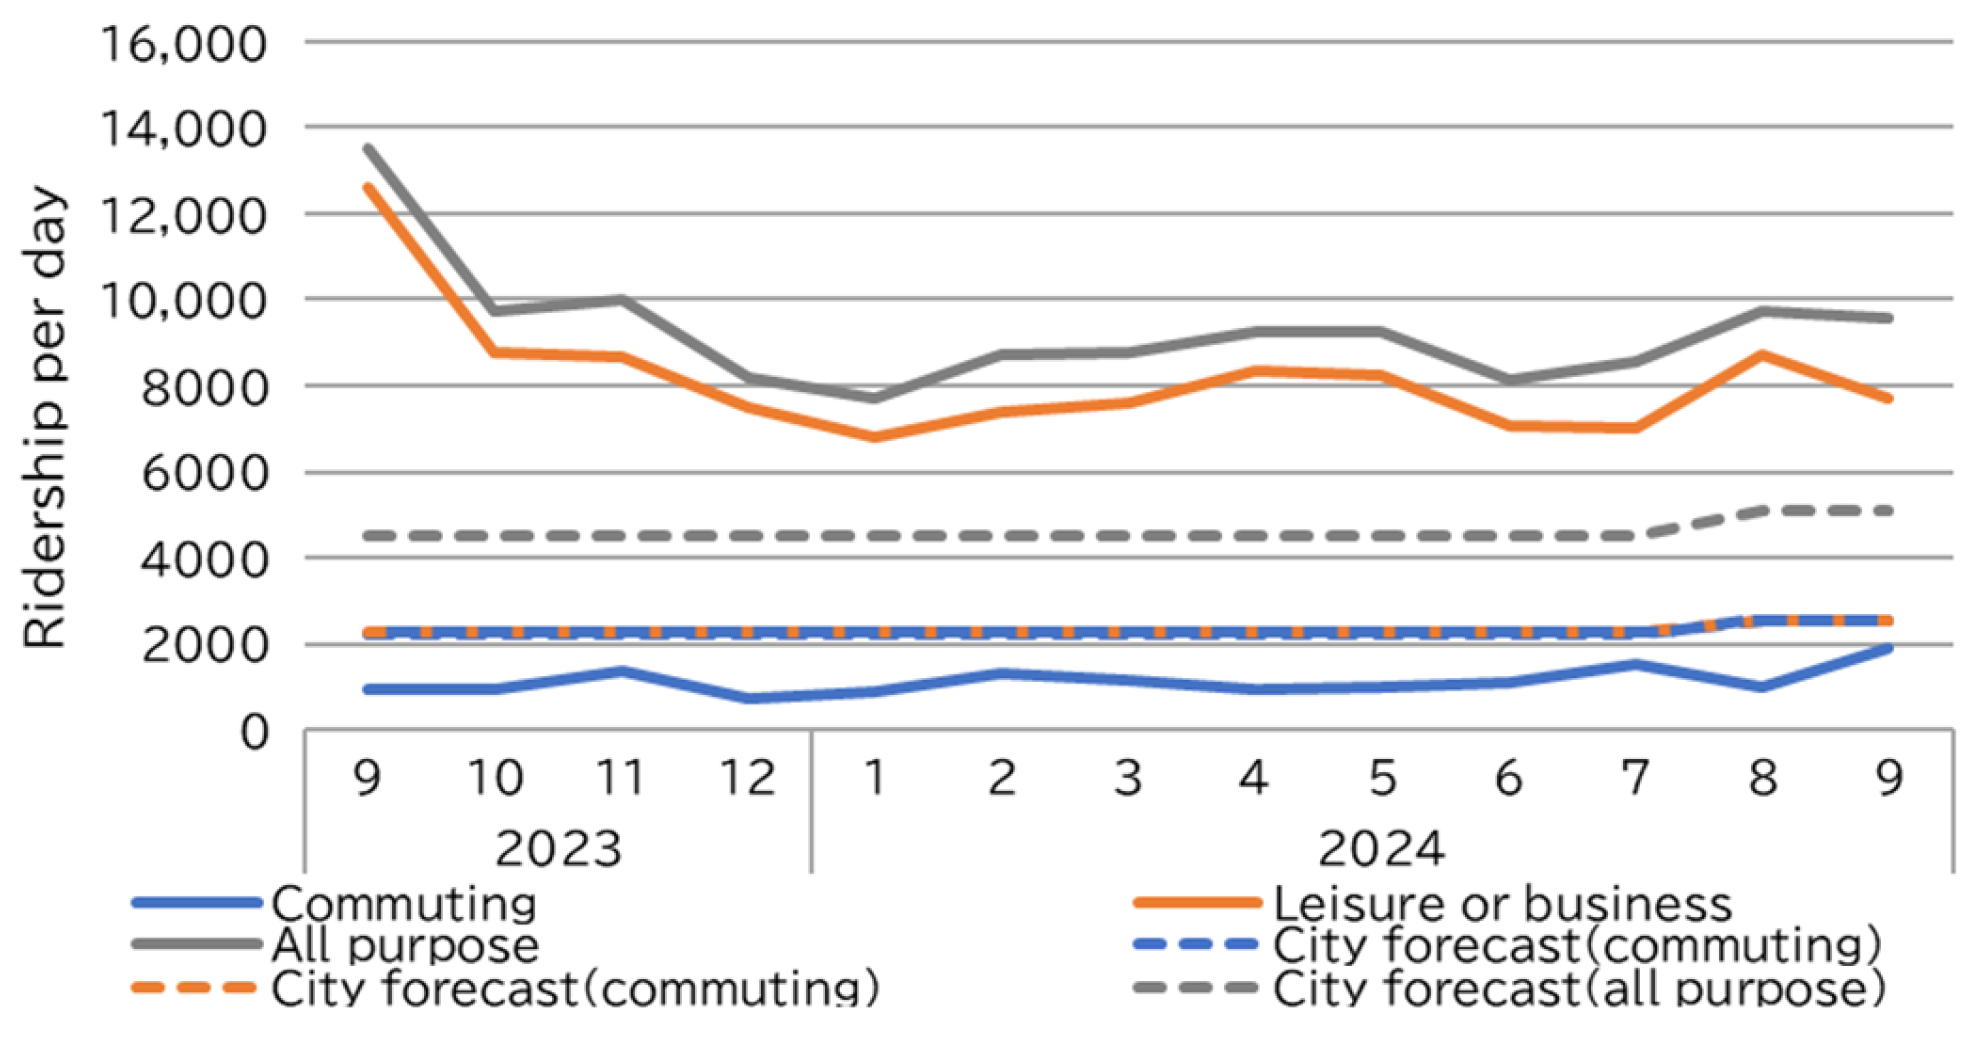
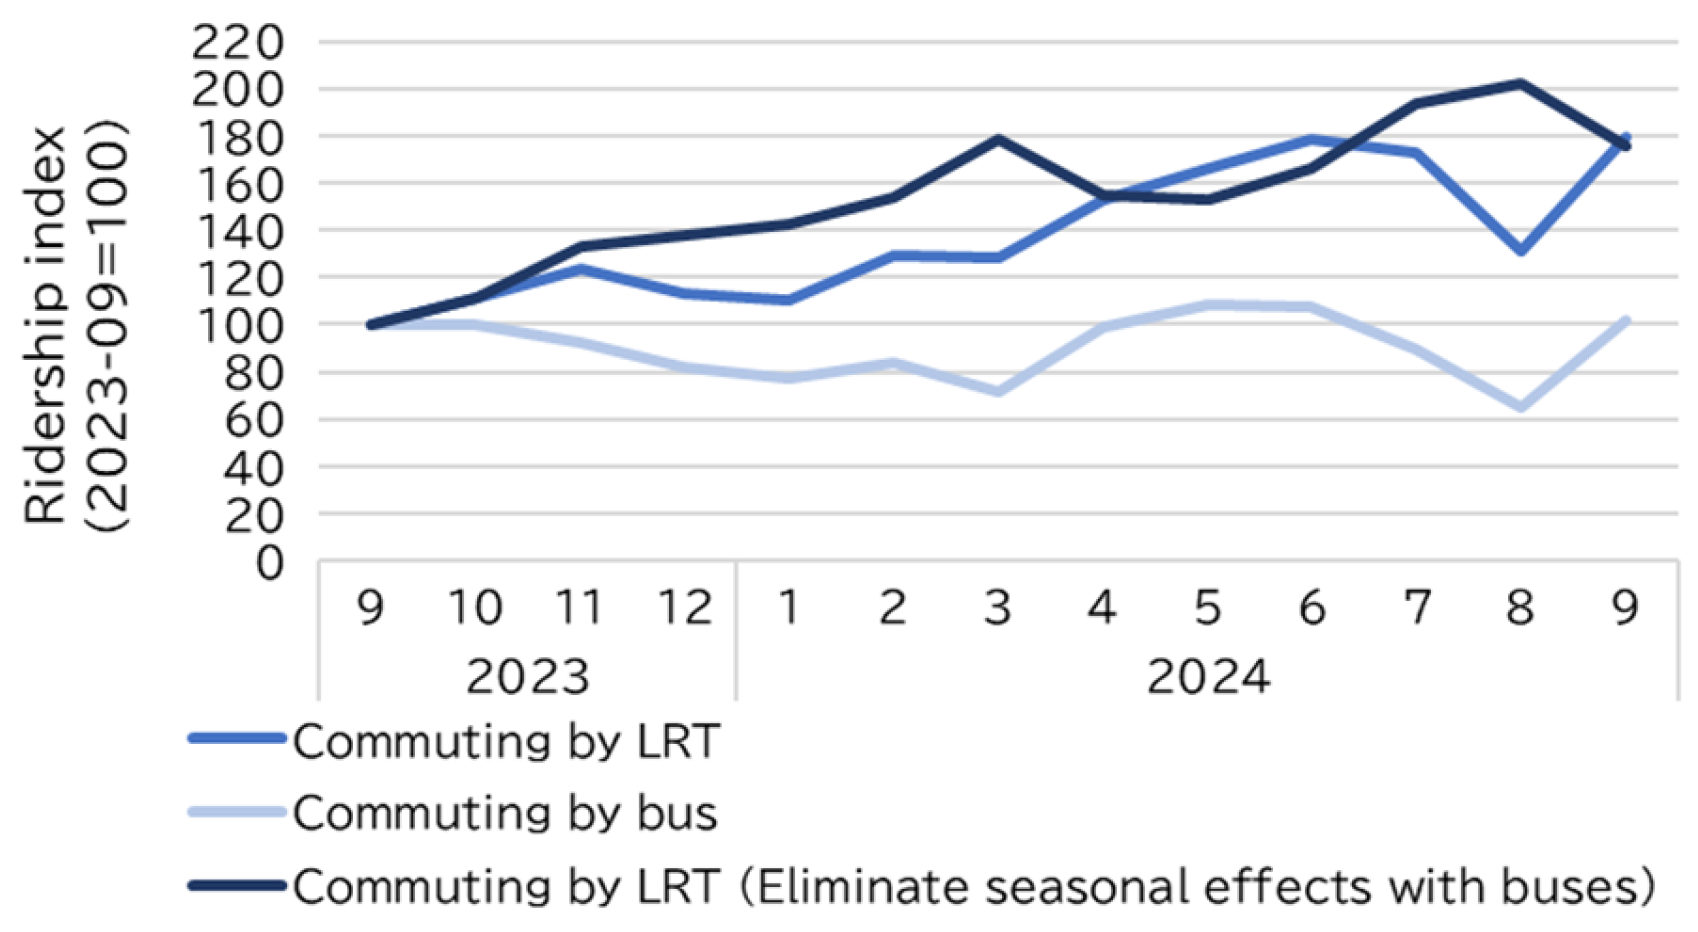
3.2. Changes in Commuting
3.2.1. Changes in Ridership by Purpose
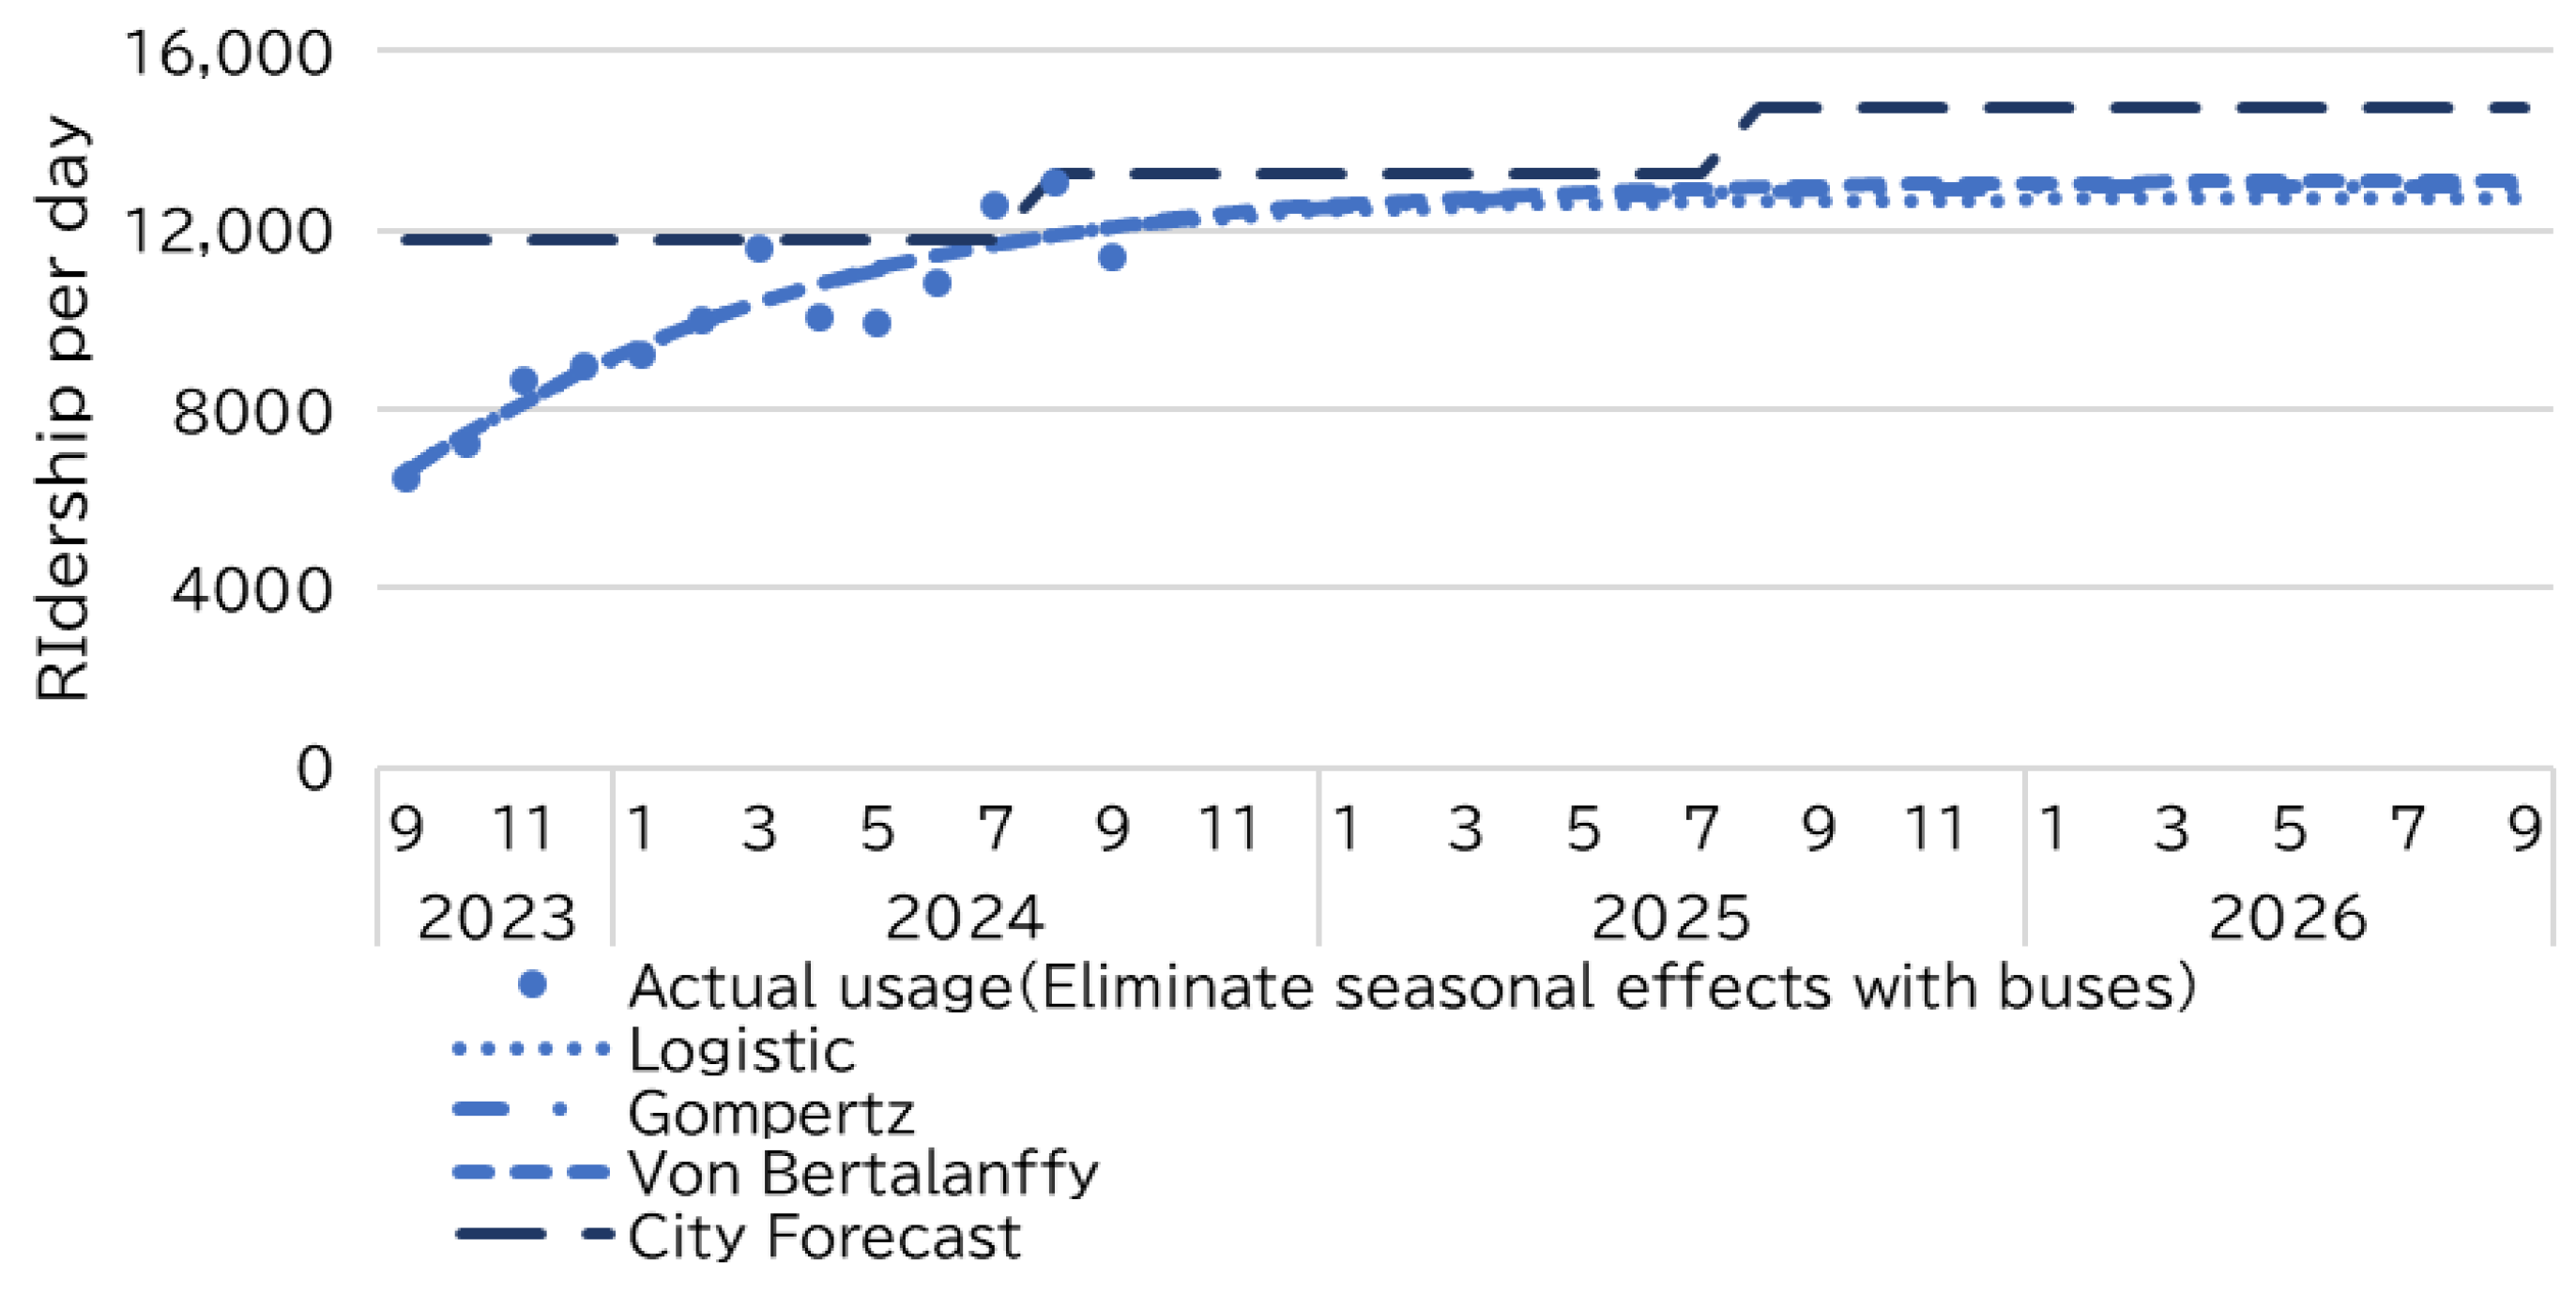
3.2.2. Predicting Commuter Ridership
4. Discussion
5. Conclusions
Author Contributions
Funding
Institutional Review Board Statement
Informed Consent Statement
Data Availability Statement
Acknowledgments
Conflicts of Interest
References
- The Global Tram and Light Rail Landscape 2019-21. Available online: https://cms.uitp.org/wp/wp-content/uploads/2023/06/Statistics_Brief_-LTR-update.pdf (accessed on 13 April 2025).
- Aoyama, Y. Introduction of LRT into Japan: Problems and Prospect. IATSS Rev. 2009, 34, 130–134. [Google Scholar]
- Status of LRT Introduction Consideration. Available online: https://racda-okayama.org/wp-content/uploads/2024/01/rsummit16-22-20p.pdf (accessed on 13 April 2025).
- 1st New Tramway System in 75 Years Opens North of Tokyo. Available online: https://www.asahi.com/ajw/articles/14990277 (accessed on 13 April 2025).
- Utsunomiya Tram’s Rejuvenation Achievements a Model for Other Cities. Available online: https://english.kyodonews.net/news/2024/09/5f262b48b0a3-utsunomiya-trams-rejuvenation-achievements-a-model-for-other-cities.html (accessed on 13 April 2025).
- Pickrell, D.H. A Desire Named Streetcar Fantasy and Fact in Rail Transit Planning. J. Am. Plan. Assoc. 1992, 58, 158–176. [Google Scholar] [CrossRef]
- Flyvbjerg, B.; Skamris Holm, M.K.; Buhl, S.L. How (In)accurate Are Demand Forecasts in Public Works Projects? The Case of Transportation. J. Am. Plan. Assoc. 2005, 71, 131–146. [Google Scholar] [CrossRef]
- Perry, J. Measuring the Accuracy of Bus Rapid Transit Forecasts. J. Public Transp. 2017, 20, 119–138. [Google Scholar] [CrossRef]
- Hoque, J.M.; Zhang, I.; Schmitt, D.; Erhardt, G.D. Are public transit investments based on accurate forecasts? An analysis of the improving trend of transit ridership forecasts in the United States. Transp. Res. Part A Policy Pract. 2024, 186, 104142. [Google Scholar] [CrossRef]
- Briand, A.S.; Côme, E.; Trépanier, M.; Oukhellou, L. Analyzing year-to-year changes in public transport passenger behaviour using smart card data. Transp. Res. Part C Emerg. Technol. 2017, 79, 274–289. [Google Scholar] [CrossRef]
- Goulet-Langlois, G.; Koutsopoulos, H.N.; Zhao, J. Inferring patterns in the multi-week activity sequences of public transport users. Transp. Res. Part C Emerg. Technol. 2016, 64, 1–16. [Google Scholar] [CrossRef]
- Hosoe, M.; Kuwano, M.; Moriyama, T. A method for extracting travel patterns using data polishing. J. Big Data 2021, 8, 13. [Google Scholar] [CrossRef]
- Alsger, A.; Tavassoli, A.; Mesbah, M.; Ferreira, L.; Hickman, M. Public transport trip purpose inference using smart card fare data. Transp. Res. Part C Emerg. Technol. 2018, 87, 123–137. [Google Scholar] [CrossRef]
- Medina, S.A.O. Inferring weekly primary activity patterns using public transport smart card data and a household travel survey. Travel Behav. Soc. 2018, 12, 93–101. [Google Scholar] [CrossRef]
- Kusakabe, T.; Asakura, Y. Behavioural data mining of transit smart card data: A data fusion approach. Transp. Res. Part C Emerg. Technol. 2014, 46, 179–191. [Google Scholar] [CrossRef]
- Moylan, E.; Kundu, D. Evidence of changes in travel behavior after the introduction of a new transit mode: Canberra’s light rail. Australas. Transp. Res. Forum Proc. 2022, 43. Available online: https://trid.trb.org/View/2259744 (accessed on 13 April 2025).
- Nishiuchi, H.; Kobayashi, Y.; Todoroki, T.; Kawasaki, T. Impact analysis of reductions in tram services in rural areas in Japan using smart card data. Public Transp. 2018, 10, 291–309. [Google Scholar] [CrossRef]
- Li, X.; Gao, Y.; Zhang, H.; Liao, Y. Passenger travel behavior in public transport corridor after the operation of urban rail transit: A random forest algorithm approach. IEEE Access 2020, 8, 211303–211314. [Google Scholar] [CrossRef]
- Meng, G. A study of short-term passenger flow forecasting for public transportation based on the time series method. Appl. Comput. Eng. 2024, 81, 92–97. [Google Scholar] [CrossRef]
- Nagaraj, N.; Gururaj, H.L.; Swathi, B.H.; Hu, Y.C. Passenger flow prediction in bus transportation system using deep learning. Multimed. Tools Appl. 2022, 81, 12519–12542. [Google Scholar] [CrossRef]
- Martí, P.; Ibáñez, A.; Julian, V.; Novais, P.; Jordán, J. Bus Ridership Prediction and Scenario Analysis through ML and Multi-Agent Simulations. Adv. Distrib. Comput. Artif. Intell. J. 2024, 13, e31866. [Google Scholar] [CrossRef]
- Du, B.; Peng, H.; Wang, S.; Bhuiyan, M.Z.A.; Wang, L.; Gong, Q.; Liu, L.; Li, J. Deep irregular convolutional residual LSTM for urban traffic passenger flows prediction. IEEE Trans. Intell. Transp. Syst. 2019, 21, 972–985. [Google Scholar] [CrossRef]
- Chang, J.S.; Chung, S.B.; Jung, K.H.; Kim, K.M. Patronage ramp-up analysis model using a heuristic f-test. Transp. Res. Rec. 2010, 2175, 84–91. [Google Scholar] [CrossRef]
- Flyvbjerg, B. Measuring inaccuracy in travel demand forecasting: Methodological considerations regarding ramp up and sampling. Transp. Res. Part A Policy Pract. 2005, 39, 522–530. [Google Scholar] [CrossRef]
- Kumar, M.Y.; Kumar, P.V. Demand shortfall in infrastructure construction projects: Case of rail projects in india. Faru Proc. 2017, 1, 112–122. [Google Scholar]
- Shinn, J.E.; Voulgaris, C.T. Ridership ramp-up? Initial ridership variation on new rail transit projects. Transp. Res. Rec. 2019, 2673, 82–91. [Google Scholar] [CrossRef]
- Toyama City: Compact City Development. Available online: https://openknowledge.worldbank.org/entities/publication/65068d5b-0048-5c40-9db6-c2d47e6668a6 (accessed on 13 April 2025).
- Cao, J.; Ermagun, A. Influences of LRT on travel behaviour: A retrospective study on movers in Minneapolis. Urban Stud. 2016, 54, 2504–2520. [Google Scholar] [CrossRef]
- Radzimski, A.; Gadziński, J. Impacts of light rail in a mid-sized city: Evidence from Olsztyn, Poland. J. Transp. Land Use 2021, 14, 821–840. [Google Scholar] [CrossRef]
- Lee, S.S.; Senior, M.L. Do light rail services discourage car ownership and use? Evidence from Census data for four English cities. J. Transp. Geogr. 2013, 29, 11–23. [Google Scholar] [CrossRef]
- Matsuda, M.; Odani, M.; Okuchi, T. Analysis of Introduction Effects of Light Rail Transit on Users’ Travel Behavior and Urban Revitalization-Based on the Results of Questionnaire Survey to Passengers. East. Asia Soc. Transp. Stud. 2009, 7, 225. [Google Scholar] [CrossRef]
- Overview of the Implementation Plan for Advanced Rail Transportation. Available online: https://www.city.utsunomiya.lg.jp/_res/projects/default_project/_page_/001/012/233/160926jisshikeikakugaiyou.pdf (accessed on 13 April 2025).
- Cherwony, W.; Polin, L. Forcasting Patronage on New Transit Routes. Traffic Q. 1977, 31, 287–295. [Google Scholar]
- Rayaprolu, H.; Levinson, D. Co-evolution of public transport access and ridership. J. Transp. Geogr. 2024, 116, 103844. [Google Scholar] [CrossRef]
- Liu, L.; Miller, H.J.; Scheff, J. The impacts of COVID-19 pandemic on public transit demand in the United States. PLoS ONE 2020, 15, e0242476. [Google Scholar] [CrossRef]


| Commute to Work | Commute to School | Business | Leisure | All Purpose | |
|---|---|---|---|---|---|
| Number of passengers on weekdays | 13,357 | 1305 | 274 | 1382 | 16,318 |
| Number of passengers on weekends | 2671 | 131 | 82 | 2764 | 5648 |
| Target line | Haga Utsunomiya LRT |
| Data period | 26 August 2023–30 November 2024 |
| Target users | All users of transportation IC cards, including Totra |
| IC card usage rate | Weekdays: 95%, weekends: 88% |
| Items used in this thesis | Individual ID, boarding/disembarkation time, boarding/getting off station |
| Target | User of Haga Utsunomiya LRT (Distributed at stations) |
| Number of distributions and respondents | Distributions: 6800 Respondents: 1305 |
| Distribution period | 29 November 2023–1 December 2023 |
| Response period | 29 November 2023–28 December 2023 |
| Items used in this thesis | Purpose, Boarding and drop-off station |
| Section | 8.056 | |
| Coefficient | Duration of stay (min.) | −0.015 |
| Frequency (day per month) | −0.326 | |
| Weekends dummy variables | 3.094 | |
| Model evaluation | Accuracy | 0.91 |
| Recall | 0.93 | |
| Precision | 0.91 | |
| F-measure | 0.92 | |
| Logstic | Gompertz | Von Bertalanffy | |
|---|---|---|---|
| Formula | |||
| Parameter | L: 12,702 k: 0.233 t0: −0.479 | L: 12,955 k: 0.672 r: 0.184 | L: 13,128 k: 0.168 t0: −9.47 |
| 95% confidence interval | L: (9835, 15,570) k: (0.012, 0.455) t0: (−2.363, 1.405) | L: (9429, 16,561) k: (0.424, 0.920) r: (−0.022, 0.390) | L: (9216, 17,040) k: (−0.034, 0.369) t0: (−19.912, 0.965) |
| R2 | 0.845 | 0.847 | 0.848 |
| RMSE | 733 | 727 | 726 |
| MAE | 603 | 593 | 590 |
| AIC | 69.06 | 68.86 | 68.80 |
| BIC | 70.75 | 70.56 | 70.50 |
Disclaimer/Publisher’s Note: The statements, opinions and data contained in all publications are solely those of the individual author(s) and contributor(s) and not of MDPI and/or the editor(s). MDPI and/or the editor(s) disclaim responsibility for any injury to people or property resulting from any ideas, methods, instructions or products referred to in the content. |
© 2025 by the authors. Licensee MDPI, Basel, Switzerland. This article is an open access article distributed under the terms and conditions of the Creative Commons Attribution (CC BY) license (https://creativecommons.org/licenses/by/4.0/).
Share and Cite
Tomioka, H.; Mangelson, C.; Morimoto, A. Research on the Increase in Commuter Use Immediately After the Opening of LRT Using IC Card Data. Future Transp. 2025, 5, 88. https://doi.org/10.3390/futuretransp5030088
Tomioka H, Mangelson C, Morimoto A. Research on the Increase in Commuter Use Immediately After the Opening of LRT Using IC Card Data. Future Transportation. 2025; 5(3):88. https://doi.org/10.3390/futuretransp5030088
Chicago/Turabian StyleTomioka, Hidetora, Connor Mangelson, and Akinori Morimoto. 2025. "Research on the Increase in Commuter Use Immediately After the Opening of LRT Using IC Card Data" Future Transportation 5, no. 3: 88. https://doi.org/10.3390/futuretransp5030088
APA StyleTomioka, H., Mangelson, C., & Morimoto, A. (2025). Research on the Increase in Commuter Use Immediately After the Opening of LRT Using IC Card Data. Future Transportation, 5(3), 88. https://doi.org/10.3390/futuretransp5030088