1. Introduction
Vehicle-to-grid (V2G) technology, first proposed by Kempton and Steven [
1], has opened new frontiers in both sustainable mobility and renewable energy management. By enabling bidirectional electric energy transfer between the power grid and electric vehicles (EVs), V2G transforms EVs from passive energy consumers into active energy resources. Through the integration of renewable energy sources, electric vehicles not only reduce overall carbon footprints, but also help stabilise the grid by feeding surplus energy back into the grid during peak demand periods. This dual role of EVs as both transport devices and distributed energy stores (DESs) is particularly compelling in the broader context of decarbonisation, a key objective for governments and institutions worldwide.
In addition to this, the urgency of the shift toward sustainable energy solutions is underscored by accelerating urbanisation trends, with urban populations projected to exceed 68% by 2050 [
2]. As cities grow, the demand for efficient and cleaner transport intensifies, prompting stakeholders to explore EV adoption more aggressively, heightening the importance of effective EV battery management strategies, particularly V2G. The European Union (EU) exemplifies this challenge, where the rapid expansion of urban areas and rising energy needs emphasise the necessity of innovative approaches to energy production and distribution. The EU “Fit for 55” policy framework further amplifies this challenge by aiming to phase out internal combustion engine vehicles (ICEs) by 2035 [
3]. This directive not only advances the phasing out of traditional vehicles (TVs) but also foreshadows a significant surge in electricity consumption, heightening the importance of effective EV battery management strategies, particularly V2G.
Recent studies indicate that a substantial portion of urban travel consists of short trips, often less than 5 km, leading vehicles to be parked for extensive periods, commonly 6–8 h daily [
4]. In many large European cities, private car usage remains prevalent for such systematic travel (e.g., home–work or home–school), contributing to traffic congestion and environmental pollution via heightened CO, CO
2, and NH
3 emissions [
5,
6]. By contrast, electrifying these trips and harnessing the inherent downtime of parked vehicles creates an opportunity to leverage idle battery capacity for grid services. Specifically, when EVs are parked and plugged in, they can charge during off-peak hours and discharge back to the grid during peak demand, providing ancillary services that balance energy supply and demand. This strategy not only promotes the localised consumption of renewable energy, such as solar photovoltaic (PV) generation, but also reduces reliance on rapid ramp-ups from conventional power plants, thereby advancing broader goals of urban decarbonisation.
University campuses around the globe are implementing and promoting cutting-edge technology to meet the Sustainable Development Goals (SDGs) [
7], and in this context V2G emerges as a particularly promising technology that could be deployed on campuses. First, they often concentrate a large number of vehicles within a compact geographic area. Second, faculty, staff, and students typically maintain predictable schedules, resulting in extended parking durations conducive to both charging and discharging cycles without compromising mobility needs [
8]. Universities also tend to have a substantial energy demand of up to 71.34 kWh/m
2 annually [
9], driven by academic buildings, laboratories, and campus facilities. Coupling V2G services with campus-based renewable energy assets can substantially reduce operational costs and environmental impacts, transforming EV batteries into a flexible energy resource for on-site load management. Furthermore, by harnessing systematic travel behaviours, such as consistent arrival and departure times, campus-based V2G initiatives can serve as a scalable model for other large institutions, including corporate campuses, government complexes and residential communities.
Against this backdrop, the paper proposes a novel V2G strategy at the University of Rome Tor Vergata campus. By using high-resolution floating car data (FCD), this approach identifies and manages EVs parked on-site, accurately estimating surplus battery capacity for grid support while respecting the primary mobility requirements of vehicle owners. A real-time algorithm operates on a half-hour schedule, determining each EV’s essential battery charge for its next trip and calculating the remaining capacity available for grid stabilisation. This spatial–temporal framework is further enhanced by advanced time-series forecasting models, specifically auto-regressive integrated moving average (ARIMA) and long short-term memory (LSTM) models, to predict daily energy transfer. Compared to conventional regression approaches, which are insufficient due to their failure to capture the crucial temporal dependencies inherent in the data, such as autocorrelation (where the value at one time-step depends on previous time-steps), ARIMA and LSTM methods offer higher accuracy and more granular insights into how much energy can be fed back into the grid across varying weekdays and seasonal conditions.
Although the FCD used in this study was drawn from a general sample population rather than a dedicated pool of EV users that are associated with the campus community, the findings suggest that campus-based V2G can cover a substantial fraction of local energy needs under realistic mobility conditions. In practical terms, this means that even with conservative estimates of EV adoption among university commuters, a significant level of grid support can be achieved without disrupting driver convenience. Beyond the campus setting, these results have direct implications for grid operators, policymakers, and energy aggregators, illuminating how small-scale V2G pilots can evolve into robust, system-wide implementations.
In this context, this paper mainly contributes to the literature through (1) the development of a comprehensive, data-driven V2G framework, which exploits the opportunities offered by FCD for revealing travel patterns and then forecasting the energy scheduling; (2) the validation of this framework using a large, real-world dataset in a university campus microgrid setting; and (3) a comparative evaluation of linear (ARIMA) and nonlinear forecasting models (LSTM), demonstrating the practical advantages of LSTM for this application.
The remainder of this paper is structured as follows:
Section 2 reviews the foundations of V2G and the relevant literature.
Section 3 presents the methodology for forecasting and predicting transferred energy to the grid, detailing how high-resolution FCD is utilised to schedule energy transfers.
Section 4 discusses the implementation details and a case study at the University of Rome Tor Vergata campus, illustrating real-time scheduling and predictive analytics. Finally,
Section 5 concludes the paper by summarising key findings and outlining potential avenues for future research.
2. Background
Recently, the push towards EV adoption globally is highlighted as a primary solution to reduce greenhouse gas and pollutant emissions originating from the transportation sector, as EVs are seen as a form of sustainable transportation for people and goods [
10,
11]. Major industrial countries with higher transport emissions have paved the way by implementing incentives and technological advancements supporting the widespread adoption of EVs and have paved their future strategy towards 100% zero-emission vehicles by 2050 [
12,
13]. In the context of urban transport, EVs are equipped with relatively large-capacity batteries with respect to their everyday use, as the average trip distance by cars is less than 5 km. Additionally, some statistics show that vehicles spend more time parked than driving. For example, in America, only 5% of cars are on the road, while more than 90% of private cars are parked [
14]. With large batteries, the increasing number of electric vehicles could potentially cause a significant increase in electricity demand during peak hours, threatening the economic and secure operation of the grid [
15]. To address this issue, V2G technology was introduced with the aim to use the energy stored in the EV batteries to stabilise the electricity grid [
16,
17]. Therefore, EVs can serve as DESs by providing a range of services for the power grid such as frequency regulation and spinning reserve [
18]. On the other hand, some incentives can be distributed to EV owners for providing grid services. For V2G services to succeed, EV users’ mobility patterns should be considered, which are based on key parameters such as travelling/charging time, charging location, parking time, travelling distance, and required charging energy. Moreover, such characteristics should be detailed in terms of temporal, spatial, and energy usage/consumption [
19]. Modelling EV behaviour presents significant challenges, particularly in predicting charging and discharging demand, as well as scheduling. EV usage can be understood through activities such as travelling, parking, and charging. Factors that influence charging and discharging demand include trip characteristics (the number of trips, trip distances, and energy consumption), and the availability of charging infrastructure (parking location, time limits for charging/discharging, and parking duration) [
20,
21]. To accurately predict charging/discharge demand, it is essential to estimate spatial and temporal patterns, including location, timing, frequency, and energy needs for charging activities. The charging behaviour of electric vehicles can be identified directly from charging profiles or indirectly inferred from travel and parking patterns, all of which reveal usage patterns related to spatial, temporal, and energy consumption. The spatial–temporal profile encompasses the timing and locations of EV activities, such as parking, driving, and charging, providing insights into travel patterns, destinations, charging points, and sociodemographic POIs. This profile is modelled using methods such as origin–destination analysis, trip chain generation, and extended time Markov chain models to study spatial–temporal vehicle states comprehensively [
22,
23]. Integrating energy consumption into this profile is crucial for accurately predicting EV charging demand, as energy usage complements the spatial–temporal profile by defining the energy requirements of charging activities. However, concerns about battery degradation remain a significant challenge for the large-scale adoption of V2G, as in V2G systems, meeting fluctuating power demands requires the frequent charging and discharging of electric vehicles [
24]. Frequent charging and discharging can accelerate battery ageing, impacting its overall lifespan and creating concerns for EV owners that should be addressed to ensure widespread participation and mitigate the risk associated with the battery degradation. It is also crucial to address economic concerns to encourage full participation [
25]. Privacy and security issues also pose significant barriers to the widespread adoption of V2G, as users are required to share sensitive data, such as charging locations, plugging/unplugging times, vehicle states, and battery state of charge (SoC), with EV aggregators for optimal scheduling, and sharing such information exposes users to potential privacy risks [
26]. Therefore, implementing robust mitigation strategies, such as data anonymisation and secure aggregation protocols that protect user-specific information while still allowing for effective grid management, is critical for building user trust and ensuring system integrity.
The integration of V2G introduces significant uncertainties from renewable generation, energy prices, and EV availability patterns. Recent research has explored risk-averse energy management strategies to address these challenges. For integrated energy systems, approaches like conditional value-at-risk (CVaR) combined with decentralised optimisation have shown promise in limiting operational risks while respecting privacy constraints [
27]. Similar risk-averse frameworks could enhance V2G scheduling resilience against market volatility and grid instability [
28].
The multi-stakeholder nature of V2G (EV owners, aggregators, and grid operators) necessitates fair cooperation mechanisms. Asymmetric Nash bargaining methods have emerged as effective tools for profit distribution in multi-agent energy systems [
29]. By quantifying contributions and bargaining power, these approaches enable equitable revenue sharing that incentivizes participation while maintaining operational efficiency. Such cooperative models could resolve key economic barriers in V2G adoption.
3. Methodology
The proposed methodology, shown in
Figure 1, integrates spatial–temporal analysis, real-time scheduling, and predictive modelling to identify suitable areas to implement V2G services using large amounts of FCD based on [
30,
31]. The approach involves four interrelated steps:
vehicle trip detection; initially, FCD is used to capture detailed travel patterns such as vehicle type, parking duration, travel distance, and trip purpose by distinguishing between short-distance and long-distance trips; this step helps identify the type of vehicles most likely to stay for extended periods, allowing for effective V2G utilisation without compromising primary mobility needs;
spatial identification of V2G hub on the campus; secondly, by focusing on spatially identifying areas where V2G services can be effectively deployed, using FCD, potential and actual V2G operation points are mapped; in this study, the University of Rome Tor Vergata campus, designed as a university city model, serves as a case study; the campus has unique characteristics, including high vehicle turnover and centralised infrastructure, that make it an ideal candidate for V2G implementation;
real-time scheduling algorithm for V2G services; this step manages energy transfers over discrete time slots while respecting mobility constraints and grid demands; key factors include maintaining permissible SoC levels, aligning transfers with vehicle arrival and departure times, accounting for charging/discharging infrastructure capacities, and synchronising with grid demand at each time interval; by balancing these constraints, the algorithm maximises the total energy transferred to the grid without disrupting users’ travel requirements;
predictive modelling of transferred energy; the final step involves predicting the transferred energy to the grid, using advanced forecasting models; both ARIMA and LSTM models are employed for one-step-ahead energy transfer predictions; these models incorporate historical data, grid demand patterns, and EV usage trends to provide accurate forecasts.
The proposed methodology outlines an innovative approach to integrating V2G services at the University of Rome Tor Vergata campus through four interlinked steps. First, large-scale FCD is harnessed to characterise vehicle movements, trip types, parking durations, and travel distances, identifying vehicles that are most likely to remain parked for extended periods and can serve the V2G network without affecting owners’ mobility. Second, spatial analysis is performed to identify potential V2G parking zones within the campus, a campus city model with centralised and high-density parking facilities ideal for energy aggregation. In the third step, a real-time scheduling algorithm is introduced to manage energy transfer timing, ensuring optimal grid support while respecting the constraints of vehicle availability, SoC, charging infrastructure, and grid needs. Lastly, predictive ARIMA and LSTM models are utilised for forecasting energy transfers based on historical mobility data, enabling more precise energy flow predictions and enhancing the overall efficiency of the V2G system. These four steps collectively facilitate a seamless, scalable V2G implementation that balances energy supply with mobility demands, positioning the university campus as a viable model for broader energy management solutions.
3.1. Vehicle Trip Detection and Spatial Identification at the Campus
The first step in the proposed methodology focuses on vehicle trip detection through FCD. This step, which is based on [
32,
33,
34], is critical for reconstructing vehicle trip chains, identifying vehicle arrival and departure times at the University of Rome Tor Vergata campus, and estimating the travelled distance till reaching the campus and the travelled distance after departure from the campus.
FCD is collected from probe vehicles equipped with on-board units (OBUs), which record various attributes, including vehicle position, travel time, engine status, and trip details. The ability to track individual vehicle trips allows us to model mobility patterns and assess the potential energy available for grid transfer without disrupting mobility needs. While individual FCD records can be prone to errors, the large volume of the dataset used in this study helps to mitigate the impact of outliers. The trip reconstruction methodology further ensures data quality by filtering out illogical or incomplete records, leading to a robust representation of mobility patterns.
FCD provide high-resolution data on vehicle movement, allowing for the reconstruction of travel patterns, and includes anonymised vehicle ID, trip start and end time and date, geo-referenced position, and distance travelled, as shown in
Table 1.
Utilising the FCD data for the reconstruction of the trip chains by linking trips with the same anonymised vehicle ID, meaning that the destination of one trip becomes the origin of the next, and vehicles are tracked over multiple trips until the end of the observed day to determine total travelled distance before and after parking in the V2G lot at the university campus. Such an operation impacts the SoC, determines energy availability for V2G services, and ensures vehicles retain enough charge for subsequent mobility for the rest of the trip chain on the observed day.
The parking duration at the university campus is crucial for estimating the energy that can be transferred to the grid. The proposed procedure uses the arrival and departure times to determine the duration available for V2G services and is expressed as follows:
where
is the parking duration of EV at a given parking slot;
is the departure time of EV from the given parking lot;
is the arrival time of EV at the given parking lot.
Since the dataset includes both internal combustion vehicles (ICVs) and EVs, the conversion to EVs is necessary. Because EV battery capacity and energy consumption depend on vehicle type and class, a methodology adapted from [
35] is used to convert ICVs to EV-equivalent energy consumption values. This is done using the vehicle segmentation shown in
Table 2.
3.2. Real-Time Scheduling Algorithm for V2G Services
The third step of the methodology involves implementing a dynamic scheduling algorithm to optimise energy transfer from aggregated EVs to the grid. The algorithm balances the grid energy demand, EV user mobility requirements, and charging infrastructure constraints. Furthermore, the algorithm operates across discrete time slots (30 min intervals) and is governed by four core principles (SoC, vehicle availability, infrastructure limitations, and grid demand).
In fact, the
SoC could be expressed as a function of the total charged battery capacity, the consumed energy before V2G participation, the energy transferred to the grid, and the reserved energy to be kept. The transferred energy to the grid depends on parking duration and the amount the EV user is willing to give, while the reserved energy can be quite arbitrary depending on EV user preferences; therefore, the
SoCi,t of vehicle
i at time slot
t can be expressed as follows:
where
is the state of charge of EV i at time slot , in percentage;
is the total charged battery capacity of EV i at time slot t;
is the consumed energy of EV i at time slot t before parking at the parking lot;
is the energy transferred to the grid by EV i at time slot t;
is the index of EVs charging and discharging (from 1 to I);
is the total number of EVs charging and discharging at the parking lot;
is the index of time slots (from 1 to T);
is the total number of time slots.
The energy consumed,
, can be calculated as a function of the travelled distance as follows:
where
is the total distance travelled by EV i at time slot t before arriving at the parking lot;
is the average energy consumption, measured in kWh per km for EV i at time slot t to travel a distance of 1 km.
The energy that can be expressed by vehicle
i can be calculated as a function of total travel time and the vehicle energy transfer rate as follows:
where
is the parking duration of EV i at time slot t;
is the rate of energy transferred to the grid via the bidirectional charging station.
The
vehicle availability constraint considers the arrival and departure times of EVs at parking lots to align energy transfers with vehicle availability; energy transfer is only allowed when the EV is parked for a significant time interval (e.g., more than 30 min). The
V2G infrastructure limitations account for constraints related to the charging and discharging capacity of V2G infrastructure, which is a function of the number of charging and discharging stations in that area and the maximum power limit of a station at any time:
where
is the energy transfer limit from the V2G parking at slot time t;
is the total number of charging–discharging stations;
is the charging and discharging energy transfer from station j at time slot t;
is the maximum charging and discharging energy transfer that could be transferred from the parking lot.
The
grid demand refers to the fact that the energy transferred to the grid should align with the grid demand at each time slot. This relationship can be expressed as a function where the scheduled transfer matches the grid’s needs:
where
is the grid energy demand during time slot
t.
The operational logic of the real-time scheduling algorithm is illustrated in
Figure 2. For each 30 min time slot, the algorithm iterates through every EV identified within the campus. It first checks vehicle availability by verifying that it is parked and its current SoC exceeds the minimum required level
. This value is set to preserve the driver’s future mobility needs. For each available vehicle, the algorithm calculates the maximum transferable energy for that time slot, ensuring the transfer respects all system constraints, including infrastructure capacity and overall grid demand. This amount is aggregated to a running total. Once all EVs have been processed, the final energy transfer for the time slot is recorded, and the algorithm proceeds to the next time slot.
The primary objective of the algorithm is to maximise the total energy transferred to the grid while ensuring EVs retain the minimum required SoC for future mobility. Energy transfers stay within infrastructure capacity, and the grid demand constraint is respected. This objective can be expressed as follows:
where
is the total energy transferred to the grid;
is the availability index of EV i at time slot t (binary, 1 if the EV is parked and available, otherwise 0);
is the energy transferred to the grid by EV i at time slot t.
The above maximization is subject to the following constrains:
- 1.
SoC; ensures each EV’s battery charge level remains within operational limits during V2G participation, and at the departure time, the has to meet the minimum level required for the EV i to complete its mobility requirements;
, the minimum permissible SoC to ensure EV owner mobility requirements,
, the maximum permissible SoC;
, the SoC of the departed EV i at time slot t, in percentage,
, the minimum SoC required for EV i to complete its daily routine;
- 2.
parking availability; it ensures that the vehicle will be parked for sufficient time to start the charging-discharging;
- 3.
infrastructure; it ensures that the instantaneous energy transfer at any time slot does not exceed the collective power rating of all charging/discharging stations; this respects hardware limitations (e.g., transformer/cable capacities);
- 4.
grid demand constraints; they mandate that the aggregate transferred energy to the grid during slot aligns with the grid real-time demand, i.e.,
The algorithm stability, particularly during periods of high demand, is inherently maintained by its core constraints. By strictly enforcing the minimum SoC level to protect user mobility and capping energy transfer to meet grid demand, the system is designed to balance user’s needs and grid stability in real-time. Furthermore, the algorithm incorporates several key features to enhance its functionality and effectiveness. It employs temporal scheduling to dynamically align energy transfers with grid demand and user mobility patterns, ensuring the efficient use of resources.
3.3. Predictive Modelling of the Transferred Energy
The final step in the methodology focuses on predicting the energy transferred to the grid from aggregated EVs using historical energy transfer data. This predictive modelling step is crucial for optimising energy scheduling, ensuring grid stability, and maximising total energy transfer. For this task, simple regression models are insufficient as they fail to capture the crucial temporal dependencies inherent in the data, such as autocorrelation (where the value at one time-step depends on previous time-steps). Therefore, more sophisticated time-series models were chosen by employing and comparing two powerful models for one-step-ahead prediction:
ARIMA; this model was selected as a robust
linear baseline; unlike simple regression, ARIMA is explicitly designed to model trends, seasonality, and autocorrelation by using past energy values and past forecast errors in its predictions, making it a standard for time-series analysis [
36];
LSTM; this advanced deep learning model was chosen to capture potential
complex nonlinear patterns that a linear model like ARIMA might miss. LSTMs excel at learning long-term dependencies in sequential data, which is ideal for modelling the complex dynamics of energy availability driven by daily human mobility patterns [
37].
These models were selected for their established efficacy in energy forecasting: ARIMA handles linear trends, while LSTM captures nonlinear complexities inherent in mobility-driven energy patterns. Comparative studies confirm their superiority over simpler regression models for temporal data [
38].
The predictive models will use only weekday historical energy transfer data at half-hour intervals, ensuring that predictions focus solely on recurring weekday energy transfer patterns and that exogenous variables (such as weekends, holidays, and weather conditions) do not influence the predictions.
ARIMA is a statistical model that combines autoregressive, differencing, and moving average components to predict future values based on past observations. The one-step-ahead prediction for energy transfer is obtained directly from past observations, and forecasts for longer time horizons are iteratively computed using estimated values.
The model is expressed as follows:
where
is the transferred energy at time slot t;
and are the number of autoregressive lags and the moving average term and were determined using optimisation criteria;
and are the model coefficients, which were estimated from the historical data;
is the white noise error term;
is a constant term.
LSTM is an RNN model designed to capture long-term dependencies in sequential data. Unlike ARIMA, which assumes linear relationships, LSTM can model complex nonlinear patterns in energy transfer dynamics.
The LSTM model processes a sequence of past transferred energy values and predicts the next step:
where
is the length function of LSTM network;
is the length of the input sequence, as per a day, it is 48.
To assess the effectiveness of ARIMA and LSTM, both models are trained exclusively on weekday data only, and their performance is compared using key evaluation metrics:
root mean squared error (RMSE) measures the deviation between the actual and predicted energy transfer values and , expressed as follows:
where
is the mean of actual transferred energy values.
4. Application to University of Rome Tor Vergata Campus
The methodology presented in the earlier section has been implemented at the campus of the University of Rome Tor Vergata. The University of Rome Tor Vergata is situated in the southeastern outskirts of the city. It comprises six main faculties (Economics, Law, Engineering, Humanities, Medicine and Surgery, and Mathematics, Physics and Natural Science). Each faculty is designed to cater to specific academic needs, with modern research facilities, labs, and lecture halls complemented by green spaces and historical buildings. This mix of old and new infrastructure provides a practical environment for piloting cutting-edge technologies in real-world settings. With a student population of 36,591 and a faculty and administrative staff of 2335, the Tor Vergata campus functions as a small university-city [
39].
In terms of transportation, the vast parking infrastructure of the campus, consisting of 5842 designated parking spots, reflects the significant daily commuting activity of students, faculty, and administrative personnel. The high parking demand and extended parking durations make the campus an optimal site for V2G services, where EVs can serve as temporary energy storage units, helping to regulate electricity demand and support grid stability.
Figure 3 outlines the university layout.
The six faculties have varying levels of parking capacity, with the school of Mathematics, Physics and Natural Science (Scienze MM.FF.NN.) offering the highest number of parking spots (1612) and the school of Humanities (Lettere e Filosofia) the lowest (360). On average, students park their vehicles for approximately 7.1 h per visit, while academic and administrative staff have longer parking durations, averaging 8.3 h [
40]. Staff in administrative offices and medical faculties tend to have even longer parking durations, as they follow fixed working hours with fewer interruptions compared to students. These prolonged parking periods align well with V2G requirements, as EVs need to remain stationary for long periods to effectively participate in controlled energy discharging and recharging cycles. An estimated 70–75% of parking spaces are occupied during peak hours, meaning that roughly 4000–4400 vehicles could be available for V2G participation each day [
40].
Table 3 summarises the university campus statistics and
Table 4 further classifies the university population.
Beyond the transport infrastructure, user acceptance is a critical factor for V2G implementation on the campus. Survey results on mobility patterns and EV adoption rates indicate that willingness to participate varies across faculties. Among students, the highest availability for V2G participation is observed in the school of Mathematics, Physics and Natural Science, at 75%, and the school of Engineering, at 71%, whereas the school of Humanities exhibits the lowest availability at 59%. Among administrative and academic staff, the willingness to participate is notably higher, especially among academic staff where availability reaches 77% as shown in
Table 5. It is important to note that these willingness percentages, sourced from a campus-specific survey, provide a preliminary estimate. A comprehensive adoption model would also require a deeper analysis of socio-demographic factors and the specific economic incentives offered to participants, which are valuable avenues for future research.
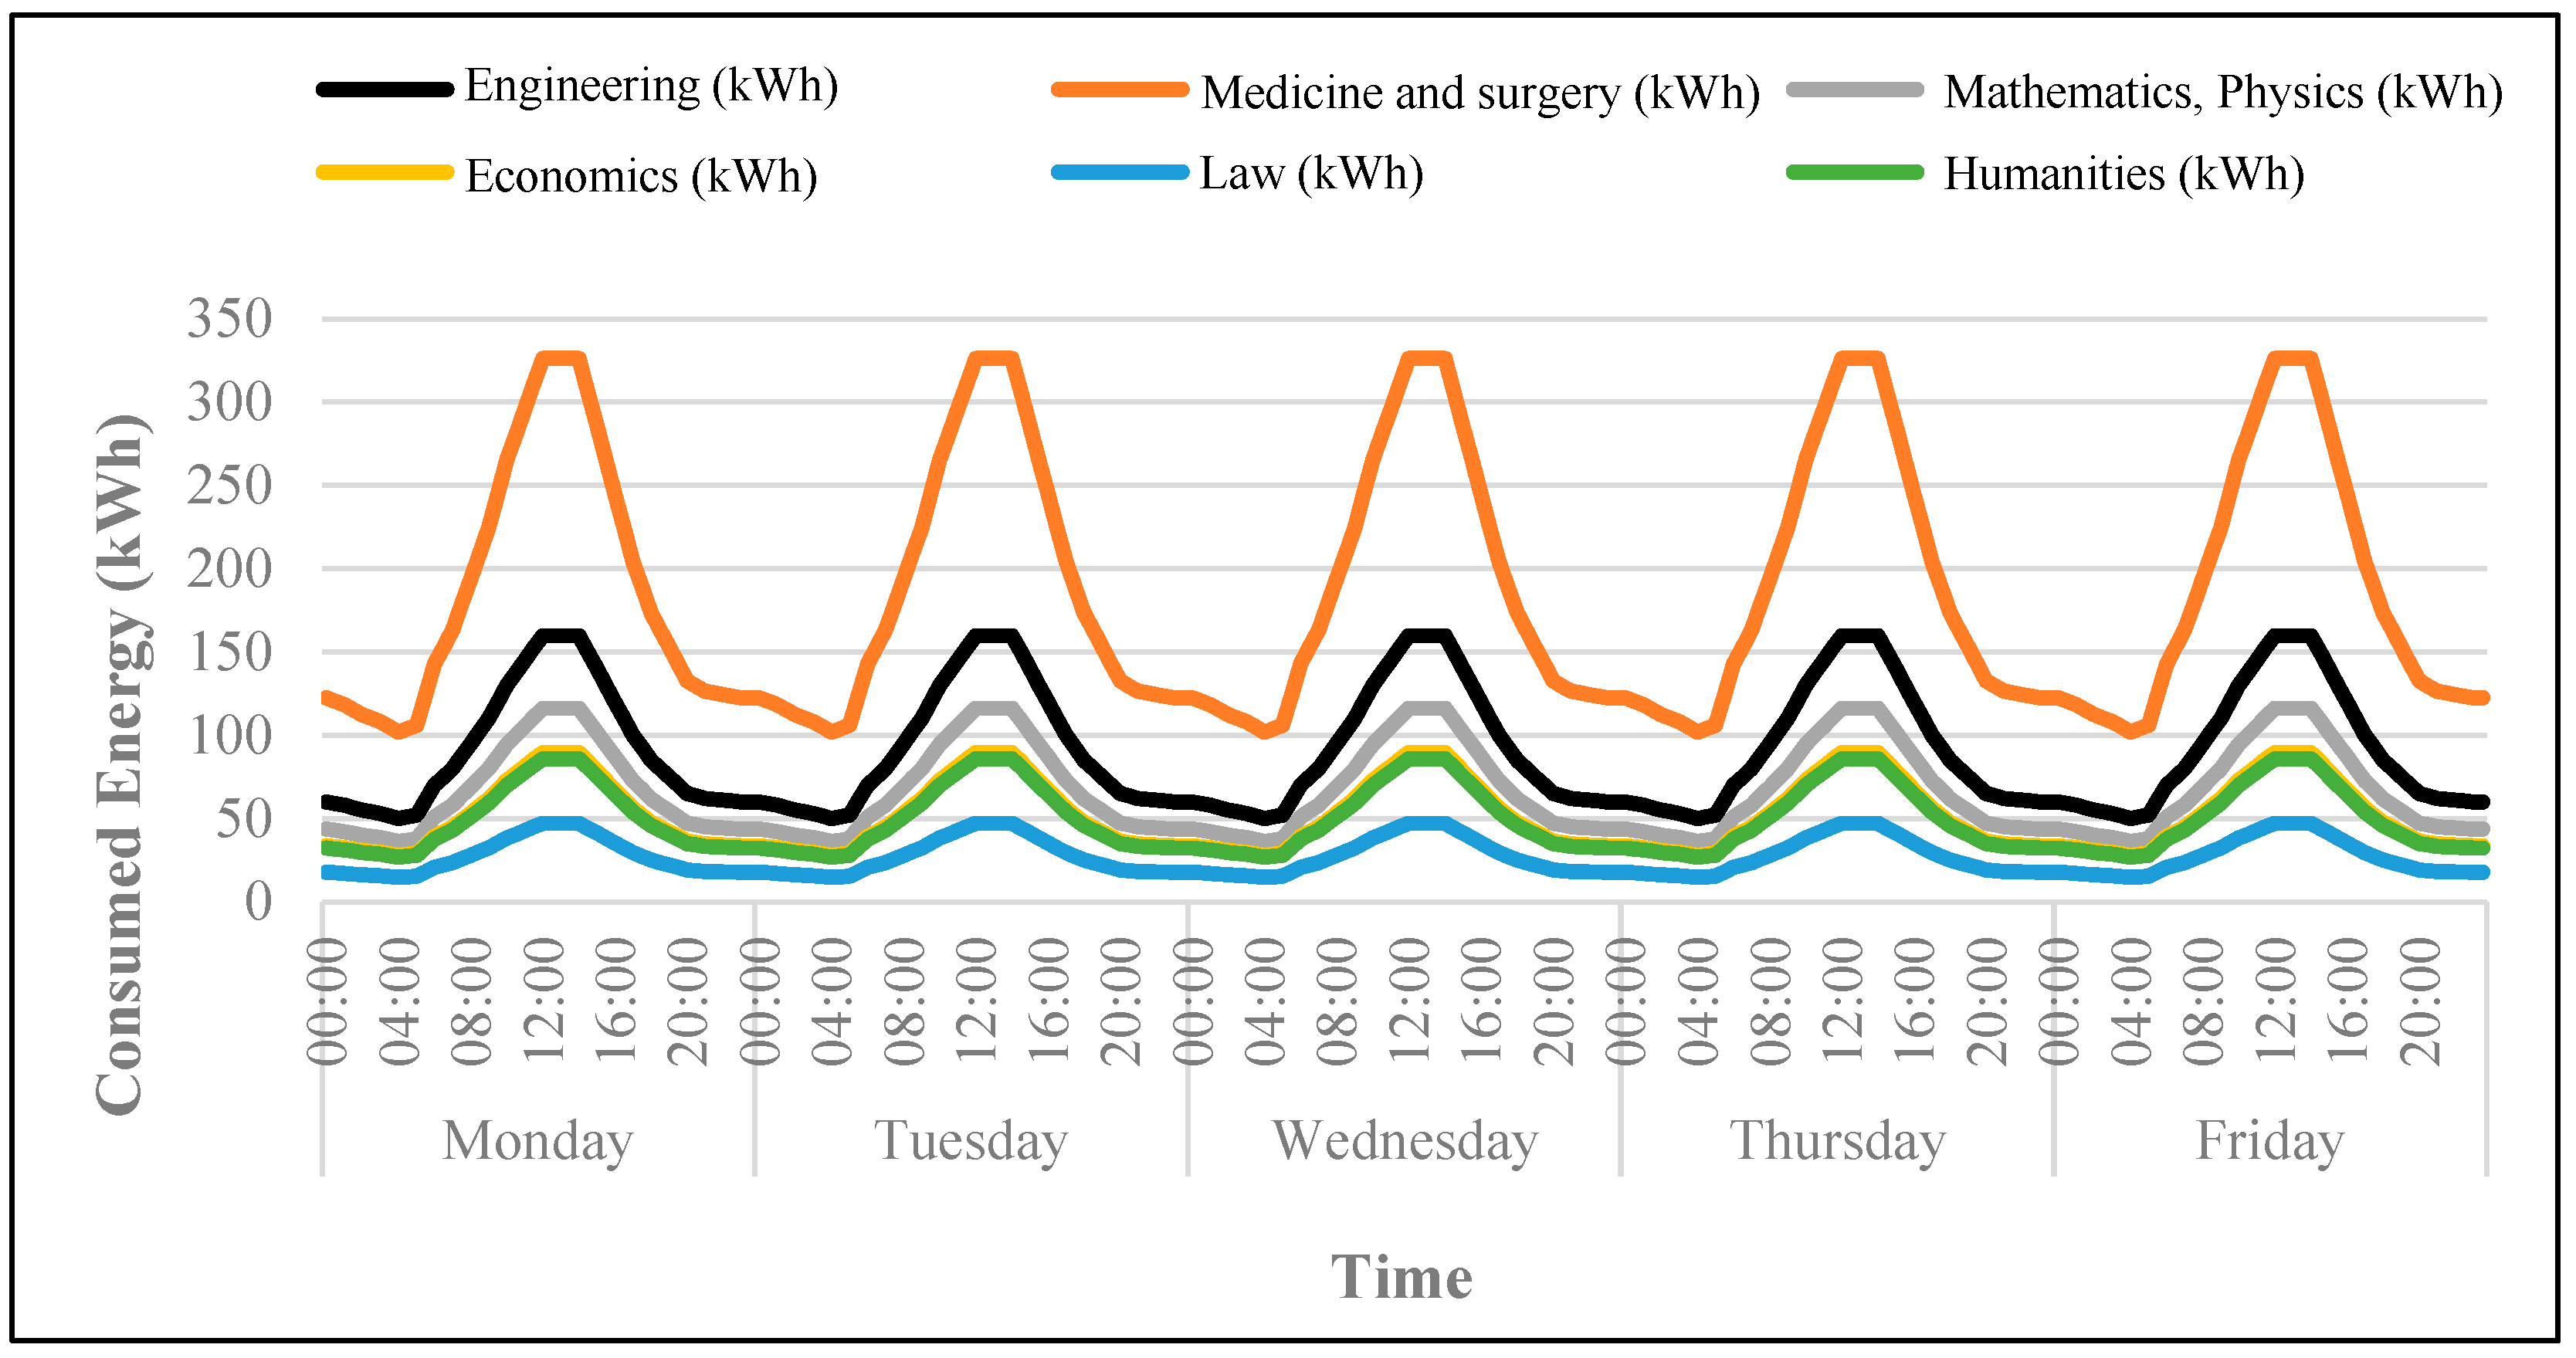
Campus energy consumption patterns vary significantly across faculties, primarily due to differences in faculty sizes, research activities, and operational schedules. Using the hourly energy profile of the school of Engineering (with a peak of 160 kWh during 12:00–15:00) as a reference, a model was developed to scale each faculty’s consumption relative to Engineering’s population, based on [
41,
42,
43]. This model is further adjusted using an intensity classification that accounts for faculty-specific energy needs [
44,
45]. For instance, Medicine and Surgery, classified as a high-intensity faculty with a baseline of 60 kWh similar to Engineering and a population roughly twice that of Engineering, shows a peak consumption of approximately 326 kWh. In contrast, Mathematics, Physics and Natural Science, another high-intensity faculty but with a smaller population, peaks at around 116 kWh.
Medium-intensity faculties, such as Economics and Law, are scaled based on their relative population and a lower baseline (40 kWh instead of 60 kWh). This results in peak consumption values of roughly 90 kWh for Economics and about 47 kWh for Law. Finally, the low-intensity faculty of Humanities, with a baseline of 30 kWh, exhibits a peak of approximately 86 kWh, despite having a population slightly higher than Engineering.
These energy profiles, expressed in half-hour intervals for weekdays, capture not only the inherent differences in infrastructure and research activities among faculties but also the significant variation in operational energy demand during peak periods, as shown in
Figure 4.
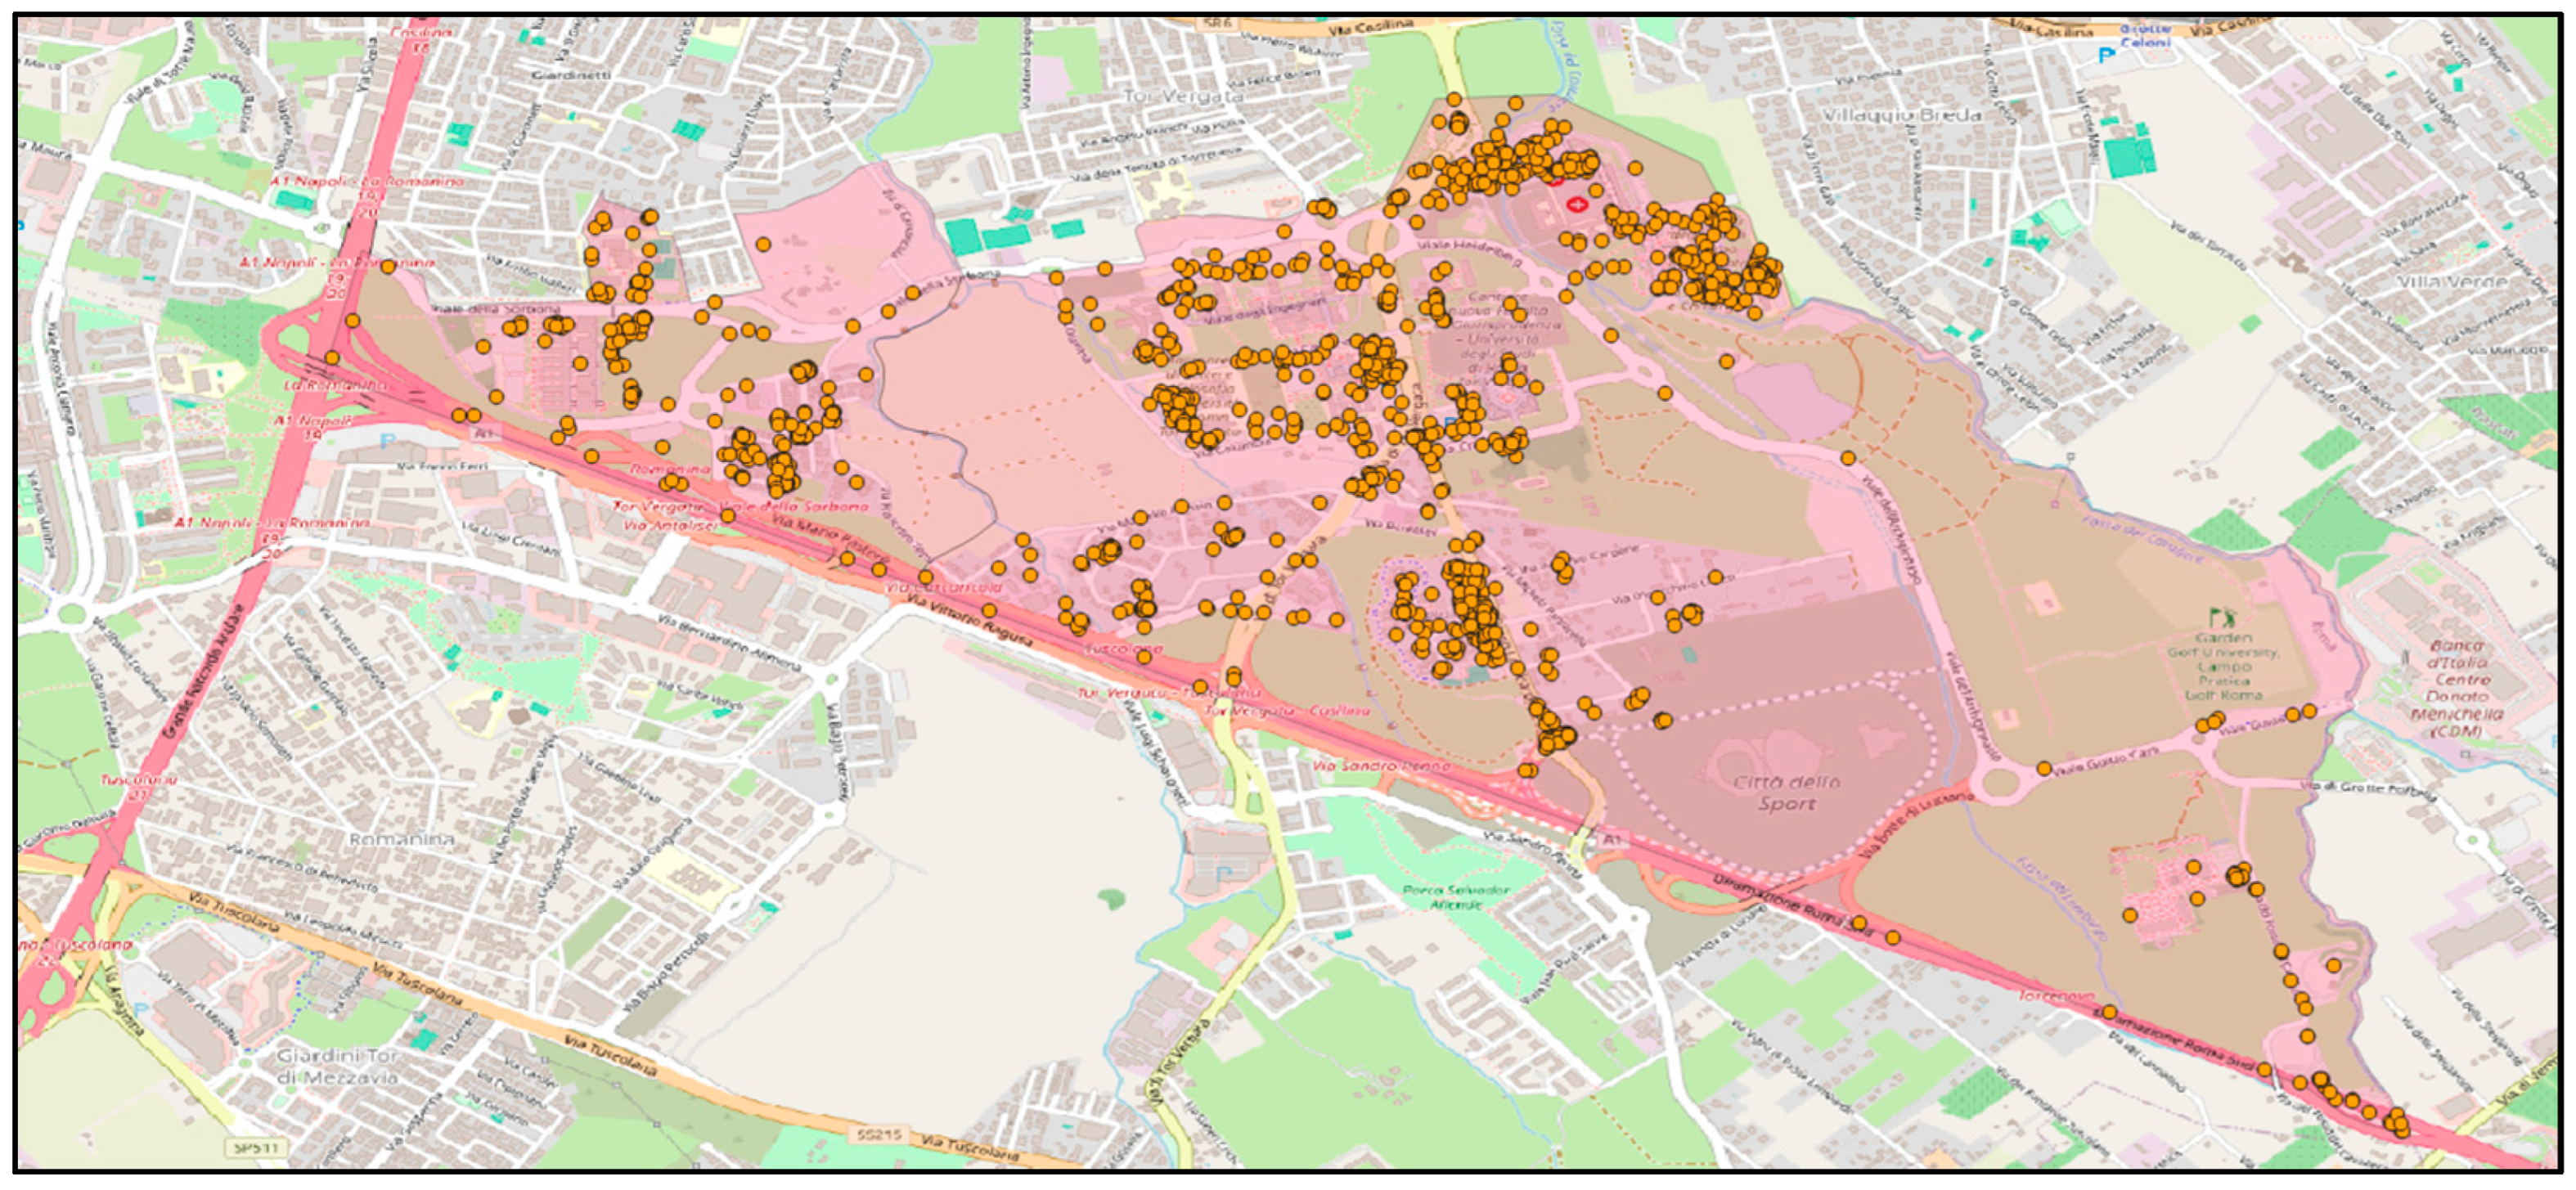
4.1. Vehicle Trip Detection and Spatial Identification at the Campus
The vehicle trip detection methodology in this section is based on FCD collected from a broad sample of vehicles circulating within the Lazio region rather than a dataset specifically dedicated to university commuters. The university campus serves as the primary observation point, as illustrated in
Figure 5.
The dataset spans 58 days in 2023, spreading over four time intervals (15–28 February, 31 May–15 June, 12–25 July, and 27 September–10 October) capturing seasonal and calendar-related variations, with a total of 9,319,333 recorded trips from 70,322 vehicles. These vehicles include both ICE vehicles and EVs.
The trip reconstruction process, applied to the 9,319,333 recorded trips, allowed for the identification of the trip chains of vehicles visiting the campus. Inconsistent or erroneous data were identified, and a subsequent cleaning process ensured a high-quality sample for the V2G simulation. Then, a dataset of 2342 vehicles was identified as making relevant trips to the University of Rome Tor Vergata campus, with 49,092 detected trips during the observation period.
To evaluate the potential of V2G participation, a 30 min parking duration threshold was applied to identify significant stops within the campus. This ensured that only vehicles parked for a sufficient amount of time were considered for energy transfer potential. Since a large portion of the identified vehicles were ICVs, a subset of 1873 ICVs operating within the Tor Vergata campus was selected. These vehicles were then simulated as EVs by assigning battery parameters, such as energy capacity and consumption rates, to estimate energy consumption equivalent to that of EVs.
Trip reconstruction was performed by linking sequential trips for each vehicle, forming trip chains that allowed for the estimation of arrival and departure times, pre- and post-parking distances, and the corresponding SoC levels for the simulated EVs. Vehicles parked for more than 30 min were flagged as potential contributors to V2G services, ensuring that energy availability assessments were consistent with realistic user behaviours and charging constraints.
4.2. Real-Time Scheduling Algorithm for V2G Services
The real-time scheduling algorithm for V2G services requires an optimisation approach that balances energy transfer to the grid while accommodating user mobility needs. This algorithm uses FCD to estimate the arrival time, parking time, SoC, and the available energy for grid transfer. The methodology is applied to weekly datasets.
The real-time scheduling algorithm is designed based on the following assumptions:
SoC estimation; the SoC is estimated using the distance travelled to reach the campus, assuming an initial 100% SoC at the start of the day. A minimum SoC threshold, , is set based on the higher of either 40% of the battery capacity or the required energy to fulfil mobility needs (calculated as 1.4 times the required energy for remaining trips);
energy availability for grid export; the vehicles are available for V2G services when parked within the campus zone, provided their SoC exceeds minimum SoC threshold .
energy consumption rate; the energy consumption is calculated according to the vehicle type, as shown in
Table 2.
charging efficiency; the charging efficiency is considered at 90% to account for losses.
charging/discharging rate; the charging and discharging rate is 22 kWh per charging/discharging unit.
temporal resolution; the scheduling algorithm operates on a half-hourly basis, corresponding to 48 time slices per day.
The analysis of energy transfer patterns during weekdays used aggregated datasets spanning the periods 15–28 February, 31 May–15 June, 12–25 July, and 27 September–10 October. The dataset consists of 48 half-hourly time slices for each weekday, allowing for a granular assessment of V2G energy contributions. The key findings are summarised below:
- 1.
energy transfer trends by weekday, i.e.,
Mondays; peak energy transfer occurs between 08:00 and 10:30 AM, coinciding with high vehicle availability; a decline follows after 12:00 PM as vehicles leave for midday activities. Mondays in February and October show 20–30% higher energy contributions compared to summer months;
Tuesdays; energy transfer remains elevated from 09:00 AM to 03:00 PM due to prolonged parking durations; specific dates, such as 6 June and 3 October, exhibit higher peaks, with energy transfer reaching 50–60 kWh per time slice;
Wednesdays; the highest energy transfer is observed between 08:30 and 09:30 AM, with a decline post-04:00 PM; unlike other weekdays, Wednesdays demonstrate stable energy contribution patterns across different weeks;
Thursdays; a sustained transfer pattern is observed from 07:30 AM to 11:00 AM, with gradual declines in post-afternoon hours;
Fridays; the lowest energy transfer rates occur on Fridays, with minimal peaks observed in the morning hours.
- 2.
key observations, i.e.,
time-of-day patterns; morning peaks (07:00–10:00 AM) are driven by workplace arrivals; midday lulls (12:00–01:00 PM) result in reduced contributions due to short-term departures; and evening resurgence (04:00–06:00 PM) brings minor peaks from vehicles parked for late activities.
weekly fluctuations; february weeks show lower energy contributions (avg. 15 kWh/slice) due to reduced vehicle participation; June and October weeks exhibit higher contributions (avg. 35 kWh/slice) due to increased vehicle participation.
Figure 6 illustrates the energy transfer trends for different weekdays and the whole period of study.
4.3. Predictive Modelling of the Transferred Energy Analysis
To forecast the transferred energy on weekdays, both ARIMA and LSTM models were employed. The forecasting goal was to perform one-step-ahead predictions based on the transferred energy values resulting from of the real-time scheduling algorithm for V2G, where each data point represents a 30 min time slice across the multiple working days spanning the periods of 15–28 February, 31 May–15 June, 12–25 July, and 27 September–10 October.
The ARIMA model was implemented using the pmdarima.auto_arima() function to automate model selection while accommodating seasonality. The dataset exhibits strong daily cyclic behaviour, with 48 half-hour intervals each day, which justifies a seasonal ARIMA structure with a periodicity of 48 (m = 48). To prevent excessive computational overhead and reduce the risk of overfitting, the model search space was constrained by setting max_p = 1, max_q = 1, and max_order = 2. First-order differencing (d = 1) and seasonal differencing (D = 1) were enforced to ensure stationarity and capture daily patterns.
The time-ordered dataset was split into 80% for training and 20% for testing and validation. Post-training forecasts were generated using a rolling one-step-ahead prediction strategy: for each new time step in the test set, the model predicted the next value and was subsequently updated with the actual observed value. This simulates a real-time forecasting environment and allows the model to adapt dynamically as new observations become available.
The LSTM model was developed using TensorFlow and Keras, to capture potentially nonlinear and complex temporal dependencies in the data. The model was trained to perform one-step-ahead forecasting based on a sliding input window of 48 time steps (equivalent to one full day). The energy transfer values were normalised to the [0, 1] range using a MinMaxScaler for stable training.
The LSTM architecture comprised two stacked LSTM layers, each with 64 units and ReLU activation, followed by a dense layer that outputs a single forecast value. The model was trained for up to 100 epochs with early stopping based on validation loss. After training, predictions were generated for both training and test sequences, which were then rescaled back to the original units.
The model parameters are as follows:
ARIMA parameters; i.e., seasonal: true, m = 48, max_p = 1, max_q = 1, max_order = 2, d = 1, D = 1, approximation = true, and method = ‘css-mle’;
LSTM parameters; i.e., window size = 48, epochs= 100, batch size = 32, LSTM layers = 2 × 64 units with ReLU activation, and output layer = dense (1).
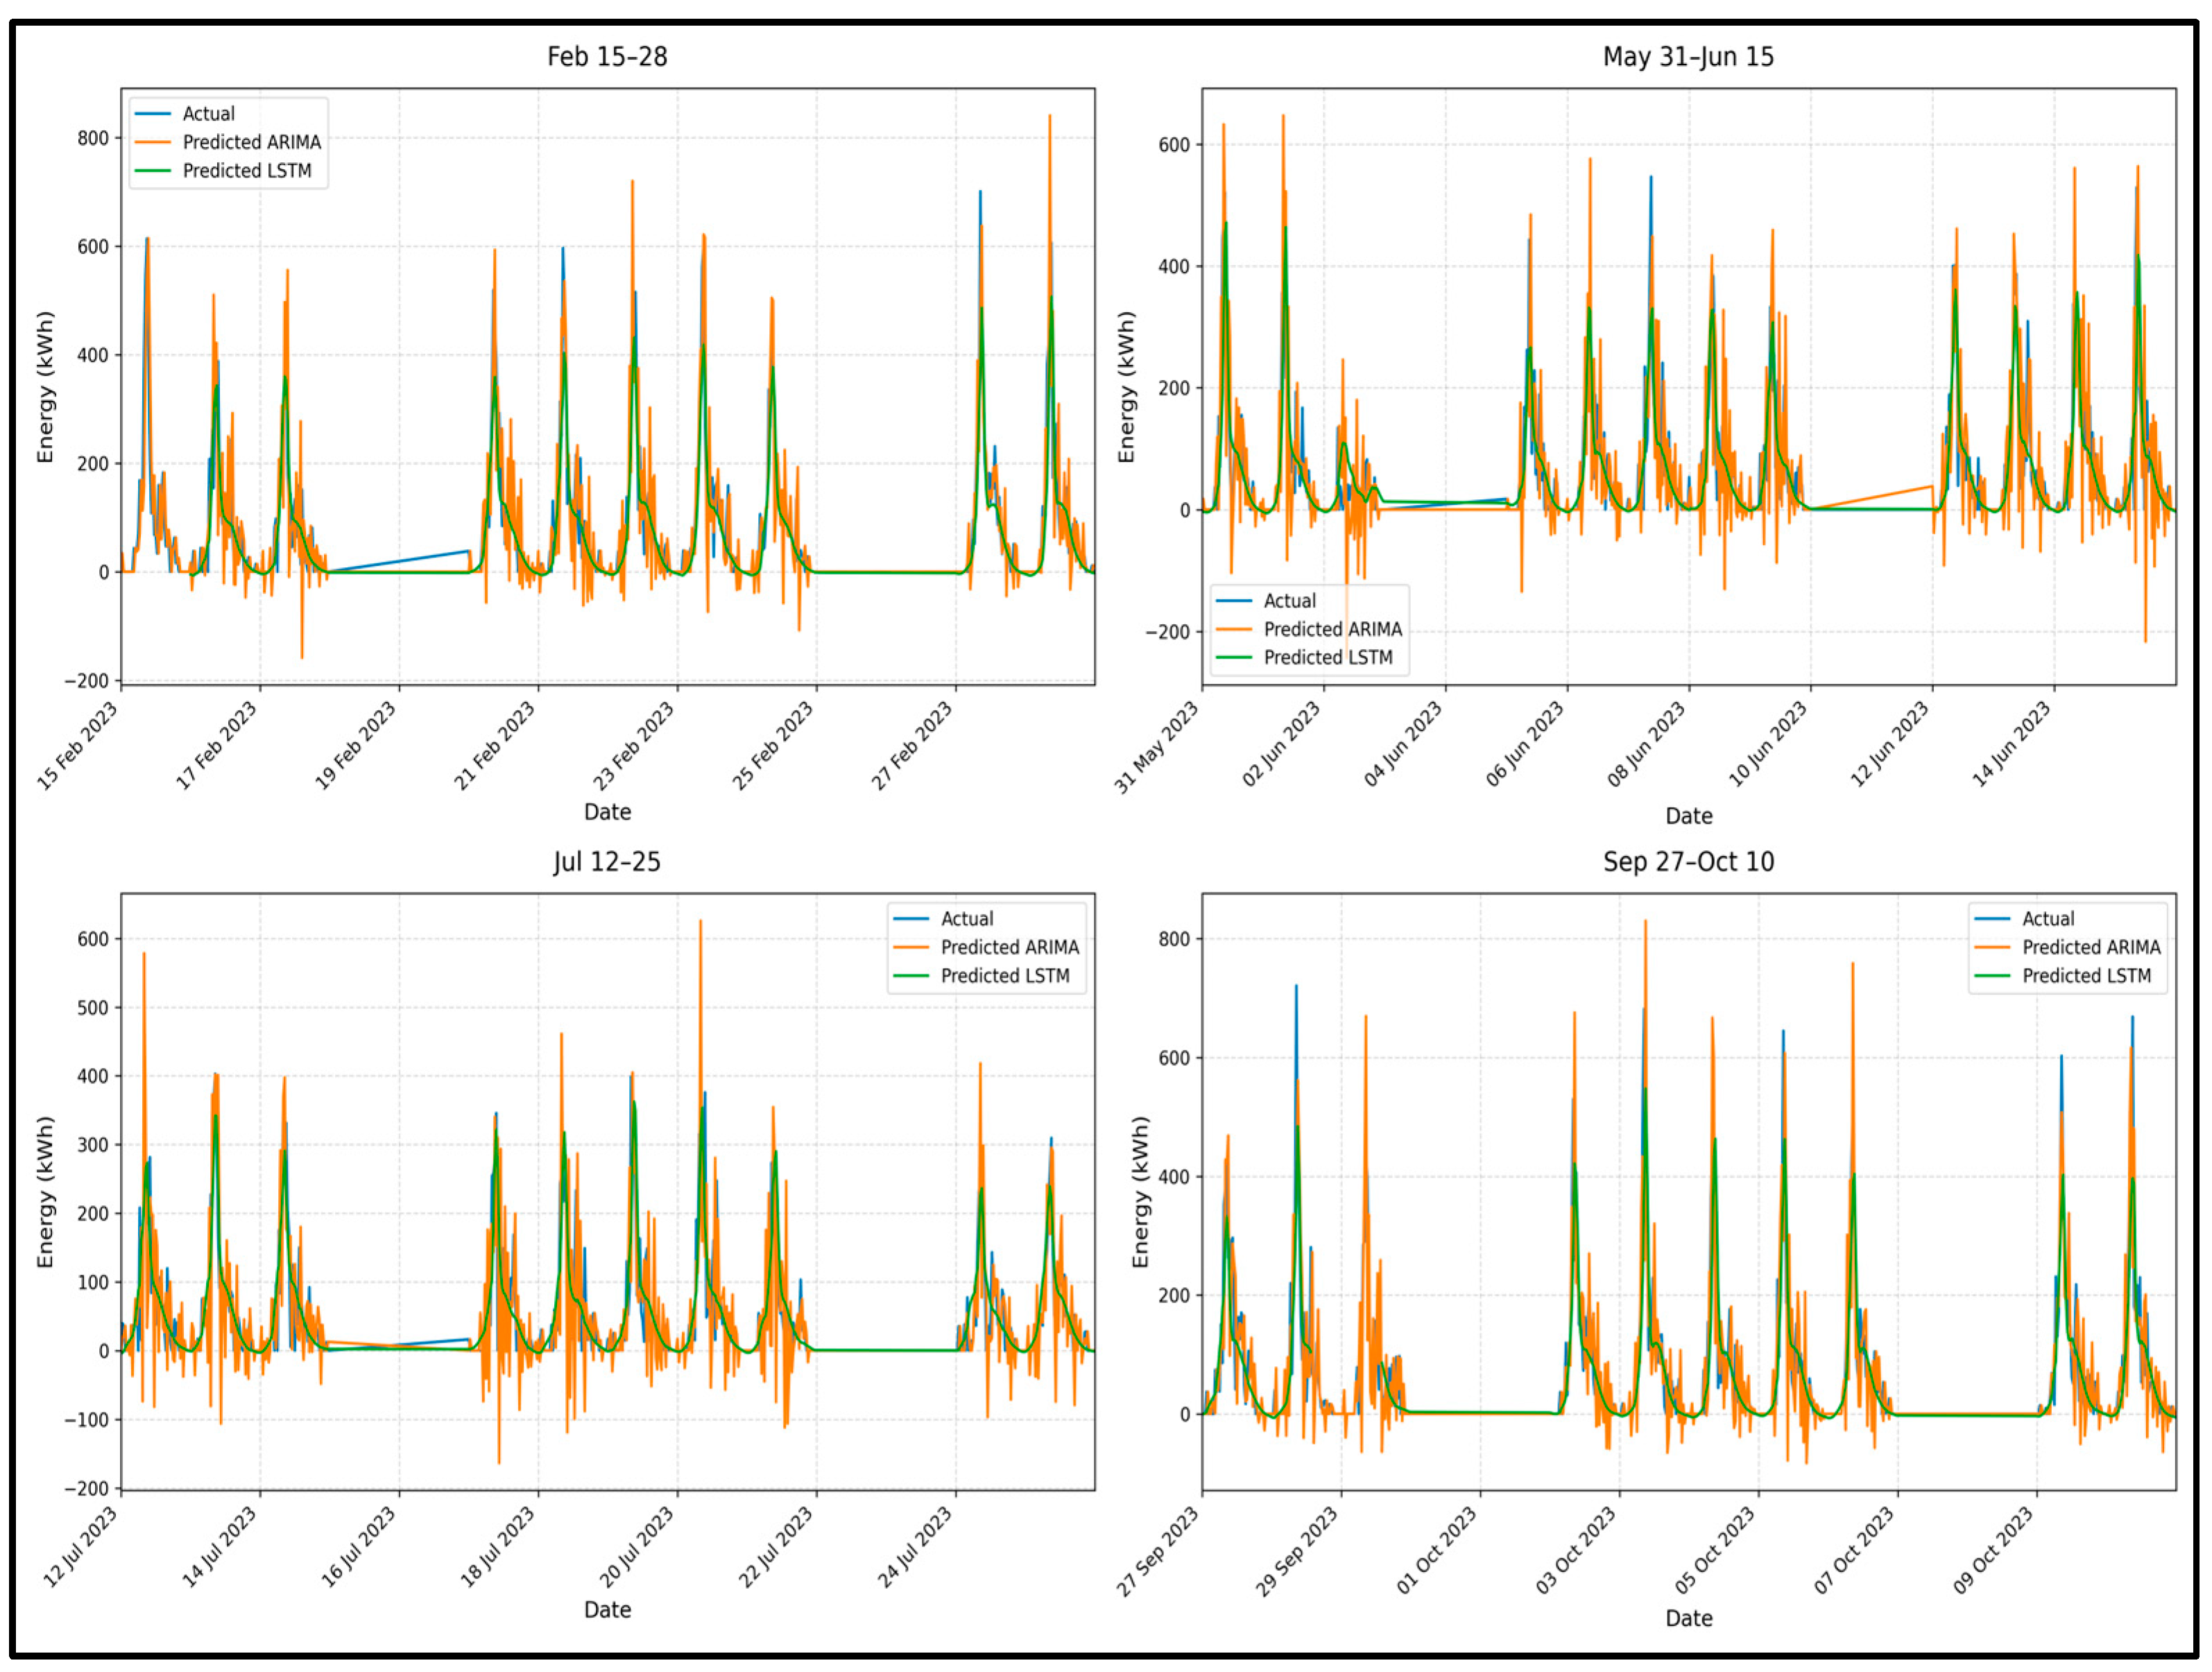
The performance of both models is detailed in
Table 6 and illustrated in
Figure 7. Although ARIMA effectively captured the general daily and weekly patterns, its linear nature limited its responsiveness to the sharp fluctuations inherent in mobility-driven energy availability. The LSTM model significantly outperformed ARIMA, as evidenced by its substantially lower RMSE (59.48 vs. 87.89 on the test set) and higher R
2 (0.76 vs. 0.46 on the test set). An interesting observation is that both models show testing performance that is comparable to, or even slightly better than, their training performance (e.g., for LSTM, a testing R
2 of 0.76 vs. a training R
2 of 0.74). This is due to the data split, which was split chronologically rather than randomly. This result suggests that the testing period may have contained more regular or less noisy mobility patterns than parts of the training data. Crucially, this strong performance on the test set is a positive indicator, demonstrating that the models have generalized well and are not overfitted to the training data. The practical advantage of this superior performance is that more reliable forecasts allow for a more efficient and confident scheduling of V2G services. The models were validated using a time-ordered 80/20 train–test split, which simulates a real-world scenario and confirms the model’s ability to generalize to unseen data, indicating they are not overfitted.
4.4. V2G Results Analysis
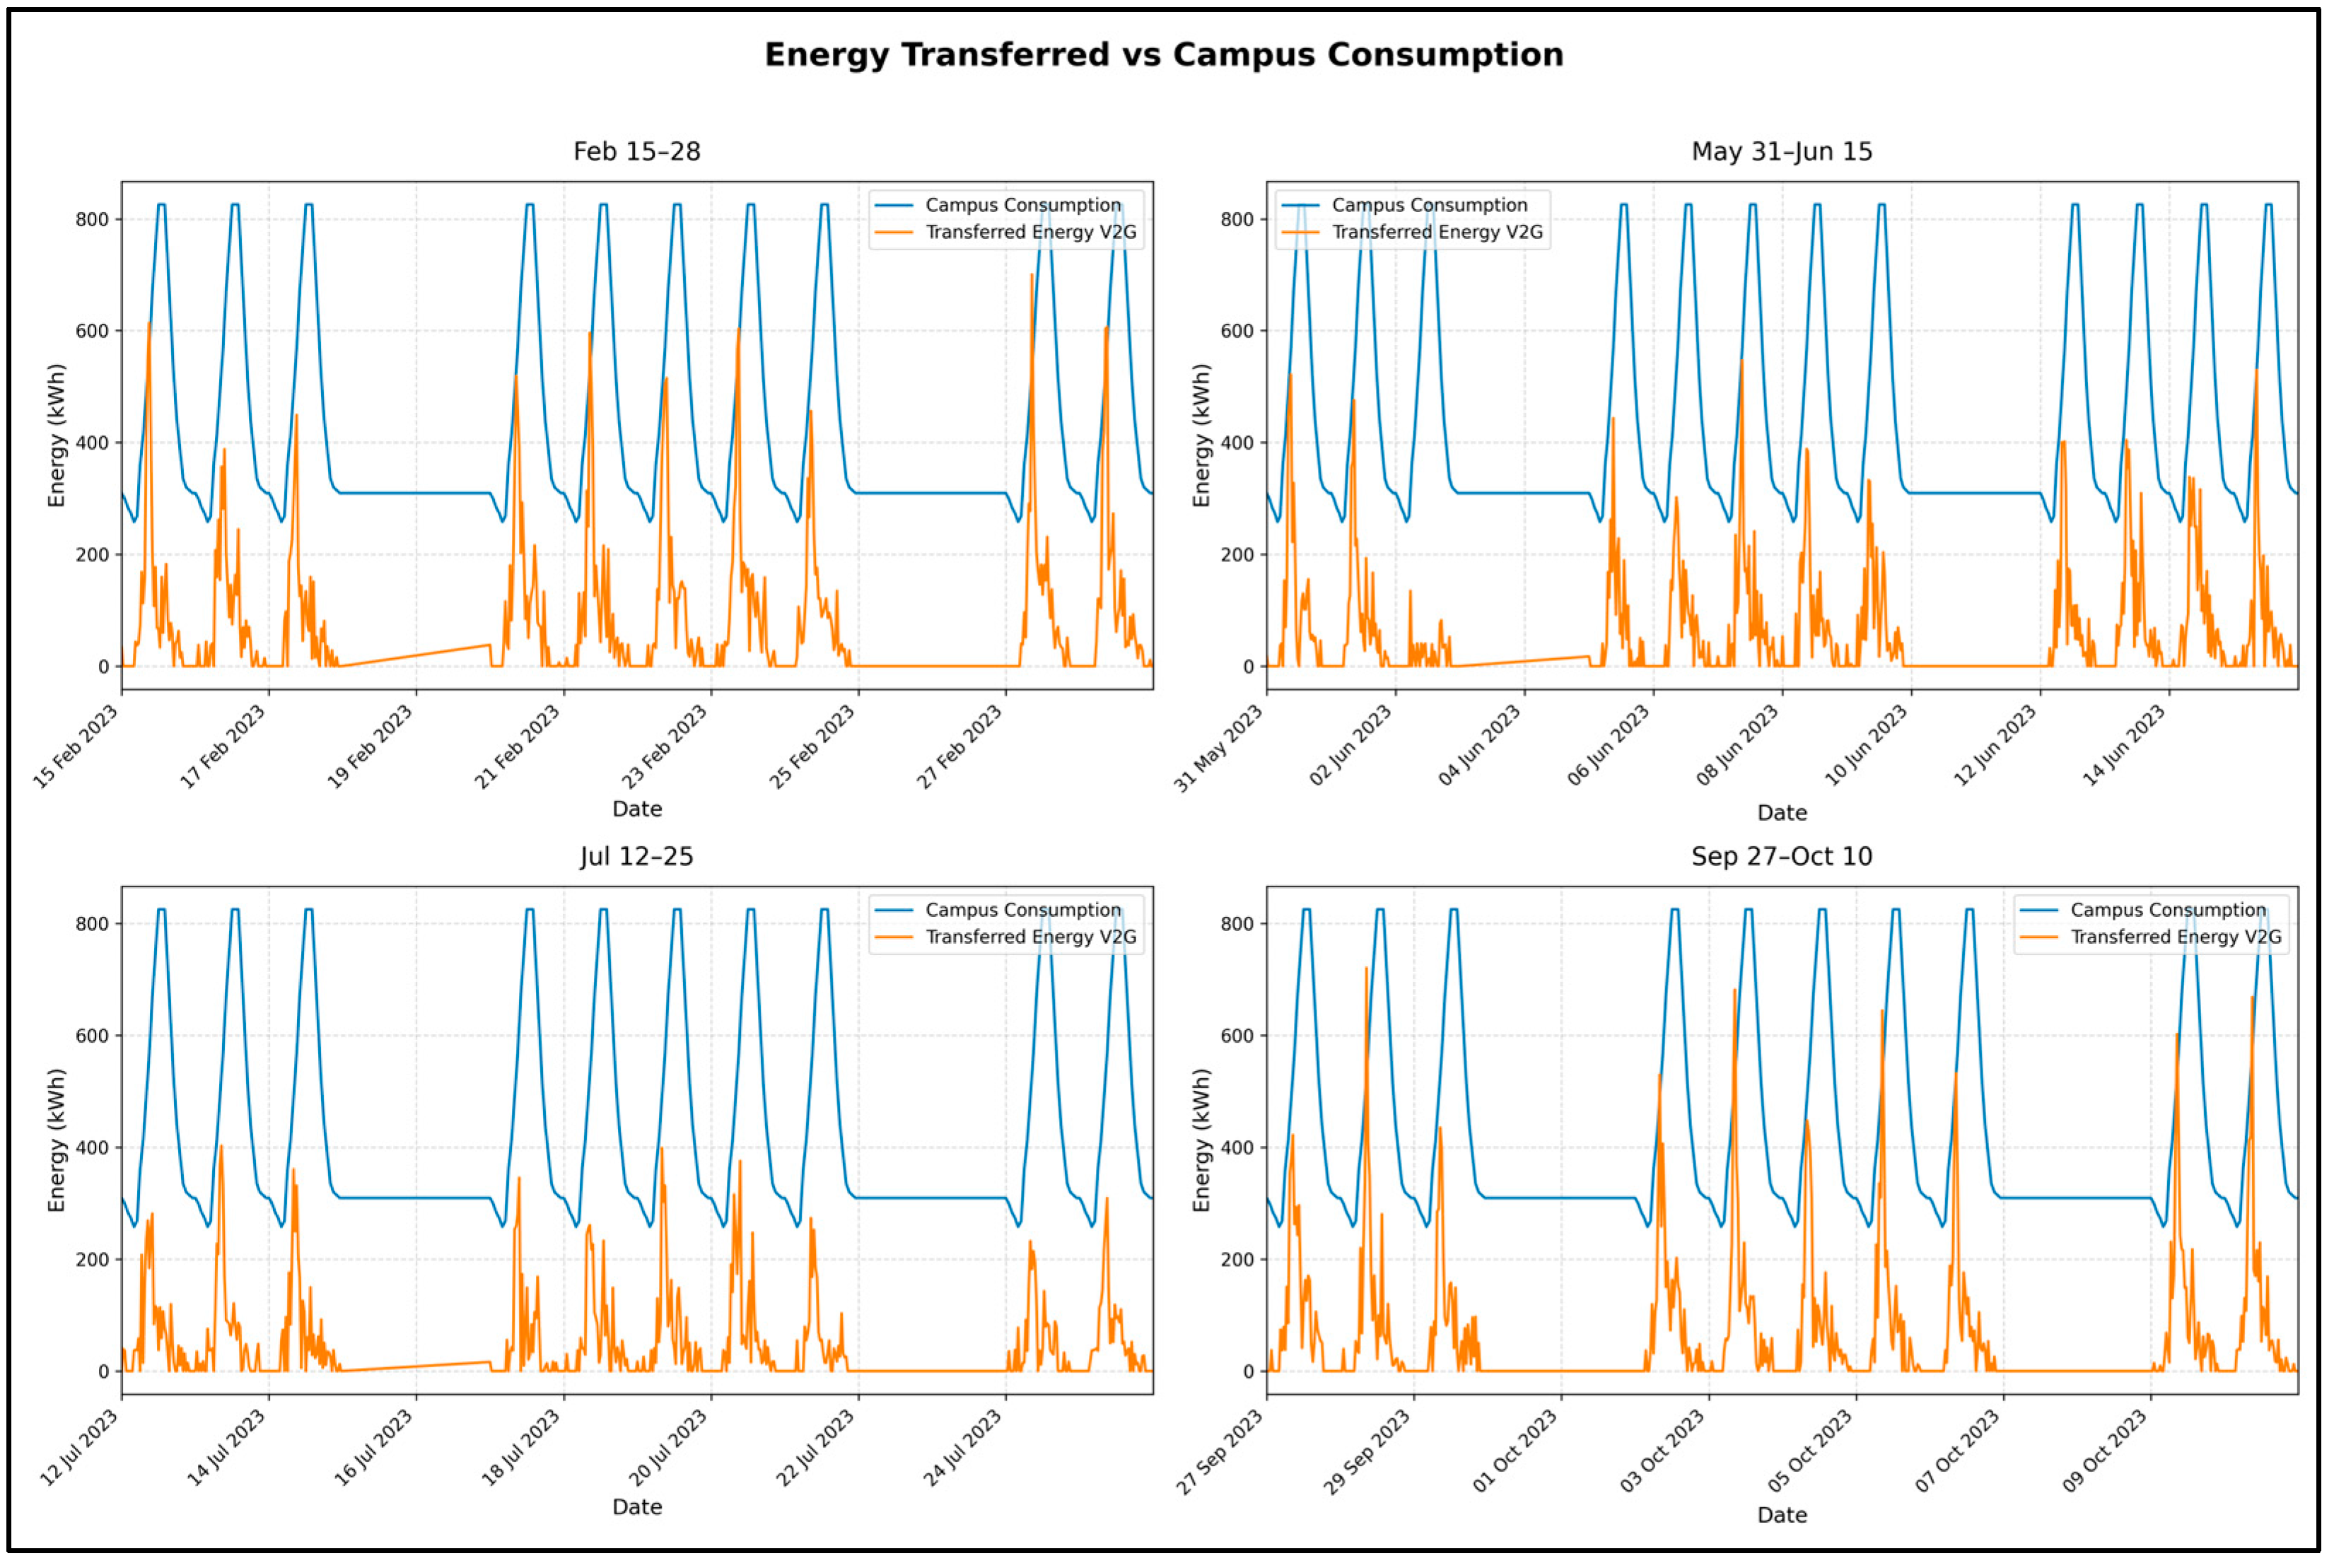
This section evaluates the real-world performance of the V2G services by analysing their ability to offset campus energy demand. The implementation of V2G services at the University of Rome Tor Vergata campus demonstrates their potential to reshape energy demand dynamics and enhance grid stability.
Figure 8 illustrates the comparative analysis between campus energy consumption (blue curves) and V2G-transferred energy (red curves) across the four distinct periods: 15–28 February, 31 May–15 June, 12–25 July, and 27 September–10 October, as these intervals capture seasonal variations in academic activity, vehicle availability, and energy demand.
A key observation is the temporal synchronisation between V2G energy injection and the campus demand peaks. During periods such as February and early June, the red V2G lines spike in direct correlation with the consumption surges, demonstrating the V2G system’s capacity to provide targeted peak-shaving support. This implies that when a sufficient number of vehicles are connected and available, the V2G infrastructure acts as a decentralised battery storage network, releasing energy exactly when grid stress is highest.
Additionally, in the July window, both consumption and V2G injection are noticeably reduced. This is likely attributable to the summer academic break, leading to reduced vehicle presence and lower campus activity. However, even during this low-occupancy period, the V2G response retains its load-following behaviour, showing potential for adaptive grid support even in scenarios of partial demand and limited vehicle engagement.
In late September and early October, we again observe substantial contributions of V2G to campus demand. These results reinforce the consistency and reliability of the system during regular academic operations. Importantly, the graphs reveal not only the energy injected but also the precision in timing, which is a critical advantage of predictive scheduling and the intelligent control mechanisms implemented in the system.
The results validate the V2G role as a decentralised energy storage solution. By leveraging idle EV batteries, the campus reduces reliance on fossil-fuel-based peaker plants, advancing its decarbonisation goals within the EU “Fit for 55” framework. Furthermore, the spatial–temporal scheduling framework demonstrates how predictive analytics can optimise energy flows in real-world settings, applied in
Section 4.3.
4.5. Discussion
The analysis of V2G results from the University of Rome Tor Vergata campus demonstrates a significant potential for EVs to contribute to grid stability and peak demand shaving. The temporal synchronisation observed between V2G energy injection and campus demand peaks, even with a simulated EV fleet based on general FCD, underscores the viability of the proposed framework. However, transitioning from these promising simulation results to a real-world operational system requires addressing several practical considerations.
Key concerns revolve around user acceptance and participation, which, while preliminarily surveyed, will be influenced by factors such as battery degradation perceptions, economic incentives, and the ease of use of the V2G system. Ensuring data privacy and security for shared vehicle data also remains paramount. Furthermore, while the algorithm accounts for existing infrastructure constraints, the scalability and robustness of the physical charging infrastructure for widespread V2G participation need to be confirmed.
To address these points and validate the findings of this study, a dedicated pilot programme on the university campus emerges as a logical and critical next step. Such a pilot would involve the following:
deploying the real-time scheduling algorithm with actual campus-based EVs and V2G-enabled charging stations;
collecting data on real-world energy transfer, user behaviour, and battery performance under V2G operation;
gathering direct feedback from participants to understand concerns and refine incentive structures;
evaluating the economic benefits and operational impacts in a live environment.
A successful pilot programme would not only provide invaluable real-world validation for the models and algorithms presented but also offer a clear pathway for scaling V2G services on the campus and replicating the framework in other similar institutional settings. This would bridge the gap between theoretical potential and tangible impact, paving the way for a broader adoption of V2G technology.
5. Conclusions
This study presents a structured and innovative methodology for implementing V2G services in a smart campus environment, using FCD and advanced modelling techniques. The workflow encompasses trip detection, the spatial localisation of V2G hubs at the campus, a real-time algorithm to manage energy transfers, and transferred energy forecasting using ARIMA and LSTM algorithms.
Through detailed data analysis and simulation, it becomes evident that V2G holds tremendous potential as a dynamic energy resource. By leveraging the latent energy stored in electric vehicles during idle periods on campus, the V2G system can smooth out energy consumption curves, especially during high-load intervals. The integration of predictive algorithms allows for proactive energy management, ensuring that energy is discharged during peak demand and recharged during low-demand periods, creating a two-way energy exchange ecosystem.
The empirical results from the selected time periods demonstrate the practical feasibility of V2G in offsetting grid loads. More importantly, they confirm that V2G systems can adapt to seasonal and behavioural fluctuations, maintaining alignment with real-time energy needs. This adaptability positions V2G not just as a technological supplement, but as a core component of future campus microgrids and urban energy networks. The predictive algorithms used, ARIMA and LSTM models, enable high-accuracy energy forecasting. The LSTM model’s superior performance highlights the value of machine learning in energy management.
Beyond technical performance, this research underscores the sustainability implications of V2G adoption. By reducing reliance on fossil-fuel-based energy during peaks and by facilitating decentralised energy storage, the university can move closer to net-zero carbon objectives and contribute to the broader transition toward renewable and resilient energy systems.
While this study presents a robust framework for V2G implementation on a university campus, several limitations and avenues for future research should be acknowledged to build upon these findings:
data source and fleet composition; the current analysis utilised FCD from a general vehicle population to simulate EV behaviour; future work should aim to test and refine the framework using data from a dedicated fleet of EVs actively used by the campus community; this would provide more precise insights into participation rates and energy capacities;
economic analysis and business models; a comprehensive economic assessment was beyond the scope of this paper; future research should undertake a detailed cost-benefit analysis, explore potential revenue streams from providing ancillary services to the grid, and develop viable business models that ensure fair compensation for EV owners and sustainable operation for aggregators;
battery degradation; the impact of increased cycling due to V2G on long-term battery health is a critical concern for EV owners; future studies should integrate sophisticated battery degradation models to quantify these effects accurately and explore mitigation strategies, such as smart charging protocols that minimise stress on the battery;
real-world validation and scalability: as discussed, a campus-based pilot programme is the crucial next step for validating the proposed system in an operational environment; this would also allow for rigorous testing of the system’s scalability and provide a replicable model for other large institutions like corporate campuses or residential communities;
advanced control and optimisation strategies; to enhance system resilience and efficiency, future work could explore the integration of risk-averse energy management strategies and scenario-based stochastic programming; these approaches would allow the system to better manage uncertainties stemming from electricity market volatility, EV availability, and on-site renewable generation (e.g., solar PV);
enhanced predictive modelling: while the LSTM model demonstrated strong performance, the field of predictive modelling is continually evolving; future investigations could compare its performance against other cutting-edge forecasting techniques, such as transformer-based models or other RNN variants, to further enhance prediction accuracy;
user behaviour and engagement; deeper studies into user behaviour, beyond preliminary willingness surveys, are needed; this includes understanding the impact of dynamic pricing, different incentive structures, and gamification on participation rates and user satisfaction with V2G programmes.
In conclusion, the study confirms that integrating V2G with intelligent data-driven management strategies can significantly transform a university campus into an active energy participant. It provides a replicable blueprint for institutions and smart cities aiming to combine mobility electrification with grid modernisation, aligning energy innovation with environmental and operational goals.


