1. Introduction
The past decade has brought about rapid advances in deep learning methods and computation capacities which have enabled both the development of very sophisticated object detection methods and their widespread application in many different societal sectors. In the transport sector, object detection is used among other applications, in the development of vehicle-to-vehicle and vehicle-to-infrastructure communication [
1,
2,
3]. In addition, various public administration entities have installed specific traffic monitoring cameras on streets and intersections in cities or on highways which use object detection algorithms to automatically determine traffic density.
In a similar manner object detection methods have been applied in transport research in order to detect not only vehicles and traffic density but also other traffic participants such as pedestrians and cyclists [
4,
5]. Some researchers have also used object detection algorithms to identify vehicles on traffic cameras at a limited number of locations and to estimate the traffic over the entire road network on this basis [
6], while others have deployed object detection algorithms to detect vehicles in order to estimate traffic volume counts and intersection turning patterns [
7], or to investigate correlations between truck loads and bridge behaviour [
8].
In addition to the use of object detection methods, various researchers have also engaged in their further development and refinement. For example, several open-source projects have brought about specific hardware compositions and software packages for the detection of vehicles and other traffic participants [
9,
10]. Other scholars have developed human detection and tracking algorithms for video data [
11], attempted to enhance and improve the accuracy of object detection models by first identifying high-accuracy identification regions in the traffic camera image [
12], compared the accuracy of objection detection models trained with synthetic and real-world data [
13], and compared thermal video sensors and visible light cameras for the detection of vehicles, bicycles, and pedestrians under various lighting and temperature conditions [
14].
Here, we investigate the use of public webcams for the detection of traffic participants in public spaces since they pose particular challenges but also opportunities. Only a few researchers have applied object detection models to images taken from public webcams in order to identify traffic participants. Reference [
15], for instance, primarily applied object detection methods on webcam data to identify driving trajectories which were then used to determine the horizontal alignment of existing highways. Yet, public webcams could provide a valuable source of data for transport research going far beyond the mere detection of driving trajectories. In many countries, public webcams are already used to constantly streaming videos or images of city squares, road junctions, popular tourist spots, and other locations.
Hence public webcams could provide additional information on the frequency of different modes of transport such as walking, cycling, public transport, or car usage at different locations over time for public spaces which are not investigated in terms of traffic frequency by other means. Thus, public webcams could provide valuable empirical data on traffic flow, etc., which are needed for the development of traffic models [
16] and transport policies. While the data source of public webcams is of high interest for traffic research, the application of object detection models to public webcams also comes with particular challenges, as the images and videos often have a low image resolution and low temporal resolution and the angles and perspectives vary considerably between different cameras.
Therefore, tailored research is needed to investigate how object detection models can be used to exploit the huge potential of public webcams as a source of data for transport research as well as traffic management. An important step in that direction was made by [
17], who applied optimisation and deep learning based object detection models to 212 public webcams in New York, USA. The results show that the deep learning methods based on fully convolutional networks significantly reduce the mean absolute error [
17]. However, they only considered the detection of vehicles in their analysis and did not apply their models to detect bicycles, pedestrians, or public transport, which are, however, of particular interest when public spaces are monitored.
In contrast, ref. [
18] investigated the quality of different object detection models for both vehicles and persons by using 4000 manually labelled images from public webcams in London and North East England. The object detection models Faster-RCNN, YOLOv5x, as well as an ensemble of Faster-RCNN and YOLOv5x were applied to this dataset and compared in their performance. The results showed that the ensemble achieved the highest accuracy in detecting both vehicles and persons without significant increases in run time if parallelized [
18].
Furthermore, their study shed light on another important issue concerning the potential of public webcams as a source of data for transport research: Webcam images posing very high resolutions can lead to data protection issues if number plates of private cars and people’s faces are recognisable. In fact, applying object detection models to image data can raise a wide range of different ethical concerns depending on the actual use case [
19].
Therefore, ref. [
18] ran several tests investigating how far the quality of images can be reduced without decreasing the accuracy of object detection. This, of course, generally also depends on the distance between the camera and the objects recorded but for the images used in the study, a manual inspection revealed that downscaling the quality to a width of 440 pixels made it impossible to identify number plates and people’s faces [
18]. At the same time, the number of detected vehicles on images with the highest quality and images downscaled to a width of 440 pixels correlated by 0.96 (Pearson’s correlation coefficient) on average for different object detection methods [
18]. The same test yielded a correlation of 0.86 on average for persons and bicycles showing that a downscaling of quality to ensure data protection is possible without significant loss of accuracy in object detection [
18].
Considering above mentioned related research, this paper builds on these valuable insights on the potential of public webcams as a source of data for transport research by highlighting the accuracy of object detection models under different lighting conditions: brightness, dusk, and at night. Distinguishing among different lighting conditions is important as other studies have shown that weather conditions can have a big impact on the detection accuracy of objection detection models [
20]. Furthermore, this exploratory study aims to assess the potential of using open webcam imagery for transport related applications. Therefore, the goal of this study is to evaluate the out-of-the-box performance of state-of-the-art open-source models on non-standardised public webcam imagery. Out-of-the-box algorithms without domain specific fine-tuning are chosen in order to test their robustness in a low-effort, plug-and-play application context. While this study does not propose new algorithms, it highlights the challenges and potential of a rarely studied data source: publicly accessible non-traffic-specific webcams. These present unique characteristics—such as non-standardised viewpoints, lighting, and image quality—that differ markedly from typical traffic camera footage. Understanding these challenges is a necessary first step toward the development of more robust, domain-adapted detection methods.
A total of 15 images from three different webcams in the German city of Brunswick were manually labelled. Six categories were distinguished: “person”, “bicycle”, “car”, “truck”, “bus”, and “tram”. In the manual labelling process, 339 object were identified from one of these six categories. This allowed for evaluating the accuracy of various object detection models for the different categories of traffic participants mentioned in varying lighting conditions. This constitutes the main contribution of this paper to the related literature exploring the potential of public webcams as a source of data for transport research in public spaces.
The remainder of this article is organised as follows. The data section describes the cameras used and the labelling of the 15 webcam images. Subsequently, the methods section outlines the object detection models analyzed and the concrete approach for the evaluation and the comparison of their accuracy. Thereafter, the main results of the evaluation and comparison are described in the results section and situated among the findings of other studies in the discussion section. Finally, the main findings are summarized in the conclusions section.
2. Materials and Methods
We use open webcam data from three public web cameras located in the city of Brunswick, Germany. With a population of approximately 250,000, Brunswick is centrally located in Germany in the Federal State of Lower Saxony. The three webcams are installed in the city centre of Brunswick and can be accessed via the city’s official website (
https://www.braunschweig.de/leben/stadtportraet/braunschweiger_ansichten/webcam/index.php, accessed on 20 November 2023).
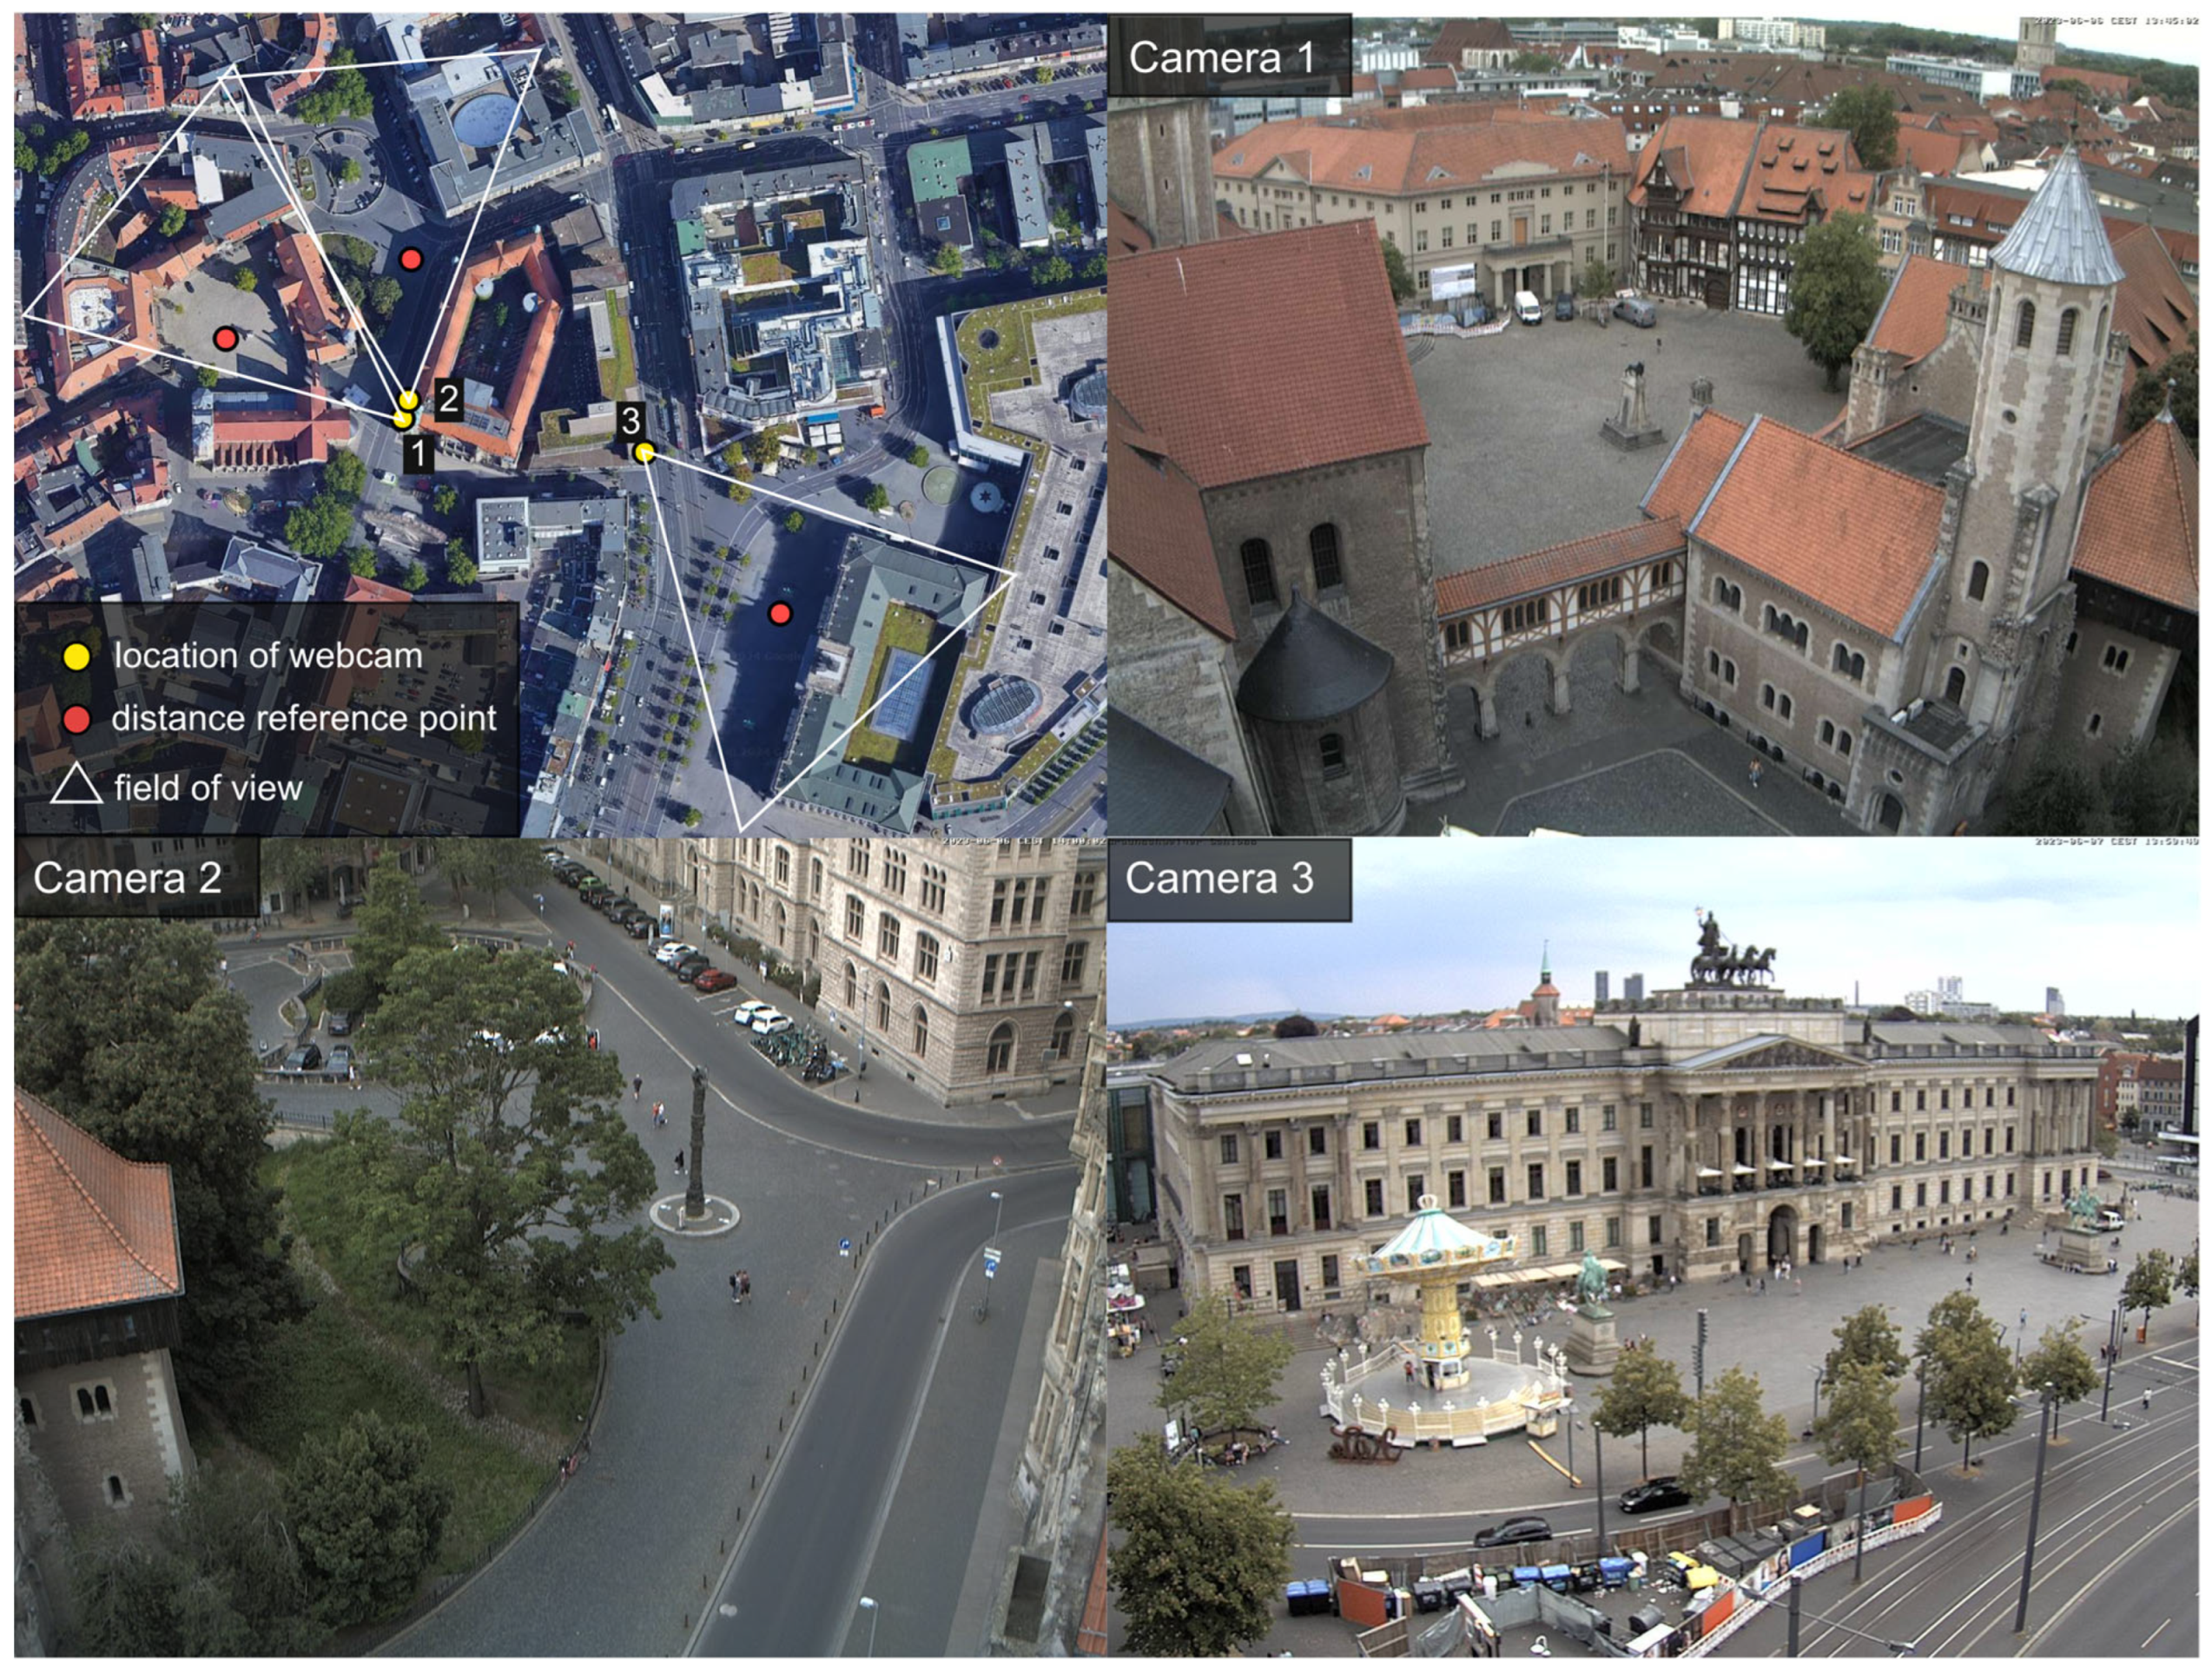
Figure 1 shows exemplary images from the webcams as well as their locations and their respective viewing direction.
Camera 1, situated at ‘Burgplatz’, captures a central medieval square within the pedestrian precinct, depicting typical pedestrian activity and delivery traffic. Camera 2, located at ‘Ruhfaeutchenplatz’, provides views of two roads adjacent to a historic square, featuring a pedestrian precinct and parking lots along the upper road. Camera 3, positioned at ‘Schloss’, offers views of Brunswick Castle, with a pedestrian precinct in the foreground alongside a road accommodating both vehicular traffic and tram lines. It is important to note that these webcams do not provide continuous video recordings. Instead, they capture images at intervals of 15 min for Camera 1, 5 min for Camera 2, and 1 min for Camera 3. This interval-based image capture affects the temporal resolution of the data collected.
A total of 15 images were selected—five scenes per camera—encompassing various ambient lighting conditions as well as differing numbers and types of objects. The overall number of images was deliberately kept low in order to allow for a manual inspection of the results of the object detection models for each image. The main objective of this explorative study is to provide a general proof of concept for the application of object detection models on webcam images in the area of transport research.
The selection of the 15 images ensures a diverse range of scenes to evaluate the performance of the models across different scenarios. The following conditions were selected for the five scenes per camera:
Three scenes in bright light (two with many traffic participants, one with few traffic participants)
One scene at dusk or on a relatively dark rainy day (with at least a few traffic participants)
One scene at night (with at least a few traffic participants)
Apart from the criteria to have three images at bright light, one image at dusk, and one image at night for each camera, the sampling process was random.
The 15 selected images were manually annotated and objects labelled accounting to the following classes: “pedestrian”, “bicycle”, “bus”, “tram”, “car”, and “truck”. The manual labelling was guided by visual inspection using the tool “Labelbox” (
https://labelbox.com/ accessed on 23 November 2023). This means that an object was labelled as belonging to one of the six distinguished classes if, after manually inspecting the image, the annotator was certain that it actually represents an object of that class. In some cases, this led to objects being labelled even if they were not fully captured in the image, as illustrated by the three trams in
Figure 2.
All manually labelled images can be found in
Appendix A.
Table 1 displays the counts for each mode of transport resulting from the manual labelling process. Altogether 339 objects belonging to one of the six categories of interest in this study were found in the manual labelling process.
These manual counts were treated as ground truth and served as the basis for evaluating and comparing the different object detection algorithms presented in the following section.
3. Theory
A total of eight different object detection models were applied on the 15 manually labelled images. The following first seven models, implemented in the open-source Python library mmdetection v3.3.0 [
21], were applied as they showed promising results in detecting transport-related objects in pretests on images from public webcams in other cities in Germany. In addition, Yolov8x from ultralytics [
22] was chosen as it was the latest YOLO version available at the time of the study:
Yolov3 (Backbone: DarkNet-53)
Faster R-CNN R-50 (Backbone: R-50-FPN)
Faster R-CNN R-101 (Backbone: R-101-FPN)
Faster R-CNN X-101 (Backbone: X-101-64x4d-FPN)
Cascade R-CNN (X-101) (Backbone: X-101-32x4d-FPN)
Cascade Mask R-CNN (X-101) (Backbone: X-101-32x4d-FPN)
RetinaNet (X-101) (Backbone: X-101-32x4d-FPN)
Yolov8x (Backbone: P5 CSPDarknet53)
YOLOv3 (You Only Look Once, version 3) is a real-time object detection model that builds upon the previous YOLO versions by improving speed and accuracy. It frames object detection as a single regression problem, directly predicting bounding boxes and class probabilities from full images in one evaluation, making it extremely fast. YOLOv3 utilizes a feature extraction network called Darknet-53, which combines residual blocks to improve feature learning. The model divides the image into a grid and predicts bounding boxes and confidences for objects within these grids, handling objects at three different scales to detect both small and large objects effectively [
23].
Faster R-CNN (Region-based Convolutional Neural Network) is an advanced version of R-CNN and Fast R-CNN, designed for more efficient object detection [
24]. It integrates a Region Proposal Network (RPN) that shares full-image convolutional features with the detection network, significantly speeding up the region proposal process. The RPN generates region proposals which are then refined and classified by the Fast R-CNN detector. This integration of RPN and Fast R-CNN into a single network allows for end-to-end training and more accurate and faster detection compared to its predecessors. In this study, Faster R-CNN is applied with three different backbones (R-50, R-101, and X-101).
Cascade R-CNN is an extension of the Faster R-CNN framework, designed to address the issue of overfitting and improve detection performance on challenging datasets. It employs a multi-stage object detection architecture where several detectors are trained sequentially. Each stage refines the proposals generated by the previous one, progressively improving the quality of detections. It relies on a series of detectors with increasing Intersection over Union (IoU) thresholds which allows it to handle varying object scales and occlusions better than single-stage detectors [
25].
Cascade Mask R-CNN extends Cascade R-CNN by incorporating instance segmentation capabilities. Similar to Cascade R-CNN, it uses a multi-stage approach to progressively refine object detections but adds a mask prediction branch at each stage for instance segmentation [
26]. Each stage refines the bounding boxes and masks, leading to more accurate segmentation results. The cascade design helps in handling high IoU thresholds and improves the quality of both detections and segmentations.
RetinaNet is an object detection model known for addressing the imbalance between foreground and background classes through the use of a focal loss function. This loss function focuses training on hard, misclassified examples and reduces the loss contribution from easy examples, effectively mitigating class imbalance issues [
27]. RetinaNet employs a Feature Pyramid Network (FPN) on top of a ResNet backbone to construct a multi-scale, pyramidal feature representation, allowing it to detect objects at various scales. It is a single-stage detector, meaning it directly predicts class probabilities and bounding boxes from full images without the need for a separate region proposal step.
In the domain of CNN-based object detection, the YOLO models have garnered significant attention since their debut in 2015 [
23] and various versions have been released since then. YOLO models are single-stage detectors, which implies that the identification and classification of various candidate boxes within an image occur in a single step. In this study, Yolov8 was applied as it constitutes the most recent version of the probably most known open-source object detection methods. YOLOv8 provides models of varying complexity: x, l, m, s, and n (in descending order), from which we use version x. YOLO models have been employed in traffic analysis research, yielding promising outcomes [
28,
29,
30]. As of now, the latest iteration, YOLOv8, has not been applied in any other studies within the traffic analysis domain.
Furthermore, it is important to emphasise that all eight object detection models were applied with their out-of-the-box settings. It would go beyond the scope of this paper to provide an extensive list of all the parameters and further settings of the models applied. Rather, readers interested are invited to have a look at the documentation of the mmdetection library [
21] or the key paper on the mmdetection toolbox [
31] for the models Yolov3, Faster R-CNN R-50, Faster R-CNN R-101, Faster R-CNN X-101, Cascade R-CNN (X-101), Cascade Mask R-CNN (X-101), and RetinaNet. In addition, Ultralytics constitutes the best source for more information on the actual implementation of Yolov8x [
22].
Different metrics are common in the related literature for the evaluation of object detection models. While ref. [
7], for example, compare the absolute counts of the vehicles detected by convolutional neural networks to their manual labelling, ref. [
17] apply the Mean Absolute Error (MAE), and [
18] use the Mean Average Precision. The choice of a concrete metric for the comparison often depends on the data available and the objective of the analysis [
32].
In this study, the MAE is used as it provides an easily comprehensible metric and aligns well with the data and the main objective of the analysis: comparing the results of different object detection models with each other and with the counts from the manual labelling. The MAE is calculated separately for each lighting condition and mode of transport according to the following formula (Equation (1)):
with
MAEodm, mot, lc: The Mean Absolute Error of object detection model odm for mode of transport mot in lighting condition lc
odm: object detection model
mot: mode of transport
lc: lighting condition
MCOmot, i: The number of manually counted objects of mode of transport mot in image i
i: image
ADOodm, mot, i: The number of automatically detected objects of mode of transport mot in image I by object detection model odm
Nlc: The number of images in lighting condition lc
Thus, the MAE is used to outline the average performance of each object detection model in detecting the different modes of transport across all images under various lighting conditions. Furthermore, to enhance the transparency of this study, the detailed results for each object detection model and each image are provided in
Table A1,
Table A2,
Table A3,
Table A4 and
Table A5 in
Appendix A.
4. Results
In this section, we present the quantitative results of the object detection models compared to the reference data. Results are compared for varying lighting conditions using the mean absolute error.
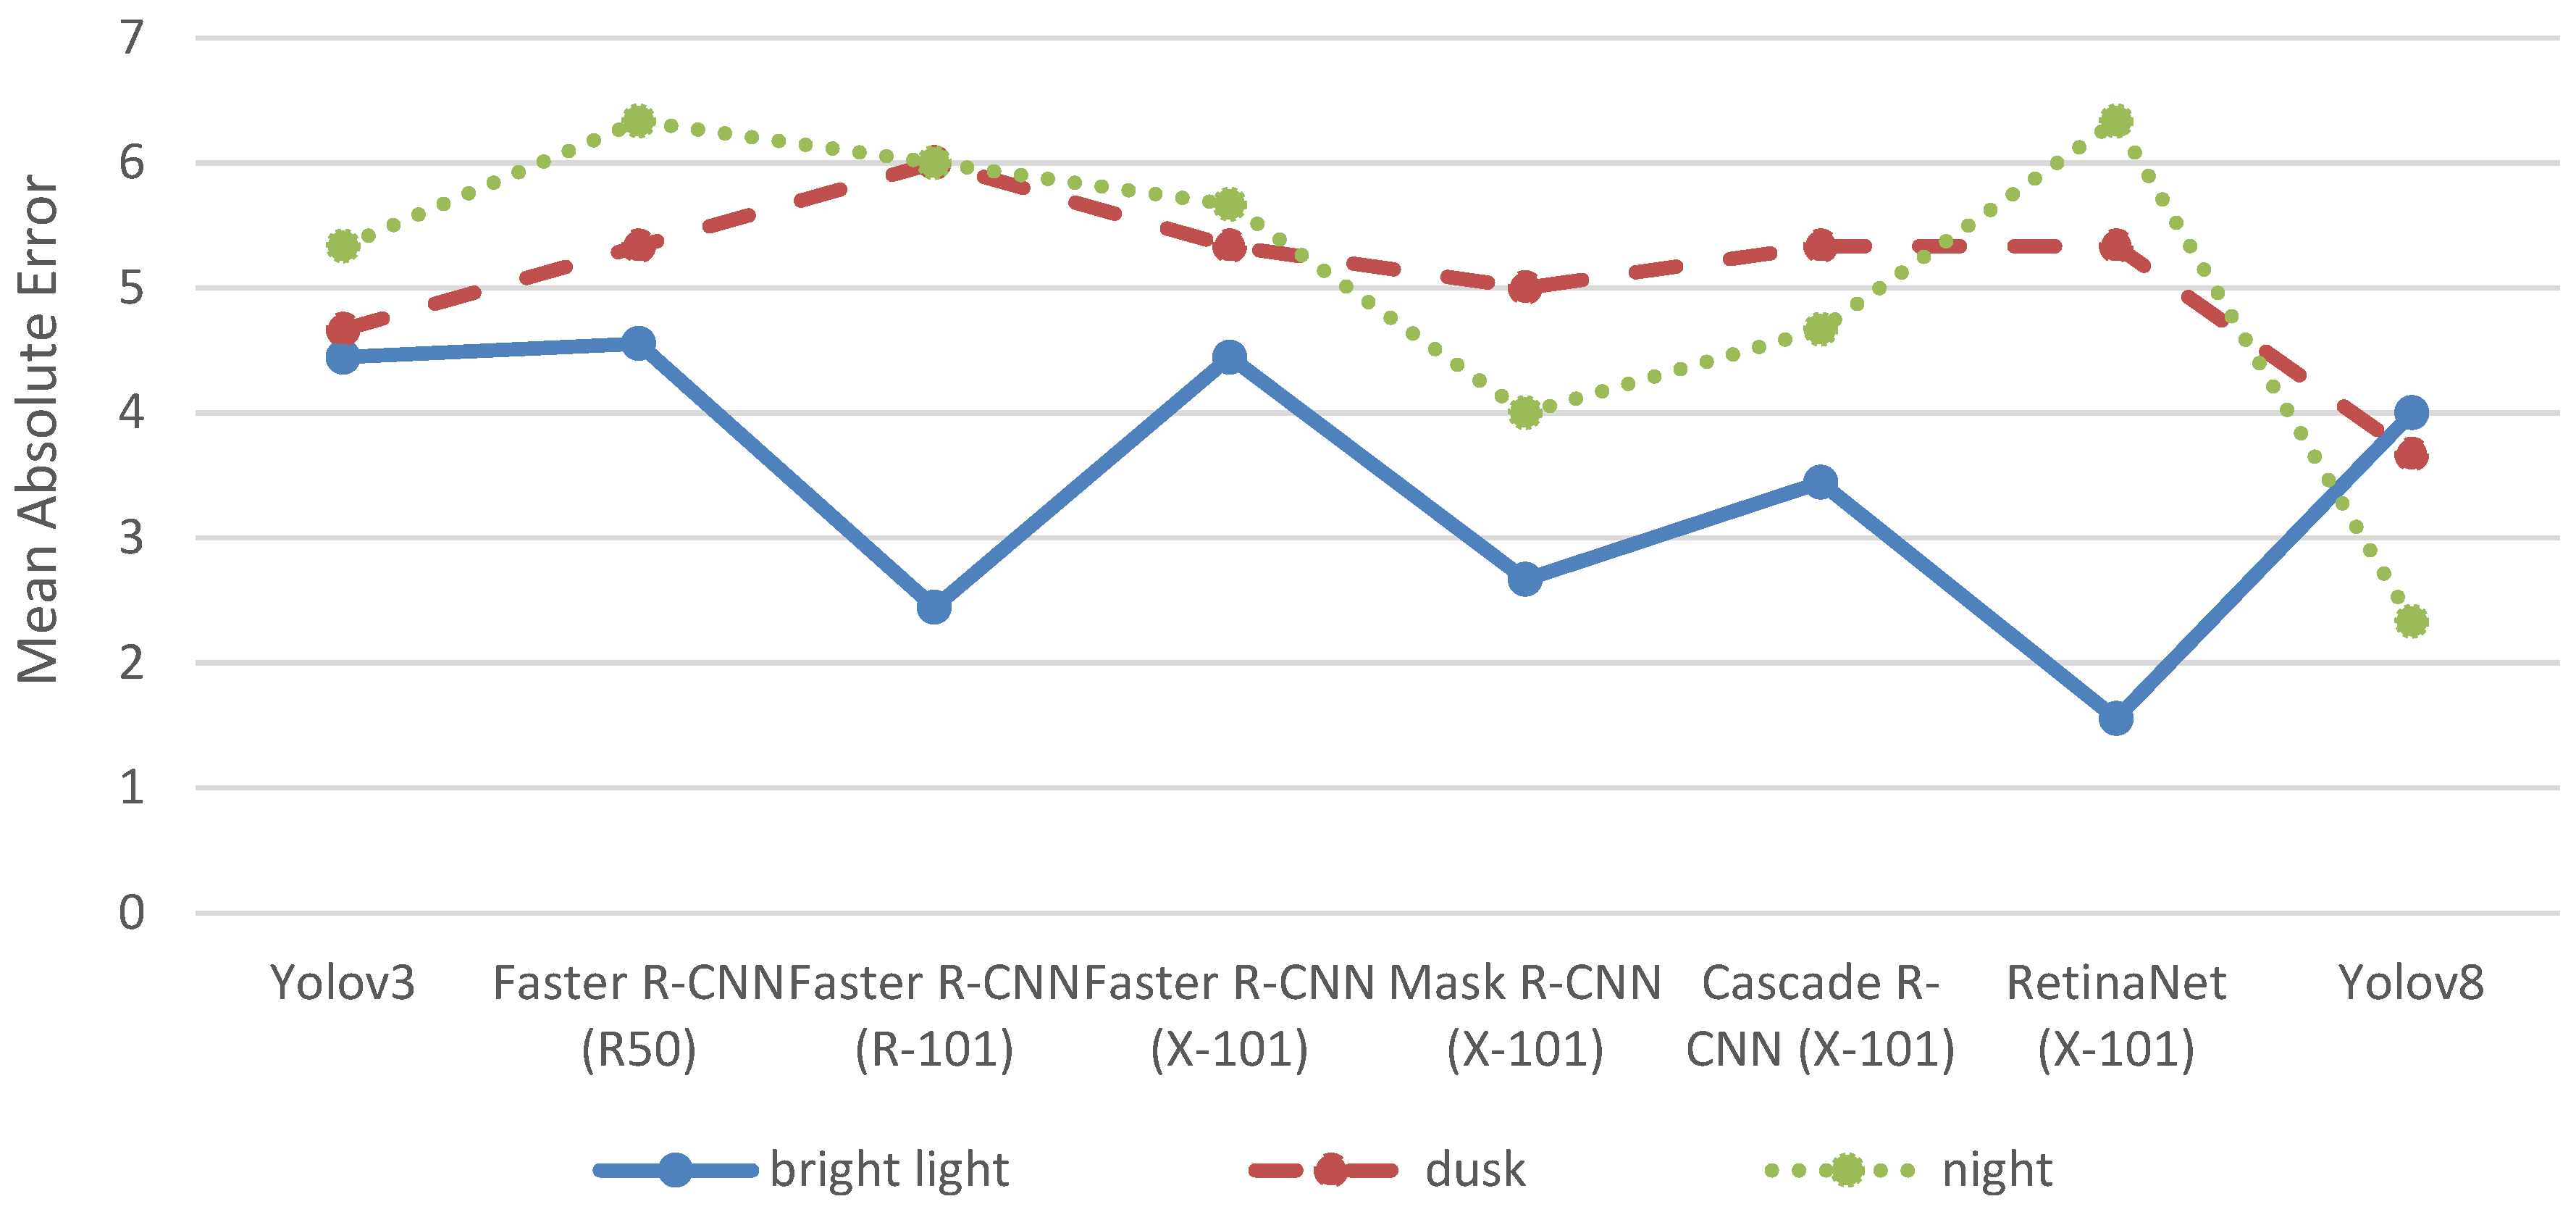
Figure 3 outlines the MAE for each object detection model in detecting cars, categorized by the investigated lighting conditions: brightness, dusk, and night.
With the exception of Yolov8, all object detection models perform best under bright light conditions and worse at dusk or night. However, the impact of the lighting conditions on the detection accuracy for cars differs considerably among the object detection algorithms. For instance, RetinaNet (X-101) achieves the lowest MAE of 1.56 under bright light but shows the highest MAE of 6.33 at night and the second-highest MAE of 5.33 at dusk. In contrast, YOLOv3 demonstrates a much more consistent performance with an MAE of 4.44 under bright light, 4.67 at dusk, and 5.33 at night, indicating that its accuracy is less sensitive to changes in lighting conditions.
The manual count of cars ranges from 0 to 22 in the different images (see
Table 1). Thus, the MAE of 1.56 of RetinaNet (X-101) at bright light conditions can be considered as a very good result as it indicates that the model, on average, detects fewer than two cars more or less than the actual count. In contrast, the MAE of 6.33 for RetinaNet (X-101) at night is less satisfactory, as it suggests the model detects more than six cars more or less than the actual count. For night conditions, Yolov8 with an MAE of 2.33 demonstrates considerably higher accuracy.
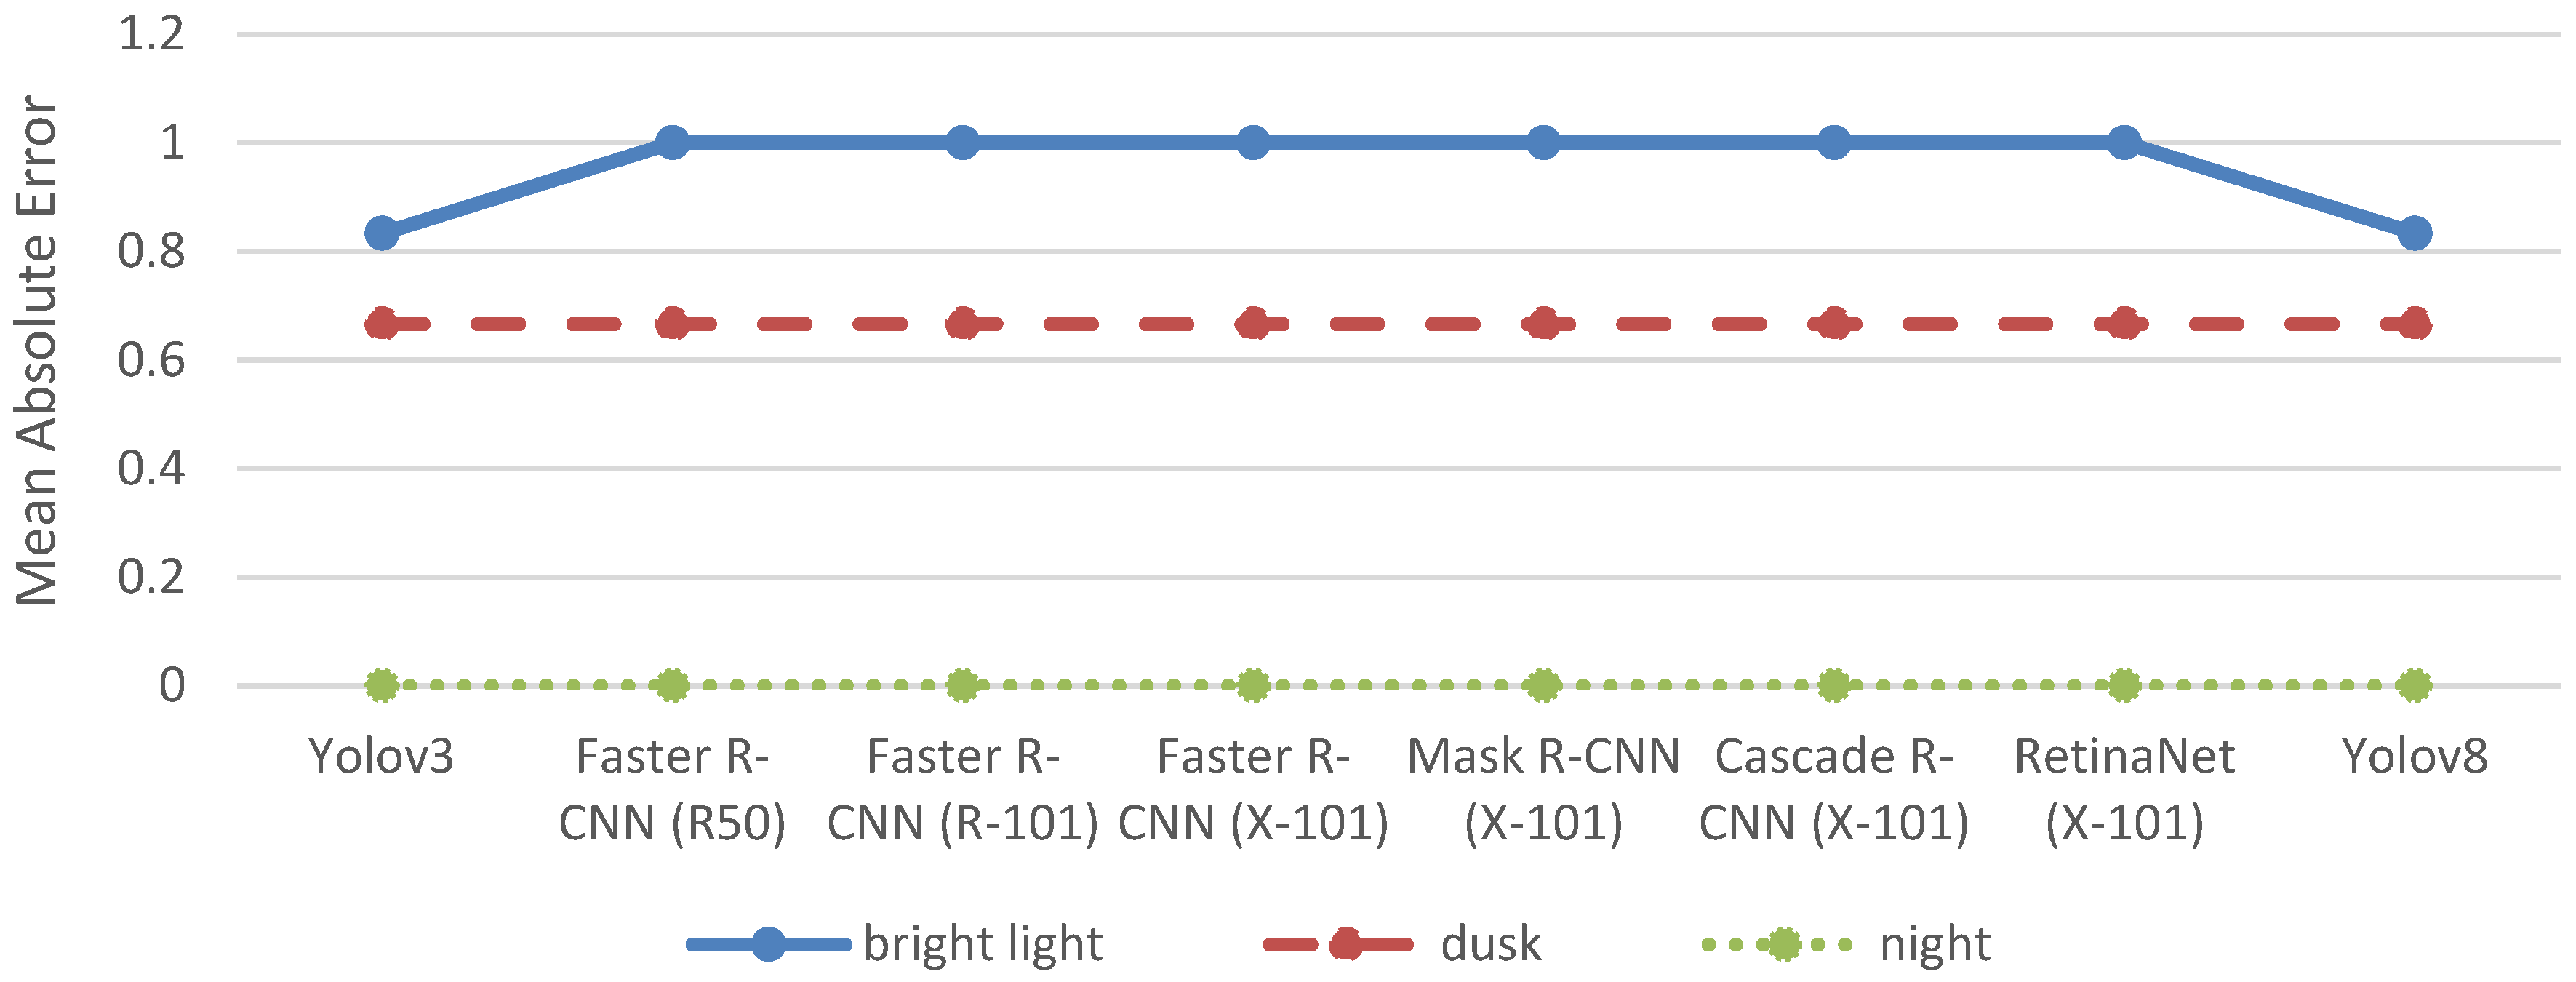
With a manual count ranging from 0 to 3 (see
Table 1), considerably fewer bicycles were present on average in the images compared to cars. Consequently, also the MAEs of the different object detection models for bicycles are considerably lower than for cars, as revealed by
Figure 4.
Identifying bicycles in the images from the different webcams is challenging. Even during manual counts, only a very thorough inspection by eye could reveal the few bicycles present in some images. Consequently, detecting bicycles in these images also constitutes a significant challenge for the automated object detection models. The MAE is almost the same across all object detection models among the different lighting conditions, likely due to the limited number of bicycles in the images, which may obscure potential differences in the detection accuracy among the models.
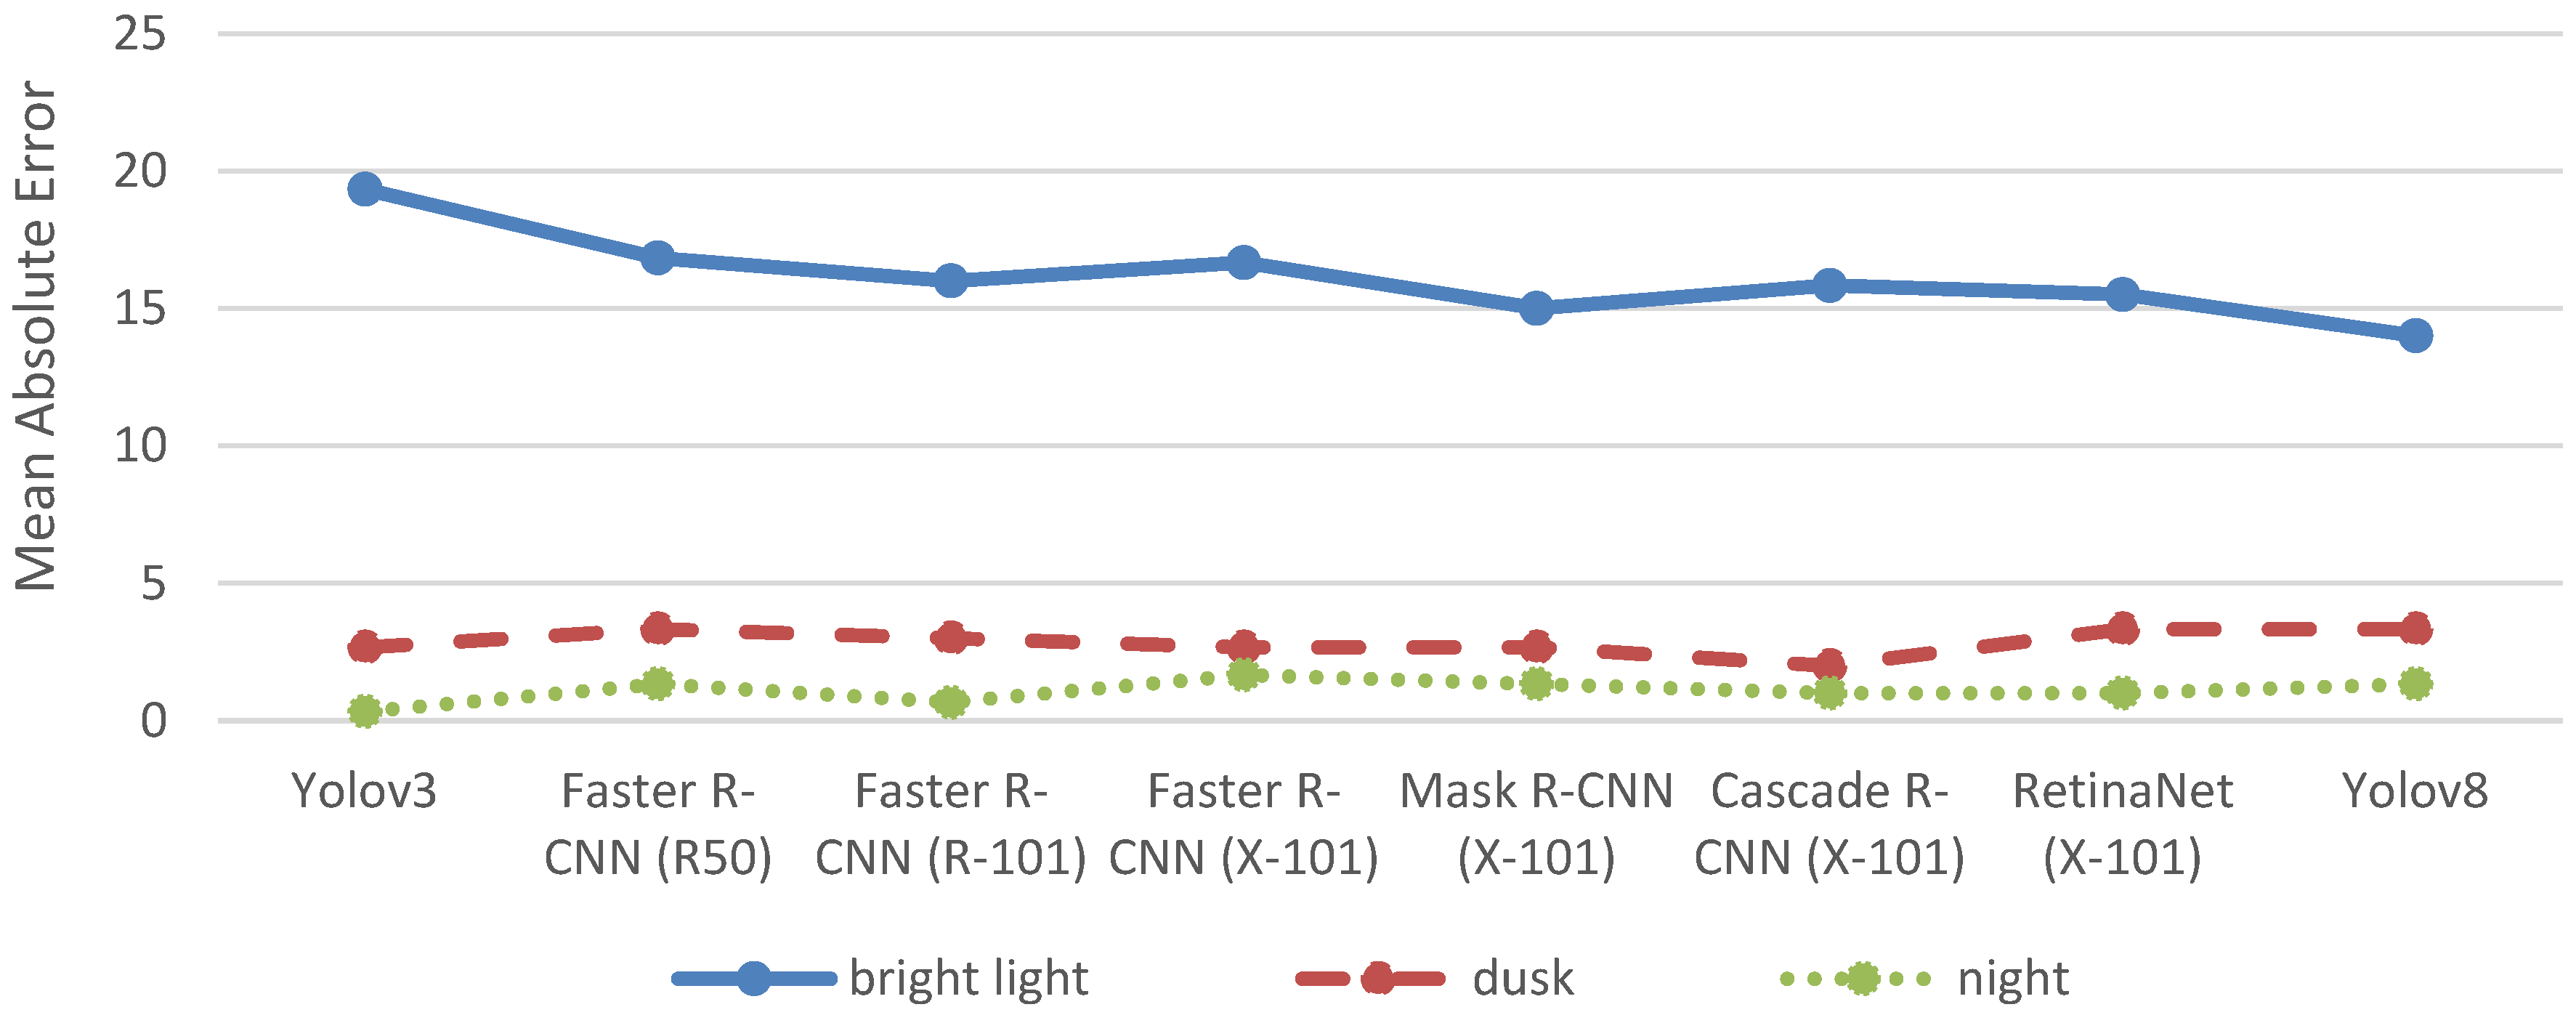
In contrast, the number of persons identified by manual counting varies between 0 and 49 on the different images (see
Table 1). Hence the MAE shown in
Figure 5 provides a more robust basis for comparing the detection accuracy of the object detection models.
At bright light conditions Yolov8 achieves the highest detection accuracy of persons with an MAE of 14, while Yolov3 has the lowest detection accuracy with an MAE of 19.33. However, at dusk and night the variation in MAEs is much smaller. At dusk, Cascade R-CNN (X-101) has the lowest MAE of 2, while Faster R-CNN (R50) and Yolov8 both have the highest MAE of 3.33. At night, the MAE ranges from 0.33 for Yolov3 to 1.67 for Faster R-CNN (X-101). The much lower MAEs at dusk and at night probably rely on much fewer people being present on the images than at bight light conditions at daytime.
In fact, the MAEs under bright light conditions are too high across all object detection models to consider the detection accuracy of persons as very satisfactory. Even the MAE of Yolov8 indicates that the model on average detects 14 persons more or less than the manual count by the eye on the images. Yet, the results also show that the object detection models generally are capable of detection persons on the webcams images, even if not with the desired accuracy. Fine-tuning the models of developing weights to better match the manual counts could offer opportunities to improve the detection accuracy to a satisfactory level.
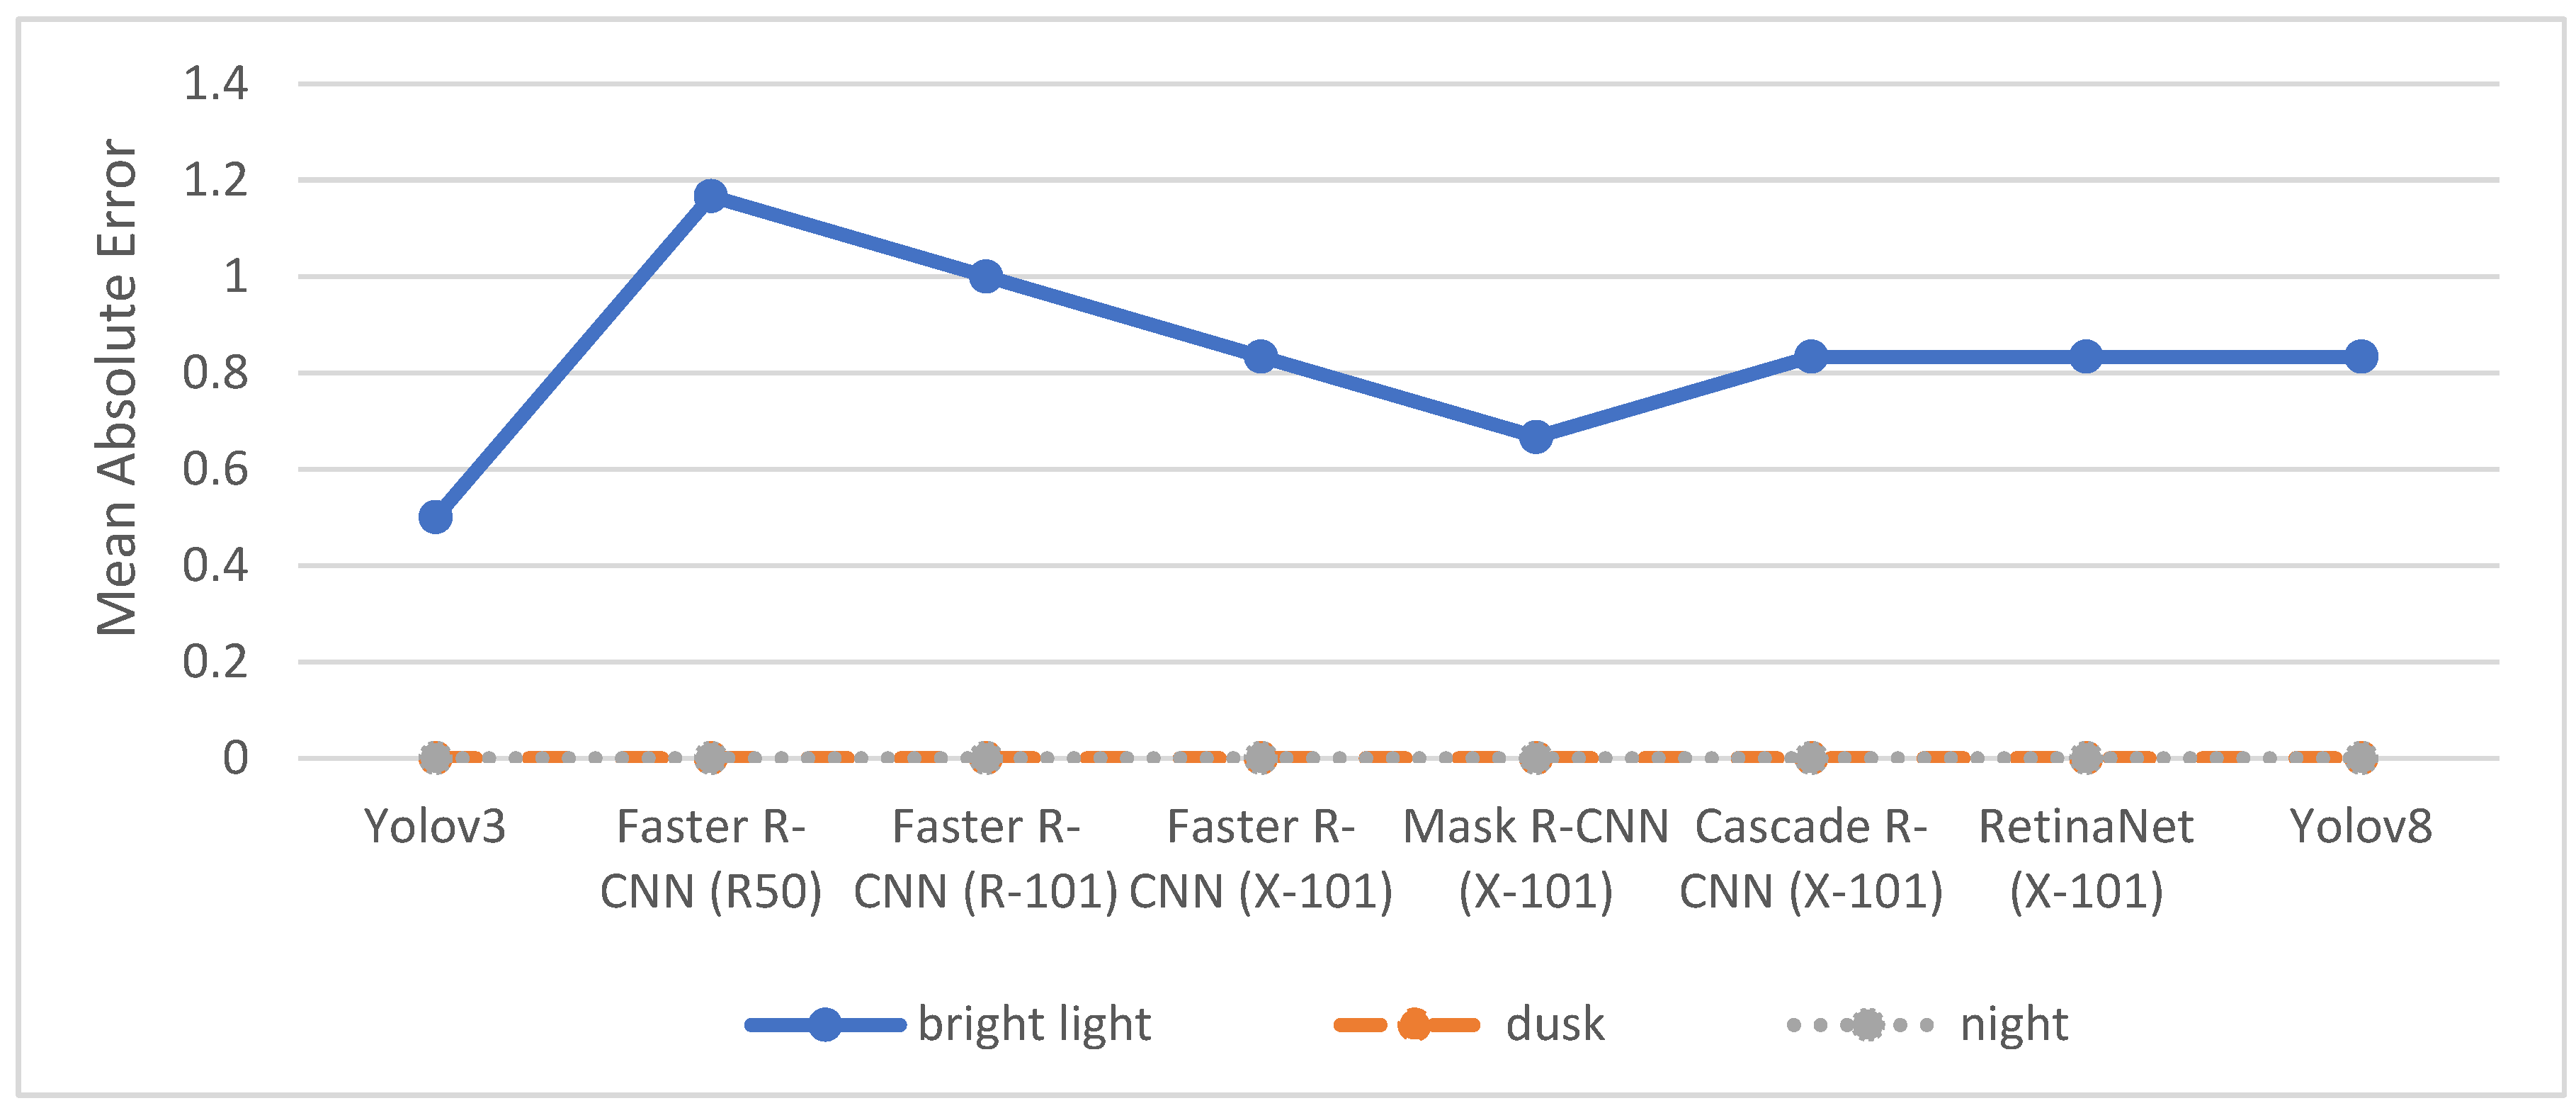
Figure 6 outlines the MAE of the object detection models across the different lighting conditions for trucks.
The MAEs for most object detection models at dusk and night are 0, which is expected as no trucks were present in the images taken during these times. However, four object detection models have an MAE of 0.33 either at dusk or at night, showing that they incorrectly classified other objects as trucks. Indeed, each of these four object detection models misclassified one object as a truck on one of the images (see
Table A4 in
Appendix A).
At bright light conditions, the number of trucks identified in the manual counts varies between 0 and 4 on the different images. Consequently, the MAE values are generally higher at bright light conditions with Faster R-CNN (R50) having the lowest MAE of 1.17 and Faster R-CNN (R-101) and Cascade R-CNN (X-101) having the highest MAE of 1.83. While all models on most images at bight light conditions detected less trucks than the manual counts, Yolov3, Faster R-CNN (R-101), Faster R-CNN (X-101), Mask R-CNN (X-101), and RetinaNet (X-101) also falsely classified other objects as trucks on some images at bright light conditions (see
Table A4 in
Appendix A).
Nonetheless, the limited number of trucks being present in the images restrict a thorough comparison of detection accuracy across the models. Therefore, differences in the MAEs for trucks should be interpreted cautiously. The same caution applies to the MAEs for buses shown in
Figure 7.
In fact, among the 15 images, only one bus was identified in the manual counts, and it was detected in one of the bright light images (see
Table 1). Consequently, it is a rather good result that all object detection models have an MAE of 0 both at dusk and at night as this means that none of them falsely classified an object as a bus (see
Table A5 in
Appendix A).
Yet, under bright light conditions all object detection models falsely classified other objects as buses. In fact, Faster R-CNN (R50) falsely detected four buses on one image, while RetinaNet (X-101) and Yolov8 falsely detected three buses on the same image (see
Table A5 in
Appendix A). Furthermore, Yolov8 was the only object detection model that successfully detected the only bus that actually was present on one of the images.
To sum up, none of the object detection models provide satisfactory results for bus detection. While the detection of too few buses could be corrected by the development of suitable weights to meet the actual number of buses on an image, the false classification of other objects as buses jeopardises the weighting. Unfortunately, the results at hand indicate that there is a systematic problem with the false classification of other objects as buses in the object detection models applied.
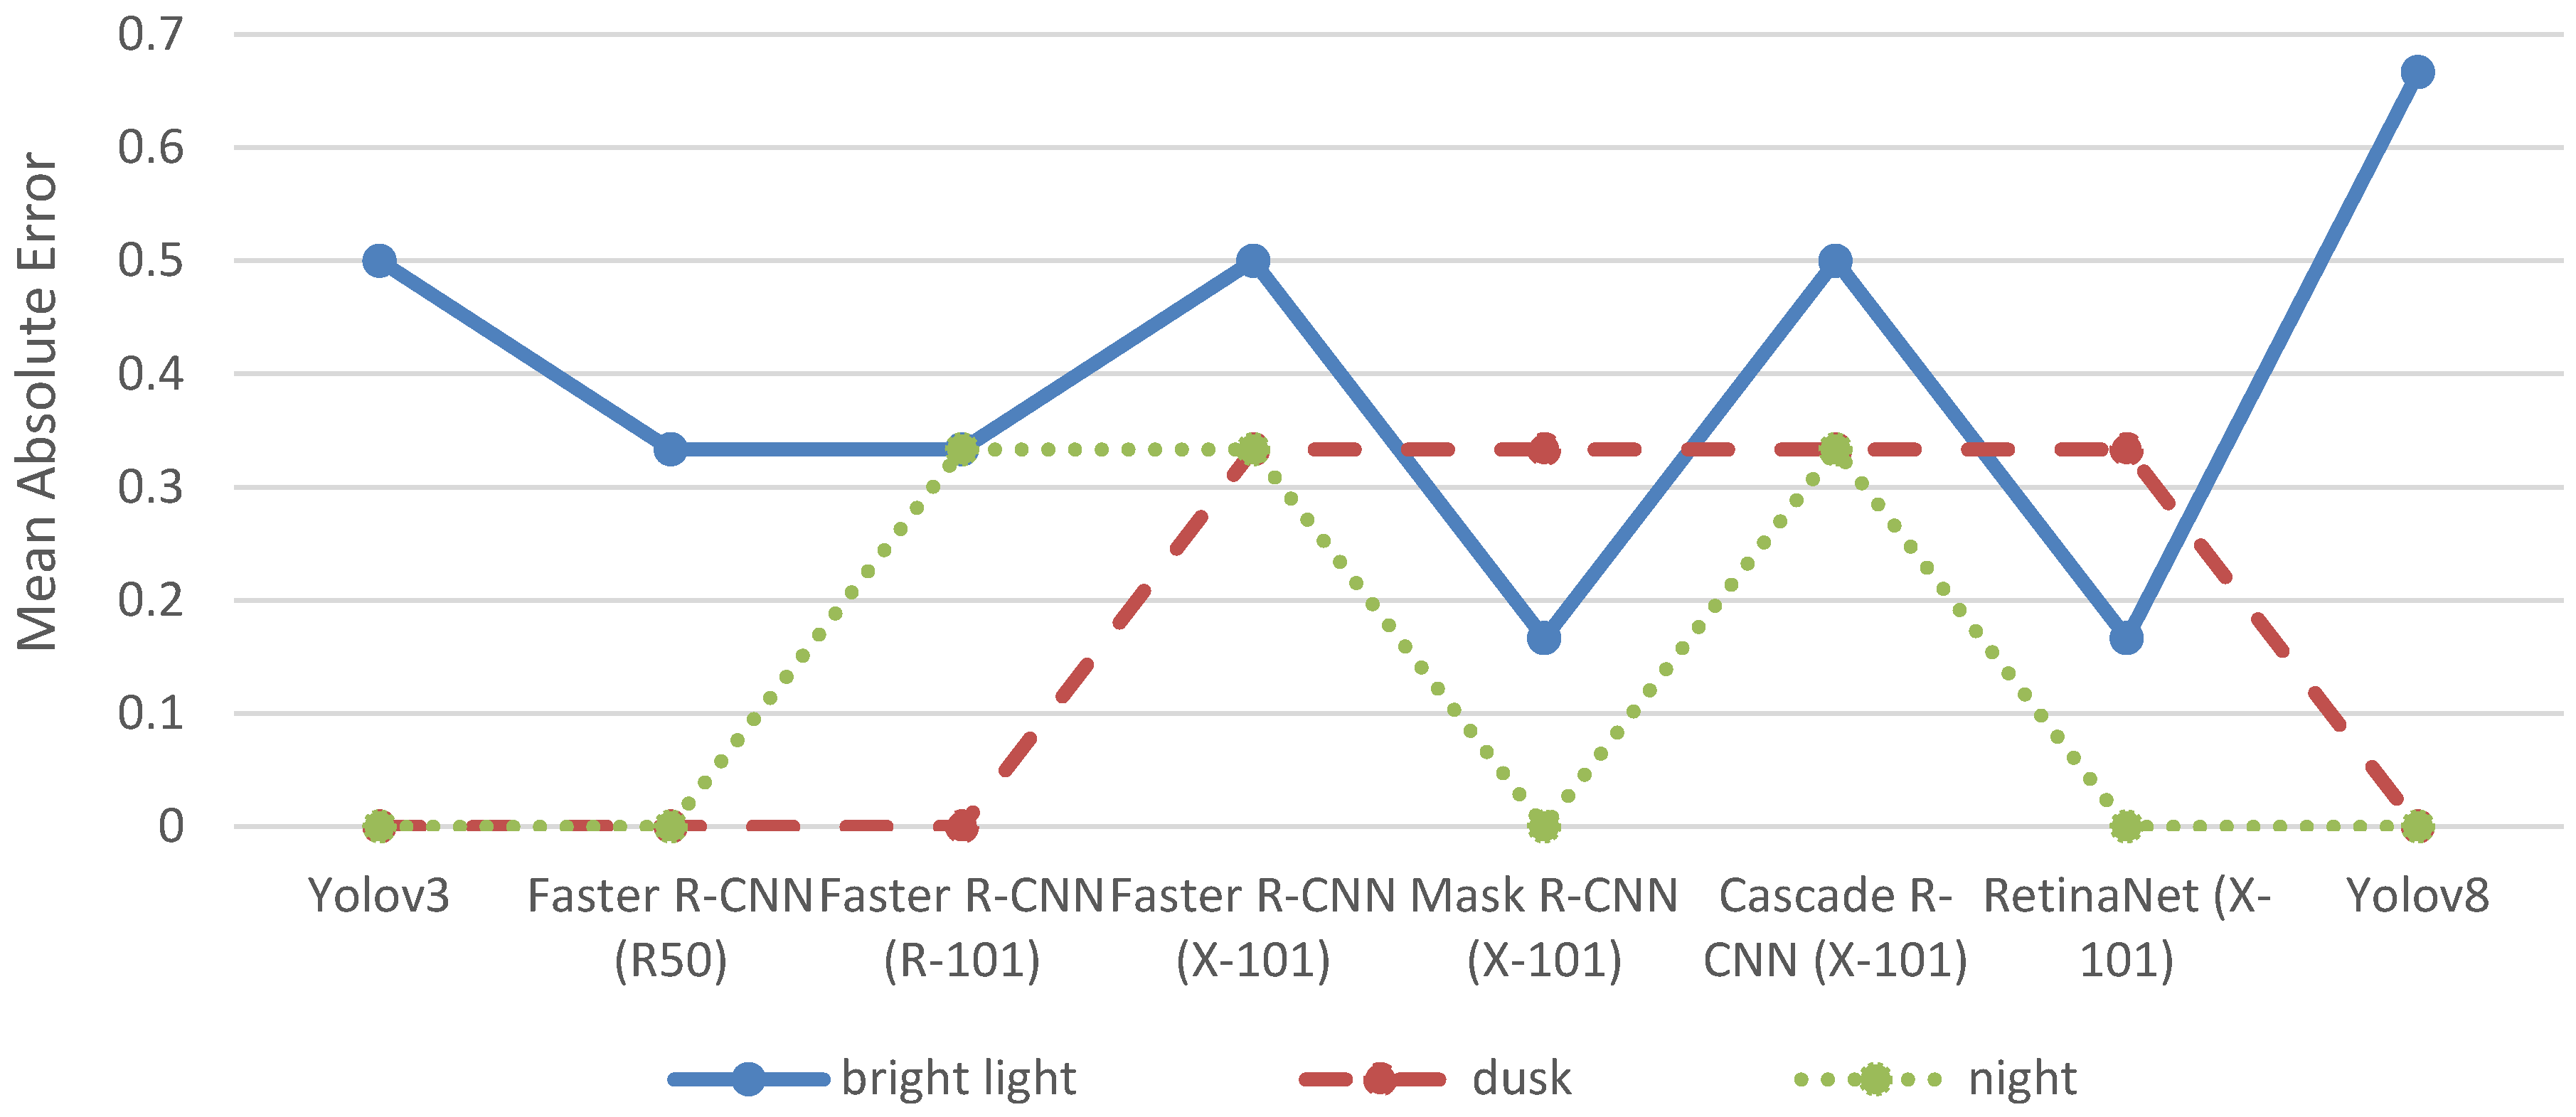
Figure 8 shows the MAE of the object detection models across the different lighting conditions for trams.
Although no trams were present on any of the images at dusk or night, five object detection models have an MAE higher than 0 either at dusk or night. Indeed, Specifically, faster R-CNN (R-101), Faster R-CNN (X-101), Mask R-CNN (X-101), Cascade R-CNN (X-101), and RetinaNet (X-101) each falsely classified at least one object as a tram in images at dusk or night (see
Table A6 in
Appendix A). In addition, Faster R-CNN (X-101), Mask R-CNN (X-101), Cascade R-CNN (X-101), and RetinaNet (X-101) each falsely classified one other object as a tram on the same image under bright light conditions.
Among the bright light images, only two included trams (see
Table 1). In one image, three trams were manually counted, and in the other image, one tram was manually counted. Mask R-CNN (X-101) and RetinaNet (X-101) have the lowest MAE at bright light conditions as they detected two out of the three trams on the one image as well as the tram on the other image. However, both Mask R-CNN (X-101) and RetinaNet (X-101) also misclassified another object as a tram on an image without any trams according to the manual counts (see
Table A6 in
Appendix A).
As previously discussed, these false positives can pose significant challenges in developing procedures to accurately match the actual object count, often more so than false negatives, where existing objects in the image are not detected. Therefore, Faster R-CNN (R50) would constitute a better choice for the detection of trams. It does not have the lowest MAE but it has correctly detected one out of three trams on one image as well as the tram on another image without falsely classifying any other objects as trams in any of the three lighting conditions.
5. Discussion
The application of out-of-the-box open-source object detection models to images from public webcams has shown that the detection accuracy varies considerably among different traffic participants and lighting conditions. In sum, a satisfactory high detection accuracy could only be achieved for cars at bright lighting conditions. In addition, the detection of persons at bright light conditions worked in principle. Although the MAE of all object detection models was at least 14, this mainly relied on too few people being detected in comparison to the manual counts. Consequently, this source of inaccuracy could be overcome by the development of weights to upscale the number of persons found by the object detection models to the number of persons manually counted.
In contrast, the automatic detection of bicycles, trams, buses, and trucks did not achieve a satisfactory accuracy even at bright light conditions. This, however, is due to a number of reasons and does not necessarily imply that the application of out-of-the-box open-source object detection models to images from public webcams is not suitable for these traffic participants. First, many images contained very few or no bicycles, trams, buses, or trucks as the locations of the webcam available in the city of Brunswick are ideal for capturing bicycles, trams, buses, or trucks. Therefore, the empirical data used in this study is only partly suitable for evaluating the detection accuracy for these kinds of traffic participants. Second, all three public webcams in the city of Brunswick are located relatively far from the traffic participants they capture. Thus, traffic participants appear as relatively small objects in the images, making their detection more challenging for the object detection models. Finally, the sampling of the images used in this study focused covering the three different lighting conditions of bright light, dusk, and night. Except of that condition, the sampling process was random.
However, public webcams in other cities may capture streets or squares with higher traffic volumes of bicycles, trams, buses, and trucks. In addition, other public webcams might provide images from closer distances and more favourable angles, potentially improving the ability of object detection models to identify these vehicles. Therefore, the fact that out-of-the-box open-source object detection models did not achieve a satisfactory accuracy in identifying bicycles, trams, buses, and trucks in this study does not imply that these models have no potential in detecting the named traffic participants on public webcams in general.
Except for Yolov8, none of the tested object detection models achieved satisfactory results in detecting any of the six categories of traffic participants at dusk or night. In fact, also Yolov8 only provided a relatively high detection accuracy for cars with an MAE of 3.67 at dusk and an MAE of 2.33 at night. While very few and often no other traffic participants were actually present at dusk or at night on the images, one of the images at dusk depicts 21 cars in the manual count and another one at night depicts 19 cars. Hence, at least in the case of cars, the data at hand provides a solid foundation for the assessment of the detection accuracy of object detection models at dusk and at night.
The results have shown that the detection accuracy for cars decreases for all object detection models except for Yolov8 at dusk and at night in comparison to bright light conditions. In contrast to the other seven object detection models, Yolov8 achieved a higher detection accuracy for cars at both dusk and nighttime in comparison to bright light conditions. These findings suggest that out-of-the-box object detection models can generally be applied for the automatic detection of cars in images from public webcams across various lighting conditions. However, achieving satisfactory detection accuracy requires using different models tailored to specific lighting conditions.
The findings of this study supplement the insights from the scholarly literature on applying object detection models to public webcams. Ref. [
17] compare object detection models based on rank constrained regression and fully convolutional networks for the detection of vehicles on 212 public webcams in New York, USA. They found that the object detection model based on a fully convolutional network reduces the MAE from 10.99 to 5.31 [
17]. The MAEs for vehicles in the study at hand are even lower and range from 1.56 to 4.56 at bright light conditions for the eight different object detection models tested.
However, the results should not directly be compared to each other as [
17] applied the object detection models to a video dataset, while the study at hand relied on images from public webcams. Furthermore, ref. [
17] attempted to optimise the object detection model to achieve a higher accuracy, while the study at hand used out-of-the-box object detection models without any fine-tuning. Still both studies demonstrate that object detection models can be used to identify vehicles on data from public webcams at a satisfactory high accuracy.
In contrast to [
17] which focused on identifying vehicles only, the study at hand also analysed whether object detection models can identify persons, bicycles, buses, trucks, and trams on the images from public webcams. While most images contained no or too few examples of bicycles, buses, trucks, and trams to properly evaluate the detection accuracy, it could be shown that the detection of persons on images from public webcams principally works with out-of-the-box object detection models. In doing so, the results of the study at hand supplement the findings of [
17] by demonstrating that not just vehicles but also persons can be detected on data from public webcams by object detection models.
Furthermore, the findings of the study at hand are in line with the results of [
18] who analysed whether object detection models can identify vehicles and persons in images from public webcams in London and North East England. Although [
18] used the mean average precision metric to evaluate detection accuracy, while the study at hand applied the MAE, both studies find that the detection accuracy is higher for vehicles than for persons among all object detection models tested. While in this study, RetinaNet (X-101) showed the highest detection accuracy for vehicles and Yolov8 proved to work best for detecting persons, ref. [
18] illustrated how an ensemble of the object detection models Faster-RCNN and YOLOv5x outperformed each model on its own in the detection of both vehicles and persons.
Hence, both studies provide evidence for the usefulness of object detection models for the detection of vehicles and persons in images from public webcams. This evidence is further strengthened by the use of images not only from public webcams in different countries but also of varying resolutions. While [
18] had to downscale images to prevent the recognition of faces and licence plates, thereby addressing data protection concerns, the images used in this study were captured from such a great distance that data protection was not an issue from the outset. In sum, the two studies show that object detection models can be used for the detection of vehicles and persons in images from public webcams displaying these objects at different angles, different distances, and different resolutions.
Finally, unlike both [
17] and [
18], this study explored the impact of various lighting conditions on the detection accuracy of the eight object detection models tested. In doing so, it contributes to the scholarly literature by addressing a previously overlooked issue. The key finding is that different object detection models are required for accurate detection of the same object under varying lighting conditions, such as bright light, dusk, or night.
Since annotating domain-specific image data is time-consuming and typically requires expert knowledge, this study focused on evaluating pre-trained object detection models without any additional fine-tuning. The aim was to test their plug-and-play potential in real-world, low-effort contexts. While this setup highlights the practical feasibility of such models, we acknowledge that domain adaptation with fine-tuning could improve detection accuracy [
33]. Moreover, due to the naturally imbalanced presence of traffic participants in public webcam footage, some categories—such as buses, trams, and trucks—were less represented, while others, particularly cars, occurred frequently. This limits the conclusiveness of our evaluation for these categories and may bias performance metrics. Future research should therefore explore methods for targeted model optimisation and training on larger, more balanced datasets, e.g., by using data augmentation techniques [
34].
6. Conclusions
This paper explored the potential of publicly accessible webcams as a valuable data source for transportation research. For this purpose, eight different open-source object detection models were tested on three publicly accessible webcams located in the city of Brunswick, Germany which are updated at regular time intervals. Fifteen images at different lighting conditions (bright light, dusk, and night) were selected from each webcam and manually labelled with regard to the following six categories: cars, persons, bicycles, trucks, trams, and buses. The results of the manual counts in these six categories were then compared to the number of counts found by the object detection models.
The main conclusion is that open webcams can indeed serve as a useful source of data for transportation research. In particular, under bright light conditions, applying out-of-the-box object detection models to these webcams can yield reliable counts of cars or persons in public squares, streets, and junctions. Although the number of cars and persons detected automatically was usually lower than the manual counts by humans, the difference was small enough to be overcome by weights. Consequently, combing object detection models and publicly accessible webcams could provide a free and continuous source of data for determining traffic flows of cars or persons at bright light conditions which can then be used to calibrate transport demand models.
However, irrespective of lighting conditions, the object detection models worked less well for identifying trams, buses, bicycles, and trucks. Since the object detection models were applied out-of-the-box in this study, i.e., without adjusting or adapting the models to the task at hand, future research should investigate whether and to what extent the detection accuracy of trams, buses, bicycles, and trucks can be enhanced by fine-tuning and adapting the models to the specific webcams used. For this purpose, future studies should specifically select images from webcams showing a high number of trams, buses, bicycles, and trucks in order to have a more suitable source of data for evaluating the detection of these objects than this study.
This study is exploratory in nature and does not aim to provide statistically significant results. The sample size was limited due to the high annotation effort, and the focus of the study was on identifying challenges specific to public webcam imagery. Thus, one of the limitations of this study is its relatively small number of images. The small number was deliberately chosen to enable the explorative approach of this paper. However, future research should build on the findings presented in this paper and extend this analysis with more images of different means of transport in many different lighting conditions as well as apply fine-tuning for the object detection models. This could help in overcoming the limitations of the small number of images used in this paper and validate the findings on a broader source of data.
In addition, the detection of cars and persons was not reliably accurate at dusk or night, and performance declines significantly under poor lighting conditions or for less frequent classes such as trams and buses. Future research should investigate whether it is possible to adapt object detection models to maintain high accuracy across all lighting conditions and relevant object classes, or if different models should be employed for different times of day. If the latter is necessary, future studies should also explore how to automate this process to ensure a consistent and reliable source of data for transportation research using publicly accessible webcams.


