Systematic Review

Success Factors in Transport Interventions: A Mixed-Method Systematic Review (1990–2022)

Department of Psychology, School of Social Sciences, Humanities and Law (SSSHL), Teesside University, Middlesbrough TS1 3BA, UK
*
Author to whom correspondence should be addressed.
Future Transp. 2025, 5(3), 82; https://doi.org/10.3390/futuretransp5030082
Submission received: 4 March 2025 / Revised: 8 May 2025 / Accepted: 26 May 2025 / Published: 1 July 2025

Abstract

This study is titled “Success Factors in Transport Interventions: A Mixed-Method Systematic Review (1990–2022)”. The purpose of the systematic review is to (1) identify effective interventions for transitioning individuals from private car reliance to sustainable transport, (2) summarise psychosocial theories shaping transportation choices and identify enablers and barriers influencing sustainable mode adoption, and (3) determine the success factors for interventions promoting sustainable transport choices. The last search was conducted on 18 November 2022. Five databases (Scopus, Web of Science, MEDLINE, APA PsycInfo, and ProQuest) were searched using customised Boolean search strings. The identified papers were included or excluded based on the following criteria: (a) reported a modal shift from car users or cars to less CO2-emitting modes of transport, (b) covered the adoption of low-carbon transport alternatives, (c) comprised interventions to promote sustainable transport, (d) assessed or measured the effectiveness of interventions, or (e) proposed behavioural models related to mode choice and/or psychosocial barriers or drivers for car/no-car use. The identified papers eligible for inclusion were critically appraised using Sirriyeh’s Quality Assessment Tool for Studies with Diverse Designs. Inter-rater reliability was assessed using Cohen’s Kappa to evaluate the risk of bias throughout the review process, and low-quality studies identified by the quality assessment were excluded to prevent sample bias. Qualitative data were extracted in a contextually relevant manner, preserving context and meaning to avoid the author’s bias of misinterpretation. Data were extracted using a form derived from the Joanna Briggs Institute. Data transformation and synthesis followed the recommendations of the Joanna Briggs Institution for mixed-method systematic reviews using a convergent integrated approach. Of the 7999 studies, 4 qualitative, 2 mixed-method, and 30 quantitative studies successfully passed all three screening cycles and were included in the review. Many of these studies focused on modelling individuals’ mode choice decisions from a psychological perspective. In contrast, case studies explored various transport interventions to enhance sustainability in densely populated areas. Nevertheless, the current systematic reviews do not show how individuals’ inner dispositions, such as acceptance, intention, or attitude, have evolved from before to after the implementation of schemes. Of the 11 integrated findings, 9 concerned enablers and barriers to an individual’s sustainable mode choice behaviour. In addition, two integrated findings emerged based on the effectiveness of the interventions. Although numerous interventions target public acceptance of sustainable transport, this systematic review reveals a critical knowledge gap regarding their longitudinal impact on individuals and effectiveness in influencing behavioural change. However, the study may be affected by language bias as it only included peer-reviewed articles published in English. Due to methodological heterogeneity across the studies, a meta-analysis was not feasible. Further high-quality research is needed to strengthen the evidence. This systematic review is self-funded and has been registered on the International Platform of Registered Systematic Review and Meta-analysis Protocols (INPLASY; Registration Number INPLASY202420011).

1. Introduction

The importance of shifting from high-carbon-dioxide (CO2) modes of transport to more low-carbon modes, for instance, cars to public transport, is gaining increasing prominence and attention in the recently published literature. Thus far, many attempts have been made to fully understand personal car use behaviour to influence individual behavioural change [1,2]. Individual mode choice is becoming a topic of interest in Germany, as each sector covered by the United Nations Framework Convention on Climate Change (UNFCCC) common reporting format [3] must report a reduced amount of its CO2 emissions. Only the amount of CO2 emissions emitted by the transport sector is not decreasing. [3]. In 2020, Germany’s transport sector total CO2 emission was 162.5 million tonnes—by far the largest and most significant share among the 27 countries within the European Union [4]. The far-reaching consequences, whether global or local, range from toxic and harmful emissions that contribute to global warming to irreversible damage to natural and human ecosystems or habitats and serious health problems such as respiratory diseases caused by air pollution, particularly in Germany’s densely populated areas and urban centres [5,6,7]. The World Meteorological Organization (WMO) has revealed irreversible damage to the natural system. For instance, the average global surface temperature rose 1.1 Celsius above pre-industrial levels in 2017 [8], and the annual global mean temperatures rose from 1.15 °C to 1.28 °C in 2020. Moreover, 2020 was the warmest year on record since record keeping began in the second half of the 19th century in Europe [9]. Germany’s overall CO2 emission totalled 2688.0 million tonnes, while the transport sector alone accounted for 888.8 million tonnes (28.6%) in 2020 [4], which constitutes the largest share of CO2 emissions besides the energy sector. Road traffic specifically totalled 681.6 million tonnes of emitted CO2 in 2020, with emissions caused by cars alone contributing 405.6 million tonnes of that [4]. Given that 76.7% of total transport CO2 emissions were caused by motorised road traffic, and 45.6% of total emissions from transport were caused by car use [4], various interventions exist which aim to reduce high-CO2 modes of transport.
Previous systematic literature reviews have contributed to much of what is already known. They highlight cross-disciplinary issues such as criticism of administrative structures between stakeholders, operators, and governmental bodies [10]; approaches used by local authorities to guide the intervention design and implementation process such as the avoid–shift–implementation (A-S-I) approach [11]; the effectiveness of soft interventions in bringing about behavioural change in car users [12]; how operators’ service quality and travellers’ perceptions can increase ridership and decrease car addiction [13,14]; the adoption of micro-mobility vehicles as a gap-closer to increase the likelihood of public transport usage [15]; and the co-benefits of public transport and how commuters’ driving habits can cause high greenhouse gas emissions [16]. Although several scholars have analysed diverse research problems, research on tracking the progress of interventions and the reasons for their success remains scarce. According to this paper, success refers to significant changes in individuals’ internal dispositions resulting from transport interventions compared to pre- and post-intervention stages. This systematic literature review addresses this gap by posing questions such as whether success is measured in interventions, how it is measured, whether it is methodologically sound, and which success factors can be identified. In addition to determining the success factors of the interventions, this systematic literature review summarises the literature on car-related behavioural models to enhance our understanding of individual car use.
This systematic literature review aims to collate the literature on the interventions that enable car users to use more environmentally friendly modes of transport, such as public transport. It is guided by the following research question, the scope of which is supported by three objectives listed below:
[RQ1] Which interventions have been designed to encourage car users to use sustainable transport modes more frequently?
  • [OBJ1] To identify any developed and implemented interventions designed to capitalise on drivers and overcome barriers.
  • [OBJ2] To identify the success factors of interventions within the literature that demonstrate their usefulness in fostering a modal shift from cars to less CO2-emitting modes of transport and to examine the measurement and tracking of these factors.
  • [OBJ3] To identify psychosocial enablers and barriers linked to behavioural models or studies that decrease the likelihood of using sustainable transport and increase transport modes that are not environmentally friendly.

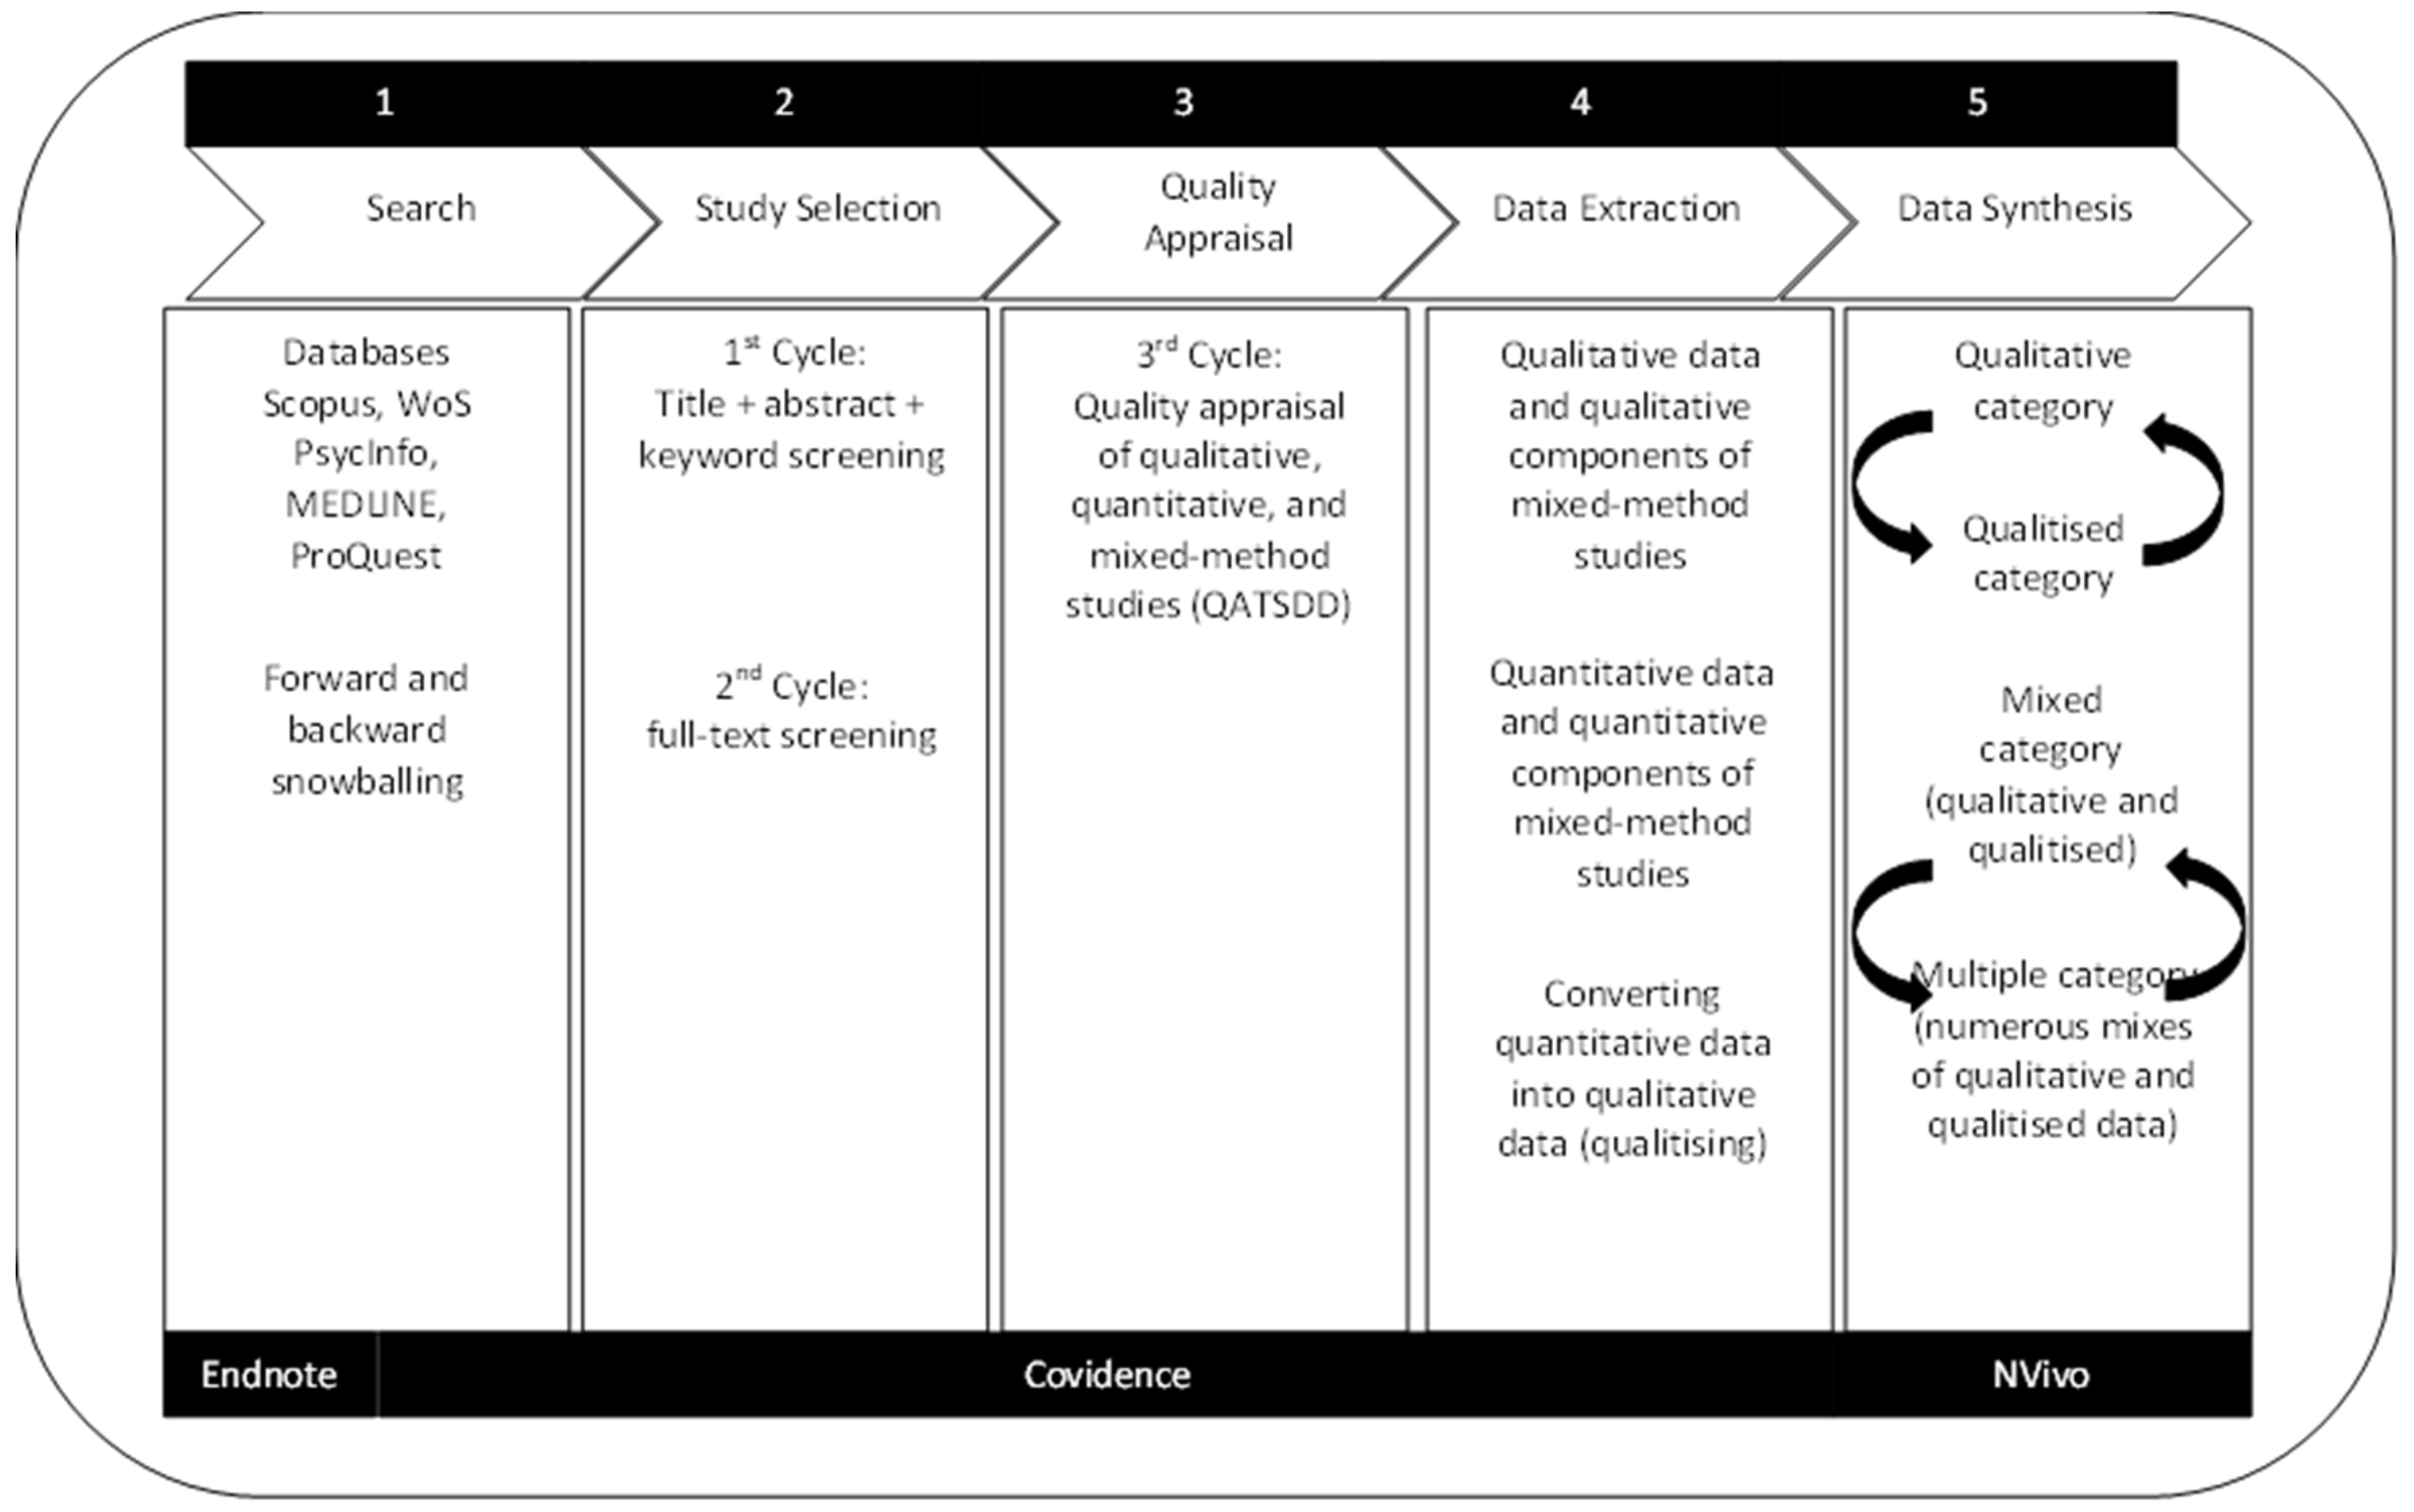
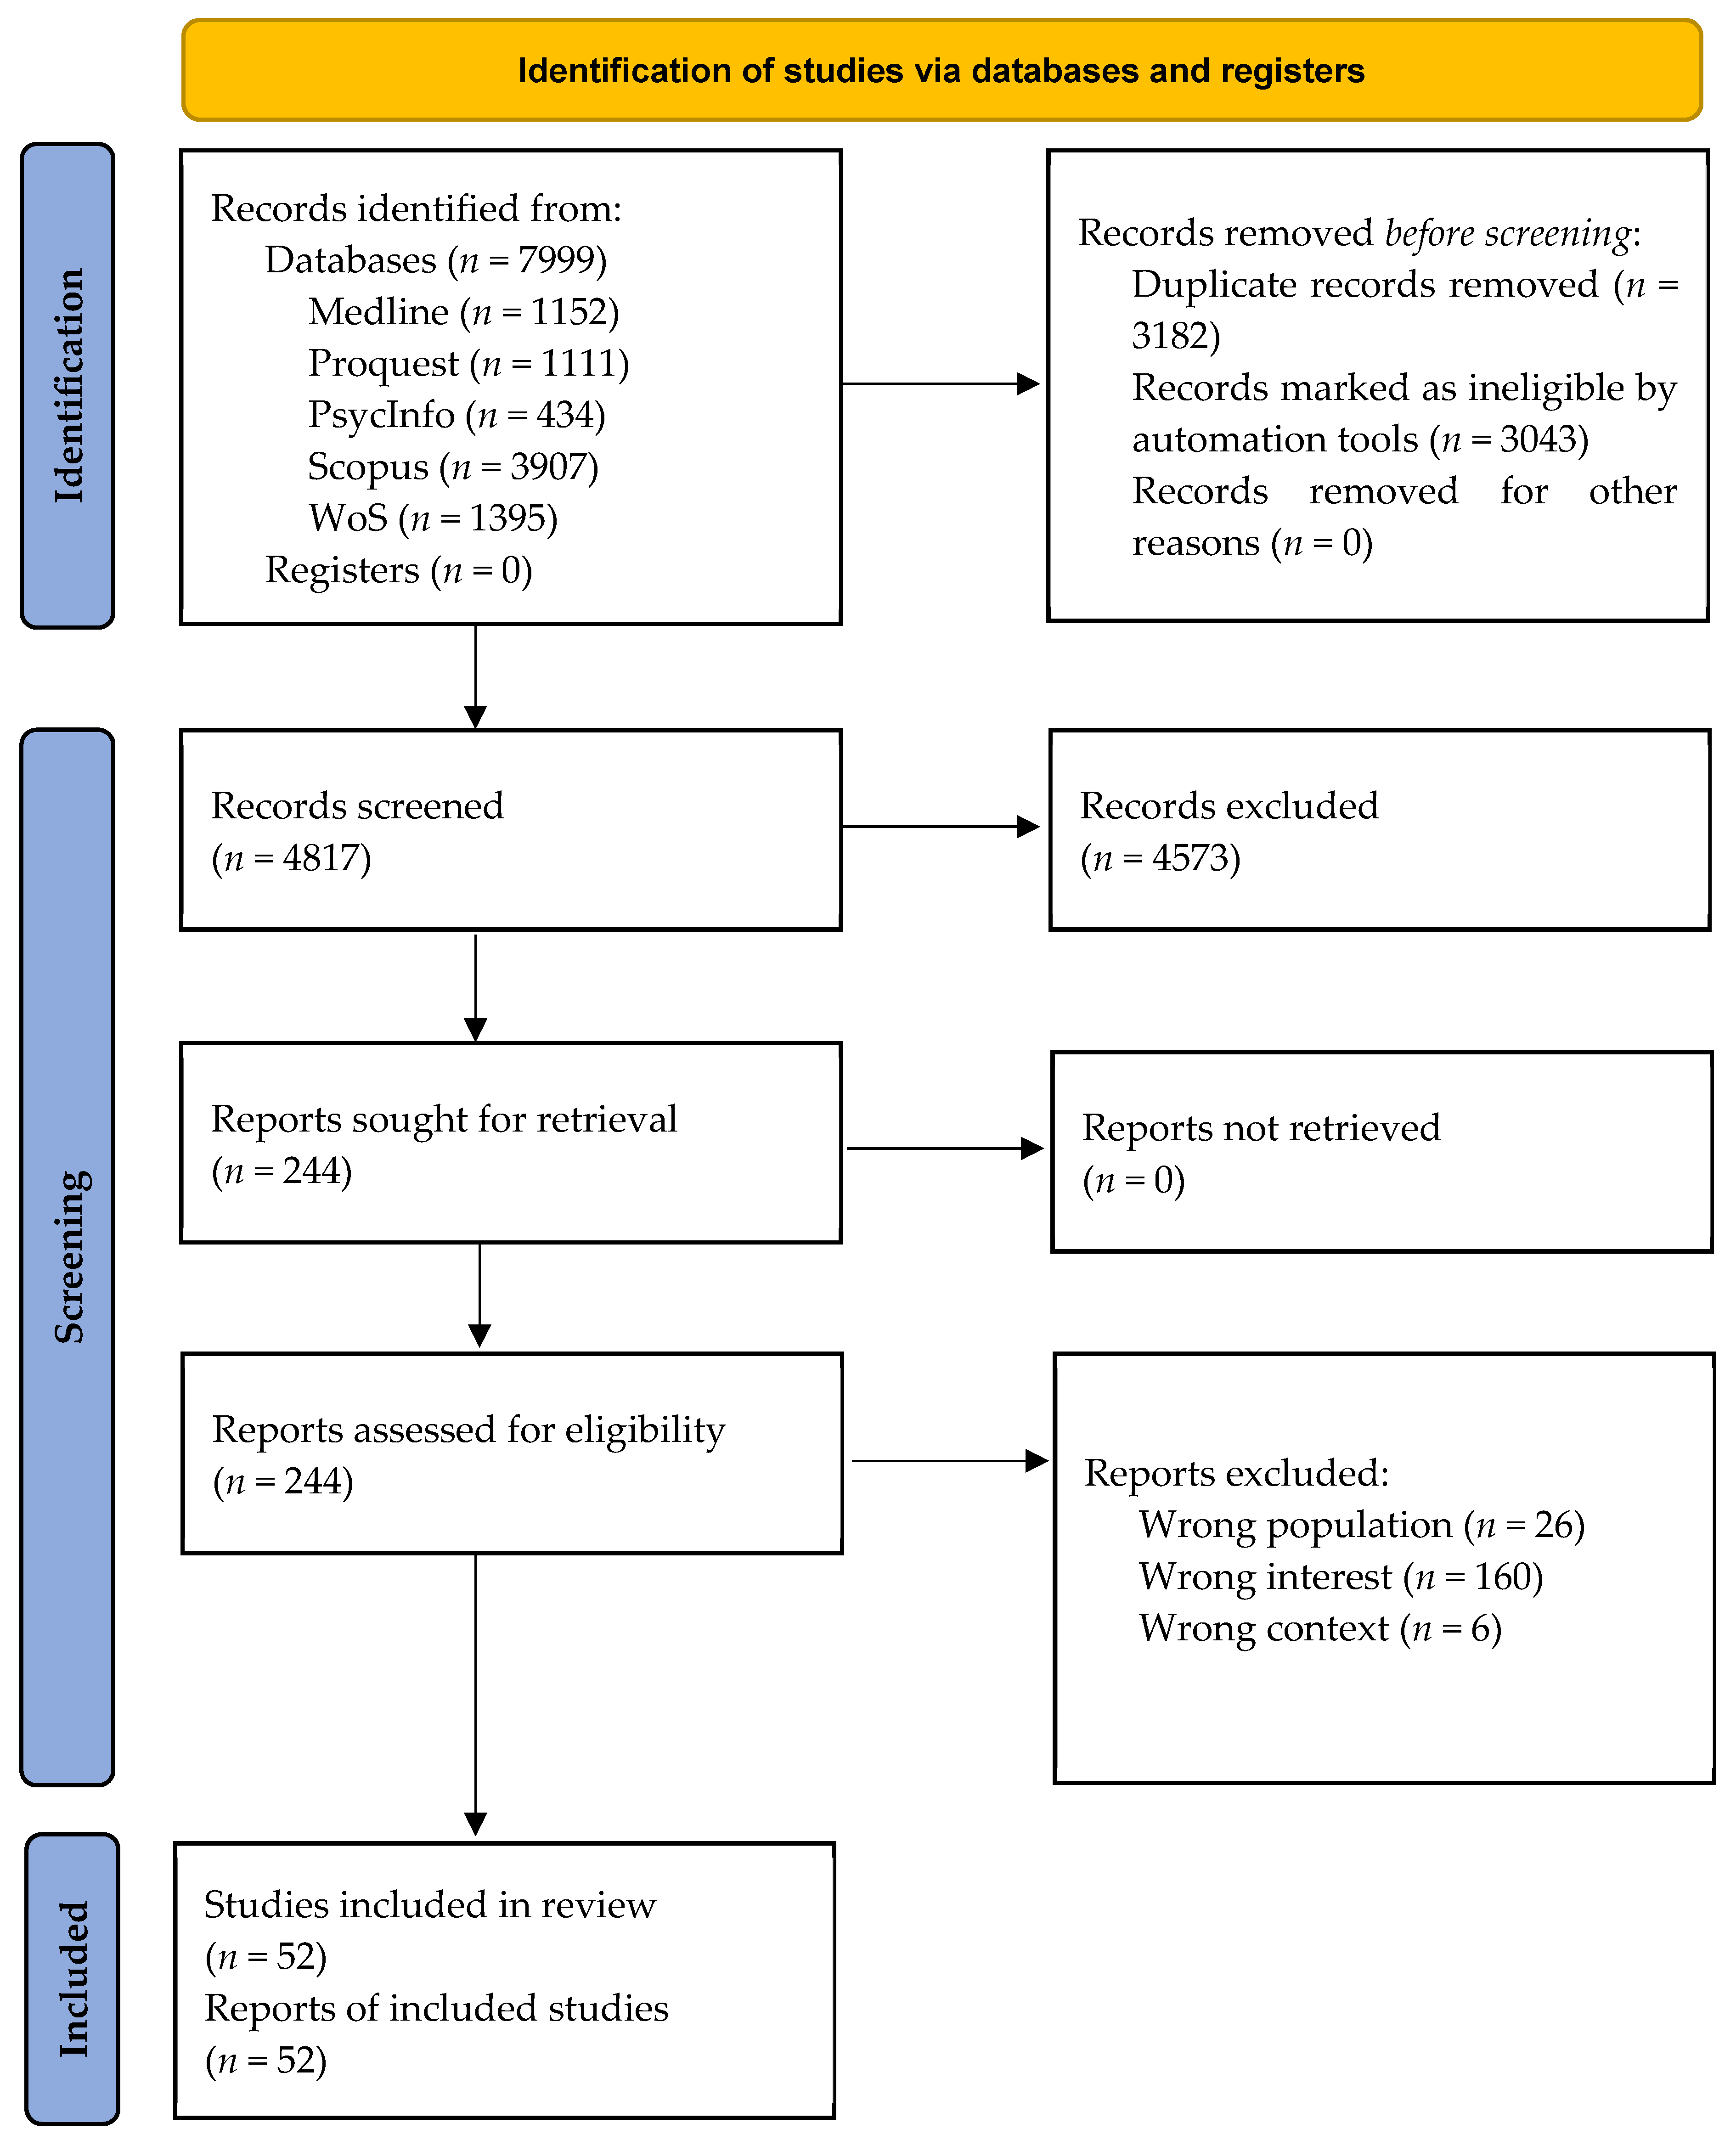
2. Materials and Methods

This systematic review was registered on the International Platform of Registered Systematic Review and Meta-analysis Protocols (INPLASY; Register Number INPLASY202420011), and the review protocol was published [17]. No changes were made to the information provided at registration or in the protocol. The systematic review applied the recommendations of the Preferred Reporting Items for Systematic Reviews and Meta-Analysis 2020 (PRISMA) [18,19] (see Table S1 of the Supplementary Materials) and the JBI Manual for Evidence Synthesis [20] provided by the Joanna Briggs Institute (JBI) for a mixed-method review using a convergent integrated approach. Using these frameworks, a systematic review was conducted following a step-by-step approach covering (a) the search of databases, (b) title–abstract–keyword and full-text screening, (c) quality assessment, (d) data extraction, and (e) data synthesis [4]. The predefined study selection process, which determines the inclusion or exclusion of a study, was divided into three cycles: title–abstract–keyword screening (1st cycle), full-text screening (2nd cycle), and quality assessment (3rd cycle). If a study passed all three cycles successfully, it was considered for inclusion, forming the body of the data corpus (see Figure 1).

2.1. Preliminary Search and Search Strategy

Five electronic databases (Scopus, Web of Science, MEDLINE, APA PsycInfo, and ProQuest) were searched. A table of synonyms was used to derive the search syntax following the population, interest, context (PICo) mnemonic. The comprehensive data are presented in Table S2 of the Supplementary Materials. The search syntax was limited to sustainable travel modes, indicators of interventions, participants exposed to them, and nonrural settings. Because each database has its own requirements and restrictions for search strings, individual Boolean search strings for each database were developed and can be found in the Supplementary Materials. To ensure the overall quality of the search strings, the lead reviewer/author (P.E.) consulted a librarian. We searched for English-language articles published in peer-reviewed journals from 1990 to 2022 using database limiters. As the parties to the Kyoto Protocol agreed to use 1990 as the reference year, the systematic literature review was interested in identifying any studies that may have contributed to the reduction in CO2 that occurred because of successful transport interventions up to the date of the review. The last search of each electronic database was conducted on 18 November 2022. Studies were included if they (a) report on a modal shift from car users or cars to less CO2-emitting methods of transport, (b) cover the adoption of low-carbon transport modes, (c) comprise interventions to encourage sustainable transport, (d) determine or measure interventions’ effectiveness, or (e) posit behavioural models of mode choice and/or psychosocial barriers for drivers to car/no-car use. All results were stored in RIS and/or ENW files and directly transferred to an Endnote library and the review software Covidence (https://www.covidence.org/, accessed on 3 March 2025).

2.2. First Cycle—Title–Abstract–Keyword Screening

By applying the search strategy to the first cycle, 7999 hits were generated and 4817 studies remained after duplicates were removed. Covidence automatically removed 3043 duplicates and the lead reviewer manually flagged 139 studies as duplicates. Non-peer reviewed studies such as books or chapters were excluded. The inclusion of books or chapters that do not contain scientifically approved results, which are often presented in various ways, can lead to distorted findings in systematic reviews. Considering the title–abstract–keywords, 4573 studies were marked as irrelevant and excluded. At the end of this stage, 244 studies passed the first sifting cycle and were processed for the second cycle. A detailed overview can be found in Figure 1. A sample of 10% of all decisions made by the lead reviewer was critically reviewed, and the results were confirmed by a second reviewer/author (S.P.). No additional changes were necessary.

2.3. Second Cycle—Full-Text Screening

The remaining 244 studies were thoroughly read before the studies were matched against the predefined inclusion criteria. In the second cycle, a total of 192 studies were excluded. Most studies were excluded because few included interventions to reduce car use, dependency, or ownership. Hence, 52 studies progressed to the third cycle after undergoing a critical review process by the second reviewer and being selected for quality assessment (see Figure 2). A sample of 10% of all available full-text studies was reviewed by the second reviewer, who fully agreed with the lead reviewer’s decision to include or exclude studies. No changes were necessary within the second cycle. During the study selection process, inter-rater reliability was calculated using Cohen’s Kappa. After title–abstract–keyword and full-text screenings, the Kappa coefficient was 1.0, indicating nearly perfect agreement between reviewers. Inclusion and exclusion criteria were clear and applied accurately, with no discrepancies noted.

2.4. Third Cycle—Quality Assessment

In total, 52 papers that passed the second sifting cycle were eligible for quality assessment using the Quality Assessment Tool for Studies with Diverse Designs (QATSDD) [23]. The strength of the QATSDD is that it assesses the study design regardless of the methodological origin. The QATSDD (see Table 1) consists of 16 criteria, 14 of which apply to both qualitative and quantitative studies. Each criterion was rated on a four-point scale ranging from 0 (not mentioned, poor quality) to 3 (completely detailed, high quality). In summary, qualitative and quantitative papers achieved a total quality score of up to 42 based on 14 applicable criteria. In comparison, mixed-method studies achieved a total quality score of up to 48 based on all 16 criteria initially included in the QATSDD. In total, 16 papers (15 quantitative/qualitative papers and 1 mixed-method paper) were identified as falling below the moderate quality thresholds of 15 qualitative and quantitative papers and 17 mixed-method studies. Detailed information on the thresholds for low-, moderate-, and high-quality studies and the criteria used can be found in the notes below Table 2 and Table 3. The majority of the reviewed papers did not explicitly mention the research questions. In addition, some papers failed to provide information on scientific quality criteria, particularly reliability and validity. Only a small number of studies considered precise validity and reliability measures, such as the use and interpretation of Cronbach’s alpha. This systematic review was threatened by bias because of the low reliability and validity of the quality-appraised papers. All 15 low-quality papers were excluded from the systematic review to avoid bias, such as sample bias. The remaining 36 moderate- and high-quality papers were considered for further data extraction. Disagreements between the lead and the second reviewer (P.E., S.P.) were resolved by applying the agreed-upon decision rules: In cases of a one-point difference between the total quality scores, the lower scores were considered without discussion. However, a discussion was required for each total score that exceeded the one-point mark.

2.5. Study Characteristics

Overall, 36 studies were included in the final review. Most of the studies were cross-sectional quantitative studies that employed a non-experimental design or a non-quasi-experimental design, except for 6 studies. Sample sizes ranged from N = 6 to N = 44,956. Participants’ ages varied from 5 to 84+ years, with the proportion of female participants ranging from 12% to 71%. The interventions identified in this systematic review included various measures, such as road pricing schemes, congestion charge schemes, sustainable transport initiatives, reward schemes, information campaigns, and car use restriction schemes, assessed through experimental procedures, self-reports, or observational methods. Reported pre- and post-implementation changes generally indicated significant shifts in individuals’ internal dispositions, particularly social norms, acceptance, attitudes, awareness, motivation, intention, and behaviour. A detailed overview of the study characteristics is presented in Table 4, Table 5, Table 6, Table 7 and Table 8.

2.6. Data Extraction

The lead reviewer, P.E., independently extracted quantitative and qualitative data from 36 included studies using Form S1 of the Supplementary Materials which was derived from the JBI Mixed-Method Data Extraction Form [20]. The focus was on the commuting population and the three main aspects of interest: types of transportation interventions proposed, factors that enable or hinder mode choice decisions, and the methods used to measure the success or failure of an intervention. In addition, this information was relevant to densely populated areas. Therefore, quantitative data from quantitative studies and quantitative components of mixed-method studies comprised numerical values and descriptive and/or inferential statistical outcomes. In the absence of a standard scientific understanding of what constitutes data in qualitative contexts, we constructed “key concepts”. This meant extracting excerpts from the results sections of the included qualitative and mixed-method studies and collating them according to conceptual meaning [76]. The data obtained comprised (a) study characteristics (authors of the publication, publishing date, journal, study design employed: qualitative, quantitative, or mixed methods), (b) review-related data (name of the lead and second reviewer, date of the review, record number), (c) methods (sample size, participants’ characteristics, phenomena of interest, setting, data collection of included studies, applied methods or theories such as the theory of planned behaviour, multiple regression analysis, scales or frameworks for operationalising), (d) conclusion outlining how the study’s results contribute to the review question, (e) comments on the intervention (particularly the name and purpose of the intervention, the type of intervention applicable, and the setting of the intervention), (f) the reviewers’ comment section (listing issues that need to be resolved before synthesis). To address the issue of missing information, a request-for-information process was planned, whereby the first author (P.E.) would reach out to an article’s author to obtain the relevant details. Any inadequately addressed or left unanswered requests within four weeks were not considered during the transformation and synthesis stage. In summary, initiating a request-for-information process was deemed unnecessary. Based on the total number of papers included, the data extraction was supported by the second reviewer (S.P.), who had a sample of 10%. Discrepancies were resolved, and a consensus was reached through written and further verbal discussions. Consequently, involving the decision of a third reviewer was unnecessary.

2.7. Data Transformation and Data Synthesis

2.7.1. Step 1: Familiarising with Data

The lead reviewer initially familiarised himself with the data obtained by reading and re-reading before the quantitative data were transferred to Table S3 of the Supplementary Materials inspired by Stern et al. [21].

2.7.2. Step 2: Transforming Quantitative Data into Qualitative Form Using the Qualitising Table

After completing 36 data extraction forms, data were transformed from quantitative to qualitative form (“qualitising”) In the qualitising table, quantitative data were converted into detailed textual descriptions so that the data could answer the review question (“contextualising”) before an open code format was applied, which could be used within the synthesis process. For example, in an intervention study [47], participants were provided with information on their greenhouse gas emissions as part of an experiment in the first phase. During this phase, the predictor travelling time was specified as −1.19 in a multinomial logistic regression. Numerical data were transformed into text to answer the review questions. This transformation results in a textual description, such as “longer transit times suggest a lower likelihood of intending to commute by car”.

2.7.3. Step 3: Free Line-by-Line Coding

Open codes were produced for the three subheadings: interventions, enablers and disablers, and success factors. A total of 50 qualitised codes were constructed from 30 quantitative studies and 2 quantitative components of the mixed-method studies. P.E. and S.P. discussed the data retrieved until they reached a consensus on the textual descriptions. A detailed summary of the data extraction, data transformation, and thematic synthesis processes is available in the Figure S1 presented in the Supplementary Materials.

2.7.4. Step 4: Developing Themes by Collapsing Qualitative and Qualitised Categories

The data were synthesised using JBI’s convergent integrated approach [21,77], which merges qualitative and qualitised codes to aggregate them into four categories to understand the mixed-method review: multiple, mixed, qualitised, and qualitative categories. Multiple categories comprised more than two codes. The codes to be aggregated contain both qualitative and qualitised data. To combine the codes into a mixed category, both qualitised and qualitative codes must be aggregated. Qualitised categories are those obtained exclusively through the synthesis of qualitised codes. Conversely, qualitative categories were obtained solely by synthesising qualitative codes. This study synthesised 27 categories that were equal in similarity and meaning. The combined categories resulted in 11 integrated findings. The term “integrated finding” is used interchangeably with “theme” in this work.

2.8. Vote-Counting and Sensitivity Analysis

To ensure robustness, the selection criteria were adapted from PICo (population, interest, context) to PICO (population, intervention, comparator, and outcome) to minimise methodological heterogeneity. During the robustness check, the focus was on including only studies with an experimental design. These experimental studies examined how information or road pricing interventions affected car usage among motorised road users in urban areas. Out of the 36 studies considered, only 7 met the specified criteria. We evaluated whether a meta-analysis could be conducted following the grouping. Essential requirements for a meta-analysis include that the transport interventions yield comparable outcomes to ensure study comparability. Furthermore, the experimental studies should exhibit consistent statistics, such as standardised effect sizes, log odds ratios (OR), risk ratios, Cohen’s d, or standardised mean differences (SMDs). The review indicated significant variations in results post-grouping. For instance, changes were observed in kilometres driven, trip frequency, shifts in preferred transport modes (light rail), alterations in sustainable index values within the Transportation Sustainability Index (TSI), and compensatory behaviours (such as driving outside peak hours, altering routes, teleworking, or utilising public transport). Additionally, the review highlighted a lack of informative content in the experimental studies. For instance, Henry and Gordon [32] do not present a standardised effect size when examining differences in driving behaviour between alert and non-alert days. Although they noted a significantly reduced mileage on alert days (29.9 miles versus 35.4 miles on non-alert days, p < 0. 05), they failed to compute metrics such as the standardized mean difference (SMD) or odds ratio (OR), which would be useful for comparing results across studies. Furthermore, their regression table is missing direct measurements of effect size, and they do not report the variance (standard deviation or standard error) for miles driven or trips taken. Conversely, Gehlert et al. [30] do not provide any standardised effect measures, such as odds ratios or Cohen’s d. Furthermore, neither the standard error nor the confidence interval for these changes is mentioned in the text or table; instead, the data are presented only as point estimates of reduction. Although car use reduction is suggested (likely supported by statistical testing), the variance or precise significance of each metric is not detailed. The findings presented by Khademi et al. [38] suggest that, over an extended period, the influence of rewards on driving behaviours markedly diminishes. Despite indicating an initial decline of 7% in peak trips associated with the reward, they fail to report this metric as an effect size with an accompanying measure of variance. As a result, the model outputs, which consist of coefficients and standard errors, do not support the consolidation of a singular effect size for car usage appropriate for meta-analysis. Additionally, the lack of a log odds ratio regarding the reduction in trips highlights a consideration of various behavioural alternatives instead of a singular binary outcome.
The analysis by Minal et al. [51] highlights significant changes in the TSI composite index associated with the odd–even scheme, showing a +6.1% increase from 0.841 to 0.896. Notably, their study lacks standard effect size measures such as confidence intervals or standard errors for the TSI, complicating traditional variance calculation due to the index’s aggregation through PCA methods. Furthermore, they do not provide an odds ratio or risk ratio linked to the reduced car trips on odd and even days, which limits the conventional derivation of effect size or variance from their findings. Piras et al. [56] suggest personalised travel plans enhance mode switching but lack specific odds ratios or risk differences. They qualitatively note personalised plans’ positive effect on switching to light rail. While detailed results should include a coefficient for the intervention effect in the discrete choice model, the needed data, like exponentiated OR and standard error, are not presented. This limitation calls for cautious interpretation, as the observed effect may be influenced by other factors. Consequently, they do not provide a summary effect size with a confidence interval, which could have been derived from the available model coefficients. Only one study—Luo et al. [47]—provided logit coefficients, standard errors, and p-values.
In conclusion, the present review deemed a meta-analysis to be impractical [47]. Consequently, the study opted to follow the synthesis without meta-analysis (SWiM) guidelines [78]. According to these guidelines, a summary of effect sizes, aggregation of p-values, and vote-counting based on the effect direction should be utilised instead of a meta-analysis. Given the prior explanations, neither effect sizes nor p-values can be condensed into a summary. Thus, vote-counting based on the effect direction and a leave-one-out sensitivity analysis evaluated the study’s robustness. Vote-counting can only indicate whether there is any evidence of an effect, not the average effect, which limits the conclusions that can be made. All experimental studies adhering to the PICO mnemonic were included in the synthesis. For the vote-counting analysis, studies were categorised based on study design due to the heterogeneity in the studies and their methodologies. The results of the vote-counting analysis are presented with tables that report key study characteristics, such as the study design, sample size, outcomes, and methods (see Table 9 and Table 10). They are discussed narratively in Section 3.

3. Results

A summary of 32 years of research on the choice of transport mode based on 11 studies [25,31,32,46,47,49,59,60,63,65,69] reveals that regression analysis is the most common method for modelling user behaviour. A further distinction in the choice of regression analysis is made between multiple regression and discrete choice modelling [25,31,47,49,55,59,63,65]. The most commonly used theories for explaining the mode choice using multiple regression are the theory of planned behaviour [41,46,52,60,63], norm activation model [41], material possession theory [46], technology acceptance model [37], cognitive dissonance theory [30], and practice theory [74]. Studies that did not use these theories modelled the behavioural mode choice process using discrete choice modelling [25,31,49,65]. Depending on the number of transport modes (categorically scaled dependent variable), an individual could choose the type of discrete choice modelling, distinguishing between a binary logit model for two transport modes, a multinomial logit model for more than two (or several) transport modes, or a nested logit model for several similar transport modes.

3.1. Results of Relevant Related Systematic Reviews

The mixed-method systematic literature review reported on a systematic review whose scope differed from that of the current study, presenting these findings narratively, as recommended by the JBI guidelines, using an integrated approach [21]. The current review’s objective is to identify interventions that have been developed or implemented to overcome barriers, with evident results. While reporting on previous review insights, discussing strategies to deliver information and influence behavioural change enriches the current review’s understanding of the broader scope of interventions and of how information campaigns could impact individuals’ transport choices. A further objective of the current review is to identify the success factors for interventions that facilitate a shift from cars to less carbon-emitting modes of transport. The previous review [73] provided 17 recommendations for effective information campaigns that directly contribute to the current review’s understanding of what makes transport-related information campaigns successful. Riley et al. [73] examined the literature on air pollution information campaigns with the potential to change behaviour that leads to air pollution. Across 37 studies, the systematic review focused on how the provision or delivery of information through specific channels or from particular sources and the communication of information on air pollution can change behaviour. In total, it made 17 recommendations, of which 11 focused on the communication of messages, 2 on the channels of information, 2 on the sources, and 2 on the recipients of such information. This systematic review contributes to the current study by revealing that information campaigns can be considered intervention measures to change driving behaviour. They can be particularly successful if they fulfil specific requirements: (a) the information must come from a trustworthy source for the message recipient; (b) the information should be tailored to the recipient, that is, personalised and spatially localised; (c) the message must be delivered in a way that the recipient can understand; (d) the message should be formulated as positively as possible, and the benefits of the behavioural change, especially on the individual’s health, should be emphasised. Finally, the review noted that sociodemographic characteristics can negatively or positively influence behavioural change. These included sex, age, income, education level, and state of health.
Overall, the current review identified 11 themes: 9 that explain an individual’s mode choice behaviour and 2 related to critical success factors of interventions.

3.2. Enablers of and Barriers to Individual Mode Choice Decision

3.2.1. Theme 1 [Barrier]: Perceived Threats and Lack of Privacy and Convenience Prevent Individuals from Opting for Sustainable Transport Modes

Theme 1 is supported by four studies [29,37,39,58]. Four studies supported the idea that individuals reject commuting by sustainable modes of transport because of potential threats and lack of or interference with privacy [29,37,39,58]. Thus, threats and a lack of privacy could be barriers to change. Two studies reported threats [71,74] that exist when using sustainable transport, such as being insulted by another commuter; endangering one’s physical well-being due to the unpredictable driving behaviour of others, especially car drivers; and the non-existence or replacement of infrastructure in favour of another, for instance, replacing a car lane to create space for a bike lane. One female rider reported being verbally assaulted by a driver saying, “Get off the road, you fat b****”, whereas another was physically assaulted [74]. In another study, a cyclist expressed his safety concerns about the driving behaviour of motorists as follows:
As a cyclist, I find Singapore drivers are inconsiderate. [...]. At the beginning, I don’t feel safe riding on public roads [...]. I would advise a new cyclist not to go on the public road [71].
Another quote highlights the inherent threat posed by car commuters’ misbehaviour: “[...] cyclists must check every time for cars coming or turning” [71].
In addition, two studies reported that motorists felt threatened by sharing (dealing with cyclists while riding) or replacing infrastructure, for example, by expanding cycle paths at the expense of parking facilities [74]. One cyclist described the increased risk for cyclists by referring to narrow pavements and dangerous roads [71]. Three studies reported the absence or disturbance of privacy [67,70,71]. Privacy is the condition in which passengers, other road users, or travellers cannot come too close to the traveller or behave unpleasantly towards other passengers. Three studies outlined the challenge of travellers unwilling to share transport with strangers [67,70,71], while one study included the inappropriate behaviour of third parties as a further challenge [67].

3.2.2. Theme 2 [Enabler]: The Personal Belief That One Must Do Something Good for (Future) Generations or the Environment Encourages Individuals to Choose Sustainable Modes of Transport

Theme 2 is supported by four studies [34,49,68,72]. Four studies reported that travellers are particularly likely to use sustainable modes when they can consistently attribute a positive value to their transport behaviour for a higher purpose, giving them a sense of accomplishing something good or making a significant contribution to either the environment or health [34,49,68,72]. Therefore, travellers’ positive attributions are likely to enable transport-related behavioural changes. In one study, one traveller reported that he was committed to protecting the environment and that he travelled by active transport and bus for this reason [72]. Another traveller in the same study stated that he would support anything that took cars off the road, which would ultimately help the environment [72]. These studies mainly focused on health and environmental awareness [49,72]. Travellers’ health and environmental concerns include worries about the pathological changes in individual health caused by air pollution and climate change [68,72].

3.2.3. Theme 3 [Barrier and Enabler]: Perceived Enjoyment While Commuting Enables Individuals to Be Sustainable and Active Commuters or Car-Dependent Commuters

Theme 3 is supported by five studies [37,56,67,71,74]. Five studies stated that travellers are most likely to choose the mode of transport that gives them the most pleasure when using it [37,56,67,71,74]. Travellers in four studies felt that they particularly enjoyed using a mode that corresponded to their interests [37,67,71,74]. Based on several studies, this is mainly the case with cars and could be considered a barrier to opting for sustainable transport. Travellers perceived driving as an enjoyable form of entertainment [56].

3.2.4. Theme 4 [Barrier]: Personal Belief That the Time Saved by Using a Car Allows the Individual to Pass the Day More Quickly and That Time Is Wasted When They Engage in Sustainable Modes of Transport

Theme 4 is supported by three studies [67,69,71]. Three studies reported that travellers actively incorporate the construct of time into their conscious choice of transport mode. A transport mode is preferred only if (a) the first-and-last-mile problem can be covered, (b) waiting times for the means of transport can be estimated to be low not only daily but also in the long term [69], (c) the travel time is not endangered by influences such as disruptions in the timetable and it can be estimated to be relatively short [71], and (d) possible pick-up times are short [69]. Regarding travel time, one passenger in a study commented that he had had “bad experiences […]” with sustainable transport and had therefore “wasted more than an hour of time […]” [71]. In contrast, another passenger in the same study wished for something “cheaper, faster, and less stressful” for sustainable local transport. Therefore, it is not surprising that travellers feel dependent on cars in their daily lives [67]. Without a car that (unlike sustainable transport) offers time predictability, travellers cannot organise their daily lives and accomplish what they want or need to do [67]. One study reported the pick-up and waiting time thresholds that a traveller is willing to accept [69]. Exceeding these thresholds leads to a decision not to use transport. Another study reported on coping strategies as a possible consequence of exceeding the personal perception of time, such as using means of transport outside rush hour and information technology for route optimisation [71].

3.2.5. Theme 5 [Barrier]: The Influence of Close Acquaintances Such as Friends, Family, or Even Locals and Celebrities Increases Commuters’ Motivation in Their Mode Choice Decision

Theme 5 is supported by five studies [34,49,60,71,72]. Five studies supported the idea that sustainable means of transport are used more frequently if this type of transport behaviour is endorsed by important persons in the immediate social environment, such as family, friends, or prominent personalities [49,72]. Furthermore, fellow residents fulfil the role model function akin to that of parents, educators, and law enforcement officials. Travellers observe the transportation behaviours of these residents, which can profoundly shape their practices and decision-making [71]. Social pressure is thereby exerted, which can result in the traveller using sustainable transport modes [34,49]. One study recommended that social pressure be maintained permanently, as this is the only way to ensure a significant proportion of travellers change their implementation of mobility, which could address travel behaviour [60]. Another study reported that participants’ personal views on mobility and transport interventions, such as road pricing, were identical to those the study participants named as their reference (family members) [72]. Cognitive dissonance is another factor that must be considered. Travellers are less willing to be pressured by strangers [72] or the state [60,71]. These are perceived as the standards of others, representing the general public’s views and referring to people to whom the traveller does not necessarily relate [72].

3.2.6. Theme 6 [Barrier]: Physical Impairments and Poor Health Mobility Needs of Individuals Are Obstacles to Sustainable Transport Choices

Theme 6 is supported by four studies [33,46,59,75]. Four studies indicated that travellers’ impairments significantly impact transport use [33,46,59,75]. Impairments included long-term but temporary medical conditions and musculoskeletal impairments. Travellers with such impairments often believe that they are unable or no longer able to travel by active or sustainable modes of transport, significantly limiting not only their mobility but also that of their caregivers. In one study, a traveller reported that after caring for a disabled person, it is “probably too tiring to bike to work” [75]. Two studies found that transport use declines with age [46,59]. Interest in active and sustainable modes of transport also declines with age [59]. This may be attributed to the increased physical limitations with age, such as slower reflexes, impaired vision, and reduced driving ability [46]. A recent study revealed that travellers without any impairments influencing their walking ability are more likely to choose sustainable modes of transport [33].

3.2.7. Theme 7 [Barrier]: Commuters Are Hindered by a Lack of Appropriate Infrastructure and Material Deficiencies When Considering Active or Public Transport

Theme 7 is supported by four studies [31,43,71,74]. Four studies pointed out that sustainable modes are not used because of a lack of or significant deficiencies in the existing infrastructure [31,43,71,74]. Three studies cited a lack of infrastructure as the lack of secure bicycle parking [74]; bicycle rentals [71]; showers or changing facilities [74]; infrastructure for the development of sustainable transport [71], especially high-quality bus services [31]; and information about rail and train connections [71]. The infrastructure deficiencies in two studies included poor road surfaces with potholes [74], too few cycling paths and shelters [71], insufficient bicycle parking facilities [74], poorly developed cycling paths with obstacles [71], and deficiencies in public transport in terms of parent- and child-friendly facilities [71].

3.2.8. Theme 8 [Barrier]: Affluence and Multiple Car Ownership Facilitate Car Use

Theme 8 is supported by nine studies [24,31,32,33,34,43,56,65,75]. Nine studies revealed high household income, and the associated ownership of one or more cars facilitate car use [24,31,32,33,34,43,56,65,75] even at the expense of more sustainable modes [75]. One study concluded that car ownership was sufficient to favour car use over more sustainable modes [33,43], whereas another concluded that this effect increased with each additional car in the household [56]. Another study suggested that if the living conditions of households remain the same, regardless of transport ownership, and only income increases, then income alone significantly increases the intention to travel by car [65]. One study revealed that a higher income also leads to higher transport demand (in terms of km travelled) [32]. Conversely, a lower income means that people need the option to travel by car [31] or to use sustainable modes of transport [43,59].

3.2.9. Theme 9 [Enabler]: The Personal Belief That Sustainable Transport Is the Most Cost-Effective Travel Option Encourages Abandoning Motorised Transport Modes

Theme 9 is supported by five studies [25,31,34,59,71]. Five studies supported the hypothesis that people choose sustainable modes when they are more economically advantageous than other modes [25,31,34,59,71]. Two studies suggested that lower costs for sustainable modes lead to higher traveller satisfaction [34] and a higher use of sustainable modes [25]. Four studies argued that higher costs for car trips would lead to a rejection of car use [25,31,59,71].

3.3. Success Factors of Intervention

3.3.1. Theme 10: The Most Effective Interventions Are Those That Require the Cheapest Implementation and Operational Costs

Theme 10 is supported by three studies [55,66,70]. Three studies consider interventions—particularly efficient from the regulator’s perspective—if the costs of introducing and operating an intervention measure follow the cost minimisation principle and can be recovered [55,66,70]. According to one study, the total system cost of an intervention is calculated as follows. The total system cost, discounted to the reference year at the discount rate, is the sum of the annual investment costs, fixed and variable O&M costs, import costs, and export revenues for each region and year. Taxes and subsidies are added to the total system cost function [66]. Another study examined the challenges of cost recovery with and without government subsidies [70]. It is assumed that interventions should be designed for market cost recovery [70].

3.3.2. Theme 11: Reducing Cars Boosts Sustainable Transport and Mitigates Environmental Impact

Theme 11 is supported by four studies [47,51,63,70]. Four studies referred to the environmental success factors of interventions, such as a reduction in the number of cars on the road and the associated reduction in traffic-related CO2 emissions [47,51,63,70]. One study reported that the success of the intervention was based on a decrease in the number of private cars on the road [51], whereas two other studies cited a reduction in road traffic as a success [51,70]. Another two studies reported that reducing CO2 emissions can be used as an indicator of success.

3.4. Vote-Counting and Sensitivity Analysis Results

Five out of seven studies indicate that interventions involving information and road pricing can negatively impact car usage. Utilising leave-one-out sensitivity analysis, the ratio is 0.71. In a leave-one-out sensitivity analysis, excluding each favourable study individually results in rates of 0.66 (4 out of 6), 0.60 (3 out of 5), 0.50 (2 out of 4), and 0.33 (1 out of 3), thus suggesting that the impact of these interventions on car use is consistently robust. When examining whether information and urban road pricing interventions have changed users’ internal dispositions, and therefore changed the outcome, the same pattern occurred: five out of seven studies show evidence that these interventions affect the internal dispositions of urban motorised road users, equating to a majority rate of 0.71. In a leave-one-out sensitivity analysis, excluding each favourable study individually results in rates of 0.66 (4 out of 6), 0.60 (3 out of 5), 0.50 (2 out of 4), and 0.33 (1 out of 3). This highlights the findings’ significant stability, implying that the impact of interventions on internal dispositions can be reliably measured. Even though these findings strengthen the overall conclusion of this study, these results should be carefully considered because it can be inferred that while transport interventions might lower car usage, alterations in road users’ internal dispositions are not necessarily required for this reduction to occur in each case. In other words, a shift in internal disposition does not need to happen before a motorised road user decreases their car use. Alternatively, it can be proposed that a change in internal disposition is not definitively linked to reducing car usage behaviour.

4. Discussion

By reviewing 36 studies, this mixed-method systematic review sheds light on the interventions that have been designed to encourage car users to frequently use sustainable modes of transport. Of the 11 themes, 3 enablers were identified that are capable of shifting individuals’ mode choice behaviour towards more sustainable modes if they were to be the outcome of an intervention, namely (a) the personal belief of doing something good for (future) generations or the environment, which encourages individuals to choose sustainable modes of transport; (b) perceived enjoyment while commuting, which enables individuals either to be sustainable and active commuters or car-dependent commuters; (c) the personal belief that sustainable transport is the most cost-effective travel option. In addition, the review found six beliefs that change, initiated by interventions that are desirable and related to individuals: (d) family beliefs—perceived threats and lack of privacy and convenience, which prevent individuals from opting for sustainable transport modes; (e) a personal belief that the time saved by using a car allows the individual to pass the day more quickly and that time is wasted when individuals engage in sustainable modes of transport; (f) normative beliefs—the influence of close relatives such as friends and family or even locals and celebrities on commuters’ motivation in their mode choice decision; (g) control beliefs—physical impairments and poor state of health affecting the mobility needs of individuals; (h) sustainable commuters being hampered by a lack of appropriate infrastructure and material deficiencies; (i) affluent households and multiple car ownership facilitating car use. The two themes that report on the success of interventions relate to local authorities.
The results of this systematic literature review indicate that travellers have negative attitudes towards the use of sustainable transport because they consider its negative consequences. For example, their privacy may be violated when sustainable transportation is used. Consequently, travellers associate sustainable transport with negative outcomes and do not develop a strong intention to choose sustainable transport over car use. Measures have been discussed in the literature to positively change travellers’ attitudes, which, according to the review, should contribute to overcoming these barriers. One measure that can reduce privacy barriers involves more frequent bus and train services [31]. Providing more trains would create additional space, allowing passengers to be better distributed. In this way, travellers would not invade each other’s privacy; moreover, they can avoid disorderly behaviour by moving to another compartment. Another solution involves extending existing transport services [70]. Introducing an express bus line will ensure a better distribution of passengers, relieving heavily used means of transport of travellers switching from train to bus, or vice versa. Establishing urban emission-free zones may result in travellers feeling less threatened or exposed to physical or psychological attacks [55]. In these zones, travellers who prefer to travel via active transport would be given the safe space they need. Any harmful modes of motorised transport will be prohibited, ensuring that environmentally conscious travellers are not exposed to them. Eliminating these motorised options will likely create a more uniform group of travellers, particularly regarding mindset and pace, reduce potential tension among commuters, and enhance overall safety during travel. Information initiatives, like the 1998 Atlanta Information Campaign, aimed to lessen the perceived dangers for sustainable commuters. The campaign intended to heighten awareness of air pollution, specifically ground-level ozone, while decreasing urban motorised traffic. The Atlanta Information Campaign initiated efforts to transition motorised commuters into more environmentally responsible travellers by announcing ozone alert days across television, radio, newspapers, and electronic road signs. With this heightened awareness, commuters were urged to adopt practices such as opting for alternative transportation methods, telecommuting, carpooling, avoiding driving during peak hours, and minimising unnecessary trips on ozone alert days. Utilising an OLS regression model, the estimated average awareness increase was 0.518 (p < 0.001). External influences, such as front-page newspaper articles (β = +0.324, p < 0.01) and the summer months (e.g., August: β = +0.285, p < 0.001), further boosted awareness. Though the methodology does not permit a straightforward before-and-after comparison, it highlights a clear link between ozone alert days and heightened awareness, indicating the campaign’s effectiveness. Henry and Gordon [32] also explored whether the rise in awareness influenced commuter behaviour. On ozone alert days, government employees travelled an average of 26.4 km, compared to 38.5 km on non-alert days, showing a significant decrease of 12.1 km. Private employees experienced a lesser reduction of 3.5 km (from 34.4 km to 30.9 km), which was not statistically significant. Most notably, the increase in awareness did not significantly affect the distance travelled in the ANCOVA model (β = −0.098, n.s.), indicating that awareness alone was not enough to inspire sustainable changes in commuter behaviour. However, environmentally aware travellers will no longer have to contend with the unpredictable behaviour of motorists and will be able to utilise the existing infrastructure more effectively. The study also found that a high household income and ownership of one or more vehicles facilitated driving. Individuals who own one or more vehicles due to high household income are also inclined to use all available vehicles to remain independent of the people living with them or to reconcile personal, external, and/or family interests. Such households can finance the upkeep of vehicles and regularly buy new fuel. Sensible measures could include registration restrictions and driving bans. Minal et al. [51] reported on the odd–even scheme, which restricts or allows the use of roads for cars on even or odd calendar days, depending on the last number of the vehicle’s licence plate. Their findings indicate modifications in the TSI composite index before and during the odd–even scheme. They report percentage increases in the index (e.g., the composite TSI rose from 0.841 to 0.896, reflecting a +6.1% change). Thus, the primary reason for the increase in TSIs on both even and odd days was the decrease in the overall number of private vehicles on the roads, showcasing the effectiveness of the intervention. Interventions that allow only one vehicle per household have been identified in the literature. Financial sanctions [29,30,40,45,52,66] ensure that financially well-off households lose purchasing power. Intervention measures such as increasing petrol or vehicle taxes can also be considered [66]. To minimise the purchasing power of private households, three transport measures can be implemented in larger cities, similar to Copenhagen, as examined in Denmark’s AKTA road pricing experiment: (a) modifying the domestic tax system to align with the Danish car tax system, (b) instituting urban road pricing, and (c) applying congestion charges. The details of these transport measures will be elaborated upon below, followed by a discussion of the resulting behavioural changes. The Danish tax framework mandates that car users pay a registration tax of up to 180%, depending on the car’s value and progressive taxation. Additionally, there is a 25% VAT on car purchases and an annual road tax of approximately EUR 400 based on the type of vehicle. Urban road pricing categorises a city into zones from the outskirts to the centre. The closer drivers are to the city centre, the higher the fees for crossing into the zone or per kilometre driven in the specified areas. For instance, charges during peak rush hours are considerably higher than those applied outside these times. At this point, it is essential to examine whether the transport interventions in Copenhagen effectively fostered a noticeable change in behaviour among motorised road users. Before the experiment, the following user attitudes were recorded regarding the current Danish car tax system, urban road pricing, and peak hour charging, showing positive responses of 20%, 72%, and 62%, respectively. Post-experiment findings by Gehlert et al. [30] revealed changes in the public acceptance of these measures. The most significant shift, at 48.6%, occurred with the Danish tax system, where most users remained negative, with 51.4% expressing unfavourable views. However, 23.8% of users’ attitudes shifted to negative, while 24.9% became more positive. The urban congestion charge observed the second-largest change, showing a 39% change rate. Acceptance of this measure remained positive at 61%, yet 13.1% of users reported a decline in support, while 26.1% experienced a more favourable view of the urban road user charge. Prior research has also found that travellers have recently become aware of the need to act to benefit themselves and those around them. What drives travellers to choose sustainable transport is their belief that they are taking a stand for themselves, others, and future generations. The results reveal that travellers generally evaluate the use of sustainable transport modes positively because they recognise that the consequences of their actions prevent damage to not only their health but also that of others and of future generations, such as the prevention of respiratory diseases. This evaluation process logically leads some travellers to choose sustainable transport modes. However, against their better judgement, there are also those who remain in their car or strive for a mix of cars and sustainable transport modes. The assumption that personal norms [41] must differ for each person is based solely on the various characteristics of travellers’ observable behaviour. The survey results reveal several reasons for people’s inflexibility. Travellers may be unable to use public transport, especially if they suffer from age-related physical limitations or long-term or temporary illnesses that make them believe that they cannot use public transport and must stay at home or in bed without outside help. According to the review, no appropriate intervention measures have yet been identified for this type of barrier. Travellers also cite rational reasons to justify their continued use of cars, such as the fact that they do not have a stop within walking distance and would not be able to go about their daily lives without a car. The implementation of mobility as a service could address the lack of infrastructure and material deficits or its development, such as the installation of charging stations [55,66]. Travellers’ poor health status and lack of infrastructure can be explained by the norm activation model described by Schwartz, specifically during the activation phase [79]. If these problems are not addressed, the activation may be cancelled, causing a lack of moral obligation and resulting in inaction. Another explanatory approach is Aijzen’s theory of planned behaviour [41,46,52,60,63,80]. This systematic review identified barriers to travellers’ attitudes towards sustainable transport, the social environment, related social pressures, and their ability to use sustainable transport modes. If these barriers are not addressed, travellers may not develop a strong intention to use sustainable transport, leading to inaction.

5. Limitations

While this systematic review effectively identifies the motivations behind individuals’ increased use of sustainable modes of transport and the psychological barriers to shifting traffic from private cars to sustainable alternatives, it fails to predict which of these beliefs would most significantly influence lasting behavioural change and, consequently, which should be prioritised in interventions. Although this was within the scope of the systematic literature review, we could not ascertain whether individuals exposed to interventions experienced significant changes before and after implementation due to the review’s lack of statistical or aggregated quantitative insights, such as a meta-analysis, on how interventions influence internal dispositions (e.g., intention, attitude, social pressure, capability, motivation) before and after their implementation. The absence of such analyses is primarily due to the limited number of quantitative studies evaluating the effectiveness of the interventions included in this review. Moreover, employing statistical methods and meta-analysis was not feasible because of several methodological and statistical constraints. One reason is the substantial heterogeneity in the analytical approaches and theoretical frameworks used across the included studies. The predominant methodology employed is regression analysis, with studies varying between multiple regression and discrete choice modelling. Additionally, the studies included in this review differ significantly in the theoretical frameworks applied to explain mode choice behaviour. While some studies utilise psychological models such as the theory of planned behaviour (TPB), the norm activation model (NAM), material possession theory, and cognitive dissonance theory, others employ discrete choice modelling without explicitly referencing these theories. These variations lead to differences in outcome measures, predictor variables, and data structures, which limit the ability to synthesise findings quantitatively in a meaningful way. Another major limitation is the variability in the measurement of dependent variables across studies. The classification of transport modes differs depending on whether researchers utilised binary logit models (for two transport modes), multinomial logit models (for multiple modes), or nested logit models (for structurally similar transport options). This variation in how transport choices are modelled and categorised introduces statistical incompatibilities, further preventing the aggregation of effect sizes in a standardised format. Given these inconsistencies in study design, statistical methodology, theoretical underpinnings, and outcome measurement, conducting a meta-analysis would not have provided a reliable or interpretable quantitative data synthesis. Furthermore, a subgroup meta-analysis would have been challenging due to the few studies employing comparable methodologies. Instead, as the Prisma 2020 guidelines [18,19] suggested, a narrative synthesis was deemed more appropriate for capturing the complexity of psychological factors influencing transport mode choice. Consequently, the success of the interventions in shifting behaviour towards sustainable transport remains uncertain. The only success factors identified were economic objectives, financing an intervention’s estimated implementation and operating costs, and environmental goals, which focused on reducing the number of authorised cars to promote sustainable transport and minimise the ecological impact. Although this review identifies key psychological factors influencing transport choices, it does not establish causality between them and behavioural change. The included studies were primarily cross-sectional or correlational, limiting conclusions about the long-term effectiveness of the interventions in promoting sustainable transport. Future work should adopt longitudinal or experimental rather than cross-sectional study designs to assess pre–post changes in psychological dispositions such as attitudes, social norms, and perceived behavioural control. At present, there are no longitudinal studies concerning mobility as a service (Maas) that employ randomised and controlled experimental pre- and post-designs to investigate the temporal changes in attitudes and intentions. Therefore, future research should explore how digital platforms, particularly MaaS platforms, can facilitate behaviour-controlling transport interventions, especially through the use of real-time messages (nudges). An analysis of the effects within various policy contexts, such as the stringency of carbon tax policies, would also be of considerable interest. The review’s findings may be context-dependent, as the studies were conducted across different geographical, socio-economic, and policy environments. Consequently, the results should be examined with caution. A potential limitation of this review is the risk of publication bias, as studies reporting significant effects of interventions may have been more likely to be published than those with null results. Furthermore, language and database selection bias may have influenced the included studies, as research published in non-English languages or outside of major academic databases was not systematically included.

6. Conclusions

This study explored the psychological and behavioural factors influencing transportation choices, focusing on interventions to promote sustainable transport adoption and addressing enablers of and barriers to behavioural change. Each of the nine themes identified contributed to a deeper understanding of why individuals intend to engage with or disengage from sustainable transport instead of cars. Two additional themes contribute to implementation costs and the monitoring of the number of cars in circulation related to the concern of local authorities. This is significant because the findings support local authorities or policymakers in understanding commuting behaviour and provide an overview of suggested interventions in the literature and the decision-making of transport intervention. Thus, this systematic review should be considered as a foundation that provides stakeholders, such as policymakers, operators, or scholars, with the necessary information for intervention planning. The findings highlight the need for targeted interventions, such as improved services and financial incentives, to shift attitudes and encourage sustainable transportation choices. In conclusion, it is worth noting that the JBI guidelines originally applicable to medicine can also be successfully applied to psychosocial topics. This systematic literature review demonstrates the potential of interdisciplinary methodological approaches for developing traffic and transport behaviour knowledge. Therefore, the manuscript provides an impulse to think beyond the conventional methods of a research field and promotes the application of interdisciplinary methodologies in understanding transport behaviour.

Supplementary Materials

The following supporting information can be downloaded at: https://www.mdpi.com/article/10.3390/futuretransp5030082/s1, Table S1: PRISMA 2020 Checklist by Page et al. [19]; Table S2: Table of keywords and synonyms based on review question, created by the author; Table S3: Qualitising table layout inspired by Stern et al. [21]; Figure S1: Data extraction and synthesis using JBI’s convergent integrated approach [21]; Form S1: JBI Mixed-Method Data Extraction Form following a Convergent Integrated Approach [20,21].

Author Contributions

Conceptualisation, P.E.; methodology, P.E.; software, P.E. and S.P.; validation, P.E. and S.P.; formal analysis, P.E.; investigation, P.E.; Data curation, P.E.; writing—original draft preparation, P.E.; writing—review and editing, P.E.; visualisation, P.E.; supervision, P.v.S., M.C. and T.C.; project administration, P.E. All authors have read and agreed to the published version of the manuscript.

Funding

This study did not receive any specific grant from funding agencies in the public, commercial, or not-for-profit sectors.

Data Availability Statement

Data availability does not apply, as this study is a systematic literature review. All supplementary materials, including data collection templates, data transformation templates, or any other resources used in the review, can be found within the Supplementary Materials.

Acknowledgments

We gratefully acknowledge the support of all co-authors and Teesside University staff. We also thank Paul Van Schaik for the supervision of the research students particularly in proofreading, deliberating, and revising the manuscript.

Conflicts of Interest

The authors declare that they have no known competing financial interests or personal relationships that could have appeared to influence the work reported in this paper.

Glossary

#TerminologyMeaningAuthor
1Soft interventions
(psychological interventions)
Strategies to influence people’s perceptions, beliefs, attitudes, values, and norms [12,56,63].(Semenescu, Gavreliuc and Sârbescu, 2020)
(Piras, Sottile, Tuveri and Meloni, 2022)
2Hard interventions
(structural interventions)
Strategies to modify social conditions and structures that attempt to change transportation behaviour by altering the physical environment and/or implementing legal or economic policies [12,56,63].(Semenescu, Gavreliuc and Sârbescu, 2020)
(Piras, Sottile, Tuveri and Meloni, 2022)
3First-and-last-mile problemCover the distance from the origin to the bus/train station (first-mile problem) or from the bus/train station to the destination (last-mile problem) [67].(von Behren, Bönisch, Vallée and Vortisch, 2021)
4Belief(s)Accessible beliefs about the consequences of the behaviour. For instance, a commuter may believe that using transport (behaviour) is not convenient or safe (behavioural belief), which leads to the rejection of commuting by public transport (outcome) [80].(Ajzen, 2005)
5QualitiseTransforming quantitative findings into a qualitative form (“qualitising”) to respond directly to the review question. Quantitative data should be presented as detailed textual descriptions so that the data can answer the review question (“contextualising”) [21].(Stern et al., 2020)
6Qualitative categoriesQualitative categories (subthemes) are obtained exclusively by synthesising two or more qualitative codes [21].(Stern et al., 2020)
7Qualitised categoriesQualitised categories (subthemes) are obtained exclusively by synthesising two or more qualitised codes [21]. (Stern et al., 2020)
8Multiple categoriesMultiple categories are comparable to subthemes from thematic analysis, which are made up of more than two codes in unequal proportions; for instance, two qualitised codes and one qualitative piece of code or vice versa [21]. (Stern et al., 2020)
9Mixed categoriesMixed categories are comparable to subthemes from thematic analysis, which synthesises both qualitised and qualitative codes in equal shares [21].(Stern et al., 2020)
10Integrated finding
(themes)
Outcome (themes) produced by aggregating qualitative categories with qualitised categories or multiple categories with mixed categories (subthemes) [21].(Stern et al., 2020)
11Key conceptsThemes or subthemes, labelled as findings within qualitative studies, included in the systematic review capable of answering the present paper’s review question [76].(Thomas and Harden, 2008)
12Modal shift Giving up a motorised CO2-emitting transport mode in favour of more sustainable transport modes; for instance, giving up cars and opting for railway [81]. (Diao, 2018)

References

  1. Chng, S.; Abraham, C.; White, M.P.; Hoffmann, C.; Skippon, S. Psychological theories of car use: An integrative review and conceptual framework. J. Environ. Psychol. 2018, 55, 23–33. [Google Scholar] [CrossRef]
  2. Pronello, C.; Gaborieau, J.-B. Engaging in Pro-Environment Travel Behaviour Research from a Psycho-Social Perspective: A Review of Behavioural Variables and Theories. Sustainability 2018, 10, 2412. [Google Scholar] [CrossRef]
  3. Umweltbundesamt. National Inventory Report for the German Greenhouse Gas Inventory 1990–2019; Umweltbundesamt: Dessau-Roslau, Germany, 2023; p. 994. [Google Scholar]
  4. European Commission Directorate-General for Mobility Transport. EU Transport in Figures: Statistical Pocketbook 2022; Publications Office of the European Union: Luxembourg, 2022. [Google Scholar]
  5. Hunecke, M.; Richter, N.; Heppner, H. Autonomy loss, privacy invasion and data misuse as psychological barriers to peer-to-peer collaborative car use. Transp. Res. Interdiscip. Perspect. 2021, 10, 100403. [Google Scholar] [CrossRef]
  6. Lorenzoni, I.; Nicholson-Cole, S.; Whitmarsh, L. Barriers perceived to engaging with climate change among the UK public and their policy implications. Glob. Environ. Change 2007, 17, 445–459. [Google Scholar] [CrossRef]
  7. Steg, L. Sustainable Transportation: A psychological perspective. IATSS Res. 2007, 31, 58–66. [Google Scholar] [CrossRef]
  8. World Meteorological Organization (WMO). WMO Statement on the State of the Global Climate in 2017; World Meteorological Organization (WMO): Geneva, Switzerland, 2018; p. 40. [Google Scholar]
  9. World Meteorological Organization (WMO). WMO Statement on the State of the Global Climate in 2019; World Meteorological Organization (WMO): Geneva, Switzerland, 2020; p. 44. [Google Scholar]
  10. Hrelja, R.; Khan, J.; Pettersson, F. How to create efficient public transport systems? A systematic review of critical problems and approaches for addressing the problems. Transp. Policy 2020, 98, 186–196. [Google Scholar] [CrossRef]
  11. Wimbadi, R.W.; Djalante, R.; Mori, A. Urban experiments with public transport for low carbon mobility transitions in cities: A systematic literature review (1990–2020). Sustain. Cities Soc. 2021, 72, 103023. [Google Scholar] [CrossRef]
  12. Semenescu, A.; Gavreliuc, A.; Sârbescu, P. 30 Years of soft interventions to reduce car use—A systematic review and meta-analysis. Transp. Res. Part D Transp. Environ. 2020, 85, 102397. [Google Scholar] [CrossRef]
  13. Chowdhury, S.; Ceder, A. Users’ willingness to ride an integrated public-transport service: A literature review. Transp. Policy 2016, 48, 183–195. [Google Scholar] [CrossRef]
  14. Redman, L.; Friman, M.; Gärling, T.; Hartig, T. Quality attributes of public transport that attract car users: A research review. Transp. Policy 2013, 25, 119–127. [Google Scholar] [CrossRef]
  15. Oeschger, G.; Carroll, P.; Caulfield, B. Micromobility and public transport integration: The current state of knowledge. Transp. Res. Part D Transp. Environ. 2020, 89, 102628. [Google Scholar] [CrossRef]
  16. Kwan, S.C.; Hashim, J.H. A review on co-benefits of mass public transportation in climate change mitigation. Sustain. Cities Soc. 2016, 22, 11–18. [Google Scholar] [CrossRef]
  17. Esser, P.; Pigera, S.; Campbell, M.; Van Schaik, P.; Crosbie, T. Success Factors in the Case of Transport Interventions: A Mixed-method Systematic Review Protocol (1990–2022). Int. Platf. Regist. Syst. Rev. Meta-Anal. Protoc. 2024, 1–10. Available online: https://inplasy.com/inplasy-2024-2-0011/ (accessed on 3 March 2025). [CrossRef]
  18. Page, M.J.; Moher, D.; Bossuyt, P.M.; Boutron, I.; Hoffmann, T.C.; Mulrow, C.D.; Shamseer, L.; Tetzlaff, J.M.; Akl, E.A.; Brennan, S.E.; et al. PRISMA 2020 explanation and elaboration: Updated guidance and exemplars for reporting systematic reviews. BMJ 2021, 372, n160. [Google Scholar] [CrossRef]
  19. Page, M.J.; McKenzie, J.E.; Bossuyt, P.M.; Boutron, I.; Hoffmann, T.C.; Mulrow, C.D.; Shamseer, L.; Tetzlaff, J.M.; Akl, E.A.; Brennan, S.E.; et al. The PRISMA 2020 statement: An updated guideline for reporting systematic reviews. Syst. Rev. 2021, 10, 89. [Google Scholar] [CrossRef]
  20. Lizarondo, L.; Stern, C.; Carrier, J.; Godfrey, C.; Rieger, K.; Salmond, S.; Apostolo, J.; Kirkpatrick, P.; Loveday, H. Chapter 8, Mixed methods systematic reviews. In JBI Manual for Evidence Synthesis; Aromataris, E., Munn, Z., Eds.; JBI: North Adelaide, Australia, 2020; pp. 307–308. [Google Scholar]
  21. Stern, C.; Lizarondo, L.; Carrier, J.; Godfrey, C.; Rieger, K.; Salmond, S.; Apóstolo, J.; Kirkpatrick, P.; Loveday, H. Methodological guidance for the conduct of mixed methods systematic reviews. JBI Evid. Synth. 2020, 18, 2108–2118. [Google Scholar] [CrossRef]
  22. Haddaway, N.R.; Page, M.J.; Pritchard, C.C.; McGuinness, L.A. PRISMA2020: An R package and Shiny app for producing PRISMA 2020-compliant flow diagrams, with interactivity for optimised digital transparency and Open Synthesis. Campbell Syst. Rev. 2022, 18, e1230. [Google Scholar] [CrossRef] [PubMed]
  23. Sirriyeh, R.; Lawton, R.; Gardner, P.; Armitage, G. Reviewing studies with diverse designs: The development and evaluation of a new tool. J. Eval. Clin. Pract. 2012, 18, 746–752. [Google Scholar] [CrossRef]
  24. Adamczak, M.; Toboła, A.; Fijałkowska, J.; Cyplik, P.; Tórz, M. Analysis of incentives to eco-driving for car rental companies’ customers. Sustainability 2020, 12, 10579. [Google Scholar] [CrossRef]
  25. Al-Atawi, A. Sustainable travel modes in Saudi Arabia: Is there a potential for formal car-sharing scheme? World J. Sci. Technol. Sustain. Dev. 2016, 13, 46–55. [Google Scholar] [CrossRef]
  26. Albalate, D.; Gragera, A. The impact of curbside parking regulations on car ownership. Regional Science and Urban Economics 2020, 81, 103518. [Google Scholar] [CrossRef]
  27. Bao, Y.; Xu, M.; Dogterom, N.; Ettema, D. Effectiveness investigation of travel demand management measures in Beijing: Existing measures and a potential measure–tradable driving credit. Transp. Res. Part F Traffic Psychol. Behav. 2020, 72, 47–61. [Google Scholar] [CrossRef]
  28. Basaric, V.; Djoric, V.; Jevdjenic, A.; Jovic, J. Efficient Methodology for Assessment of Targets and Policy Measures for Sustainable Mobility Systems. Int. J. Sustain. Transp. 2015, 9, 217–226. [Google Scholar] [CrossRef]
  29. Basbas, S.; Politis, I. Urban road pricing and sustainable transportation systems: The Thessaloniki central area case. Int. J. Sustain. Dev. Plan. 2008, 3, 1–15. [Google Scholar] [CrossRef]
  30. Gehlert, T.; Nielsen, O.A.; Rich, J.; Schlag, B. Public acceptability change of urban road pricing schemes. Proc. Inst. Civ. Eng. Transp. 2008, 161, 111–121. [Google Scholar] [CrossRef]
  31. Hammadou, H.; Mahieux, A. Transportation demand management in a deprived territory: A case study in the north of France. Transp. Res. Procedia 2014, 4, 300–311. [Google Scholar] [CrossRef]
  32. Henry, G.T.; Gordon, C.S. Driving less for better air: Impacts of a public information campaign. J. Policy Anal. Manag. 2003, 22, 45–63. [Google Scholar] [CrossRef]
  33. Hoang, Q.; Okamura, T. Analyzing behavioral intentions in new residential developments of motorcycle dependent cities: The case of Ho Chi Minh City, Vietnam. Case Stud. Transp. Policy 2020, 8, 163–172. [Google Scholar] [CrossRef]
  34. Ingvardson, J.B.; Nielsen, O.A. The relationship between norms, satisfaction and public transport use: A comparison across six European cities using structural equation modelling. Transp. Res. Part A Policy Pract. 2019, 126, 37–57. [Google Scholar] [CrossRef]
  35. Irvansyah, R.; Sugiarto, S.; Achmad, A.; Fahlevi, H. Analysis of the Trans Koetaradja bus services considering latent variables of bus line services. IOP Conf. Ser. Mater. Sci. Eng. 2020, 917, 012036. [Google Scholar] [CrossRef]
  36. Moerman, J.-j.; van Heusden, S.; Matheussen, B.; Martinetti, A. Encouraging a Modal Shift to Passenger Railway Transportation: A Case Study in Adaptable Rolling Stock Interior Design. Sustainability 2022, 14, 9701. [Google Scholar] [CrossRef]
  37. Javadinasr, M.; Asgharpour, S.; Rahimi, E.; Choobchian, P.; Mohammadian, A.K.; Auld, J. Eliciting attitudinal factors affecting the continuance use of E-scooters: An empirical study in Chicago. Transp. Res. Part F Traffic Psychol. Behav. 2022, 87, 87–101. [Google Scholar] [CrossRef]
  38. Khademi, E.; Timmermans, H.; Borgers, A. Temporal adaptation to reward schemes: Results of the spitsscoren project. Transp. Res. Procedia 2014, 3, 60–69. [Google Scholar] [CrossRef]
  39. Kilavuz, T.; Kisla, R. Demand management methods for the environment oriented hybrid traffic system to be implemented in Istanbul. Transp. Res. Procedia 2016, 14, 3380–3389. [Google Scholar] [CrossRef]
  40. Kverndokk, S.; Figenbaum, E.; Hovi, J. Would my driving pattern change if my neighbor were to buy an emission-free car? Resour. Energy Econ. 2020, 60, 101153. [Google Scholar] [CrossRef]
  41. Lanzini, P.; Pinheiro, D.; Jara, E. Toward a new paradigm for urban mobility in Brazil: An empirical investigation in the city of Florianopolis. Int. J. Sustain. Transp. 2022, 14, 319–332. [Google Scholar] [CrossRef]
  42. Leow, N.X.; Krishnaswamy, J. Smart cities need environmental consciousness and more social responsibilities as an outcome of COVID-19 – reflections from urban road commuters. Foresight 2022, 24, 276–296. [Google Scholar] [CrossRef]
  43. Lesteven, G.; Samadzad, M. Ride-hailing, a new mode to commute? Evidence from Tehran, Iran. Travel Behav. Soc. 2021, 22, 175–185. [Google Scholar] [CrossRef]
  44. Liakopoulou, S.; Kakana, M.M.; Avtji, P.; Genitsaris, E.; Naniopoulos, A. Investigating the preferences of students towards the creation of a carpooling system serving the academic bodies of Thessaloniki city. Transp. Res. Procedia 2017, 24, 425–432. [Google Scholar] [CrossRef]
  45. Li, P.; Zhao, P.; Brand, C. Future energy use and CO2 emissions of urban passenger transport in China: A travel behavior and urban form based approach. Appl. Energy 2018, 211, 820–842. [Google Scholar] [CrossRef]
  46. Loo, L.Y.L.; Corcoran, J.; Mateo-Babiano, D.; Zahnow, R. Transport mode choice in South East Asia: Investigating the relationship between transport users’ perception and travel behaviour in Johor Bahru, Malaysia. J. Transp. Geogr. 2015, 46, 99–111. [Google Scholar] [CrossRef]
  47. Luo, R.; Fan, Y.; Yang, X.; Zhao, J.; Zheng, S. The impact of social externality information on fostering sustainable travel mode choice: A behavioral experiment in Zhengzhou, China. Transp. Res. Part A Policy Pract. 2021, 152, 127–145. [Google Scholar] [CrossRef]
  48. Martinez, A.G.; Diez, J.; Lambas, M.E.L.; Ricci, S. From car to bike: Marketing and dialogue as a driver of change. WIT Trans. Built Environ. 2018, 176, 221–230. [Google Scholar] [CrossRef]
  49. Matowicki, M.; Amorim, M.; Kern, M.; Pecherkova, P.; Motzer, N.; Pribyl, O. Understanding the potential of MaaS—An European survey on attitudes. Travel Behav. Soc. 2022, 27, 204–215. [Google Scholar] [CrossRef]
  50. Melia, S.; Chatterjee, K.; Stokes, G. Is the urbanisation of young adults reducing their driving? Transp. Res. Part A Policy Pract. 2018, 118, 444–456. [Google Scholar] [CrossRef]
  51. Minal; Gajrani, K.K.; Sekhar, C.R.; Tare, V. Impact of road rationing on modal shift and transport sustainability in Delhi, India. Proc. Inst. Civ. Eng. Transp. 2022, 175, 12–21. [Google Scholar] [CrossRef]
  52. Moody, J.; Zhao, J. Travel behavior as a driver of attitude: Car use and car pride in US Cities. Transp. Res. Part F Traffic Psychol. Behav. 2020, 74, 225–236. [Google Scholar] [CrossRef]
  53. Morris, D.; Enoch, M.; Pitfield, D.; Ison, S. Car-free development through UK community travel plans. Proc. Inst. Civ. Eng. Urban Des. Plan. 2009, 162, 19–27. [Google Scholar] [CrossRef]
  54. Muller, M.; Park, S.; Lee, R.; Fusco, B.; Correia, G.H.A. Review of whole system simulation methodologies for assessing mobility as a service (Maas) as an enabler for sustainable urban mobility. Sustainability 2021, 13, 5591. [Google Scholar] [CrossRef]
  55. Pamucar, D.; Deveci, M.; Canıtez, F.; Paksoy, T.; Lukovac, V. A novel methodology for prioritizing zero-carbon measures for sustainable transport. Sustain. Prod. Consum. 2021, 27, 1093–1112. [Google Scholar] [CrossRef]
  56. Piras, F.; Sottile, E.; Tuveri, G.; Meloni, I. Does the joint implementation of hard and soft transportation policies lead to travel behavior change? An experimental analysis. Res. Transp. Econ. 2022, 95, 101233. [Google Scholar] [CrossRef]
  57. Poslad, S.; Ma, A.; Wang, Z.; Mei, H. Using a Smart City IoT to Incentivise and Target Shifts in Mobility Behaviour--Is It a Piece of Pie? Sensors 2015, 15, 13069–13096. [Google Scholar] [CrossRef] [PubMed]
  58. Pritchard, J. MaaS to pull us out of a car-centric orbit: Principles for sustainable Mobility-as-a-Service in the context of unsustainable car dependency. Case Stud. Transp. Policy 2022, 10, 1483–1493. [Google Scholar] [CrossRef]
  59. Rahmat, M.; Mizokami, S. Demand and driver supply implications of regular public transportation system for policy makers: A case study of Kandahar City, Afghanistan. Transp. Res. Procedia 2020, 48, 2975–2989. [Google Scholar] [CrossRef]
  60. Rezaimoghadam, M.R.; Davoodi, S.R.; Dabiri, N. Public transportation users’ behavior based on theory of planned behavior. Alam Cipta 2022, 15, 10–18. [Google Scholar] [CrossRef]
  61. Ricci, M. Bike sharing: A review of evidence on impacts and processes of implementation and operation. Res. Transp. Bus. Manag. 2015, 15, 28–38. [Google Scholar] [CrossRef]
  62. Santos, G.; Behrendt, H.; Teytelboym, A. Part II: Policy instruments for sustainable road transport. Res. Transp. Econ. 2010, 28, 46–91. [Google Scholar] [CrossRef]
  63. Sottile, E.; Meloni, I.; Cherchi, E. Hybrid choice model to disentangle the effect of awareness from attitudes: Application test of soft measures in medium size city. Case Stud. Transp. Policy 2017, 5, 400–407. [Google Scholar] [CrossRef]
  64. Souche-Le Corvec, S.; Mercier, A.; Ovtracht, N.; Chevallier, A. Urban toll and electric vehicles: The winning ticket for Lyon Metropolitan Area (France). Res. Transp. Econ. 2019, 73, 17–33. [Google Scholar] [CrossRef]
  65. Srinivasan, K.K.; Lakshmi Bhargavi, P.V.; Ramadurai, G.; Muthuram, V.; Srinivasan, S. Determinants of changes in mobility and travel patterns in developing countries: Case study of Chennai, India. Transp. Res. Rec. 2007, 2038, 42–52. [Google Scholar] [CrossRef]
  66. Venturini, G.; Karlsson, K.; Münster, M. Impact and effectiveness of transport policy measures for a renewable-based energy system. Energy Policy 2019, 133, 110900. [Google Scholar] [CrossRef]
  67. Von Behren, S.; Bonisch, L.; Vallee, J.; Vortisch, P. Classifying car owners in latent psychographic profiles. Transp. Res. Rec. 2021, 2675, 142–152. [Google Scholar] [CrossRef]
  68. Weiand, L.; Schmitz, S.; Becker, S.; Niehoff, N.; Schwartzbach, F.; von Schneidemesser, E. Climate change and air pollution: The connection between traffic intervention policies and public acceptance in a local context. Environ. Res. Lett. 2019, 14, 085008. [Google Scholar] [CrossRef]
  69. Yi, X.; Lian, F.; Yang, Z. Research on commuters’ carpooling behavior in the mobile internet context. Transp. Policy 2022, 126, 14–25. [Google Scholar] [CrossRef]
  70. Jittrapirom, P.; Marchau, V.; van der Heijden, R.; Meurs, H. Future implementation of mobility as a service (MaaS): Results of an international Delphi study. Travel Behav. Soc. 2020, 21, 281–294. [Google Scholar] [CrossRef]
  71. Kurniawan, J.H.; Ong, C.; Cheah, L. Examining values and influences affecting public expectations of future urban mobility: A Singapore case study. Transp. Policy 2018, 66, 66–75. [Google Scholar] [CrossRef]
  72. Nikitas, A.; Avineri, E.; Parkhurst, G. Understanding the public acceptability of road pricing and the roles of older age, social norms, pro-social values and trust for urban policy-making: The case of Bristol. Cities 2018, 79, 78–91. [Google Scholar] [CrossRef]
  73. Riley, R.; de Preux, L.; Capella, P.; Mejia, C.; Kajikawa, Y.; de Nazelle, A. How do we effectively communicate air pollution to change public attitudes and behaviours? A review. Sustain. Sci. 2021, 16, 2027–2047. [Google Scholar] [CrossRef]
  74. Buck, M.; Nurse, A. Cycling in an ‘ordinary city’: A practice theory approach to supporting a modal shift. Int. J. Sustain. Transp. 2021, 17, 65–76. [Google Scholar] [CrossRef]
  75. Goodman, A.; Guell, C.; Panter, J.; Jones, N.R.; Ogilvie, D. Healthy travel and the socio-economic structure of car commuting in Cambridge, UK: A mixed-methods analysis. Soc. Sci. Med. (1982) 2012, 74, 1929–1938. [Google Scholar] [CrossRef]
  76. Thomas, J.; Harden, A. Methods for the thematic synthesis of qualitative research in systematic reviews. BMC Med. Res. Methodol. 2008, 8, 45. [Google Scholar] [CrossRef] [PubMed]
  77. Sandelowski, M.; Voils, C.I.; Barroso, J. Defining and designing mixed research synthesis studies. Res. Sch. 2006, 13, 29. [Google Scholar] [PubMed]
  78. Campbell, M.; McKenzie, J.E.; Sowden, A.; Katikireddi, S.V.; Brennan, S.E.; Ellis, S.; Hartmann-Boyce, J.; Ryan, R.; Shepperd, S.; Thomas, J.; et al. Synthesis without meta-analysis (SWiM) in systematic reviews: Reporting guideline. BMJ 2020, 368, l6890. [Google Scholar] [CrossRef]
  79. Schwartz, S. Normative influences on altruism. In Advances in Experimental Social Psychology; Berkowitz, L., Ed.; Academic Press: New York, 1977; Volume 10, pp. 221–279. [Google Scholar]
  80. Ajzen, I. Attitudes, Personality and Behaviour; McGraw-Hill Education: Berkshire, UK, 2005. [Google Scholar]
  81. Diao, M. Towards sustainable urban transport in Singapore: Policy instruments and mobility trends. Transp. Policy 2019, 81, 320–330. [Google Scholar] [CrossRef]
Figure 1. The convergent integrated approach to MMSR [21]. WoS = Web of Science; QATSDD = Quality Assessment Tool for Studies with Diverse Designs; MMSR = mixed-method systematic review.
Futuretransp 05 00082 g001
Figure 2. Prisma flow chart [22].
Futuretransp 05 00082 g002
Table 1. Quantitative studies: Quality Assessment Tool for Studies with Diverse Designs inspired by Sirriyeh et al., 2012 [23] *.
Author(s)C1C2C3C4C5C6C7C8C9C10C11C12C13C14C15C16
#1770–Adamczak 2020 [24] **032232000002100116
#6609–Al-Atawi 2016 [25] **233021110003200119
#4494–Albalate 2020 [26] **113001010003300114
#2293–Bao 2020 [27] **013122023003000017
#2759–Basaric 2015 [28] **023001200002200214
#1514–Basbas 2008 [29] ***333000000003230219
#3707–Gehlert 2008 [30] **333122330303300332
#2937–Hammadou 2014 [31] **333032100303300024
#3774–Henry 2003 [32] **033033330303300229
#6724–Hoang 2020 [33] **033013013003032224
#4951–Ingvardson 2019 [34] **331132203003200326
#4954–Irvansyah 2020 [35] **013012000002200112
#1225–Jan-jaap 2022 [36] ***333011000001300116
#6480–Javadinasr 2022 [37] **333033113003300329
#3008–Khademi 2014 [38] **033113310003300122
#6752–Kilavuz 2016 [39] **01301000000000005
#5047–Kverndokk 2020 [40] **333331220303300029
#6760–Lanzini et al. (2022) [41] **333321111303302231
#6497–Leow 2022 [42] **301311000003100114
#2482–Lesteven 2021 [43] **033033010003202323
#5932–Liakopoulou 2017 [44] **00310100000000005
#5930–Li 2018 [45] **333013100003300222
#3051–Loo 2015 [46] **333021100003300221
#5102–Luo 2021 [47] **033033330003300327
#5953–Martinez 2018 [48] **003023230001000014
#2512–Matowicki 2022 [49] **333033333003300333
#5162–Melia 2018 [50] **003121200003100114
#6515–Minal 2022 [51] **003312030002100015
#2540–Moody 2020 [52] **331022031003300324
#4034–Morris 2009 [53] **03100100000000016
#5216–Muller 2021 [54] **33000000000000006
#5277–Pamucar 2021 [55] **333010010003302221
#6319–Piras 2022 [56] **033023330003300326
#845–Poslad 2015 [57] **033021110000002114
#6322–Pritchard 2022 [58] **03300000000000017
#5338–Rahmat 2020 [59] **303023120002000117
#6545–Rezaimoghadam 2022 [60] **333212013003201226
#3189–Ricci 2015 [61] **02200000001000016
#4197–Santos 2010 [62] **03300000000000006
#6104–Sottile 2017 [63] **333013233003300128
#5467–Souche-LeCorvec 2019 [64] **333001100002000114
#4263–Srinivasan 2007 [65] **033033100002200118
#5556–Venturini 2019 [66] **333003200003203224
#7559–vonBehren 2021 [67] **033023210303300326
#1491–Weiand 2019 [68] **033031100003200218
#6372–Yi 2022 [69] **333013110002100220
Grey = enhanced readability; red low quality green = high quality. ** Quantitative/qualitative study; *** Mixed-Method study.
Table 2. Qualitative studies: Quality Assessment Tool for Studies with Diverse Designs inspired by Sirriyeh et al., 2012 [23].
Author(s)C1C2C3C4C5C6C7C8C9C10C11C12C13C14C15C16
#4974–Jittrapirom 2020 [70] **033013330003322329
#5913–Kurniawan 2018 [71] **033012320000330222
#6003–Nikitas 2018 [72] **323332320020212230
#5353–Riley 2021 [73] **333003301000320324
* 0 = not at all, 1 = very slightly, 2 = moderately, 3 = completely. ** Quantitative/qualitative study designs: low-quality studies: 0–14 (red), moderate-quality studies: 15–28, high-quality studies: 29–42 (green). C1: Explicit theoretical framework. C2: Statement of aims/objectives in main body of report. C3: Clear description of research setting. C4: Evidence of sample size considered in terms of analysis. C5: Representative sample of target group of a reasonable size. C6: Description of procedure for data collection. C7: Rationale for choice of data collection tool(s). C8: Rationale for choice of data collection tool(s). C9: Statistical assessment of reliability and validity of measurement tool(s) (quantitative only). C10: Fit between stated research question and method of data collection (quantitative only). C11: Fit between stated research question and format and content of data collection tool, e.g., interview schedule (qualitative only). C12: Fit between research question and method of analysis (quantitative only). C13: Fit between research question and method of analysis (quantitative only). C14: Assessment of reliability of analytical process (qualitative only). C15: Evidence of user involvement in design. C16: Strengths and limitations critically discussed.
Table 3. Mixed-method studies: Quality Assessment Tool for Studies with Diverse Designs inspired by Sirriyeh et al., 2012 [23].
Author(s)C1C2C3C4C5C6C7C8C9C10C11C12C13C14C15C16
#4618–Buck 2021 [74] ***333011120001003321
#384–Goodman 2012 [75] ***033033130003200324
* 0 = not at all, 1 = very slightly, 2 = moderately, 3 = completely. *** Mixed-method study designs: low-quality studies: 0–16 (red), moderate-quality studies: 17–32, high-quality studies: 33–48 (green). C1: Explicit theoretical framework. C2: Statement of aims/objectives in main body of report. C3: Clear description of research setting. C4: Evidence of sample size considered in terms of analysis. C5: Representative sample of target group of a reasonable size. C6: Description of procedure for data collection. C7: Rationale for choice of data collection tool(s). C8: Rationale for choice of data collection tool(s). C9: Statistical assessment of reliability and validity of measurement tool(s) (quantitative only). C10: Fit between stated research question and method of data collection (quantitative only). C11: Fit between stated research question and format and content of data collection tool e.g., interview schedule (qualitative only). C12: Fit between research question and method of analysis (quantitative only). C13: Fit between research question and method of analysis (quantitative only). C14: Assessment of reliability of analytical process (qualitative only). C15: Evidence of user involvement in design. C16: Strengths and limitations critically discussed.
Table 4. Study characteristics.
Study IDPopulationExposure to Transport InterventionOutcomes
Author
(Year)
Study
Design
CountrySample SizeSource of ParticipantsAgeFemale %Identification
Participant
Significant Changes in Internal Dispositions Pre–Post Implementation (Effectiveness)
No Change ObservedChanges Observed
Adamczak (2020) [24]Cross-sectionalPoland323Car rental customers (before starting car rental)21–60
years
37Self-reportCar renting incentivesFuturetransp 05 00082 i001
Al-Atawi (2016) [25]Cross-SectionalSaudi Arabia527Household survey-30Self-reportCar sharing schemeFuturetransp 05 00082 i001
Bao
(2020) [27]
Cross-sectionalChina660car commuters in Beijing (driver behaviour)-48ExperimentTraffic congestion charge scheme “tradeable credits” Futuretransp 05 00082 i002
Basbas
(2008) [29]
Cross-sectionalGreece813 nodes
293 zones
Data file of road network data
Data file trip matrix
Data set of observed morning counts
--Observation and modelling traffic simulationImplementing of the metro transportation system Futuretransp 05 00082 i002
Road pricing scheme
cordon tolls in the city centre
Futuretransp 05 00082 i002
Buck
(2021) [74]
Cross-sectionalUnited Kingdom95Princes Park ward non-cyclists and cyclists--Self-reportProvision of segregated cycle lanesFuturetransp 05 00082 i001
Cycle parking facilities,Futuretransp 05 00082 i001
Resurfacing of cycle lanesFuturetransp 05 00082 i001
Safe public bicycle storage facilitiesFuturetransp 05 00082 i001
Gehlert
(2008) [30]
Cross-sectionalDenmark252AKTA field experiment area: subset of the original AKTA sampleUnder 30, up to 60+ years31Quasi-experimentDanish car tax system Futuretransp 05 00082 i002
Urban road pricing Futuretransp 05 00082 i002
Peak hour charge Futuretransp 05 00082 i002
Package solution Futuretransp 05 00082 i002
Table 5. Study characteristics.
Study IDPopulationExposure to Transport InterventionOutcomes
Author
(Year)
Study
Design
CountrySample SizeSource of ParticipantsAgeFemale %Identification
Participant
Significant Changes in Internal Dispositions Pre–Post Implementation (Effectiveness)
No Change ObservedChanges Observed
Goodman (2012) [75]Cross-sectionalUnited Kingdom1142Participants lived within 30 km of central Cambridge and commuted to pre-specified Cambridge workplaces17–71 years68Self-report-Futuretransp 05 00082 i001
Hammadou (2014) [31]Cross-sectionalFrance15,628Household Travel Surveys,
Béthune–Bruay–Noeux and Lens–Lévin–Hénin–Carvin
5–65+
years
55Self-reportBus with a high level of service linesFuturetransp 05 00082 i001
Henry (2003) [32]Cross-sectionalUnited States2935Probability sample of adult residents of the 13 counties of the metropolitan area of Atlanta42 Ø
years
61ExperimentAtlanta information campaign Futuretransp 05 00082 i002
Hoang (2020) [33]Cross-sectionalVietnam215Ho Chi Minh City (HCMC)21–40
years
40Self-report-Futuretransp 05 00082 i001
Ingvardson (2019) [34]Cross-sectionalStockholm
Oslo, Helsinki, Copenhagen, Vienna, Geneva
44,956BEST questionnaire data from six European cities16–80+
years
54 ØSelf-report-Futuretransp 05 00082 i001
Javadinasr (2022) [37]Cross-sectionalUnited States2126Lime customers18–65+
years
37Self-reportImplementing e-scootersFuturetransp 05 00082 i001
Jittrapirom (2020) [70]Cross-sectionalEurope
North America
Asia Pacific
89Academic literature and recommendations--Self-reportImplementing a MaaS pilot projectFuturetransp 05 00082 i001
Khademi (2014) [38]LongitudinalNetherlands380SpitsScoren project46 Ø
years
15Quasi-experimentReward scheme SpitsScoren project Futuretransp 05 00082 i002
Kurniawan (2018) [71]Cross-sectionalSingapore22Singapore residents19–40
years
-Self-reportArea licensing scheme
Electronic road pricing (ERP)
Futuretransp 05 00082 i001
Table 6. Study characteristics.
Study IDPopulationExposure to Transport InterventionOutcomes
Author
(Year)
Study
Design
CountrySample SizeSource of ParticipantsAgeFemale %Identification
Participant
Significant Changes in Internal Dispositions Pre–Post Implementation (Effectiveness)
No Change ObservedChanges Observed
Kverndokk (2020) [40]Cross-sectionalNorway2264Electric battery vehicle users and internal combustion vehicle users--Self-reportSubsidizing green cars Futuretransp 05 00082 i002
Taxing brown cars Futuretransp 05 00082 i002
Green cars drive in bus lanes Futuretransp 05 00082 i002
Lanzini et al. (2022) [41]Cross-sectionalBrazil436Florianopolis27 Ø
years
57Self-report-Futuretransp 05 00082 i001
Lesteven (2021) [43]Cross-sectionalIran482Tehran region15–50
years
49Self-report-Futuretransp 05 00082 i001
Li (2018) [45]Cross-sectionalChina187Cities in China----Futuretransp 05 00082 i001
Loo (2015) [46]Cross-sectionalMalysia488Johor Bahru, Singapore18–65+
years
71Self-report-Futuretransp 05 00082 i001
Luo (2021) [47]Cross-sectionalChina561Zhengzhou32 Ø
years
57ExperimentInformation campaign
social externality information intervention
Futuretransp 05 00082 i002
Matowicki (2022) [49]Cross-sectionalEurope6405
(6000)
England, Germany, Czech Republic, and Poland38 Ø
years
51Self-reportMaaSFuturetransp 05 00082 i001
Minal (2022) [51]Cross-sectionalIndia301Delhi18–30
years
-Quasi-experimentOdd–even schemeFuturetransp 05 00082 i001
Table 7. Study characteristics.
Study IDPopulationExposure to Transport InterventionOutcomes
Author
(Year)
Study
Design
CountrySample SizeSource of ParticipantsAgeFemale %Identification
Participant
Significant Changes in Internal Dispositions Pre–Post Implementation (Effectiveness)
No Change ObservedChanges Observed
Moody (2020) [52]Cross-sectionalUnited States1236Residents and commuters in New York–Newark–Jersey City, NY–NJ–PA (NYC), and Houston–The Woodlands–Sugar Land, TX metro area
(HOU)
18+
years
-Self-report-Futuretransp 05 00082 i001
Nikitas (2018) [72]Cross-sectionalUnited Kingdom30Elderly people living in Bristol26–84
years
53Self-reportRoad pricing schemeFuturetransp 05 00082 i001
Pamucar (2021) [55]Cross-sectionalUnited Kingdom6Researcher at a transport research centre
Transport planner, Transport for London
Urban planner from London
--Self-reportIntroduce zero emission zonesFuturetransp 05 00082 i001
Install electric chargingFuturetransp 05 00082 i001
Infrastructure to support ULEVsFuturetransp 05 00082 i001
Piras (2022) [56]LongitudinalItaly194Car drivers in the metropolitan area of Cagliari18–60+
years
56ExperimentIntroduction of a new light railway line Futuretransp 05 00082 i002
Information campaign
Personalised travelled plans
Futuretransp 05 00082 i002
Rahmat (2020) [59]Cross-sectionalAfghanistan200Residents of Kandahar city1–60+
years
12Self-report-Futuretransp 05 00082 i001
Rezaimoghadam (2022) [60]Cross-sectionalIran362Citizens of Gorgan-39Self-report-Futuretransp 05 00082 i001
Table 8. Study characteristics.
Study IDPopulationExposure to Transport InterventionOutcomes
Author
(Year)
Study
Design
CountrySample SizeSource of ParticipantsAgeFemale %Identification
Participant
Significant Changes in Internal Dispositions Pre–Post Implementation (Effectiveness)
No Change ObservedChanges Observed
Riley (2021) [73]ReviewNot included in synthesis process. Study characteristics reported as narrative.
Sottile (2017) [63]Cross-sectionalItaly62Travellers within the metropolitan area of Cagliari18–80
years
48ExperimentVoluntary travel behaviour change programme promoting the use of the light rail in park-and-ride mode Futuretransp 05 00082 i002
Srinivasan (2007) [65]Cross-sectionalIndia1172Chennai Household Travel Survey18–60+
years
-Self-report-Futuretransp 05 00082 i001
Venturini (2019) [66]Cross-sectionalDenmark----Observation and modelling traffic simulation-Futuretransp 05 00082 i001
Von Behren (2021) [67]Cross-sectionalGermany600Car owners and car users living in Munich and Berlin16–56+
years
<50Self-report-Futuretransp 05 00082 i001
Weiand (2019) [68]Cross-sectionalGermany3500 observationsIn and around Potsdam18–55+
years
40–50%Self-report-Futuretransp 05 00082 i001
Yi (2022) [69]Cross-sectionalChina420NingboUnder 24 up to 46+
years
43Self-report-Futuretransp 05 00082 i001
Table 9. Vote-counting summarises the effects of transport intervention studies on car-use behaviour.
Study IDSample SizeStudy DesignNon-RCTRCTMethodsOutcomesBehavioural Change in Car Use
#2293
Bao 2020 [27]
660Pre–postFuturetransp 05 00082 i002Futuretransp 05 00082 i001Regression analysis
Factor analysis KMO and Bartlett’s test
Car use◄►
#3707
Gehlert 2008 [30]
252Pre–postFuturetransp 05 00082 i002Futuretransp 05 00082 i001Regression analysis
ANOVA
Mileage (km)
Number of trips (trips)
#3774
Henry 2003 [32]
2935No alert days and alert daysFuturetransp 05 00082 i002Futuretransp 05 00082 i001OLS
ANCOVA
Mileage
Number of trips (trips)
#3008
Khademi 2014 [38]
380LongitudinalFuturetransp 05 00082 i002Futuretransp 05 00082 i001Mixed logitModal choice
#5102
Luo 2021 [47]
561Pre–postFuturetransp 05 00082 i001Futuretransp 05 00082 i002Multinomial logit
Difference-in-difference estimation
n.a.◄►
#6515
Minal 2022 [51]
301Pre–postFuturetransp 05 00082 i002Futuretransp 05 00082 i001Multinomial logit
Sustainability index
Reduction in car use in %
#6319
Piras 2022 [56]
194Pre–postFuturetransp 05 00082 i002Futuretransp 05 00082 i001Discrete choice modelling
Hybrid choice model
Modal choice
NRC, non-randomised comparative study; RCT, randomised controlled trial. Effect direction: ▲ = benefit (positive change, i.e., reducing mileage driven, trips taken, reduction in car use or choosing other options than car); ◄► = no change/mixed results/conflicting findings.
Table 10. Vote-counting summarises the effects of transport intervention studies on internal dispositions.
Study IDSample SizeStudy DesignNon-RCTRCTMethodsOutcomesChanges in Internal Dispositions
#2293
Bao 2020 [27]
660Pre–postFuturetransp 05 00082 i002Futuretransp 05 00082 i001Regression analysis
Factor analysis KMO and Bartlett’s test
Public’s acceptability (attitude)
#3707
Gehlert 2008 [30]
252Pre–postFuturetransp 05 00082 i002Futuretransp 05 00082 i001Regression analysis
ANOVA
Public’s acceptability (attitude)
#3774
Henry 2003 [32]
2935No-alert days and alert daysFuturetransp 05 00082 i002Futuretransp 05 00082 i001OLS
ANCOVA
Public’s awareness
#3008
Khademi 2014 [38]
380LongitudinalFuturetransp 05 00082 i002Futuretransp 05 00082 i001Mixed logitIntention
#5102
Luo 2021 [47]
561Pre–postFuturetransp 05 00082 i001Futuretransp 05 00082 i002Multinomial logit
Difference-in-difference estimation
Intention
#6515
Minal 2022 [51]
301Pre–postFuturetransp 05 00082 i002Futuretransp 05 00082 i001Multinomial logit
Sustainability index
n.a.◄►
#6319
Piras 2022 [56]
194Pre–postFuturetransp 05 00082 i002Futuretransp 05 00082 i001Discrete choice modelling
Hybrid choice model
n.a.◄►
NRC, non-randomised comparative study; RCT, randomised controlled trial. Effect direction: ▲ = benefit (positive change); ◄► = no change/mixed results/conflicting findings.
Disclaimer/Publisher’s Note: The statements, opinions and data contained in all publications are solely those of the individual author(s) and contributor(s) and not of MDPI and/or the editor(s). MDPI and/or the editor(s) disclaim responsibility for any injury to people or property resulting from any ideas, methods, instructions or products referred to in the content.

