Abstract
Personal Rapid Transit (PRT) and Group Rapid Transit (GRT) are classes of fully automated public transport systems, where passengers can travel in small vehicles on an interconnected, grade-separated network of guideways, non-stop, from origin to destination. PRT and GRT are considered sustainable as they are low-emission and able to attract car drivers. The parameterized cost modeling framework developed in this paper has the advantage that profitability of different PRT/GRT systems can be rapidly verified in a transparent way and in function of a variety of relevant system parameters. This framework may contribute to a more transparent, rapid, and low-cost evaluation of PRT/GRT schemes for planning and decision-making purposes. The main innovation is the introduction of the “peak hour network saturation” S: the number of vehicles in circulation during peak hour divided by the maximum number of vehicles running at line speed with minimum time headways. It is an index that aggregates the main uncertainties in the planning process, namely the demand level relative to the supply level. Furthermore, a maximum S can be estimated for a PRT/GRT project, even without a detailed demand estimation. The profit per trip is analytically derived based on S and a series of more certain parameters, such as fares, capital and maintenance costs, daily demand curve, empty vehicle share, and physical properties of the system. To demonstrate the ability of the framework to analyze profitability in function of various parameters, we apply the methods to a single vehicle PRT, a platooned PRT, and a mixed PRT/GRT. The results show that PRT services with trip length proportional fares could be profitable already for . The PRT capacity, profitability, and robustness to tripled infrastructure costs can be increased by vehicle platooning or GRT service during peak hours.
1. Introduction
1.1. Background on PRT
The transition to carbon-neutral transport and the goals to reduce urban air pollution and traffic accidents while maintaining accessibility to mobility for all are challenging tasks for most cities. As cycling infrastructures, reserved bus/tram lanes, as well as road and car parks compete for the same public space, it appears difficult for cities to move rapidly toward more sustainable mobility solutions. Additional infrastructure for high capacity connections, either for public transport (e.g., light rail or metro) or private transport (tunnels or bridges for multi-lane freeways), are expensive. It is legitimate to ask whether there is no third alternative that offers both a high-quality transport service, similar to the car, and a high capacity similar to light rail trains (LRT), but at much lower infrastructure and operating costs.
This work analyzes and generalizes the performance and financial feasibility of a form of public transport, called Personal Rapid Transit (PRT), where car-size, fully automated vehicles run on dedicated guideways [1]. The PRT vehicles can transport up to six passengers or light freight, they are individually controlled, and electrically driven. PRT vehicles are available on demand, 24 h a day. Journeys are typically non-stop from a station of origin to destination, without any intervention by the passenger. PRT may provide a genuine alternative to the private car as passengers can travel individually or in a small group of their choice, always seated and in a comfortable atmosphere.
The interconnected PRT network consists of light-weight, narrow-gauge guideways. A one-way guideline cross-section is approximately equal to 1 m2 and the minimum radius of curvature is 3–5 m, which means that guideway structures can be flexibly routed in urban areas either underground in shafts, on-ground (when protected), elevated, and even inside existing buildings.
Flexible switching and globally controlled routing allow PRT systems to operate as networks, and not as a collection of independent lines, as is the case in conventional public transport, thus achieving much lower door-to-door travel times. This means the following: (1). The PRT has the capacity to attract car drivers; this is a hypothesis to justify the estimation methods of maximum peak-hour network saturation in Section 2.1. (2). PRT traffic would not interfere with the remaining surface traffic, which facilitates its implementation in the present infrastructure and favors pedestrians and cyclists, the most sustainable modes. Note that the present study does not include mode share estimation; stated preference surveys are reported in [2].
Despite its potential advantages, no large-scale PRT network has been implemented, even though PRT technology has been known since the early 1970s; see [1] for an early technical description. Since then, political, financial, and technical issues have prevented a successful adoption of PRT [3]. From 2000, several smaller companies began to develop PRT systems using off-the-shelf components and implemented smaller networks for niche markets [4,5,6]. However, none of the developed systems reached time headways below three seconds. Many projects try to reach higher capacities by increasing the vehicle size to up to 20 passengers [3,7]. These systems, also known as Group Rapid Transit (GRT), are not as attractive for the user as private transport means, but with their on-demand service, are more convenient than conventional public transport.
1.2. State of the Art
Numerous studies have been conducted to estimate the demand for PRT systems, the flows generated on the network links, the number of vehicles required, and the service characteristics it offers; see [8] for small-scale networks and [9,10] for large-scale, city-wide networks. There have also been studies to optimize network layouts [11] or station throughput [12].
To date, there is no large, real-world PRT network in operation, which means that demand and supply models cannot be properly calibrated and validated with observed data. PRT networks are complex systems, and there are several issues that have been raised in different studies. A paper by Gustafsson et al. [13] models a PRT network based on Vectus PRT technology, taking into account a wide range of details, including estimates of the limits of computational power and computational speed needed for the real PRT system, and other details often overlooked in previous studies. Another study by Etgar et al. [14] investigates the application of PRT in inner-city environments through microsimulation and points out common flaws found in a number of PRT-related studies and simulations. Arslan et al. [15] highlight the capacity limits of different station configurations, which can represent bottlenecks of the overall PRT network.
Despite many difficulties and uncertainties cited above, many economic feasibility studies have been published, Table 1 summarizes some key characteristics of the most comprehensive studies.

Table 1.
Synthesis table of the main system characteristics from PRT feasibility studies found in literature. = estimated from vehicle parameters; 1 = Density for the general London area, but the PRT system is used in airport; 2 = uncertain estimate).
From a methodological point of view, the cost studies in Table 1 follow these generic steps: (1). ridership estimation, (2). microsimulation to verify trip times, flows, and required number of vehicles, and (3). finally, the cost/benefit analysis. Ridership estimation followed different procedures depending on the data available in the different case studies. In the case of Fornebu, Oslo, [16] the peak demand was assumed equal to an estimated value of potential passengers at the most critical station in Lysaker, but the author has not provided any model or whether population density played a role. In the study of Tyne and Wear [19], the authors state that since the PRT mode would represent an enhancement to the current rail system, it should be included in the same demand share as the rail mode. The mode share for rail+PRT was obtained from a 2005 study (4 years earlier). Masdar City’s case [23] was studied by both macro- and microsimulations based on Origin/Destination matrix obtained from land use data, commuter mobility estimations, and projected population density. This matrix was then manipulated during the microsimulation phase of the study to account for a range of possible asymmetries in the real transport demand. The Rimini study in Italy [24] faced the problem of dealing with a PRT system designed for non-systematic demand of targeted user groups like tourists, business travelers, and congress visitors. For this case, traditional demand models are hard to calibrate and transfer. This is why the authors leveraged data about maximum attractive facilities’ capacity (hotel beds, conference rooms size, parking spaces, beach umbrellas, etc.). They found an upper bound to demand to validate system functioning during peak demand, while they estimated an average value of demand for the economical analysis. P.H. Bly et al. [21] reviewed three case studies: Heathrow’s airport, London (UK), Cardiff (UK), and Corby (UK). In the case of Heathrow, the demand estimation followed the same principle seen in Rimini; as the target demand are users of the parking lots connected to the airport’s facilities, the demand can be estimated from records of airport passenger data. The demand for the cases of Cardiff and Corby was studied with conventional logit models based on stated preference surveys, and population data. The population densities have been added for contextualization purposes. Note that the PRT projects in Heathrow and Rimini are special purpose customer services for the exhibition center and the airport, respectively.
In the present context, peak-hour network saturation is an endogenous parameter to the cost analysis, and is defined as the ratio between the number of vehicles that actually run on the network during peak hour and , the number of vehicles that can fit in the network—this is when the entire network is filled with available vehicles and all vehicles run at the minimum distance headway . Therefore, the network saturation can be expressed as
where is the guideway length, is the line velocity, and is the minimum time headway in seconds. The network saturation has been an intermediate result in the cost analyses by Edward Anderson in [25].
The PRT studies in Table 1 provide all parameters to determine S; see the last column of the table. Note that the peak-hour network saturation, as defined in Equation (1), has been determined for the present paper but not by any of the original publications. The saturation S from these studies ranges from values of 0.5 to extremely high values close to unity. There may be various reasons for such high saturation values, or likewise a high number of vehicles in use: (1) with asynchronous vehicle following models at low speeds, the time headway can actually be lower than the one at line-speed; (2) congestion does occur locally in microsimulations, leading to an accumulation of vehicles with almost zero spacing; (3) there is a large number of vehicles waiting in stations.
1.3. Motivation and Objectives
PRT or GRT cost studies are difficult and subject to considerable uncertainties as there is no real system to validate demand and supply models. Most of these uncertainties in demand and supply models can be concentrated in a single parameter, the peak-hour network saturation S. This important and useful observation has not been reported in the previous literature. With this parameter, together with other more certain system and cost parameters, a complete profitability and sensitivity analysis can be performed.
The first objective of the paper is to develop an easy-to-evaluate framework which allows us to determine the range of S for which the PRT/GRT system is likely to become profitable. This method can be used in the sensibility analysis after a study based on demand models and microsimulations.
The second objective is to propose an alternative way to determine S and verify profitability: Instead of determining S through resource-intensive modeling, there may be an alternative way to perform a cost analysis, and this is by looking at the maximum possible network saturation , which a certain network and station configuration would allow. It is easier to estimate without the need for a full-blown demand model with microsimulations. This approach could greatly support the evaluation of potential PRT schemes and accelerate decision making.
Finally, the third objective is to apply the profitability analysis to different PRT/GRT configurations and determine the range of S for which they are potentially profitable.
The concept of network saturation, maximum network saturation, and the framework for analyzing profitability are explained in Section 2. In Section 3, the framework developed is applied to different PRT system configurations and the results are critically discussed in Section 4. Conclusions are drawn and future research directions are given in Section 5.
2. Methods
This section introduces the concept behind the network saturation, explains how to determine or estimate it, as shown in Section 2.1, and how the network saturation can be used as an exogenous variable to determine the profit per vehicle trip; see Section 2.2.
2.1. Determination of Network Saturation and Maximum Network Saturation
The network saturation S, as defined in Equation (2), can be determined for any PRT study as long as the required parameters are known; see Table 1 for examples. However, obtaining the network saturation from demand models and microsimulations is prone to many uncertainties, as explained in Section 1.2. The results in Section 3 show that if S is close to unity, then the PRT/GRT service is typically profitable, whereas if S is close to zero, the PRT/GRT service almost never profitable.
An alternative would be to consider the maximum network saturation that can be achieved with a particular PRT/GRT network. The maximum network saturation is the network saturation at which demand cannot increase further without the risk of traffic breakdown, because the line capacity has been exceeded at one or more network links.
There are game-theoretical arguments to foster the hypothesis that the actual peak demand of an urban PRT network is limited by the maximum network saturation : PRT may attract a large share of urban trips from current public and individual transport users [2]—a demand that would always exceed the actual network capacity of initial PRT networks; however, if the PRT network could not absorb more demand without risking congestion, then passenger queues would build up at stations, and waiting times would increase. This would lead to an equilibrium where the queues will grow to a length such that the overall travel time of PRT trips equals the ones of other mode alternatives. At this point, the PRT network cannot absorb more demand and is therefore operating at a limit, which is equal to the maximum network saturation . The maximum network saturation could be estimated in several ways:
- If a peak hour station-to-station demand matrix and the PRT network were available, then could be approximated by iteratively assigning the demand to the network, while increasing the demand level: (Step 1). Increase the demand by scaling up the demand matrix by a small factor, for example, 1.05. (Step 2). Assign the demand with the assignment method described in [26]. (Step 3). Verify if any of the link flows reached line-capacity limit; if not, go to (Step 1); if yes, calculate , where the minimum number of required vehicles can be determined from the link flows, link speeds and link travel times [26], e.g, the number of vehicles on link a equals , where is the flow, is the speed, and is the length of link a.
- Even if no station-to-station demand matrix is available, it is possible to estimate with simple heuristics: for example, if the length of trunk lines and the length of feeder lines were known, then the maximum network saturation could be estimated by ; this estimate simply assumes that the trunk lines operate at 90% and feeder lines at 10% capacity during peak hours.
The first method would not require a microsimulation and the second method would not even require a demand analysis or detailed network. The second method could be used to quickly discard economically unfeasible network configurations (e.g., networks with ).
2.2. Profit per Trip Analysis
In this section the profit per trip is derived, based on a known peak-hour network saturation S. Note that S can be determined with any of the methods mentioned in the previous subsection. The total annual profit is the annual number of passenger trips multiplied by profit per trip, where , the difference between the revenue per trip and the costs for one trip . Profit occurs if or .
The following is an attempt to estimate with some simplifying assumptions, such that the sensibility of to the most significant (or uncertain) parameters becomes clear and apparent. Profit estimation starts with the estimation of trips per year, based on the already introduced network saturation S. Assuming the PRT network and logistics guarantee that vehicles do not create congestion ( implies that all link flows remain below capacity limit and therefore no congestion occurs) and run at a constant line-speed , then the network saturation S, as defined in Equation (1), can also be expressed as
where the maximum flow or the capacity Q equals the inverse time headway .
Assuming S is known for a peak hour scenario, then we could determine the required number of vehicles in circulation by
which is also the minimum number of vehicles to be purchased for the specific PRT service. With an average trip length , the number of occupied vehicle trips during one peak hour can be determined by , where is the share of occupied vehicles and is the ratio between the average commercial speed of the vehicle and the line speed . The theoretical range of is between 0.5 (completely asymmetric demand) and one (completely balanced demand). The commercial speed can be considerably lower than as it includes breaking/accelerating maneuvers before/after stations and dwell times inside stations. Note that there is always a share of empty vehicles in circulation, as the demand patterns (e.g., OD matrices) are typically asymmetric. Furthermore, demand fluctuations can cause a further increase in empty vehicle movements; for example vehicles are forced to depart empty from the station if there is no free berth for incoming vehicle and, at the same time, no user ready to depart. Assuming further that is the ratio of peak hour passenger trips and daily trips and is the number of effective days per year, then the number of passenger trips per year equals
where , , and are site specific.
The annual capital costs of the system per meter is given by the annualized capital costs of the guideway, stations, and the vehicles divided by the guideway length , hence , where , , and are the annual capital costs of guideway, one station, and one vehicle, respectively, and is the number of stations. The annualized capital cost components are obtained by their absolute capital costs (guideway meter , station and vehicle ) multiplied with the standard cost depreciation function , using the interest rate r and respective amortization in years. Thus, , , and . If is the average distance between the stations then . Substituting with Equation (3), becomes
Also, the operating and maintenance costs () have these generic components: cost per guideway meter per year , the cost per station , and the fix-cost per vehicle . The O&M costs per vehicle meter can be estimated using these cost components:
where is the vehicle maintenance cost, is the battery maintenance, is the specific energy consumption per weight and per meter, is the total mass of the vehicle, and is the specific electrical energy cost.
The fixed annual costs per meter guideway can be written as and by making the previous substitutions for and the fixed annual costs become
The variable cost for one driven vehicle meter is , which means the average vehicle cost per vehicle trip is .
The cost of one trip is the sum of the total annualized capital costs and the fixed and variable cost, divided by the number of trips per year; thus,
The revenue per trip is in general the ticket price p times the average number of passengers paying per vehicle . In case of simulating fees charged per vehicle trip and not per passenger, no matter how many passengers board the vehicle, then should be set to one. Revenues from advertising and other sources of income such as freight transport during night hours are neglected for simplicity. However, such additional income could substantially increase profitability.
Finally, replacing with Equation (4) the profit per vehicle trip can be expressed as
Replacing for clarifies the correlation between and :
The parameter combines some “inefficiency aspects” of PRT as the numerator increases when the demand is more imbalanced between peak and off-peak hours. The denominators , , and represent the “efficiencies” of the system in terms of the number of days of activity, the time losses of operations and maneuvers, and the share of occupied vehicles running. Note that in this form, the profit per trip is independent of the guideway length . This makes Equation (8) a universal means to check feasibility and optimize the system at an early stage of a PRT project, before delving into time-consuming demand models and microsimulations. In addition, note that functions and increase linearly with the product of capacity and network saturation .
3. Results
In this section, the previously developed cost framework is applied to various configurations of PRT and GRT systems, for which the profitability and sensibility to infrastructure costs are investigated.
Table 2 shows the parameters assumed for the basic PRT configuration. Note that these parameters do not represent a concrete PRT system, but are rather realistic averaged values from the studies shown in Table 1 as well as other literature.

Table 2.
System parameters of basic PRT system.
The parameters of the demand profile are estimates from [29] and from [30]. In contrast, Götzler et al. [11] present demand profiles for a PRT application in Bad Hersfeld that are more skewed than those used in this study. In this analysis, more general demand patterns representative of urban daily profiles were preferred. However, within this framework, skewed demand patterns are undesirable. The system is designed to meet a specific peak-hour demand, so very low demand during off-peak hours significantly reduces overall profitability. A measure of caution is recommended in establishing a realistic daily demand pattern for the specific case study. In Table 3, the basic cost elements are summarized. Infrastructure and station costs have been taken from [31]; O&M costs estimated from the Cardiff studies [21,32] would suggest an overall EUR 200 per vehicle each year, but a more refined operating and maintenance cost can be written considering general maintenance costs, battery exchange costs (if assuming batteries are needed in the vehicle), average energy consumption per passenger, and cost of electricity for commercial users. Basic vehicle maintenance costs are estimated at EUR/km EUR/m, and battery exchange costs are estimated at EUR/km = 775 EUR/m from [33]. It should be noted that maintenance costs are derived from electric bus values; therefore, values might be inflated with respect to a smaller PRT vehicle. On the other hand, PRT vehicles might have fewer and more costly spare parts or maintenance operations due to their small-scale production, at least initially. Electric bus values were taken to maintain a margin of confidence above maintenance costs. The specific energy consumption is taken at kWh/pax-km from [34] for a vehicle of 600 kg and 1 passenger. Assuming that a passenger may be 75 kg in mass, then this value would be associated with a gross vehicle mass of 675 kg. With these data, it is possible to estimate from [34] that the specific energy consumption is kWh/(km kg) = kWh/(m kg). Energy cost for commercial users is at EUR/kWh from Eurostat 2024 data [35]. With these parameters, the O&M can be obtained from Equation (6).

Table 3.
Cost components.
The capital costs of the vehicle are difficult to estimate as they heavily depend on the quantity produced. For the present study, the PRT vehicle costs as much as a premium electric vehicle, which is in line with the implicit assumptions about vehicle cost made in [32]. In any case, the main goal is to show some systematic relations and sensitivities between parameters and profitability.
3.1. PRT with Single Vehicles
The first configuration is the simplest case, where single PRT vehicles circulate with a distancing policy, imposing a minimum safe distancing. Assuming a maximum failure deceleration of the lead vehicle, a minimum emergency deceleration, and a fixed system delay time of the following vehicle, then the flow Q that can be achieved at line speed equals
in vehicles per hour per direction. The system parameters and costs used for the evaluation are taken from Table 2 and Table 3 .
In a first analysis, a fixed ticket price is assumed and the profitability is determined as a function of network saturation S and trip length . The results in Figure 1 show that the profitable region (in blue) depends heavily on both parameters.
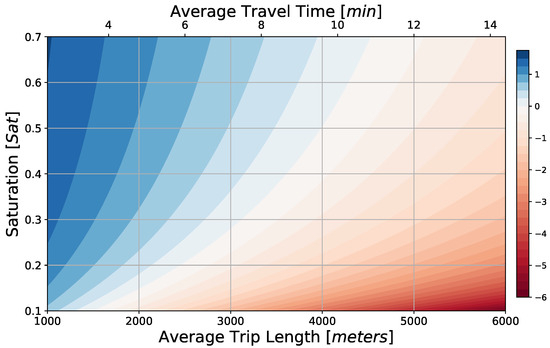
Figure 1.
Profit per vehicle trip (color scale in EUR) as function of network saturation S and average trip length , assuming a fixed ticket fare of EUR.
As in any system configuration, the PRT system is more profitable if it operates closer to the network capacity, resulting in a network saturation S close to one. An increased trip length , or likewise an increased trip time, renders the system less profitable, as vehicles are occupied for a longer period of time and the user pays a flat rate for the entire trip. This dependency on the trip length can be fully compensated with a ticket fare proportional to the trip length, as shown in Figure 2, where the ticket price of km EUR is comparable to the fixed price for trips of approximately 3 km. The interesting result of this figure is that with the proposed pricing policy, the network saturation S only needs to be greater than to ensure the profitability of the system.
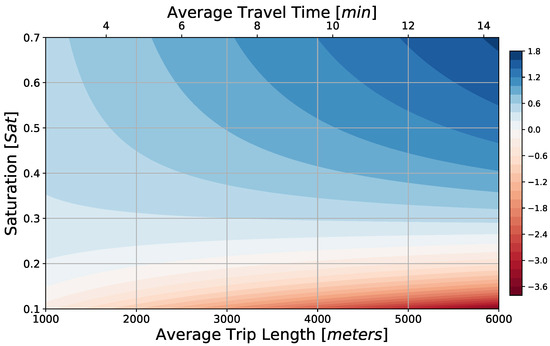
Figure 2.
Profit per vehicle trip (color scale in EUR) as function of network saturation S and average trip length using a proportional ticket fare km EUR.
In an attempt to quantify the sensitivity to infrastructure costs, the profits per trip have been determined for the case where guideway costs and station costs tripled and ticket-price p simultaneously increased approximately by 60%, as shown in Figure 3. The result shows that profits were to be made for the entire range of trip lengths and saturation above , while the increase in ticket prices appears modest in face of the strong increase in infrastructure costs.
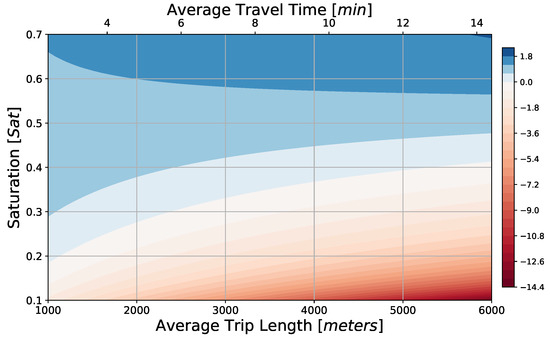
Figure 3.
Profit per vehicle trip (color scale in EUR) as function of network saturation S, with tripled infrastructure costs and average trip length using a proportional ticket fare km EUR.
Another parameter of great interest in PRT studies is the share of vehicles running empty on average at any given time of service. This value is heavily influenced by demand patterns and empty vehicle management and relocation. Strongly asymmetrical demand, where there are significant imbalances between arrivals and departures at specific stations, may negatively impact the share of occupied vehicles running. At the same time, empty vehicle management strategies such as those studied in [11] (random ideling, go to depot, go to station, etc.) can impact the average number of vehicles running empty. For this reason, it is interesting to perform a sensitivity analysis based on this parameter. In particular, Figure 4 and Figure 5 show the profitability of each vehicle trip for ranges of share of empty vehicles ranging from 0.1 (optimal case) to 0.7 (extreme inefficiency case). The former has a low ticket price assuming normal infrastructure costs, the latter tripled infrastructure costs, and an increased ticket price (approximately an increase of ). The results show that the trend of the iso-profitable lines is more than linear with the increase in the share of empty vehicles. In the first case, even with low saturation , profitability can be achieved when the share of empty vehicles remains . With increased infrastructural costs, it is important that either the share of empty vehicles remains below , or that saturation is fairly high to ensure that the system can be profitable even if the system cannot efficiently handle empty vehicles under the pressure of realistic demand patterns.
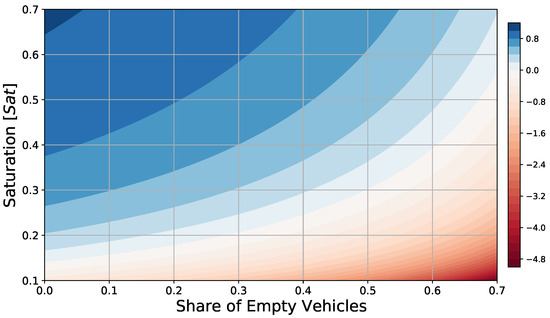
Figure 4.
Profit per vehicle trip (color scale in EUR) as function of network saturation S, and average share of empty vehicles using a proportional ticket fare km EUR = 1.50 EUR.
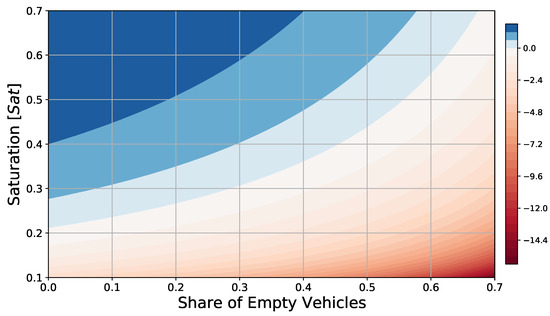
Figure 5.
Profit per vehicle trip (color scale in EUR) as function of network saturation S, with tripled infrastructure costs and average share of empty vehicles using a proportional ticket fare km EUR = 2.48 EUR.
Finally, it is interesting to move the focus from per-trip cash flow to an analysis of discounted cash flow as a function of both network saturation and the project discount rate. The net present value (NPV) has been calculated for a system represented by the parameters in Table 2 and Table 3. Figure 6 presents the results for discount rates ranging from 6% to 14%. Similar conclusions can be drawn as above: the system remains clearly profitable for saturation levels , even for high discount rates, which are appropriate for emerging or unproven technologies. This sensitivity analysis demonstrates the flexibility of the framework, showing that it can be easily adapted for various types of profitability studies.
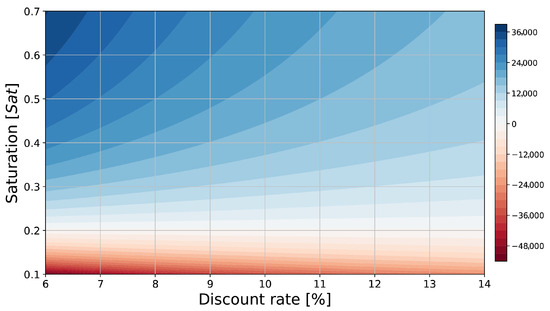
Figure 6.
Lifelong discounted cash flow as net present value (color scale in EUR) as function of network saturation S and project discount rate using a proportional ticket fare km EUR = 1.50 EUR.
3.2. PRT with Platooned Vehicle
An important performance measure of a PRT system is its capacity, or minimum headway at which vehicles run at line speed . On the one hand, higher capacities allow more trips during peak hours, which increases revenue. On the other hand, more vehicles per kilometer means more investments. Platooning vehicles with identical origin and destination is one way of decreasing the average headway, and therefore increasing the capacity. While maintaining the same safe distancing policy as with single vehicles, the maximum flow for an average platoon length of n vehicles is determined by
The vehicle flows over the line speed for platoons of vehicles are shown in Figure 7.
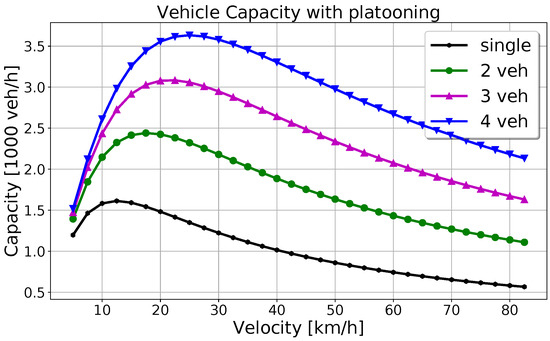
Figure 7.
Vehicle flow in a thousand vehicle per hour per direction over line speed for different platoon lengths n, including single vehicle.
Platooning is capable of substantially increasing carrying capacity (it doubled for vehicle platoons), which leads to an increase in profitability with respect to the single vehicle configuration, as shown in Figure 8—always with the assumption that an increase in capacity will be followed by an increase in trips, or S remains constant.
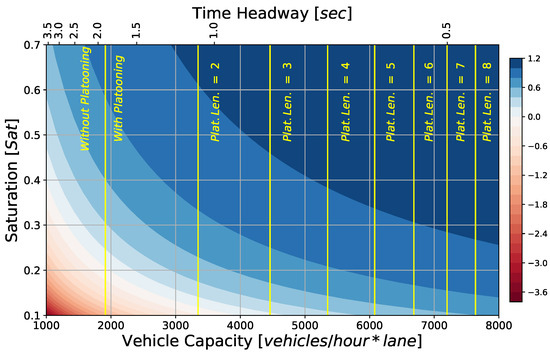
Figure 8.
Profit per vehicle trip with 3-vehicle platoons (color scale in EUR) as function of network saturation S and capacity (lower scale) or time headway (upper scale), assuming a proportional ticket price of km EUR, with km.
Comparing the profits in Figure 8 with those in Figure 9, one can recon that a PRT system with an average platoon length of would be profitable for with the same ticket price even if the infrastructure costs tripled.
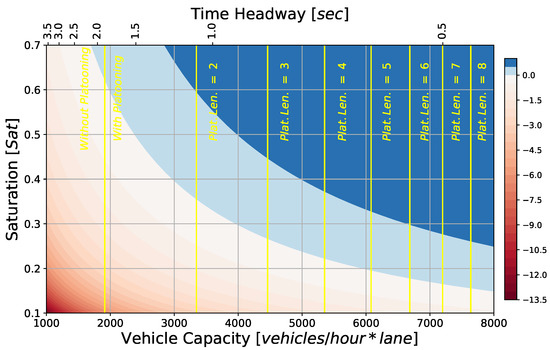
Figure 9.
Profit per vehicle trip with 3-vehicle platoons (color scale in EUR) as function of network saturation S and capacity (lower scale) or time headway (upper scale) with tripled infrastructure costs and assuming a proportional ticket price of km EUR, with km.
3.3. PRT/GRT Mixed Service
This section explores a strategy to increase the number of passengers on board the vehicle. Generally PRT is “Personal”, meaning that the vehicle is occupied by multiple people only by choice. In contrast, with Group Rapid Transit (GRT), passengers heading to the same destination board the same vehicles until they are full. Clearly, this strategy increases occupation with respect to the PRT service. Conventional GRT services feature larger vehicles, which has led to higher costs and underperformance in past projects; see Morgantown GRT as an example [36].
The analysis below uses the GRT service with both small PRT-size vehicles and larger vehicles as used with the conventional GRT system. In both cases, the logic is the following: Run the system as a normal PRT service during off-peak hours and only in rush hours as a GRT service. Clearly, vehicles remain the same throughout the entire day; the only difference between PRT and GRT service is that with GRT service, the vehicle is allowed to fill with passengers heading for the same destination and the individual cannot decide with whom to travel.
This strategy is studied in two different scenarios: one is a system that uses small vehicles with 6 seats, and the other uses larger vehicles with 12 places (standing and sitting), as typically used for GRT systems. Then, the profitability will be compared for the two scenarios to conclude which vehicle size is financially more robust for the proposed service strategy. The PRT service is used during off-peak and the GRT service only during peak hours, so this mixed service is simulated using the same framework as explained earlier, dividing the service time between peak and off-peak hours. During off-peak hours, the occupancy for both small and large vehicles is assumed at 1.3 passengers per vehicle or on average a 22% occupation [32]. During rush hour, occupancy is assumed 65%, which is equivalent to an average of 3.9 passenger per small vehicles and 7.8 passengers per larger vehicle. As more users board, vehicle boarding times increase along with overall handling times of vehicles. This is why the commercial speed is assumed to decrease from 25 km/h to an estimate of 20 km/h during peak hours.
The larger vehicles have substantial differences with respect to the smaller ones. First of all, they allow standing passengers, which means the maximum emergency deceleration is reduced to 3.0 m/s2. All increases in vehicle geometry, weight, and infrastructural costs were assumed proportional to the increase in available places. The cost of the larger vehicle versus the smaller PRT vehicle is difficult to estimate, mainly because vehicle costs depend heavily on the number of vehicles produced. As fewer larger vehicles are required, the batch size will also be smaller compared to small PRT vehicles. This is why vehicle costs have been estimated based on an existing GRT vehicle, the Easymile vehicle [37].
Assuming that the surface of the vehicle increases linearly with the number of places available, the vehicle length approximately increases as the square root of the number of places. Guideway costs are, in the first approximation, increasing proportionally to the increase in the amount of material needed to build guideways. The static load acting on the overhead guideway infrastructure is assumed to increase linearly with the number of available places. From structural analysis, the cross-sectional area of the guideway increases with the cubic root of the static load if only the bending moment is considered to cause failures [25]. For this reason, guideway costs have been increased with the cubic root of the passenger increase. Station cost increases were treated in the same way as guideway costs increased. The parameter scaling of the GRT system is summarized in Table 4.

Table 4.
Scaling of system parameters from small 6-passenger vehicles to large 12-passenger vehicles, referred to the doubling in maximum passengers . Note that the vehicle costs have been taken from an offer from Easymile, a 12-passenger vehicle [37].
The profits per trip using six-passenger vehicles are always positive, except for extremely low values of and a very high average trip length km; see Figure 10. If infrastructural costs were to be tripled, then profitability could be easily reached with and a moderate increase in the ticket fare of roughly 60%; see Figure 11.
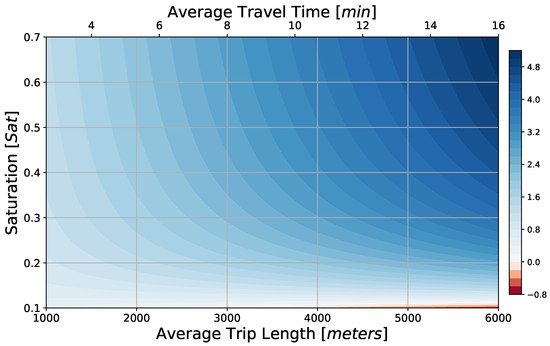
Figure 10.
Profit per vehicle trip (color scale in EUR) for a PRT/GRT mixed service as function of network saturation S, and average trip length or average travel time, assuming smaller 6-passenger vehicles and a proportional ticket fare of km EUR.
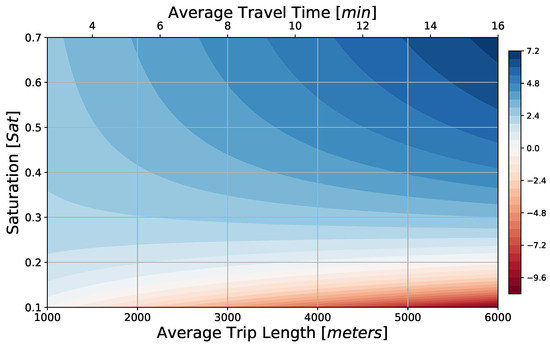
Figure 11.
Profit per vehicle trip (color scale in EUR) for a PRT/GRT mixed service with tripled infrastructure costs as function of network saturation S, and average trip length or average travel time, assuming smaller 6-passenger vehicles and a proportional ticket fare: assuming a proportional ticket price of km EUR.
Profits per trip using 12-passenger vehicles with the above parameter scaling are positive for all trip lengths for ; see Figure 12. If infrastructural costs were to be tripled, then profitability could be reached with with a moderate increase in ticket fare of roughly 60%; see Figure 13.
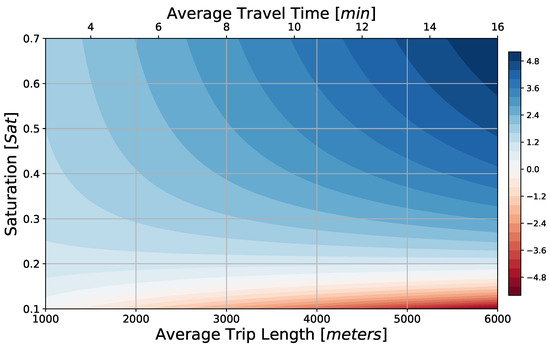
Figure 12.
Profit per vehicle trip (color scale in EUR) for a PRT/GRT mixed service as function of network saturation S, and average trip length or average travel time, assuming larger, 12-passenger vehicles and a proportional ticket fare: assuming a proportional ticket price of km EUR.
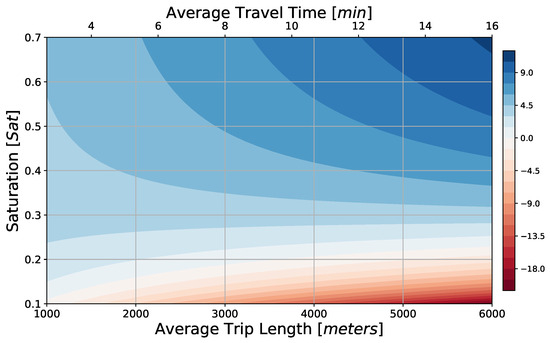
Figure 13.
Profit per vehicle trip (color scale in EUR) for a PRT/GRT mixed service with tripled infrastructure costs as function of network saturation S, and average trip length or average travel time, assuming larger 12-passenger vehicles and a proportional ticket fare: assuming a proportional ticket price of km EUR.
4. Discussion
The results show that with an appropriate distance-proportional ticket pricing, all investigated PRT configurations can be profitable for a wide range of travel distances and levels of the peak-hour saturation; most systems are profitable for . Concerning the single-vehicle PRT configuration, it must be clear that it does not have a particularly high capacity, as shown in Figure 7 (black line), which means that even a city-wide PRT network would not be able to absorb a significant share of motorized urban traffic. A PRT network with a tide grid (with a spacing less than 1000 m) could alleviate this shortcoming. However, in many cities, a dense guideway-grid may not be feasible due to constraints from existing buildings and infrastructure, or due to excessive visual impact.
The generic technological solution to increase capacity is to design PRT systems with shorter headways, which means that the brake actuation time or the maximum failure deceleration could be reduced; see Equation (9). Although safe headway reduction is a viable option and subject to ongoing R&D, two alternative PRT configurations have been investigated which also lead to an increase in capacity: platooning and Group Rapid Transit (GRT).
Platooning with vehicle strings of up to four vehicles does significantly increase the profitability. Longer platoons would further increase capacity, but profitability would increase only marginally. The platoon capability has been shown to add financial robustness to the PRT, as profits become less sensitive to an increase in infrastructure costs. However, the formation of long vehicle strings, which run from origin to destination, is a logistical challenge: the sorting and shunting of vehicles in stations so as to form the vehicle strings may be impractical or require too much space. Alternatively, dynamic platoon formation during the trip would again be a technological challenge. The formation of platoons at stations is currently tested by the Autotrèn project in Mexico, Guadalajara [38].
The second option to increase capacity would be the PRT/GRT mixed service, meaning that during peak hours, different groups with a common destination board on the same vehicle. This strategy can be realized with either standard small vehicles commonly used in normal PRT applications or with larger vehicles usually deployed for GRT-only services. Although dropping the “Personal” feature during peak hours may reduce perceived service quality, it yields much higher system capacity and greater profitability. Similar profitability per vehicle trip is obtained both in the case of small and large vehicles, but large vehicles provide additional system capacity. However, potential losses in the case of low saturation can be more dramatic than in the case of smaller vehicles. The capacity boost may be relevant for urban mobility planners. In fact, many previous PRT projects have increased their vehicle size during the development process to increase capacity, also because it is simpler to increase vehicle size than to reduce headway [3]. The question of course is whether the GRT service is able to attract enough passengers, as it is no longer as personal as a private car. With an area-covering GRT network, the available capacity may actually be higher than the demand and the network saturation S during peak hours will drop for this reason. If S dropped below , then the mixed GRT/PRT service with large vehicles with 12 places would operate at a loss. However, to incentivize the use of GRT, the operator could offer the GRT service at lower ticket prices and simultaneously charge more for individual transport. With regard to larger vehicles, the cost scaling of the infrastructure is a rough approximation based only on the quantity of the material. The real increase in infrastructure cost for larger vehicles may be different. Furthermore, the more bulky guideways, which are necessary for larger vehicles, may also be subject to visual intrusion, but this is not a subject of the present study.
5. Conclusions
Personal Rapid Transit (PRT) is an automated public transport system that is convenient to use and that potentially attracts many car and public transport users. The present article has proposed a simple, transparent and yet relevant cost model for PRT applications based on the peak-hour network saturation, which is the main innovation. This network saturation has been identified as an important and useful proxy of how close the system is operating to its capacity limit. The network saturation can be determined from a previously conducted planning process, including demand analysis, network design, and microsimulation. Alternatively, the maximum network saturation can be used instead, which can be estimated even without a full-blown demand and supply analysis. For this reason, the developed method is a quick and low-cost tool to preliminary evaluate PRT/GRT options in transportation planning and decision-making processes.
The modeling framework has been mathematically derived and the usefulness of the network saturation-based approach has been demonstrated by analyzing the profitability of three different PRT ”configurations”: the single PRT, platooned PRT, and mixed GRT/PRT service. One of the main benefits of the present analysis is the possibility of investigating the change of different parameters on profitability. The results have shown that PRT services can be profitable for a realistic range of network saturation, in particular if network saturations exceed .
Platooning capability can boost line capacity, profitability, and robustness to increases in infrastructure costs. In fact, it remains profitable even after tripling the initial infrastructure costs. Also the use of group service (GRT) during peak hours has been shown to increase capacity and profit, assuming there is sufficient demand. However, GRT with larger vehicles does risk a lower network saturation, where it is no longer profitable. On the other hand, lower ticket prices may increase both demand and profit.
One of the main limitations of the present framework is, obviously, that demand estimation and vehicle flows are not explicitly determined, but condensed into a single parameter, the network saturation S. However, since there are considerable errors attached to demand estimates and network flow estimates, it is in any case reasonable to consider a range of S. Some cost/revenue factors have not been taken into account, even though they may become significant, especially for smaller networks, such as taxation effects, planning costs, contingency costs, freight transport, redundancy of vehicles, and staff. However, such elements are seen to be very dependent on local conditions and could be included by adapting the fixed- or variable-cost components of the present framework.
In this sense, the present framework is able to provide necessary, but not sufficient, conditions for a profitable project in terms of a net present value. However, additional analysis could be performed on the basis of the present framework.
For further studies, it would be interesting to investigate a relationship between an urban area, its population density, and the network saturation for a certain line capacity. With such a method, one could easily determine for which urban area a PRT system would be an economically feasible option. Moreover, it could be interesting to expand the present framework to include population density, e.g., to address the following question: for which population densities could a PRT service potentially operate at profit? On the other hand, queue models at stations or synergetic effects with other modes, such as park and ride facilities or inter-modal hubs, would be subject to detailed planning studies that precede the present cost analysis.
Author Contributions
Conceptualization, J.S.; Data curation, G.B.; Formal analysis, J.S. and G.B.; Funding acquisition, F.R.; Methodology, J.S. and G.B.; Project administration, F.R.; Software, J.S. and G.B.; Supervision, J.S.; Validation, G.B.; Visualization, G.B.; Writing—original draft, J.S.; Writing—review and editing, G.B. and F.R. All authors have read and agreed to the published version of the manuscript.
Funding
This project is co-founded by the ECO SISTER and the HPC project, both financed by the Italian PNRR programme.
Institutional Review Board Statement
Not applicable.
Informed Consent Statement
Not applicable.
Data Availability Statement
All data used is reported in the article itself.
Conflicts of Interest
The authors declare no conflicts of interest.
References
- Irving, J. Fundamentals of Personal Rapid Transit; Lexington Books: Lexington, MA, USA, 1978. [Google Scholar]
- Schweizer, J.; Meggs, J. Chapter PRT Mode Share Estimations Using a Direct Demand Stated Preference Method. In Urban Public Transportation Systems, Proceedings of the 3rd International Conference on Urban Public Transportation Systems 2013, Paris, France, 17–20 November 2013; ASCE Press: Restin, VA, USA, 2013; pp. 1–9. [Google Scholar]
- Burke, C.G. Innovation and Public Policy; The Case of Personal Rapid Transit; Lexington Books, D. C. Heath and Company: Lexington, MA, USA, 1979. [Google Scholar]
- Lowson, M. Small-Scale Transit; ITS: Intelligent Transport Systems International: Atlanta, GA, USA, 1997. [Google Scholar]
- Lowson, M.V. Personal Public Transport. In Proceedings of the Institution of Civil Engineers; Transport 1999; Emerald Publishing Limited: Leeds, UK, 2000; Volume 135, pp. 139–151. [Google Scholar] [CrossRef]
- Branco, L.; Rosenfeld, E.; Neto, D.; Furman, B. Case Study of a Solar Power Installation on an Automated Transit Network in San Jose. In Proceedings of the American Solar Energy Society National Solar Conference 2016, San Francisco, CA, USA, 10–14 July 2016; pp. 1–10. [Google Scholar] [CrossRef]
- Latour, B. Aramis or the Love of Technology; Harward University Press: Cambridge, MA, USA, 1996. [Google Scholar]
- Schweizer, J.; Danesi, A.; Rupi, F.; Traversi, E. Comparison of static vehicle flow assignment methods and microsimulations for a personal rapid transit network. J. Adv. Transp. 2012, 46, 340–350. [Google Scholar] [CrossRef]
- Andréasson, I. Vehicle Distribution in Large Personal Rapid Transit Systems; Technical Report 1451; Transportation Research Board: Washington, DC, USA, 1994. [Google Scholar]
- Kornhauser, A. PRT Statewide Application: The Conceptual Design of a Transit System Capable of Serving Essentially All Daily Trips; Technical Report; Princeton University: Princeton, NJ, USA, 2013. [Google Scholar] [CrossRef]
- Gotzler, F.; Neumann, F.; Adenaw, L. Assessment of Personal Rapid Transit System Configurations Regarding Efficiency and Service Quality. Future Transp. 2022, 2, 734–752. [Google Scholar] [CrossRef]
- Schweizer, J.; Mantecchini, L.; Greenwood, J. Chapter Analytical capacity limits of Personal Rapid Transit stations. In Automated People Movers and Transit Systems 2011 “From People Movers to Fully Automated Urban Mass Transit"; American Society of Civil Engineers (ASCE): Reston, VA, USA, 2011; pp. 326–338. [Google Scholar] [CrossRef]
- Gustafsson, J.; Kang, J.G.; Englund, J.; Grimtell, P. Design Considerations for Capacity in PRT Networks. In Automated People Movers and Transit Systems 2011; ASCE Press: Reston, VA, USA, 2011; pp. 385–394. [Google Scholar] [CrossRef]
- Etgar, R.; Avineri, E.; Cohen, Y. Personal rapid transit capacity evaluation for inner-city: A detailed micro-simulation study. Int. J. Transp. Sci. Technol. 2023, 12, 119–135. [Google Scholar] [CrossRef]
- Arslan, O.; Reichert, M.; Sellaouti, A.; Hoffmann, S. Investigation of Personal Rapid Transit Station Capacities using Microscopic Traffic Simulation. In Proceedings of the 7th International Conference on Models and Technologies for Intelligent Transportation Systems (MT-ITS), Online, 16–17 June 2021; pp. 1–6. [Google Scholar] [CrossRef]
- Andréasson, I. Ride-sharing on PRT. In Automated People Movers 2005: Moving to Mainstream; American Society of Civil Engineers: Reston, VA, USA, 2005; pp. 1–7. [Google Scholar] [CrossRef]
- Plaace. Available online: https://platform.plaace.co/ (accessed on 15 July 2025).
- Andréasson, I. Reallocation of empty personal rapid transit vehicles en route. Transp. Res. Rec. 2003, 1838, 36–41. [Google Scholar] [CrossRef]
- Muir, H.; Jeffery, D.; May, A.D.; Tripodi, A.; Shepherd, S.; Vaa, T. Assessing the Contribution and the Feasibility of a Citywide Personal Rapid Transit System. Transp. Res. Rec. 2009, 2110, 163–170. [Google Scholar] [CrossRef]
- Brinkhoff, T. City Population. Available online: https://www.citypopulation.de/ (accessed on 15 July 2025).
- Bly, P.H.; Teychenne, P. Three Financial and Socio-Economic Assessments of a Personal Rapid Transit System. In Automated People Movers 2005: Moving to Mainstream; American Society of Civil Engineers: Reston, VA, USA, 2005; pp. 1–16. [Google Scholar] [CrossRef]
- Trust for London. Available online: https://trustforlondon.org.uk/data/geography-population/ (accessed on 15 July 2025).
- Castangia, M.; Guala, L. Modeling and simulation of a PRT network. In Proceedings of the 17th International Conference on Urban Transport and the Environment, Pisa, Italy, 6–8 June 2011; pp. 459–472. [Google Scholar]
- Schweizer, J.; Danesi, A.; Lupi, M.; Rupi, F. Chapter Personal Rapid Transit: A Self Financing Solution for Tourist Transport at the City of Rimini. In Transport Management and Land-Use Effects in Presence of Unusual Demand; FrancoAngeli—ITA: Milano, Italy, 2011; pp. 63–79. [Google Scholar]
- Anderson, J. Transit System Theory; Lexington Books: Lexington, MA, USA, 1985. [Google Scholar]
- Schweizer, J.; Parriani, T.; Traversi, E.; Rupi, F. Optimum Vehicle Flows in a Fully Automated Vehicle Network. In Proceedings of the International Conference on Vehicle Technology and Intelligent Transport Systems: VEHITS, Rome, Italy, 23–24 April 2016; Volume 1. Available online: http://www.scitepress.org/DigitalLibrary/PublicationsDetail.aspx?ID=W0rOwi3OENM= (accessed on 25 June 2025).
- Andreasson, I.J. Extending PRT capabilities. In Automated People Movers 2009: Connecting People, Connecting Places, Connecting Modes; American Society of Civil Engineers: Reston, VA, USA, 2009; pp. 343–349. [Google Scholar]
- American Society of Civil Engineers. Automated People Mover Standards; American Society of Civil Engineers: Reston, VA, USA, 2013. [Google Scholar] [CrossRef]
- Crawford, F.; Watling, D.; Connors, R. A statistical method for estimating predictable differences between daily traffic flow profiles. Transp. Res. Part B Methodol. 2017, 95, 196–213. [Google Scholar] [CrossRef]
- Vitanova, L.L.; Shirinyan, E.; Trendafilova, T.; Petrova-Antonova, D. Understanding Sofia’s travel dynamics: Study of private traffic patterns and urban mobility. Transp. Res. Interdiscip. Perspect. 2025, 30, 101352. [Google Scholar] [CrossRef]
- Kerr, A.D.; James, P.A.; Arup, O.N. APM 05 Special Sessions on PRT Infrastructure Cost Comparisons for PRT and APM. In Proceedings of the APM Conference, Xiamen, China, 25–28 October 2011. [Google Scholar]
- Tegnér, G.; Andréasson, I. PRT—A High-Quality, Cost-Efficient and Sustainable Public Transport System for Kungens Kurva. In Proceedings of the Automated People Movers 2005: Moving to Mainstream, Orlando, FL, USA, 1–4 May 2005; Volume 174, pp. 1–12. [Google Scholar] [CrossRef]
- Basma, H.; Haddad, M.; Mansour, C.; Nemer, M.; Stabat, P. Evaluation of the techno-economic performance of battery electric buses: Case study of a bus line in paris. Res. Transp. Econ. 2022, 95, 101207. [Google Scholar] [CrossRef]
- Mittelman, G.; Kariv, Y.; Cohen, Y.; Avineri, E. Techno-economic analysis of energy supply to personal rapid transit (PRT) systems. Appl. Energy 2022, 306, 118006. [Google Scholar] [CrossRef]
- Eurostat. Available online: https://ec.europa.eu/eurostat/statistics-explained (accessed on 15 July 2025).
- Anderson, J.E. The Urban Mass Transportation Administration’s Program of Development and Deployment of Automated Guideway Transit; University of Washington: Seattle, WA, USA, 1979. [Google Scholar]
- Contra Costa Transportation Authority & EasyMile Autonomous Vehicle Pilot. 2017. Available online: https://learn.sharedusemobilitycenter.org/overview/contra-costa-transportation-authority-easymile-autonomous-vehicle-pilot (accessed on 20 December 2024).
- Autotrén. 2022. Available online: https://autotren.lat/en/attributes/ (accessed on 20 December 2024).
Disclaimer/Publisher’s Note: The statements, opinions and data contained in all publications are solely those of the individual author(s) and contributor(s) and not of MDPI and/or the editor(s). MDPI and/or the editor(s) disclaim responsibility for any injury to people or property resulting from any ideas, methods, instructions or products referred to in the content. |
© 2025 by the authors. Licensee MDPI, Basel, Switzerland. This article is an open access article distributed under the terms and conditions of the Creative Commons Attribution (CC BY) license (https://creativecommons.org/licenses/by/4.0/).