Abstract
This study proposes a methodology that integrates real-time data and predictive modeling to identify the passenger flow and occupancy levels within a multimodal transport hub. This tool enables the implementation of control and planning strategies to ensure a high Level of Service (LOS). The tool is based on a Long Short-Term Memory (LSTM) model and heterogeneous data sources, including an Automatic Passenger Counting (APC) system, which are utilized to estimate the real-time passenger flow and area occupancy. The Module A of the Moncloa Interchange in Madrid is the case study, and the results reveal that transport-dedicated zones have higher occupancy levels. Methodologically, time series data were standardized to a uniform frequency to ensure consistency, and the training set consisted of seven months of available data. The model performs better in high-occupancy zones. Despite maintaining a LOS A, some periods experience temporary congestion. These findings indicate that the variations in occupancy levels influence the service quality and highlight the essential role of dynamic interchange management. Tailored operational strategies can optimize the service levels and improve the user experience by anticipating congestion through predictive modeling. This can help enhance public transport’s attractiveness, minimize the perceived transfer penalties, make transfers more efficient, and reinforce transport hubs’ role in sustainable urban mobility.
1. Introduction
Transport interchanges operate as a highly dynamic and complex system, serving dual functionality as both transport nodes and places with a significant socio-economic impact on their urban surroundings. The key role of these stations within the mobility network is evidenced by the high proportion of multimodal journeys recorded in various cities worldwide. Many examples can be mentioned: In the United Kingdom, 50% of public transport trips (30% in London) involve more than one mode of transport, implying at least one transfer [1]. Similarly, in the Paris metropolitan region, this figure reaches 36.9% of the total trips [2]. In Nanjing, one of the most populous megacities in East China, nearly 60% of public transport journeys in the city require an intermodal transfer [3]. In Barcelona, the intermodality index for the overall system is close to 20% [4]. Specifically in subway systems, the prevalence of transfers further highlights the significance of interchange stations: in Seoul, 59% of passengers make transfers between subway lines [5]; in Singapore, up to 40% of users in the selected case study station perform two or more transfer operations [6]; and in Madrid, where 55% of trips are made using public transport, the city’s main metro interchange stations register the highest level of usage [7].
Therefore, in the interchange’s operations, along with high demand, multiple interdependent factors are involved, impacting and shaping its complexity. These include the transfers among different means of transport, the diversity of user profiles, and the wide range of services available. As a result, an interchange is not merely a node within the broader transport system but can be considered a network itself, where continuous interactions occur between three fundamental components: infrastructure, processes (encompassing operations, logistics, and services), and people.
Moreover, effective management must account for these continuous interactions, ensuring that the station design, facility layout, and operational strategies are adaptable to the fluctuating passenger demand, ultimately enhancing the system performance and user experience. However, despite the crucial role of passengers, management remains primarily focused on transport services and other operational aspects, while the research on passenger-centric management is limited [8,9,10,11,12]. It is necessary to have a holistic vision that links user behavior and preferences with the spatial dynamics of the terminal to optimize operational efficiency and service quality. In this context, understanding the occupancy level, defined as the average number of passengers occupying the station spaces at a specific time relative to its total capacity, is a quantitative key metric for assessing the crowding in the terminal. It helps determine the effectiveness of the management of spaces and provides valuable insights on how it influences the overall quality of service delivery, which is necessary to define improvements for enhancing the service perception rating [13,14].
As cities grow and public transportation demand becomes increasingly critical to reducing car dependency, achieving efficient and competitive public transportation becomes crucial [15]. Effective planning is essential for improving both the daily management and long-term system performance. Generally, it ensures services during periods of normal and peak demand, such as special events or service disruptions. At the same time, at the station level, it helps address the growing challenges such as the pedestrian flow, bottlenecks, and crowding [16]. The system aims to provide passengers with the most efficient, safe, and seamless travel experience, including smooth transfers and movement within stations [15,17]. The applications related to forecasting for early proactive interventions help enhance the transfer time, perceived service quality, and retail revenues [16]. The ongoing digitalization of public transport has demonstrated the value of Intelligent Transport Systems (ITSs) in meeting these requirements through technological solutions [18]. Moreover, Automated Passenger Counting (APC) tools enable the collection of accurate real-time data [18], but forecasting remains a key area that requires further development.
This paper analyzes the passenger flow and stance within a multimodal transport hub. It aims to develop a method for forecasting the user occupancy in critical station areas using a prediction model based on the Long-Short Term Memory (LSTM) procedure, which has been widely used in the transportation field, demonstrating strong performance and providing valuable insights [19]. This approach enhances the data-driven strategies for improving the service quality through dynamic management. By examining movement patterns, occupancy trends, and forecast results, this research aims to provide valuable insights that support a more user-centric understanding of passengers’ movements and station dynamics.
The remainder of this paper is structured as follows. Section 2 reviews the relevant literature for the main concepts and definitions implied in the study. Section 3 describes the proposed methodology, which is divided into phases and developed from the general approach to the application in the case study. The Moncloa Interchange is used as a case study; it is one of the key multimodal stations in Madrid’s transport network that serves more than 200,000 passengers daily. Section 4 presents the results related to the real-time APC installed system and occupancy forecasting using the LSTM prediction model. Section 5 discusses the achievements and limitations of the study, analyzes the results and proposes dynamic strategic management for multimodal transport stations. Finally, Section 6 concludes the paper by discussing its contributions to the existing literature and proposes possible future research lines.
2. Literature Review
This section presents the state of the art on the key topics addressed in this study: a comprehensive definition of multimodal transport stations based on their core dimensions and transfer operation goals, the evaluation of their performance by the level of service metric, and the application of predictive algorithms for forecasting future operational conditions.
2.1. Multimodal Public Transport and Transfers
Transport interchanges are key nodes within the transport network, playing a crucial role in facilitating intermodal connectivity [17]. The primary objective of these nodes is to minimize the penalties associated with the transfers between different transport modes, by providing suitable infrastructure that optimizes both the comfort during the transfer process and in the waiting areas [20,21]. This is achieved through the improvement of the transfer and waiting areas, as well as offering a range of complementary services that enhance the user experience and make the system more attractive overall. Given that in large European cities such as Madrid, a high percentage of trips involve at least one transfer, reducing the penalties associated with this process has a significant impact on the perception of the public transport system, contributing to making it more competitive compared to the use of private vehicles [22].
To manage a high volume of users, interchange infrastructures are typically large in scale and represent landmarks of the transport network. As primary points of interaction between users and the system, these significantly influence the perception of the public transport network [23]. Due to this critical role in passenger movement and their spatial potential, it is essential that interchanges incorporate a high degree of functional diversity to ensure their seamless integration into the surrounding urban environment while enhancing the overall user experience [23,24]. This integration enhances both the transport perception and urban value, yielding positive economic, social, and environmental benefits [25].
The literature reveals that metro systems have a significant impact on the urban scale, as they connect large numbers of people to major urban areas of the cities [26]. This underscores the importance and advantages of establishing a wide set of functionalities in these terminals that allow their positioning as multifunctional hubs, beyond just their core role in mobility. Terminals that more than offer extra facilities to passengers actively contribute to the socio-economic development of the surrounding areas and benefit nearby communities, are successful examples of how the effective management of transport infrastructure can drive broader economic growth [26,27].
Consequently, transport interchanges serve a dual function: on the one hand, they act as transport nodes, facilitating the movement and transfers between different modes; on the other hand, they also serve as places to wait and engage in social and economic activities related to daily mobility [25,28]. This duality adds complexity to their management, as it involves the passenger flow, presence, and stay. Total integration encompasses both the physical and operational aspects, requiring the coordination of three interdependent elements that interact dynamically: infrastructure, processes, and passengers [29].
- The infrastructure dictates the available space for the general operation of the interchange. The main characteristic is the fixed typology and dimensions. Its structural layout and design determine the arrangement of facility distribution (such as commercial areas, amenities, and waiting zones) and shape the passenger flow, congestion, and dwell time (through paths to entrances, exits, transfers, and stay areas) [9].
- The processes are defined based on the specific functionality of each space within the interchange, the delivery of services, and overall management. Certain elements remain constant, such as design constraints, capacity, platforms, fixed equipment, facilities, and space distribution and allocation. In contrast, the operational aspects are dynamic, influenced by the disruptions in the surrounding urban environment, unforeseen events, incidents, emergencies, fluctuations in transportation services, and variations in passenger demand.
- Passengers are the primary actors who interact with and experience the previously mentioned aspects. The experience varies for everyone, as Bertolini exposed that different people perform different actions [28,30]. Individuals engage in different actions based on their specific needs and circumstances. Factors such as the physical condition, trip purpose, age, walking speed, personal preferences, and route choices—combined with the station design and operational plan, including service schedules, frequencies, and waiting times—shape the individual behavior within the interchange [9].
- The interdependent relationship among these three aspects also highlights that effective management must be integrated with the station’s structure and facility layout, which serve as the foundation for path organization, operation, and physically delimited passenger behavior [9,31].
The integrated management of transport interchanges, aligned with service quality, is essential in enhancing the user experience [32]. The literature includes different studies and guidelines from industry authorities that have identified the key principles and characteristics to consider in this management, many of which share common elements. Following the conceptual dimensions proposed by Bertolini, transport node, place, and both [28], Table 1 presents a summary of these principles, categorized by dimension, as outlined by various authors in the literature.

Table 1.
Literature review of the main characteristics of an interchange as transport node and place.
As observed, in addition to aspects specifically related to transportation, most are linked to the stay within the interchange and the conditions that define it. This stay can be brief, limited only to the time required for transfers, or more prolonged due to waiting times or the performance of other activities.
Most authors agree that the aspects related to the conception of the interchange as a place and a node-place are determined by factors such as accessibility, design, spatial layout, and capacity, as well as safety, security, and the availability of services, which depend on the organization of facilities. In this regard, infrastructure and the associated occupancy play a crucial role in evaluating these factors, and their effective management can significantly enhance the service quality.
Given these conditions, the main areas of transport interchanges, beyond the access and exit points, include the connecting corridors, halls, and platforms for each mode of transportation. These spaces are essential for facilitating transfers and regulating passenger flows, and crucial for analyzing passenger characteristics [9]. However, the research findings indicate that the waiting areas and spaces for services and amenities, such as commercial areas, have a significant impact on the perception of the interchange’s level of service [30,36,37,38,39,40,41,42].
2.2. Level of Service (LOS) Evaluation
From a user-centric perspective, service evaluation has identified that the most influential factor for users is related to the transfer conditions, particularly regarding the physical structures involved and the distances that must be covered to switch between the modes [36,39]. These findings are further supported by other studies highlighting the importance of the interchange layout and internal connections [43], as well as the walking environment [44], the transfer environment, and important facilities, which collectively have a significant impact on users’ perception and rating of the service quality [37].
LOS, defined in the Highway Capacity Manual, is a common language for transportation engineers and stakeholders used to classify the operating conditions of transportation infrastructures in an understandable way [45]. Focused on the transfer actions, the LOS in multimodal stations has been evaluated from different perspectives [46]. While one approach focuses on process and management by applying Data Envelopment Analysis (DEA) techniques for understanding the reasons for inefficiencies and solving them by conducting appropriate decision-making foundations [5,47], another places the emphasis on the infrastructure design, centralizing on the performance of transfer spaces and proposing targeted optimization strategies [48].
The optimization of operations, focused on managing transportation services in terms of schedules, frequencies, and coordination, among other aspects, has traditionally been a central axis for improving the evaluation of the service quality in transport interchanges. However, the management of passengers, their behaviors, and their interaction with the infrastructure has lagged behind, despite their fundamental role in the process. Indicators such as capacity usage and passenger density are among the most relevant for assessing the performance of the facility configuration scheme, highlighting the need to prioritize user management [9,49].
Additionally, as identified by Zhang et al. [9], aligning general decision-making methods with the practical management of stations—considering the physical infrastructure, available services, demand, and passenger needs—remains an existing research gap, mainly in multimodal hubs as highlighted by Sipetas et al. [17]. Addressing these issues effectively as the first step requires accurately identifying the passenger presence within the interchange, when combined with passenger flow analysis, which enables the detection of behavioral patterns, critical event causes, passenger bottlenecks, and space usage demand tendencies. All of these are essential for implementing data-driven strategies to optimize the operational management.
2.3. Prediction Modeling
The availability of real-time data is valuable and relevant, but it does not guarantee fully efficient management. The evolution of ITS technologies, with the integration of artificial intelligence and machine learning algorithms, enables the development of more sophisticated tools that address the new challenges in data processing and exploitation, adding high value to the mobility services for both passengers and operators [18,50].
In this context, the next logical step is exploring the ability to foresee the future evolution of these data by predicting the passenger occupancy or presence levels within the stations. Anticipating trends and the possible scenarios would enable the optimization of planning, improve the responses to events or variations, reduce the randomness of operations, prevent unforeseen situations, and generally control the factors that may negatively affect the service quality. Thus, occupancy prediction becomes an essential component of the real-time management in transport systems, as highlighted by Vieira et al. [10,51].
Short- and long-term predictions in transportation have been identified essentially as a time series forecasting problem, where exogenous explanatory variables (such as weather, land use, transport validation, and traffic) are used to conduct more comprehensive analyses. These variables allow for the use of a larger set of correlated data with varying degrees of influence [52], and enables the adoption of a generalized approach to obtain specific and detailed results, focused on a particular variable.
Several prediction model approaches have demonstrated their ability to capture both the stationarity and periodicity of real-time data in transportation [53]. However, several studies have highlighted that LSTM [54] Recurrent Neural Networks (RNNs) are a promising approach. This has been extensively applied in the transportation domain, particularly for predicting passenger demand, traffic flow, and occupancy levels [19].
LSTM networks have shown strong capabilities in time series forecasting and have outperformed the other methods [52,55], demonstrating high performance in capturing short- and long-range dependencies due to their ability to overcome the vanishing gradient problem, which commonly arises during the training of traditional RNNs, especially when long time lags are involved in the prediction horizon [56].
In this context, it has been identified that passenger occupancy forecasting plays a pivotal role in traveler satisfaction, especially in transport vehicles, which has been extensively researched [18,57,58,59]. However, there has been less research regarding stations. Studies have focused on stations with a single predominant mode of transport, such as smaller-scale bus stops [51], and larger ones for metro or railway stations [52]. Despite these studies representing a good starting point, they can be expanded or adapted to multimodal stations, and the specific research on this topic is limited. In addition, most existing research has utilized smart card datasets, which only provide information on entry/exit validation at stations and limit the study by not considering the passenger flow within the area. This results in a lack of predictive analysis in multimodal stations.
To address these gaps, this paper focuses on analyzing the passenger flow within a transport interchange, collecting specific data through an internal APC system to forecast the passenger occupancy. The outputs enable the evaluation of the service level and the proposal of a data-driven tool to manage station spaces dynamically, optimizing the station operations and enhancing the user experience.
3. Materials and Methods
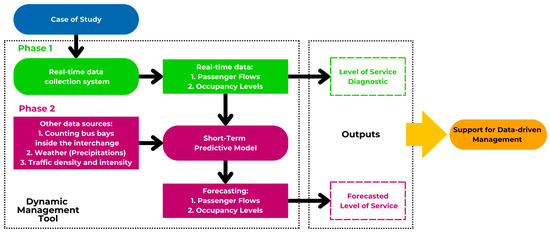
This methodology outlines the steps to predict the occupancy in a transport interchange based on the passenger flow within its spaces, allowing for the evaluation of service levels and the definition of strategies to enhance its management. Figure 1 illustrates the complete workflow to be implemented.
Figure 1.
Flowchart of the methodology for implementing a dynamic interchange management tool.
The process begins with the selection of a case study that exemplifies the importance of integrated management in the complex nodes within the transport system. Next, for phase 1, a distributed APC system [13] is implemented to capture the real-time passenger flow data, which are then used to calculate the occupancy levels and provide a continuous assessment of the service conditions within the facility. These data are subsequently utilized in phase 2 to train a neural network-based prediction model designed to anticipate over a short-term horizon of up to 24 h occupancy trends in relation to the corresponding service levels. The objective of this approach is to leverage the predictive model as a dynamic management tool, enabling the anticipation of service quality variations and the proactive planning of operational and contingency strategies. This ensures an optimized interchange performance with a standardized and efficient level of service.
This section begins by describing the selected case study and the characteristics that make it suitable for this analysis. Next, the functioning of the implemented APC system for data capture is detailed, highlighting its advantages compared to other approaches. Then follows the occupancy calculation, and, finally, the definition of the predictive model, along with its configuration, the variables used, and the validation process.
3.1. Case Study for Validation
The selection of the case study is aligned with the research objective, focusing on the passenger presence and flows within transport stations with complex management requirements. The selected station or transport node should integrate diverse functionalities, including the services and facilities for trip transfers and the use of space. The Moncloa interchange fulfills the requirements of a good case study. It is a key transportation hub in Madrid, situated on the city’s border, connecting the capital with the metropolitan northwest corridor, one of the most densely populated and affluent areas in the Madrid Metropolitan Area. Its transport node connects metropolitan buses with urban bus lines and the metro. Its facilities serve 55 metropolitan bus lines, serving nearly 100,000 passengers daily, with over 350 bus services operating during the morning peak hours. Additionally, 19 urban bus lines connect to the interchange, transporting approximately 120,000 daily passengers. The Moncloa Metro station is the busiest in the network, with over 115,000 daily validations, served by two lines: Line 3, which connects to the city center and Line 6 (the Circular) that distributes passengers among all the city’s periphery and links to seven other metropolitan bus interchanges [60,61,62].
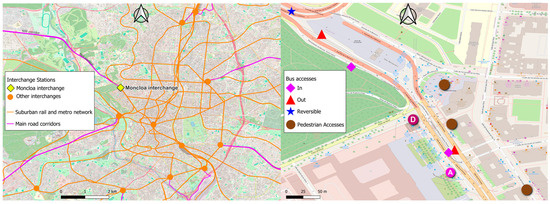
Studying the level of service at the Moncloa Interchange is crucial due to its distinctive characteristics, including its large scale, strategic location, functional diversity, and high passenger volume. These factors make it an ideal case study for analyzing the occupancy and passenger dynamics across areas with different functionalities, both for transfers and additional on-site activities. A map of the area where the terminal is located including the transportation network (suburban rail and metro), main corridors, and other interchanges, along with the access points for buses and pedestrians is presented in Figure 2 which shows the position of the case study within Madrid’s transportation network and the station’s entrances and exists for travelers and buses. The bus access point marked with a blue star directly connects with the reversible lane on the NW trunk motorway.
Figure 2.
(Left): Madrid’s suburban transport network and NW corridor linked to Moncloa Interchange. (Right): Bus and pedestrian access/egress points to Moncloa station. Pedestrian access A and D correspond to the sensors A and D in Figure 3.
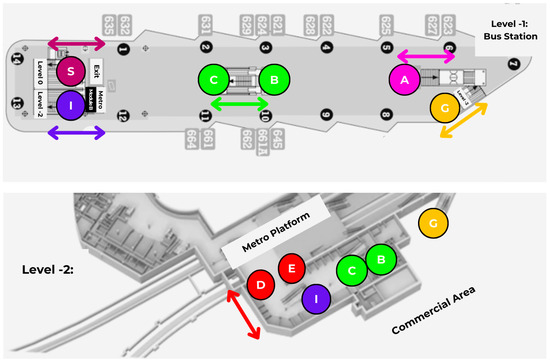
The interchange consists of two buildings: the older one (Module A) and a newer one (Module B), which was constructed as part of an expansion to accommodate the increasing demand. Both buildings are connected by transfer corridors facilitating the movement between them and various transportation platforms. Module A concentrates most of the passenger entries and exits at the interchange, as well as the busiest connection points in terms of passenger flow [60]. It has two overlapping levels interconnected by both escalators and conventional stairs. The -1 level spans an area of 2200 m2, featuring 14 bus bays and a central waiting area. The -2 level is smaller -approximately 1100 m2- and corresponds to the commercial area and connection to the metro station. This commercial area comprises approximately 30 establishments offering food, retail, and other services [60]. It is a good example of a multifunction station, aligned with the study objective of analyzing the interchange not only as a transportation hub but also as an integrated urban space. Figure 3 illustrates the distribution of spaces with the access points differentiated by color and a letter label used as the nomenclature to differentiate the six points. The A and D points indicate the pedestrian access to the terminal, and the others correspond to corridors, pedestrian ramps, and staircases, and the green and blue ones represent the connections between the two levels.
Figure 3.
Spatial distribution and access points in Module A at Moncloa Interchange.
3.2. Phase 1: Real-Time Data Collection System
This study proposes calculating the occupancy based on the adaptation of the basic principle of quantity conservation, as outlined in Equation (1) [63]. This indicates that the occupancy level in a location at a given time is the result of the initial presence at the start of that period, plus the difference between incoming and outgoing flows during the interval. To accurately calculate the passenger numbers of entries and exits, it is necessary to monitor all the access points in a reliable manner to minimize errors.
The occupancy in transport systems has often been estimated using AFC, which has proven effective for buses and small stations where all the users validate their payment at their entry. However, counting in larger or multimodal stations, such as interchanges, poses a challenge due to their open-access nature and the absence of the AFC devices at access points. While combining the validation data from different transport modes could help, it does not fully address the problem, as these facilities also attract not only passengers using transport services but also visitors looking for the station’s commercial and service areas [4], making it difficult to estimate the duration of their stay accurately and, consequently, their impact on the overall occupancy. A real-time data collection APC system was designed and installed at the Moncloa Transport Interchange to solve this challenge. This video-based system combines detection and trajectory methods for real-time passenger counting [15]. Detection techniques identify targets using region classifiers and feature subtraction, while trajectory methods track the movement of objects [15,64]. It uses cameras with edge-computing AI models based on convolutional neural networks to detect and count people in specified directions through image classification and segmentation [65]. The system tracks bidirectional flows: “entry” and “exit”.
Its implementation enables the precise spatial delimitation of each zone at the interchange and provides a detailed understanding of the passenger movement directions and presence levels over time. Moreover, this approach is cost-effective and has easy functionality, since complex data preprocessing is not required to obtain the final measures.
For its deployment at the Moncloa Interchange, the five connection and access points to Module A identified in Figure 1 were evaluated based on their spatial dimensions and physical conditions to determine the number, placement, and angles of sensors required to ensure full coverage of the area. As a result, real-time passenger flow data were collected at all the access and egress points within the study area and validated by comparing them with manual counts taken during the peak hours on several days, including weekdays and weekends, ensuring a margin of error below 2%. The space occupancy is determined by applying Equation (1). These data were then used to train the predictive model.
3.3. Phase 2: Short-Term Prediction Model
The real-time data collected in phase 1 were used to create a historical dataset of these variables and then to train a predictive model. This model aimed to predict the short-term occupancy levels, thereby providing a supportive tool for the dynamic management of the interchange. An LSTM model based on time series was selected for this task. The datasets used were time series, meaning that the data were organized according to their chronological sequence, which is suitable for trend analysis and predicting future behaviors, as it captures the temporal dependence between observations. As illustrated in Figure 1, in Phase 2, different data sources were integrated into the process.
The following subsections provide detailed definitions for the application and validation of the model.
3.3.1. Data Used for Modeling
According to the definition and requirements set to optimize the performance of the selected model, along with the historical data on passenger flow and occupancy captured by the APC system, it is useful to incorporate other data sources that influence or are related to these target variables.
LSTM models learn from temporal sequences and improve their performance when the input variables are relevant and have a significant relationship or influence on the target variable. This makes the models more effective to capture the patterns and temporal relationships between the data [18,54].
The passenger flows and occupancies within transport stations are influenced by factors that interact in complex ways, such as weather conditions, traffic congestion in the surrounding areas, boarding and alighting processes across different transport modes operating at the station [52], and how each day can be classified according to the activities in the city that influence the passenger demand variations at the station. Our model captures these complex underlying dynamics by integrating an additional set of heterogeneous data sources.
Traffic conditions were collected from twenty sensors measuring the traffic intensity and density at critical ramps connecting to other roads along the A6 Corridor, which is the main transportation artery near the interchange. The interchange station operator provided boarding and alighting counts from the 14 bus bays at Module A. Precipitation data were obtained from the city’s meteorological stations. Calendar information from public institutions was coded into Boolean identifier variables to represent the state of certain activities in the city: official holidays, academic calendars for university, high school, and secondary education.
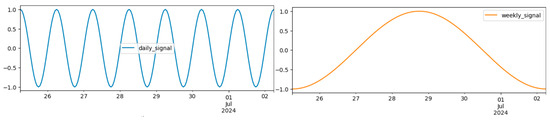
According to the interchange managers and our preliminary observation of the data, the activity in the interchange has variations, following daily, weekly, and yearly patterns. For the LSTM model to successfully identify and reflect these temporal dependencies of the data, sinusoidal features of periods of one day and one week were included in Figure 4. A yearly feature was not considered since the span of the data was shorter than one year.
Figure 4.
(Left): Sample from the daily sinusoidal feature. (Right): Sample from the weekly sinusoidal feature.
Table 2 summarizes the variables and their corresponding data sources.
Table 2.
Summary of the prediction model variables and their sources of information.
3.3.2. Data Preprocessing
The effective integration of heterogeneous data sources requires conducting a preliminary analysis of their characteristics, such as the format and sampling frequency, and standardizing the common parameters according to the requirements set for modeling with an LSTM neural network. This implies that all the time series must have the same sampling frequency and must not contain any missing values.
Moreover, the LSTM model is multivariate and simultaneously predicts all the target variables’ activity. To enhance the performance, applying standardization or normalization to the aggregated dataset is considered a good practice. Such standardization may not significantly improve the model’s ability to forecast low values, but it is necessary when predicting high values to achieve better results [56].
For the study, since the sampling rate must be adjusted to the resolution of the time series with the lowest granularity, it was set to 1 h, which was the least disaggregated level found among the datasets, and the others were adjusted accordingly. This definition means that each day in the final time series used in the model is represented by 24 records, which implies that the prediction will be made by day, covering the next 24 periods.
A two-step gap-filling method was applied to the missing data, using average values:
- First step: each missing value in a variable was filled with the average of all its values that shared the same temporal characteristics: “instant within the day”, “instant within the week”, “term time (primary)”, “term time (secondary)”, “term time (higher)”, “weekend or holiday”, and “working day next to a holiday”.
- Second step: any remaining gaps were filled based on a more simplified set of variables: “instant within the day”, “instant within the week”, and “holiday or not”.
Additionally, to avoid the accumulation of errors, the occupancy was set to zero daily when the interchange was closed (from 00:00 to 06:00). With these adjustments, the final time series ensured the data consistency and eliminated discrepancies that could affect the models’ performance and accuracy.
3.4. Model Training and Validation
The occupancy prediction in Module A of the Moncloa Transport Interchange uses the time series obtained after data preprocessing as the input. The model uses data from the past groups of 24 records to predict the values for the next 24 h. This approach corresponds to short-term prediction due to the limited forecast horizon.
For the case study, the analysis period spanned from 25 June 2024 to 10 February 2025. To ensure similar conditions to the real interchange operation, the available data were divided into three consecutive sets, following the principle that the model can only learn from past events:
- Training set: it is used to adjust the model parameters and minimize the prediction error, corresponding to the period spanning from 25 June 2024 to 3 December 2024 (approximately 5.5 months).
- Validation set: it is used to fine-tune the hyperparameters during training, allowing the model to generalize to new data, covering the period from 4 December 2024 to 18 January 2025 (approximately 1.5 months).
- Testing set: it is used for an unbiased evaluation of the model, running from 19 January 2025 to 10 February 2025 (approximately 1 month).
After the execution phase, with the results obtained for each set, the Mean Squared Error (MSE, Equation (2)) was used as a loss function [66] to evaluate the model’s performance, quantifying the error between the predicted and actual values using variance. Additionally, the accuracy of the prediction was quantified by computing the Mean Absolute Error (MAE, Equation (3)) and the Root Mean Squared Error (RMSE, Equation (4)). In these equations, represents the forecast value, and the actual value [56].
4. Results
The results are presented according to two distinct analyses as shown in Figure 1: the diagnostic of the Level of Service (LOS) based on real-time data and the assessment of the forecast values.
The above observations are based, firstly, on the evaluation of the real-time data captured by the installed APC system, as well as the calculation of occupancy based on these values. Secondly, they focus on the predictions generated by the LSTM model using the defined time series, which integrates the mentioned data, and the previously explained additional datasets. Both sets of results were analyzed under the guidelines of the LOS, both in real time and as predicted. Since all the users within transport stations are pedestrians, we applied the LOS criteria for the pedestrian facilities of the Highway Capacity Manual [45] to classify the station-level service according to the average space per person (m2/person). Using the dimensions of each area in the Moncloa Interchange, the corresponding number of people per area dimension was calculated for each level, yielding the results presented in Table 3.
Table 3.
Classification of the LOS based on the Highway Capacity Manual guideline for pedestrians and the corresponding values in person units for each area.
The average space criteria column indicates the required space per person in an area to achieve the corresponding LOS. The other two columns show the calculated number of people that can occupy an area with those specific dimensions to ensure that the corresponding LOS is maintained. In the figures below, the LOS is represented by a color overlay on the graphs, with the corresponding letter for each level displayed in the right margin.
4.1. Level of Service Diagnostic: Real-Time Observations
The real-time results provide a preliminary diagnosis of the service levels at the interchange based on the occupancy. Furthermore, these illustrate the operation of the distributed APC system via the hourly evolution of the calculated occupancy using the real-time passenger flow data captured at the access points. This occupancy analysis was plotted, describing the interchange operation and identifying recurring patterns. It is essential for detecting the potential trends that could be crucial for management, which can later be validated with the results of the predictive model.
This analysis is presented for both weekday and weekend days to compare the variations and the influence of time on the service demand trends, thereby providing a comprehensive view of the station’s operation in different contexts.
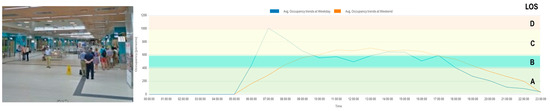
Figure 5 presents the results obtained from the data captured at Level -1 (bus station) along with a photo of the place. In line with the known demand data for the Moncloa Interchange [60], it is observed that the highest occupancy peak occurs between 07:00 and 08:00, when the most significant number of passengers use the interchange to enter or leave Madrid, mainly for commuting to work or study. It is also observed that the return trips are almost evenly distributed throughout the day, as the occupancy remains at similar levels. Only two small peaks are identified, around 14:00 and 17:00, when most users typically concentrate on their return journey. Regarding the weekend, it is noticeable that the morning peak disappears, and instead, the occupancy gradually increases, remaining constant throughout the day, indicating that the demand is more widespread over time.
Figure 5.
Average occupancy on Level -1 (bus station) on a typical weekday and weekend days.
In the figures related to the occupancy, the LOS levels are differentiated by a color hue for each range and a letter on the right side that corresponds to the labels and values in Table 3.
The LOS remains between the A and B rates most of the time for both days, as shown in Table 3, with only slight dips into level C. However, during the morning peak, the occupancy rises enough to temporarily reach service level D, where the walking speed and the ability to overtake slower pedestrians are restricted. This indicated an initial conflict situation that the interchange manager should consider addressing.
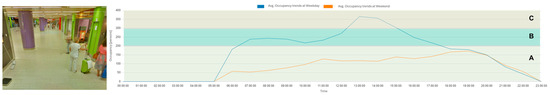
Figure 6 presents the results for Level -2 (Commercial Area) and its corresponding photo. During weekdays, the highest occupancy occurs during lunch hours, between 13:00 and 15:00, which is expected due to the services available in this area, such as cafeterias and restaurants. A slight peak is also observed in the early morning hours, coinciding with Level -1. This peak is considerably smaller, which is understandable, as users are generally in a hurry and have less time to engage in additional activities.
Figure 6.
Average occupancy on Level -2 (commercial area) on typical weekdays and weekend days.
A notable difference is observed between the values on weekdays and weekends. This indicates that the services in this area have a considerably lower demand at weekends, partly because many of the facilities are closed as fewer passengers use the interchange. In general, the number of users is significantly lower compared to the other level.
The LOS on this Level -2 predominantly remains between A and B for both days, but again, the peak demand deteriorates the situation, but less than on Level -1.
4.2. Forecasting Level of Service: Predicted Values
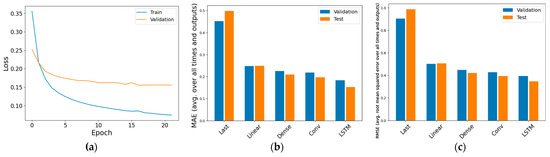
Figure 7a illustrates the evolution of the training and validation losses throughout the training of the predictive LSTM model. As observed, the final training loss is 0.07, while the validation loss is 0.16, indicating a minimal value that suggests the model effectively fits the training data. Although the validation loss is slightly higher, it remains low, implying good generalization, which is also further supported by the stabilization of both loss curves.
Figure 7.
(a) Loss curves for training and validation sets. (b) Comparison of the MAE results for different models. (c) Comparison of the RMSE results for different models.
The MAE and RMSE indices in Table 4 define the prediction accuracy of the LSTM model. Figure 7b,c compare the accuracy of the LSTM model, as measured by the MAE and the RMSE, against alternative approaches using the validation and test datasets. These figures include a Baseline Method (Last) which just repeats the last known value, a Linear Model, a Dense Neural Network, and a Convolutional Neural Network. The LSTM model achieves the lowest MAE and RMSE values in both cases and outperforms all the other methods, yielding the best performance and reinforcing the suitability of the model for this study.
Table 4.
MAE and RMSE accuracy indices for the LSTM Model.
The results obtained from the predictive model for the occupancy values are presented in the following figures. In each of them, the previous 24 h are plotted alongside the predicted 24 h, including both the predicted and actual values. This representation facilitates the analysis of the model’s performance by graphically comparing the similarity between the actual and predicted data and determining whether the model can follow the expected trend. On the other hand, the LOS analysis enables the evaluation of how well the prediction aligns with the actual levels, helping to identify any discrepancies.
In cases where the output variables present a marked periodic component, a naïve model that just shifts the input data forward in time may achieve a high prediction accuracy. Conversely, our LSTM should provide better results by capturing more complex underlying dynamics. Thus, the following figures also include a 24 h forward-shifted plot of the input variables to facilitate studying how the model outperforms the naïve approach.
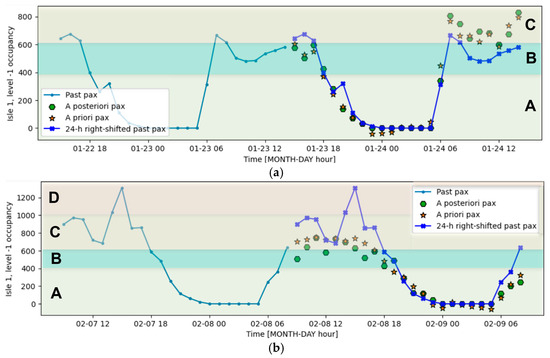
Figure 8 presents the outcomes for two different days and time ranges on Level -1. Overall, the model successfully follows the expected patterns in the data, accurately detecting peaks, troughs, and the general shape of the trends, despite a certain degree of error. Furthermore, even with this margin of error, the predicted results align with the same LOS levels as the actual data, indicating their predictive accuracy.
Figure 8.
Forecasting of average occupancy on Level -1 (bus station): (a) weekdays (Thursday to Friday), (b) weekday to weekend transition (Friday to Saturday).
The model outperforms the naïve repetition of the previous day in both examples. In Figure 8a (Thursday to Friday) the forecast occupancy has the same shape as the one from the previous day but scaled up, fully entering the service level “C” band. The LSTM model not only returns the correct shape, but it is much closer to the actual values that happened. The LSTM model’s superior behavior is more pronounced in Figure 8b, which presents the prediction of what will happen during Saturday knowing how the day starts and what happened during the previous Friday. The naïve approach would be inadequate, since the behavior during Saturdays is completely different in shape and magnitude. Conversely, the LSTM model manages a much closer and useful prediction of the occupancy during the whole day.
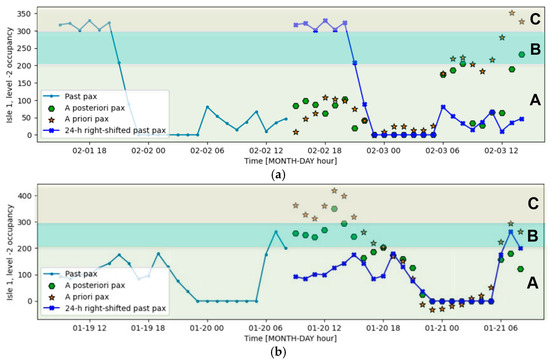
Figure 9 illustrates the forecast for two different days on Level -2. As expected, the number of users on this level is significantly lower than on Level -1, and the prediction also reflects this. The forecast consistently follows the trends of real values, but the margin of error is higher in this case. The model can detect the maximum and minimum peaks, but it tends to exaggerate the maximum values, deviating more from the actual ones. This causes a slight error when defining the LOS, although it is only observed between two consecutive levels, which does not represent a significant difference.
Figure 9.
Forecasting of average occupancy on Level -2 (commercial area): (a) during a weekend (Saturday to Sunday), (b) weekend to working day transition (Sunday to Monday).
Both examples in Figure 9 show that using the occupancies during the previous 24 h as the forecast for the next 24 ones performs worse than the LSTM. In Figure 9a, the occupancies from mid-Sunday to mid-Monday are predicted using data from mid-Saturday to mid-Sunday. The predictions of the LSTM model are significantly closer to the actual values than the naive ones. Also, the LSTM model prediction’s shape better resembles the real curve. The LSTM treats Saturdays, Sundays, and Mondays differently. However, at the end of the interval (mid-Monday), they overestimate the occupancy, forecasting a “C” level of service instead of “B”.
Figure 9b presents the transition from a Sunday to a working Monday. Again, even though the predictions of the LSTM model are not as precise as for Level -1, they are closer to the true values and follow a more similar shape than the naive model.
The forecast is more accurate for the bus station level. In general, the model manages to represent the occupancy level trends for the different areas of Module A with accuracy, predicting the expected LOS properly.
5. Discussion
The results confirm the possibility of integrating heterogeneous data sources, including real-time flows and historical passenger counting data, to predict users’ movements in a transport interchange. This integration achieved the objective of monitoring and predicting the service level in terms of passenger flow and occupancy. The strong performance of the prediction model demonstrates that the processes developed at each step of the methodology were appropriate and aligned with the research goals.
It is demonstrated that using multiple data sources has synergies despite the differences in the dataset characteristics. The data need to be homogenized using various techniques, such as resampling and interpolation, implemented during the preprocessing phase. Although these processes may result in information loss due to the variables being initially recorded at a higher granularity, the main patterns, which are the focus of this type of study, are maintained and can still be identified. This means that the most relevant trends, which have the most significant influence on the interchange’s level of service, remain unchanged. While some very specific patterns may have been smoothed or even lost due to the adjustment methods, this does not significantly affect the results or notably impact the model’s performance.
The model’s performance, validated using data from the Moncloa Interchange, demonstrates consistency between the real-time data and predicted values, indicating the model’s reliability. The predicted occupancy levels closely follow the trends observed in real-time measurements, maintaining similar patterns during the peak and off-peak hours. This alignment indicates that the model accurately captures the underlying dynamics of passenger flow and station usage, as well as the impact of external factors such as the weather and surrounding traffic conditions. The two interchange functions were analyzed (real-time and forecast), concluding that the primary function of the Moncloa Interchange is as a transport node rather than as a space where passengers stay. However, it also reveals an essential commercial function associated with shops and services during specific periods, especially on weekdays. This conclusion is based on the observation that the occupancy levels in commercial areas remain relatively low despite the high volume of passengers passing through the infrastructure. These results could differ if the model were applied to other types of interchanges, such as rail stations, where the waiting time for long-distance transport services is higher, and the function as a place could be more relevant.
On the other hand, the results validate that the selection of data for forecasting was appropriate and accurate, as the data used have a significant influence on the target variable, helping ensure that the predictions closely align with the actual values. Moreover, the adjustments and modifications made during the data preprocessing phase were crucial in increasing the efficiency of model execution, reflected in that training took less than a minute on a computer equipped with a Tesla T1 TPU. Related to the APC based on on-site observations or physical measurement, reinforce the model’s performance via its capture data method that minimizes the errors associated with interference and selection bias that are common when using signal analysis (e.g., Wi-Fi, Bluetooth) or GPS triangulation methods [16,67,68]. Other advantages include the short data processing time due to edge computing, the simplicity of system configuration and calibration, and the operational independence of the components involved.
The study has a limited scope because the test lasted only seven and a half months, from the installation of the distributed APC system to the completion of this study. This resulted in 5520 observations, sufficient for testing and validating the model for short-term predictions, yielding strong results, as demonstrated by the achieved performance and accuracy. The model has been demonstrated to be reliable in capturing part of the complex underlying dynamics that determine the passenger flow and occupancies.
The APC system may deliver systematic errors as it relies on sensors and on-premises equipment, which potentially may lead to biases in the occupancy estimation. However, these misvalues can be identified and mitigated using the preprocessing techniques implemented in phase 2. In summary, the low error margins between the predicted and actual values reinforce the model’s accuracy, confirming that the selected input variables are appropriate and contribute meaningfully to the forecasting process.
The results validate the model’s potential for applications in the transportation field, enabling it to be used as a tool for the proactive and planned management of station occupancy, thereby maintaining the service within adequate LOS ranges.
Data-Driven Tool for the Dynamic Management of Transport Interchanges
The tool enhances the comprehensive management of transport interchanges by monitoring the LOS, enabling efficient operations and improving the service quality offered in the station.
The implemented integration of the APC system and the predictive model is a powerful approach for enabling decision makers to implement data-driven strategies that address the two key pillars of immediate and long-term operation: real-time monitoring and forecasting for anticipating and mitigating potential issues. Proactive management, along with advanced planning and the definition of contingency measures, enables the identification of periods when situations that negatively impact the service may arise, allowing them to be minimized or even eliminated, thereby ensuring that the operation remains in the optimal condition.
Specific dynamic management strategies for the interchange based on the results can be implemented through actions related to five key aspects, all aimed at improving the operational efficiency of the transport hub: information management, space optimization, passenger flow control, the development and enhancement of services and amenities, and an effective emergency response [10]. In particular, the emergency response is a critical aspect due to the space limitations and high passenger volumes. In this regard, having predictive data enables the design of more effective contingency plans to ensure user safety, optimize the evacuation procedures, and improve the handling of critical situations [67].
Having real-time and predictive data would strengthen the efficiency of the traditional strategies by making them more informed and accurate, for example, optimizing the frequency adjustment of transport services for different modes during the peak and off-peak periods and adapting it to the specific daily patterns rather than relying on generalized demand trends. This would optimize resources and improve the overall cost-effectiveness of the service.
For the user management within the station, predicting the number of people based on the passenger flow enables the anticipation of potential congestion periods. This enables the prior planning of corrective measures and contingency strategies to prevent or manage these situations as efficiently as possible. In the literature, this approach is known as congestion or crowd management, which involves planning and implementing actions to ensure the orderly movement of crowds within an infrastructure [10]. In the crowd management framework, two types of strategies can be implemented. On one hand, hard management strategies refer to mandatory measures for pedestrians, like flow separation through signage, the designation of specific access and exit points with staff guiding users, or restricted access to certain areas during specific time slots. On the other hand, soft management strategies consist of recommendations that users can follow voluntarily, such as suggested optimal travel times and itineraries to avoid the peak congestion periods [11].
Among the operational strategies that could be implemented to manage the demand in real time are passenger metering (controlling passenger access to prevent overcrowding in certain areas), dock skipping (strategically skipping docks or platforms to improve the service flow), short turning (rerouting certain services earlier to optimize the capacity), and real-time stop position selection (dynamically selecting stops based on the demand) [68]. The last two involve coordination with the operators of the different transport modes.
Lastly, regarding short- and long-term occupancy predictions, the literature has shown that the availability of congestion information can influence users’ travel decisions, allowing them to better plan their daily commutes. This not only benefits passengers but can also be strategically used to optimize the system operations and distribute the demand more efficiently [50,68]. Making the predicted information available not only to operators but also, to some extent, to users, actively encourages them to explore more convenient travel alternatives. This could help reduce the excessive passenger concentration at specific points in the system and enhance the overall mobility experience.
Finally, by integrating real-time and predictive data, this tool proves effective in transforming raw information into actionable insights. It enables a more efficient, adaptable, and user-friendly transport interchange by proactively managing the occupancy and passenger flow fluctuations. This approach helps maintain an optimal level of service, ensuring smoother operations and an improved passenger experience.
6. Conclusions
The primary function of multimodal transport stations is to facilitate passenger transfers, reduce the penalties associated with them, and act as connection nodes within the system, thereby contributing to an improved perception of the service. Therefore, their role as places is also relevant, especially in their integration within the urban context. This dual function is evident at the Moncloa Interchange, where around half of the passengers passing through the bus station visit the commercial area, highlighting the importance of those areas for improving the interchange’s offered quality.
The proposed methodology develops a real-time and predictive tool that integrates data from both functional interchange dimensions and uses these data to monitor the current situations and forecast the short-term ones. This information enables the application of data-driven strategies for proactive decision making and efficient planning of the space, ensuring optimized operational management while maintaining the Level of Service at a good rate.
Specifically, regarding the technical characteristics of the prediction model used, it is relatively insensitive to fine tuning, which simplifies its application and scalability for use in other case studies with larger and more diverse data sources. Furthermore, this is supported by its negligible training and prediction times, allowing for frequent retraining with high flexibility and maintaining low hardware requirements.
Future research should focus on enhancing the capabilities and adaptability of the predictive model. The first improvement could be to expand the prediction to a longer term by incorporating a longer time span of data to reflect the long-term seasonal trends; secondly, adding to the model the Automatic Fare Collection (AFC) data at entry points will provide a more comprehensive view of the passenger demand and its relationship with the occupancy dynamics. Furthermore, incorporating external variables, such as special events, service disruptions, and fluctuations in commercial activity, will enhance the model’s ability to anticipate the passenger flow and occupancy level variations. Lastly, testing the model in various types of multimodal interchanges with different layouts, service configurations, and demand patterns would help generalize the results and facilitate their transfer to other transport nodes.
Finally, the application of this tool to optimize the dynamic management of the transport interchanges in large metropolitan areas, where nearly 80% of citizens rely on public transportation [22], would help to improve the service levels. This will provide guidelines for more comfortable space utilization and efficient transfer flows, making public transport more competitive than private transportation.
Author Contributions
Conceptualization, A.F.-L., J.B. and A.M.; methodology, A.F.-L.; software, J.B.; validation, A.F.-L. and J.B.; formal analysis, A.F.-L. and J.B.; investigation, A.F.-L.; resources, A.M.; data curation, A.F.-L. and J.B.; writing—original draft preparation, A.F.-L. and J.B.; writing—review and editing, A.F.-L., J.B. and A.M.; visualization, A.F.-L. and J.B.; supervision, A.M.; project administration, A.M. and J.B.; funding acquisition, A.M. All authors have read and agreed to the published version of the manuscript.
Funding
Project PLEC2021-007609 funded by MCIN/AEI/10.13039/501100011033 and by the European Union NextGenerationEU/PRTR.
Institutional Review Board Statement
Not applicable.
Informed Consent Statement
Not applicable.
Data Availability Statement
The data presented in this study are available on request from the corresponding author because it is sensitive to the company that manages the Moncloa Interchange station.
Acknowledgments
We warmly thank Sacyr for their essential participation during the design and execution of the sensor deployment in the use case at the Moncloa Interchange station, and for the valuable data and insights that they have provided.
Conflicts of Interest
The authors declare no conflict of interest.
Abbreviations
| APC | Automatic Passenger Counting |
| AFC | Automatic Fare Validation |
| DAE | Data Envelopment Analysis |
| ITS | Intelligent Transport System |
| LOS | Level Of Service |
| LSTM | Long-Short Term Memory |
| MSE | Mean Squared Error |
| MAE | Median Absolute Error |
| RNNs | Recurrent Neural Networks |
| RMSE | Root Mean Squared Error |
References
- UK Government Digital Service National Travel Survey 2023: Trends in Public Transport Use and Multi-Modal Public Transport Trips. Available online: https://www.gov.uk/government/statistics/national-travel-survey-2023/nts-2023-trends-in-public-transport-use-and-multi-modal-public-transport-trips (accessed on 21 April 2025).
- Yin, B.; Leurent, F. Estimation of Transfer Time from Multimodal Transit Services in the Paris Region. Future Transp. 2022, 2, 886–901. [Google Scholar] [CrossRef]
- Chen, E.; Stathopoulos, A.; Nie, Y. (Marco) Transfer Station Choice in a Multimodal Transit System: An Empirical Study. Transp. Res. Part. A Policy Pract. 2022, 165, 337–355. [Google Scholar] [CrossRef]
- Autoridad del Transporte Metropolitana Área de Barcelona (ATM Barcelona) Intermodality Index. Available online: https://www.omc.cat/en/w/intermodality-index?filterCategoryIds=undefined&operationType=AND (accessed on 23 April 2025).
- Kim, C.; Kim, S.W.; Kang, H.J.; Song, S.M. What Makes Urban Transportation Efficient? Evidence from Subway Transfer Stations in Korea. Sustainability 2017, 9, 2054. [Google Scholar] [CrossRef]
- Cheung, M.; Cheng, Y.; Fujiyama, T. Investigating Passenger Behaviour on the Metro Platform with Wi-Fi Location Tracking Data: A Case Study of Singapore. Transportation 2024, 1–23. [Google Scholar] [CrossRef]
- Metro Madrid Anual Report of Metro Madrid. Available online: https://www.metromadrid.es/es (accessed on 22 April 2025).
- Yun, T.-G.; Lee, Y.-I. A Study on the Evaluation Method of Level of Service in Transfer Walking Facilities. J. Korean Soc. Transp. 2010, 28, 143–156. [Google Scholar]
- Zhang, J.; Ai, Q.; Ye, Y.; Deng, S. Dynamic Flow Analysis and Crowd Management for Transfer Stations: A Case Study of Suzhou Metro. Public Transp. 2024, 16, 619–653. [Google Scholar] [CrossRef]
- Kabalan, B.; Leurent, F.; Christoforou, Z.; Dubroca-Voisin, M. Framework for Centralized and Dynamic Pedestrian Management in Railway Stations. Transp. Res. Procedia 2017, 27, 712–719. [Google Scholar] [CrossRef]
- Molyneaux, N.; Scarinci, R.; Bierlaire, M. Pedestrian Management Strategies for Improving Flow Dynamics in Transportation Hubs. In Proceedings of the 17th Swiss Transport Research Conference (STRC), Ascona, Switzerland, 17–19 May 2017; Ecole Polytechnique Fédérale de Lausanne: Lausanne, Switzerland, 2017. [Google Scholar]
- Ahn, Y.; Kowada, T.; Tsukaguchi, H.; Vandebona, U. Estimation of Passenger Flow for Planning and Management of Railway Stations. Transp. Res. Procedia 2017, 25, 315–330. [Google Scholar] [CrossRef]
- Dib, A.; Cherrier, N.; Graive, M.; Rérolle, B.; Schmitt, E. Unified Occupancy on a Public Transport Network through Combination of AFC and APC Data. In Proceedings of the 2023 IEEE 26th International Conference on Intelligent Transportation Systems (ITSC), Bilbao, Spain, 24–28 September 2023; pp. 1963–1970. [Google Scholar] [CrossRef]
- Azemsha, S.; Denis, K. The Study of Public Transport Occupancy Rate Patterns in Belarusian Cities; International Journal of Engineering Inventions; Natural Science Foundation: Coimbatore, India, 2022; Volume 11, pp. 128–134.
- McCarthy, C.; Moser, I.; Jayaraman, P.P.; Ghaderi, H.; Tan, A.M.; Yavari, A.; Mehmood, U.; Simmons, M.; Weizman, Y.; Georgakopoulos, D.; et al. A Field Study of Internet of Things-Based Solutions for Automatic Passenger Counting. IEEE Open J. Intell. Transp. Syst. 2021, 2, 384–401. [Google Scholar] [CrossRef]
- van Den Heuvel, J.; Voskamp, A.; Daamen, W.; Hoogendoorn, S.P. Using Bluetooth to Estimate the Impact of Congestion on Pedestrian Route Choice at Train Stations. In Proceedings of the Traffic and Granular Flow, 2013; Springer International Publishing: Berlin/Heidelberg, Germany, 2015; pp. 73–82. [Google Scholar]
- Sipetas, C.; Huang, Z.; Espinosa Mireles de Villafranca, A. Evaluation Framework for Multi-Modal Public Transport Systems Based on Connectivity and Transfers at Stop Level. Transp. Res. Rec. 2024, 2678, 147–162. [Google Scholar] [CrossRef]
- Hoppe, J.; Schwinger, F.; Haeger, H.; Wernz, J.; Jarke, M. Improving the Prediction of Passenger Numbers in Public Transit Networks by Combining Short-Term Forecasts with Real-Time Occupancy Data. IEEE Open J. Intell. Transp. Syst. 2023, 4, 153–174. [Google Scholar] [CrossRef]
- Zhang, J.; Chen, F.; Shen, Q. Cluster-Based LSTM Network for Short-Term Passenger Flow Forecasting in Urban Rail Transit. IEEE Access 2019, 7, 147653–147671. [Google Scholar] [CrossRef]
- Cascajo, R.; Lopez, E.; Herrero, F.; Monzon, A. User Perception of Transfers in Multimodal Urban Trips: A Qualitative Study. Int. J. Sustain. Transp. 2019, 13, 393–406. [Google Scholar] [CrossRef]
- Cascajo, R.; Garcia-Martinez, A.; Monzon, A. Stated Preference Survey for Estimating Passenger Transfer Penalties: Design and Application to Madrid. Eur. Transp. Res. Rev. 2017, 9, 42. [Google Scholar] [CrossRef]
- Jara-Diaz, S.; Monzon, A.; Cascajo, R.; Garcia-Martinez, A. An International Time Equivalency of the Pure Transfer Penalty in Urban Transit Trips: Closing the Gap. Transp. Policy 2022, 125, 48–55. [Google Scholar] [CrossRef]
- Turnbull, R.; O’higgins, T. Public Transport Interchange Design Guidelines: Final Report; Auckland Transport: Auckland, New Zealand, 2013. [Google Scholar]
- Transport for London. Interchange Best Practice Guidelines; Transport for London: London, UK, 2021.
- Monzón, A.; Di Ciommo, F. CITY-HUBs: Sustainable and Efficient Urban Transport Interchanges; CRC Press: Boca Raton, FL, USA, 2016. [Google Scholar]
- Quiroz Villanueva, M.J.; Guglielmi, F.; De Fabiis, F.; Coppola, P. Social and Economic Impacts of Transportation Multi-Modal and Multi-Service Hub Development. Sustainability 2025, 17, 1767. [Google Scholar] [CrossRef]
- Heddebaut, O.; Di Commo, F. Transport Intermodal Interchanges: Socio-Economic Impacts at Lille European Metropolis; Universitat Politecnica de Valencia: Valencia, Spain, 2016; pp. 1–11. [Google Scholar]
- Bertolini, L.; Spit, T. Cities on Rails; Routledge: London, UK, 2005; ISBN 9781135811259. [Google Scholar]
- Bernal, L.M.M.D. Basic Parameters for the Design of Intermodal Public Transport Infrastructures. Transp. Res. Procedia 2016, 14, 499–508. [Google Scholar] [CrossRef]
- Lois, D.; Monzón, A.; Hernández, S. Analysis of Satisfaction Factors at Urban Transport Interchanges: Measuring Travellers’ Attitudes to Information, Security and Waiting. Transp. Policy 2018, 67, 49–56. [Google Scholar] [CrossRef]
- Heekyukim, S.M.; Hur, J.; Moon, Y.S. A Study on the Analysis of Space and Structural Interface for Improvement of the Transfer Path in a Metro Station. Int. J. Civ. Struct. Environ. Infrastruct. Eng. Res. Dev. 2016, 6, 11–16. [Google Scholar]
- Moodley, S.; Venter, C. Measuring the Service Quality at Multimodal Public Transport Interchanges: A Needs-Driven Approach. In Transportation Research Record; SAGE Publications Ltd.: Thousand Oaks, CA, USA, 2022; Volume 2676, pp. 194–206. [Google Scholar]
- Terzis, G.; Last, A. GUIDE Project—Urban Interchanges—A Good Practice: Final Report; Planning and Transport Research and Computation (PTRC): London, UK, 2000. [Google Scholar]
- Consorcio Proyecto PIRATE. Intercambiador de Transporte: Manual y Directrices; Consorcio Proyecto PIRATE: Madrid, Spain, 2000. [Google Scholar]
- Wilson, T.; Yariv, B. Station Design Principles for Network Rail; Network Rail Company: London, UK, 2015. [Google Scholar]
- Hernández del Olmo, S. Assessment Methodology to Make Urban Transport Interchanges Attractive for Users; Universidad Politécnica de Madrid: Madrid, Spain, 2015. [Google Scholar]
- Chauhan, V.; Gupta, A.; Parida, M. Demystifying Service Quality of Multimodal Transportation Hub (MMTH) through Measuring Users’ Satisfaction of Public Transport. Transp. Policy 2021, 102, 47–60. [Google Scholar] [CrossRef]
- Hine, J.; Scott, J. Seamless, Accessible Travel: Users’ Views of the Public Transport Journey and Interchange. Transp. Policy 2000, 7, 217–226. [Google Scholar] [CrossRef]
- Hernandez, S.; Monzon, A. Key Factors for Defining an Efficient Urban Transport Interchange: Users’ Perceptions. Cities 2016, 50, 158–167. [Google Scholar] [CrossRef]
- Dell’Asin, G.; Monzón, A.; Lopez-Lambas, M.E. Key Quality Factors at Urban Interchanges. Proc. Inst. Civil. Eng. Transp. 2015, 168, 326–335. [Google Scholar] [CrossRef]
- Hernandez, S.; Monzon, A.; de Oña, R. Urban Transport Interchanges: A Methodology for Evaluating Perceived Quality. Transp. Res. Part. A Policy Pract. 2016, 84, 31–43. [Google Scholar] [CrossRef]
- Kim, J.; Schmöcker, J.D.; Yu, J.W.; Choi, J.Y. Service Quality Evaluation for Urban Rail Transfer Facilities with Rasch Analysis. Travel. Behav. Soc. 2018, 13, 26–35. [Google Scholar] [CrossRef]
- Desiderio, N. Requirements of Users and Operators on the Design and Operation of Intermodal Interchanges; Technishe Universitat Darmstadt, Fachgebiet Verkehrsplanung und Verkehrstechnik: Darmstadt, Germany, 2004; pp. 35–52. [Google Scholar]
- Li, L.; Loo, B.P.Y. Towards People-Centered Integrated Transport: A Case Study of Shanghai Hongqiao Comprehensive Transport Hub. Cities 2016, 58, 50–58. [Google Scholar] [CrossRef]
- Highway Capacity Manual, 7th ed.; National Academies Press: Washington, DC, USA, 2022; ISBN 978-0-309-27566-8.
- Rusanen, I.; Wiest, F. Analysis of Multimodal Passenger Terminal Design and Its Effects on Transfer Penalty. Liik.-Vuosik. 2024, 6, 35–52. [Google Scholar] [CrossRef]
- Lee, E.H.; Lee, H.; Kho, S.-Y.; Kim, D.-K. Evaluation of Transfer Efficiency between Bus and Subway Based on Data Envelopment Analysis Using Smart Card Data. KSCE J. Civil Eng. 2019, 23, 788–799. [Google Scholar] [CrossRef]
- Li, C.-X.; Yoon, C.-J. Analysis of Urban Rail Public Transport Space Congestion Using Graph Fourier Transform Theory: A Focus on Seoul. Sustainability 2025, 17, 598. [Google Scholar] [CrossRef]
- Valente, A.; Berki, B.; Dohmen, C.; Wauters, C.; Moszkowicz, D.; Koenig, G.; Carmena, G.; Koberg, H.; Moreno Sanz, I.B.; Singh, J.; et al. Improving Passenger Flow and Crowd Management Through Technology and Innovation; Advancing Public Transport: Brussels, Belgium, 2022. [Google Scholar]
- Pasini, K.; Khouadjia, M.; Samé, A.; Ganansia, F.; Oukhellou, L. LSTM Encoder-Predictor for Short-Term Train Load Forecasting. In Proceedings of the Lecture Notes in Computer Science (Including Subseries Lecture Notes in Artificial Intelligence and Lecture Notes in Bioinformatics); Springer: Berlin/Heidelberg, Germany, 2020; Volume 11908 LNAI, pp. 535–551. [Google Scholar]
- Vieira, T.; Almeida, P.; Meireles, M.; Ribeiro, R. Public Transport Occupancy Estimation Using WLAN Probing and Mathematical Modeling. Transp. Res. Procedia 2020, 48, 3299–3309. [Google Scholar] [CrossRef]
- Zhao, Y.; Ma, Z.; Yang, Y.; Jiang, W.; Jiang, X. Short-Term Passenger Flow Prediction with Decomposition in Urban Railway Systems. IEEE Access 2020, 8, 107876–107886. [Google Scholar] [CrossRef]
- Xue, R.; Sun, D.; Chen, S. Short-Term Bus Passenger Demand Prediction Based on Time Series Model and Interactive Multiple Model Approach. Discret. Dyn. Nat. Soc. 2015, 2015, 1–11. [Google Scholar] [CrossRef]
- Hochreiter, S.; Schmidhuber, J. Long Short-Term Memory (LSTM). Neural Comput. 1997, 9, 1735–1780. [Google Scholar] [CrossRef] [PubMed]
- Toque, F.; Come, E.; El Mahrsi, M.K.; Oukhellou, L. Forecasting Dynamic Public Transport Origin-Destination Matrices with Long-Short Term Memory Recurrent Neural Networks. In Proceedings of the 2016 IEEE 19th International Conference on Intelligent Transportation Systems (ITSC), Rio de Janeiro, Brazil, 1–4 November 2016; IEEE: Piscataway, NJ, USA, 2016; pp. 1071–1076. [Google Scholar]
- Toque, F.; Khouadjia, M.; Come, E.; Trepanier, M.; Oukhellou, L. Short & Long-Term Forecasting of Multimodal Transport Passenger Flows with Machine Learning Methods. In Proceedings of the 2017 IEEE 20th International Conference on Intelligent Transportation Systems (ITSC), Yokohama, Japan, 16–19 October 2017; IEEE: Piscataway, NJ, USA, 2017; pp. 560–566. [Google Scholar]
- Kuchár, P.; Pirník, R.; Janota, A.; Malobický, B.; Kubík, J.; Šišmišová, D. Passenger Occupancy Estimation in Vehicles: A Review of Current Methods and Research Challenges. Sustainability 2023, 15, 1332. [Google Scholar] [CrossRef]
- Banerjee, N.; Morton, A.; Akartunalı, K. Passenger Demand Forecasting in Scheduled Transportation. Eur. J. Oper. Res. 2020, 286, 797–810. [Google Scholar] [CrossRef]
- Wood, J.; Yu, Z.; Gayah, V.V. Development and Evaluation of Frameworks for Real-Time Bus Passenger Occupancy Prediction. Int. J. Transp. Sci. Technol. 2023, 12, 399–413. [Google Scholar] [CrossRef]
- Consorcio de Transportes de Madrid (CRTM) Intercambiador de Moncloa. Available online: https://www.crtm.es/tu-transporte-publico/intercambiadores/grandes-intercambiadores/90_14.aspx (accessed on 15 March 2025).
- Comunidad de Madrid Datos Abiertos. Available online: https://www.comunidad.madrid/gobierno/datos-abiertos (accessed on 15 March 2025).
- Empresa Municipal de Transportes de Madrid (EMT Madrid) Cuentas Anuales e Informes Estadísticos de Gestión. Available online: https://www.emtmadrid.es/Empresa/PortalTransparencia (accessed on 15 March 2025).
- The Editors of Encyclopædia Britannica Conservation of Energy. Available online: https://www.britannica.com/science/conservation-of-energy (accessed on 16 March 2025).
- Liu, G.; Yin, Z.; Jia, Y.; Xie, Y. Passenger Flow Estimation Based on Convolutional Neural Network in Public Transportation System. Knowl. Based Syst. 2017, 123, 102–115. [Google Scholar] [CrossRef]
- Redmon, J.; Divvala, S.; Girshick, R.; Farhadi, A. You Only Look Once: Unified, Real-Time Object Detection. arXiv 2016, arXiv:1506.02640. [Google Scholar]
- Bergmann, D.; Stryker, C. What Is a Loss Function? Available online: https://www.ibm.com/think/topics/loss-function (accessed on 16 March 2025).
- Tang, L.; Zhao, Y.; Cabrera, J.; Ma, J.; Tsui, K.L. Forecasting Short-Term Passenger Flow: An Empirical Study on Shenzhen Metro. IEEE Trans. Intell. Transp. Syst. 2019, 20, 3613–3622. [Google Scholar] [CrossRef]
- Jenelius, E. Data-Driven Metro Train Crowding Prediction Based on Real-Time Load Data. IEEE Trans. Intell. Transp. Syst. 2020, 21, 2254–2265. [Google Scholar] [CrossRef]
Disclaimer/Publisher’s Note: The statements, opinions and data contained in all publications are solely those of the individual author(s) and contributor(s) and not of MDPI and/or the editor(s). MDPI and/or the editor(s) disclaim responsibility for any injury to people or property resulting from any ideas, methods, instructions or products referred to in the content. |
© 2025 by the authors. Licensee MDPI, Basel, Switzerland. This article is an open access article distributed under the terms and conditions of the Creative Commons Attribution (CC BY) license (https://creativecommons.org/licenses/by/4.0/).