1. Introduction
Commute in smart cities is a service that has changed the way of citizens’ daily life and schedule [
1]. Such service is feasible due to significant research in the area of vehicle ride sharing, which aims to provide passengers a comfortable living and well-being services in smart cities [
2]. Specifically, ride sharing has a significant impact in vehicle transportation services to passengers during their daily schedule from a certain origin to a desired destination within smart cities [
3].
With vehicle technology, it is possible to incorporate electric vehicles to serve users’ needs [
4]. Intuitively, autonomous vehicle technology extends driving operations to provide certain routing commute service to smart cities’ users [
5]. Online fleet control is important for handling traffic in rush hours and providing quality of life to citizens of a city [
6]. Parking services are significant because they provide a comfort trip of commute routes at the area of coverage as well as the center of smart cities [
7]. Mobility on demand for passengers’ rendezvous during their transportation is important to achieve precise timing services, thus providing robust solutions with significant impact to smart-city heavy traffic on daily basis [
8].
Vehicle ride sharing is possible to incorporate certain meeting points of passengers to reduce mobility costs at the end of the traffic network adopted by smart city taxis [
9]. Operational policies applied on city transportation services are significant to plan certain solutions to support a balanced ride-sharing process for the majority of the population [
10]. The pricing of certain daily routes is significant for the adoption of ride-sharing solutions by the majority of smart cities’ citizens [
11]. Passenger satisfaction should be a fundamental dimension of ride-sharing policies, thus able to measure user experience provided by certain routing commutes in the city [
12]. Concretely, user satisfaction should be supported by certain privacy regulations aiming to assist citizens well-being, such as the anonymization of commuters’ personal data that provide a safe vehicle ride-sharing service [
13]. Blockchain technology could also be applied in the city scale of ride-sharing trajectories to provide significant safety solutions to passengers [
14]. Vehicle ride-sharing research focuses mainly on spatial and temporal context for proposing a routing trajectory, which serves the needs of multiple passengers [
15]. Intuitively, research on passengers’ ride-sharing commute within the city is also able to assess social context, which exploits social preferences during the routing trip [
16].
1.1. Contribution
In this paper, a vehicle ride-sharing algorithm is proposed, which incorporates certain spatial, temporal, and social behavior context restrictions to propose a satisfactory routing trajectory that serves the daily needs of smart city passengers. Specifically, expanding user context with social parameters leads to a more comprehensive understanding of user behavior than only focusing on physical attributes, such as space and time parameters. Intuitively, in this research effort, the implicit behavioral personality of individuals is evaluated experimentally when they decide to share their commute route with other passengers, aiming to focus on traveling persons’ social interactions. The proposed algorithm is based on pattern matching applied on real data exploiting passengers’ contextual information. Concretely, there are proposed certain spatial, temporal, and social matching distance functions, which define specific spatial, temporal, and social matching similarity thresholds of passengers’ social mobility behavior. Subsequently, a routing trajectory output for certain smart city commuters’ trip is proposed by the vehicle ride-sharing algorithm, which is based on the adopted matching distance functions and defined matching thresholds. Intuitively, a passenger could be picked up either (1) at the origin location of the routing trip or (2) at an intermediate location of the routing trip. Subsequently, a passenger might be dropped off either (1) at an intermediate place location of the routing trip or (2) at the destination of the routing trip. Concretely, the proposed ride-sharing algorithm supports a number of passengers with multiple pick-up origins and drop-off destinations during the commuter route. System evaluation is achieved by exploiting certain evaluation metrics, such as the following: (1) a spatial metric that evaluates the distance covered during the commute route, (2) a temporal metric that evaluates the time required during the commute route, (3) a social metric that evaluates social behavior matching between riding passengers, (4) a capacity metric that evaluates the number of riding passengers served by vehicle seat availability, and (5) a satisfaction metric that evaluates passengers’ pleasure observed by the end of the routing trip commute.
1.2. Related Work
Ride sharing as a service is decomposed in certain contextual dimensions, such as spatial, temporal, and social behavior context. Specifically, the aim is to maximize shared routes with an engaged common-use vehicle thus providing optimal origin to destination solutions and social welfare benefits to passengers. Concretely, there are certain research approaches, which are based only on spatial and temporal contexts, while other research efforts focus on spatial, temporal, and social contexts.
1.2.1. Ride Sharing Accessing Spatial and Temporal Context
Travel prediction time is assessed to handle the travel time uncertainty of commute routing trips [
17]. Specifically, the research approach focuses on minimizing the total driving detour time and the number of passengers served during a certain time sequence window size, while a deep learning-based data-driven algorithm is proposed to handle ride sharing in smart cities. A multi-agent behavior system is incorporated to reduce the total distance traveled within a single ride [
18]. Intuitively, this research effort proposes a decentralized architecture, which is based on a distributed ant colony optimization algorithm. Scalability limitations are faced efficiently to provide an integrated on-demand mobility ride-sharing system [
19]. Concretely, an algorithm is proposed, which is combined with shareability networks exploiting spatial and temporal locality filters. The elimination of sharing costs is able to reduce congestion and CO
2 emissions, thus exploiting the capabilities of shared vehicle capacities [
20]. A distributed model-free algorithm, which incorporates a deep Q-network to optimize dispatch policies during interactions within the smart city environment, is proposed.
Ride sharing enables vehicle drivers to provide commute to other passengers, thus reducing transportation time and traffic congestion in road networks [
21]. An aggregated score vehicular recommendation algorithm is proposed, which provides accurate recommendations in real time to requesting passengers. Advances in ride-sharing technology are able to face inefficiencies in vehicle usage, road congestion, fuel consumption, CO
2 emissions, and environmental concerns in smart cities [
22]. A distributed multi-hop ride-sharing algorithm is proposed, which incorporates deep reinforcement learning to provide optimal vehicle dispatch and matching decisions while interacting with the city’s environment. Passenger requirements for efficient ride-sharing services are emerging dynamically, thus defining a reliable vehicle fleet size is considered a challenging issue to be faced [
23]. A minimum fleet size demand-aware dynamic ride-sharing algorithm is proposed to define the optimum vehicle fleet size required to cover passengers’ demands during their daily activity. Concretely, a spatial and temporal routing path generation for commute route is proposed, where the solution focuses mainly on the exploitation of a Pareto optimal set for a certain stochastic transportation network [
24]. Intuitively, machine learning modeling incorporating microsimulation environments are used to define demand forecasting exploiting multi-model travel networks based on passengers’ spatiotemporal context [
25].
1.2.2. Ride Sharing Accessing Spatial, Temporal, and Social Context
The number of circulating vehicles is optimized by assessing the context of passengers’ activities during their individual mobility demands [
26]. An activity-based ride-sharing matching algorithm is proposed, which exploits several commute requests to reach alternative destinations assessing passengers’ daily activities. A timely and accurate short-term prediction for an origin–destination-based demand provides routing trip information to passengers [
27]. A multi-task factorized graph neural network is proposed to effectively face ride-sharing problems. Online ride sharing for real-time requests incorporates smart phones to schedule a vehicle pick-up according to temporal and capacity constraints [
28]. A mobile-cloud searching ride-sharing algorithm is proposed, which satisfies passengers’ requests for optimal spatial and temporal commute rides. Increasing passengers’ satisfaction from ride-sharing services causes the utilization of them by more smart cities’ users [
29]. A signaling game agent-based ride-sharing algorithm is proposed, which analyzes Bayesian equilibria for maximizing sharing ride trip commute adoption by passengers.
Traffic management for handling shared vehicle systems faces traffic congestion and CO
2 emissions in rush hours within smart cities [
30]. A ride-sharing path-planning greedy algorithm is proposed, which exploits a limited local search area of interest for each vehicle by applying certain filters on passengers’ requests. Ride sharing is considered a decision-making concept where passengers have self-interest behavior for gaining an optimal commute ride [
31]. A decentralized ride-sharing system is proposed, which is based on a stable matching algorithm to provide an efficient quality of service to commuters. Ride sharing has an impact on urban transportation in smart cities’ ecosystems, which raises fairness concerns to commuter’s rides [
32]. A ride-sharing algorithm based on a dynamic game concept is proposed, which captures fairness interactions between passengers and vehicle drivers to provide an optimal routing commute. Social and mobile technologies provide the opportunity to assess mobility traces incorporated in ride-sharing systems [
33]. An algorithm is proposed, which analyzes urban mobility data and recognizes matching rides with similar commute routes.
Authors adopt certain analytical vehicle ride-sharing solutions to provide ride-hailing mobility services to citizens of smart cities. Research focuses mainly on autonomous driving as an emerging transportation service to daily citizens’ life [
34]. On-demand transportation utilities are proposed to facilitate the use of vehicle ride-sharing services by citizens during their commute in smart cities. Focus is given on analyzing operational impact in temporal and social ride pooling [
35]. A study on the upcoming transportation trends in smart cities is provided, which are based on spatial and social user context. Authors focus mainly on the usage of media-based interactions during vehicle ride-sharing transportation in the public spaces of a smart city [
36]. An extended study on multiple vehicle ride-sharing scenarios and policies is adopted for transportation purposes in green smart city environment. A series of detailed mobility policies are examined for possible automated mobility applications in daily commute services provided to the citizens [
37]. A transportation analysis is proposed for the advances in sustainable vehicle ride-sharing systems in smart cities. Focus is given on intelligent transportation technology as well as on renewable energy in green ecosystems [
38].
Research in the literature has a significant impact in the area of vehicle ride-sharing algorithms. However, analyzed research approaches do not efficiently assess passengers’ satisfaction for ride-sharing adoption in smart cities. This is based on the limited attention to deepen into social behavior pattern matching between riding passengers of a commuter’s route. Concretely, passengers’ pleasure is not exploited with regard to an extensive variety of evaluation metrics to present the significance of the observed results. Intuitively, in the current research effort proposed, research aims to evaluate passengers’ behavior context according to certain areas of users’ activities, such as spatial context, temporal context, and social behavior context, thus assessing passengers’ satisfaction. Specifically, passengers’ social experience, which is expressed as routing trip satisfaction, is assessed by adopting predefined Likert 5-point scale style ratings. According to the adopted scale, a numeric interval within range [1, 5] is proposed, where a minimum value of 1 indicates a low satisfaction rating, while a maximum value of 5 indicates a high satisfaction rating. Subsequently, the rest of the values within the Likert scale range denote intermediate commute route satisfaction ratings. Concretely, the proposed algorithm’s spatial, temporal, and social behavior impact is based on pattern matching, while the efficiency of the algorithm is achieved by fine tuning passengers’ parameters for certain contextual information.
The structure of this paper is as follows: In
Section 2, materials and methods are presented to describe the proposed ride-sharing algorithm, which incorporates spatial, temporal, and social behavior context. In
Section 3, the adopted ride-sharing algorithm is experimentally evaluated with certain evaluation metrics, while experimental results are presented. In
Section 4, discussion on the observed results is performed, while
Section 5 concludes this paper and proposes future work.
2. Materials and Methods
Research effort problem was defined in detail and modeled accordingly to support the potentiality of the proposed ride-sharing algorithm. Concretely, social mobility ride-sharing algorithm assessed passengers’ contextual information based on spatial, temporal, and social pattern matching to provide ride-sharing services within the city.
2.1. Problem Definition
Vehicle ride sharing is a service provided to a number of passengers that have similar routes to cover their needs for daily movement within a smart city. A single vehicle was used, which picks up each passenger from a certain origin and drops them off to a desired destination. Origins and destinations are applied to certain passengers and may be more than one according to each passenger’s moving profile. Certain restrictions should be addressed to provide a vehicle ride-sharing algorithm able to fulfill each passenger’s desire. Specifically, a vehicle has a limited capacity to serve multiple passengers during their commute. Concretely, there are spatial as well as temporal limitations, which were applied during the routing trip. Intuitively, distance covered and time required to serve specific number of passengers were assessed by assigning observed values to certain defined intervals. There are proposed certain spatial, temporal, and social matching distance functions that assessed spatial, temporal, and social behavior passengers’ matching patterns. This is feasible by defining certain spatial, temporal, and social similarity matching thresholds based on passengers’ social mobility behavior patterns as observed through their activity in the smart city.
Concretely, proposed research effort exploited social behavior context of served passengers. Subsequently, assessed commute context impacts social welfare towards passengers’ satisfaction. Social context was decomposed on certain dimensions performed by passengers during their daily life activities. Such context produced by smart city passengers’ social activities was analyzed according to specific contextual social categories such as the following: (1) politics, (2) sports, (3) lifestyle, (4) technology, and (5) economic social behavior activities. Adopted social context categories were extracted by extensively analyzing social networking passengers’ behavioral activities observed on certain period of time. Concretely, social context was not fully examined in the current research effort due to its inherent complexity as a part of human nature. However, the focus is on dealing with fundamental aspects of social behavior based on principles, which are publicly available as a motivation for further study towards this research direction. Intuitively, adopted contextual social categories were not incorporated arbitrarily (i.e., are not selected explicitly by the authors) but were rather a selection, which exploits research performed in the area of implicit user’s behavioral activities performed in the literature of social networks [
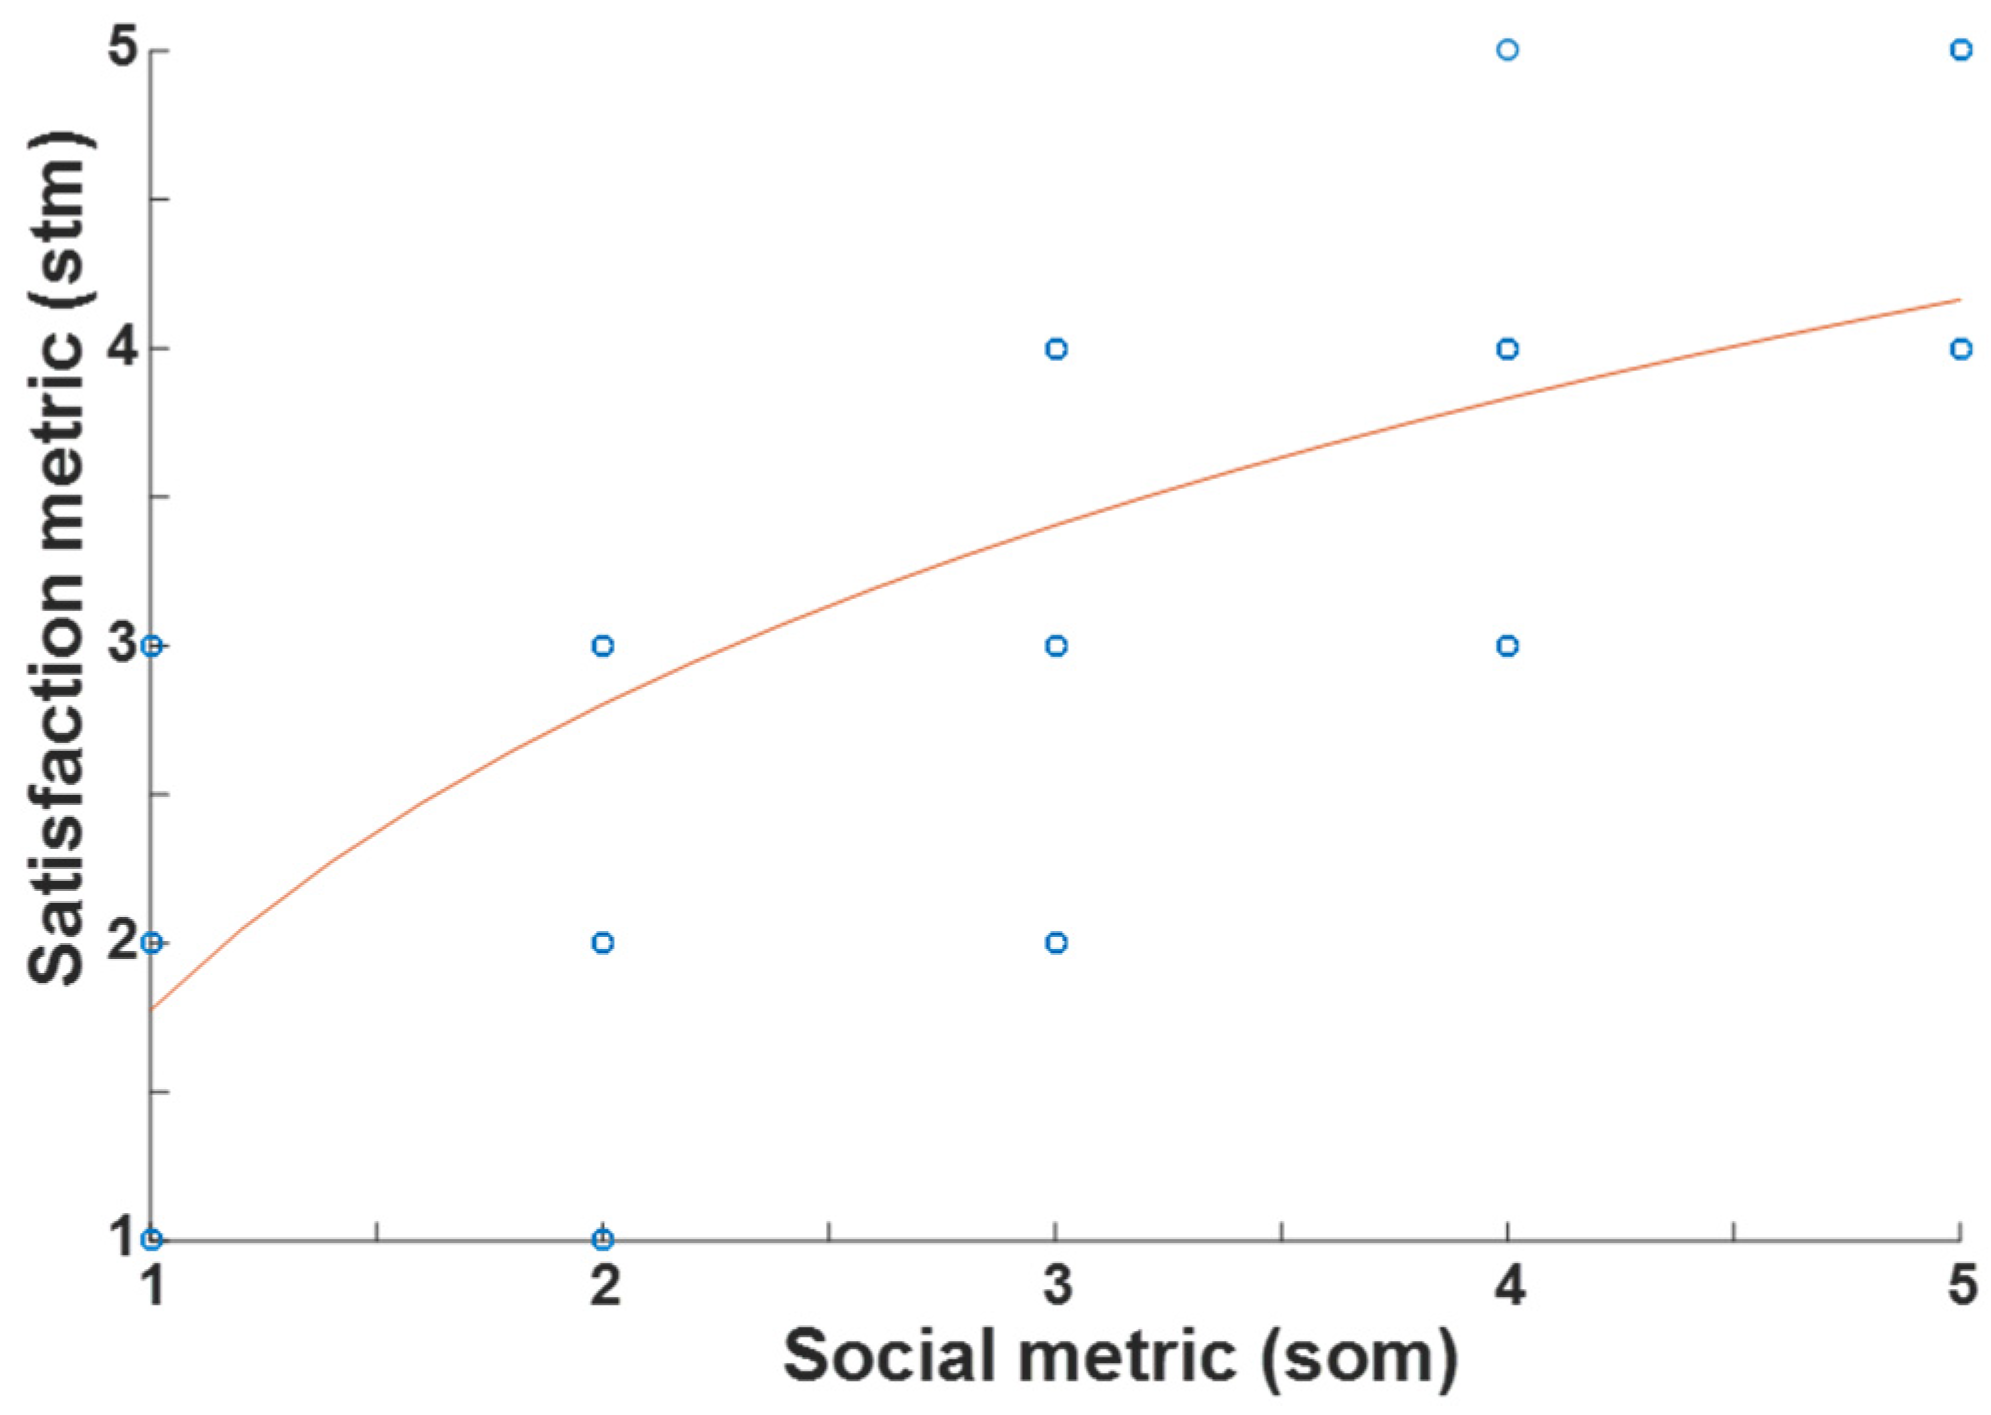
39]. Specifically, exploitation of social behavior context aims to optimize mobility performance provided by spatial and temporal context analysis of passengers’ routing trips. Intuitively, such an analysis focuses on assessing passengers’ ride-sharing satisfaction service in smart cities, which is measured according to Likert 5-point scale style ratings. Subsequently, matching of passengers is not only based on social context but also on spatial and temporal context, since decision on a possible ride sharing is not only a result of social context but also has spatial and temporal limitations. That is, no user would choose to invoke a commute route from a certain origin to a certain destination only for the sake of social interaction since spatiotemporal context is also significant and should not be omitted during the decision process. Empirical evidence of current research effort with regard to the relation between social context and user satisfaction is presented in
Section 3.3, which provides experimental evaluation results, where, the relation between social and satisfaction evaluation metrics’ values is visualized. In addition, it should be noted that context validation of the adopted social categories is also presented, where visual validation of social context was performed with regard to passengers’ satisfaction based on real data sources provided for experimentation in the physical world.
2.2. Problem Modeling
Solving vehicle ride-sharing problems requires modeling of the provided service parameters’ accurately. Concretely, proposed ride-sharing algorithm should be defined, thus able to be adopted by smart cities’ mobility infrastructure.
2.2.1. Ride-Sharing Service
Let us assume a ride-sharing service that should be provided to a rider who invokes social mobility algorithm to choose an available route with a certain driver and specific commuters to get a ride from an origin to a destination, taking into consideration customized spatial, temporal, and social users’ contextual information. It holds that rider, driver, and commuters are defined as passengers of the shared routing trip. Specifically, the algorithm should be able to handle certain pick-up and drop-off ride-sharing services. Concretely, a rider could be picked up either (1) at the origin location of the route or (2) at an intermediate location of the route. Intuitively, a rider user might be dropped off either (1) at an intermediate place location of the route or (2) at the destination of the route. Subsequently, proposed ride-sharing algorithm supports a certain number of passengers according to vehicle’s capacity with multiple pick-up origins and drop-off destinations during the commuter route.
2.2.2. Data Model
A data model should be described, which contains certain data structures. Let us assume a spatial vector,
, which contains a single Global Positioning System (GPS) point composed by a latitude,
, and a longitude,
, numeric value in the form of Decimal Degrees (DDs); thus,
. Assume a temporal vector,
, which contains a single timestamp point composed by a day of the week,
, an hour,
, and a minute,
, numeric values in the form of DD:HH:MM; thus,
. A social vector,
, which contains a certain number of social points,
, composed by certain (1) politics,
, (2) sports,
, (3) lifestyle,
, (4) technology,
, and (5) economics,
, ordinal values in the interval within [0, 1] where 0 means an absence, while 1 means a presence of the respected ordinal social point value. Thus, it holds that the defined quantity is
. Let us also assume a trajectory vector,
, which contains a certain number of spatial vectors,
, associated with a corresponding number of temporal vectors,
, along with a single social vector with a certain number of social points,
. Spatial length,
, of the trajectory vector is the total number of spatial vectors,
, while temporal length,
, of the trajectory vector is the total number of temporal vectors,
. Accordingly, social length,
, of the trajectory vector is the total number of the social vector’s social points,
. Length of the trajectory vector is the summation of the spatial length, the temporal length, and the social length; thus,
. Trajectory vector implies a commute route of a passenger within the city composed by multiple spatial and temporal vectors, while a unique social vector was assigned to the route since a passenger’s social behavior context remains constant regardless of their spatial and temporal context. Let us assume a passenger,
, which is a user assessing the proposed algorithm services. A passenger trajectory vector,
, or simply a passenger instance, contains a certain trajectory vector,
, which is associated with a unique anonymized passenger identifier,
; thus,
. Concretely, a passenger is assigned with a unique
, to preserve passenger anonymity, which may assign with more than one
, thus expressing the different commute route trajectories that a passenger may have performed during their daily movement in the smart city. A knowledge base,
, is defined as a matrix, which contains all available passengers’ unique instances enriched with certain spatial, temporal, and social behavior context assessed by the proposed algorithm; thus,
, where
is the total number of the passengers’ instances,
, assessed by the proposed algorithm. Adopted data model description is presented in
Table 1.
2.2.3. Passengers’ Roles
Several passenger roles are exploited by the social mobility ride-sharing algorithm. Concretely, a rider, , is any passenger, , who invokes the algorithm to assess the ride-sharing service. A traveler, , is also a passenger who, compared with the rider, has the following: (1) spatial matching distance less than or equal to a spatial matching threshold, , (2) temporal matching distance less than or equal to a temporal matching threshold, , and (3) a social matching distance less or equal to a social matching threshold, . Derived set of travelers provides rider the possibility to find a driver and other commuters to share the commute route. Specifically, a driver, , is a passenger provided by the travelers’ set who consents to provide a ride-sharing service to the rider. There is only one driver for a certain commute route. A commuter, , is a passenger provided by the travelers’ set who consents to join a specific ride-sharing service, which serves a rider by a certain driver. There might be one or more commuters who shared the commute route under the restriction that the total number of passengers within a specific vehicle are less or equal to the vehicle’s capacity threshold, .
2.2.4. Matching Distances and Similarity Thresholds
Proposed algorithm incorporates certain matching distances and similarity matching thresholds, which should apply to observe optimal results. Intuitively, spatial matching distance,
, between a rider and a traveler is the spatial distance between rider trajectory spatial vector,
, and traveler trajectory spatial vector,
, with regard to the summation of the previous observed spatial matching vectors’ distances. Specifically, spatial distance was incorporated for computing the spatial length of the invoked routing trips within the physical environment. Subsequently, spatial length as a distance quantity contains distance values measured in several road segments of the smart city road network, including commute trips in urban, rural, as well as mixed urban–rural networks. A spatial matching similarity threshold,
, between a rider and a traveler, is the maximum value of spatial matching distance,
, defined to infer a spatial matching similarity, which was measured in kilometers with certain spatial precision. Temporal matching distance,
, between a rider and a traveler, is the temporal distance between rider trajectory temporal vector,
, and traveler trajectory temporal vector,
, with regard to the summation of the previous observed temporal matching vectors’ distances. Subsequently, temporal matching similarity threshold,
, between a rider and a traveler, is the maximum value of temporal matching distance,
, defined to infer a temporal matching similarity, which was measured with certain temporal precision. Social matching distance,
, between a rider and a traveler, is the ordinal social distance between rider trajectory social vector,
, and traveler trajectory social vector,
, with regard to the summation of the previous observed social matching vectors’ distances. Concretely, social matching similarity threshold,
, between a rider and a traveler, is the maximum value of social matching distance,
, defined to infer a social matching similarity, which was measured with certain ordinal social precision. Capacity threshold,
, is the maximum number of passengers, except from driver,
(i.e., rider,
, and commuters,
), who can be served by a certain vehicle with specific number of seats (i.e., capacity,
), which was measured with certain capacity precision. Proposed matching distances and similarity thresholds’ description are presented in
Table 2.
2.2.5. Evaluation Metrics
To evaluate the social mobility ride-sharing algorithm performance, certain evaluation metrics should be defined. Concretely, spatial metric, , is defined as the spatial distance covered during the rider commute route from a certain spatial origin, , to a specific spatial destination, . Spatial metric was measured in kilometers within a certain spatial interval. Temporal metric, , is defined as the temporal distance required during the rider commute from a certain temporal origin, , to a specific temporal destination, . Temporal metric was measured in minutes within a certain temporal interval. Social metric, , is defined as the social distance derived from the social matching intersection between the passengers’ social context (i.e., rider, , driver, , and commuters, ) during a certain commute route. Social metric was measured in ordinal social values within a certain ordinal social interval. Capacity metric, , is defined according to the number of passengers served during a specific commute route with a certain vehicle. Capacity metric was measured in number of occupied passengers within a certain capacity interval, (i.e., ). Intuitively, satisfaction metric, , is defined as the rider’s pleasure assignment expressed as a rating by the end of the commute route. Satisfaction metric was measured within a certain satisfaction rating interval.
2.3. Ride-Sharing Algorithm
Proposed algorithm assessed passengers’ context to provide social mobility ride-sharing services within the smart city. Contribution of the algorithm is towards handling multiple inputs, such as spatial, temporal, and social context to assess the passengers’ satisfaction. Although pattern matching as a computational principle is not new, the innovation, however, is in combining such a heterogeneous context of users’ behavior to understand the reasons of their output social satisfaction. That is, focus was not only given on algorithmic back-end principles, but, rather, front-end contextual information emerged when dealing with soft systems, such as systems that attempt to understand human social mobility inherent behavior. Intuitively, annotated ride-sharing data input algorithm’s knowledge base periodically, thus updating passengers’ social mobility profile. Efficiency of the algorithm was assured since it was executed and decentralized on each passenger’s mobile device (i.e., a smartphone), thus incorporating distributed spatial, temporal, and social behavior context. Specifically, the input of the ride-sharing algorithm is the following: (1) knowledge base, , (2) rider, , (3) spatial matching threshold, , (4) temporal matching threshold, , (5) social matching threshold, , and (6) capacity threshold, .
Concretely, the algorithm based on the rider input selected from the knowledge base possible travelers to join the routing trip. Selection process was based on specific values assigned to the defined matching distances and matching similarity thresholds. Subsequently, according to the rider preference and travelers’ availability, the algorithm provided certain driver and other commuters that may express their consent to join the commute route. To perform experimental evaluation at the end of the routing trip, the algorithm’s output contained certain results based on computed values for the following: (1) spatial metric, , (2) temporal metric, , (3) social metric, , (4) capacity metric, , and (5) satisfaction metric, . Intuitively, evaluation process assesses observed spatial and temporal context during algorithm’s execution for the rider according to updated pick-up origin and drop-off destination values at the end of the commute route. Concretely, satisfaction metric was assigned a value based on rider’s rating, while the other metrics take values during the algorithm execution. Proposed ride-sharing algorithm is presented in Algorithm 1.
Spatial matching distance function is presented in Algorithm 2, and temporal matching distance function is presented in Algorithm 3, while social matching distance function is presented in Algorithm 4. Spatial metric function is presented in Algorithm 5, and temporal metric function is presented in Algorithm 6, while social metric function is presented in Algorithm 7.
| Algorithm 1. Vehicle ride-sharing algorithm |
| # | Social mobility ride-sharing algorithm |
| 1 | |
| 2 | |
| 3 | Begin |
| 4 | ) |
| 5 | where |
| 6 | and |
| 7 | and |
| 8 | |
| 9 | Then |
| 10 | where |
| 11 | //Certain driver |
| 12 | where |
| 13 | //Certain commuters |
| 14 | End If |
| 15 | //Perform ride sharing service |
| 16 | |
| 17 | Do |
| 18 | |
| 19 | Then |
| 20 | //End of riding commute route |
| 21 | |
| 22 | |
| 23 | |
| 24 | //Certain occupied passengers |
| 25 | //Certain rating |
| 26 | ) |
| 27 | End If |
| 28 | End While |
| 29 | End |
| Algorithm 2. Spatial distance function |
| # | Spatial matching distance function |
| 1 | |
| 2 | |
| 3 | Begin |
| 4 | //Compute spatial matching distance |
| 5 | Do |
| 6 | |
| 7 | |
| 8 | End While |
| 9 | ) |
| 10 | End |
| Algorithm 3. Temporal distance function |
| # | Temporal matching distance function |
| 1 | |
| 2 | |
| 3 | Begin |
| 4 | //Compute temporal matching distance |
| 5 | Do |
| 6 | |
| 7 | |
| 8 | End While |
| 9 | ) |
| 10 | End |
| Algorithm 4. Social distance function |
| # | Social matching distance function |
| 1 | |
| 2 | |
| 3 | Begin |
| 4 | //Compute social matching distance |
| 5 | Do |
| 6 | |
| 7 | |
| 8 | End While |
| 9 | ) |
| 10 | End |
| Algorithm 5. Spatial metric function |
| # | Spatial metric function |
| 1 | |
| 2 | |
| 3 | Begin |
| 4 | //Compute spatial metric |
| 5 | |
| 6 | ) |
| 7 | End |
| Algorithm 6. Temporal metric function |
| # | Temporal metric function |
| 1 | |
| 2 | |
| 3 | Begin |
| 4 | //Compute temporal metric |
| 5 | |
| 6 | ) |
| 7 | End |
| Algorithm 7. Social metric function |
| # | Social metric function |
| 1 | |
| 2 | |
| 3 | Begin |
| 4 | //Compute social metric |
| 5 | |
| 6 | ) |
| 7 | End |
4. Discussion
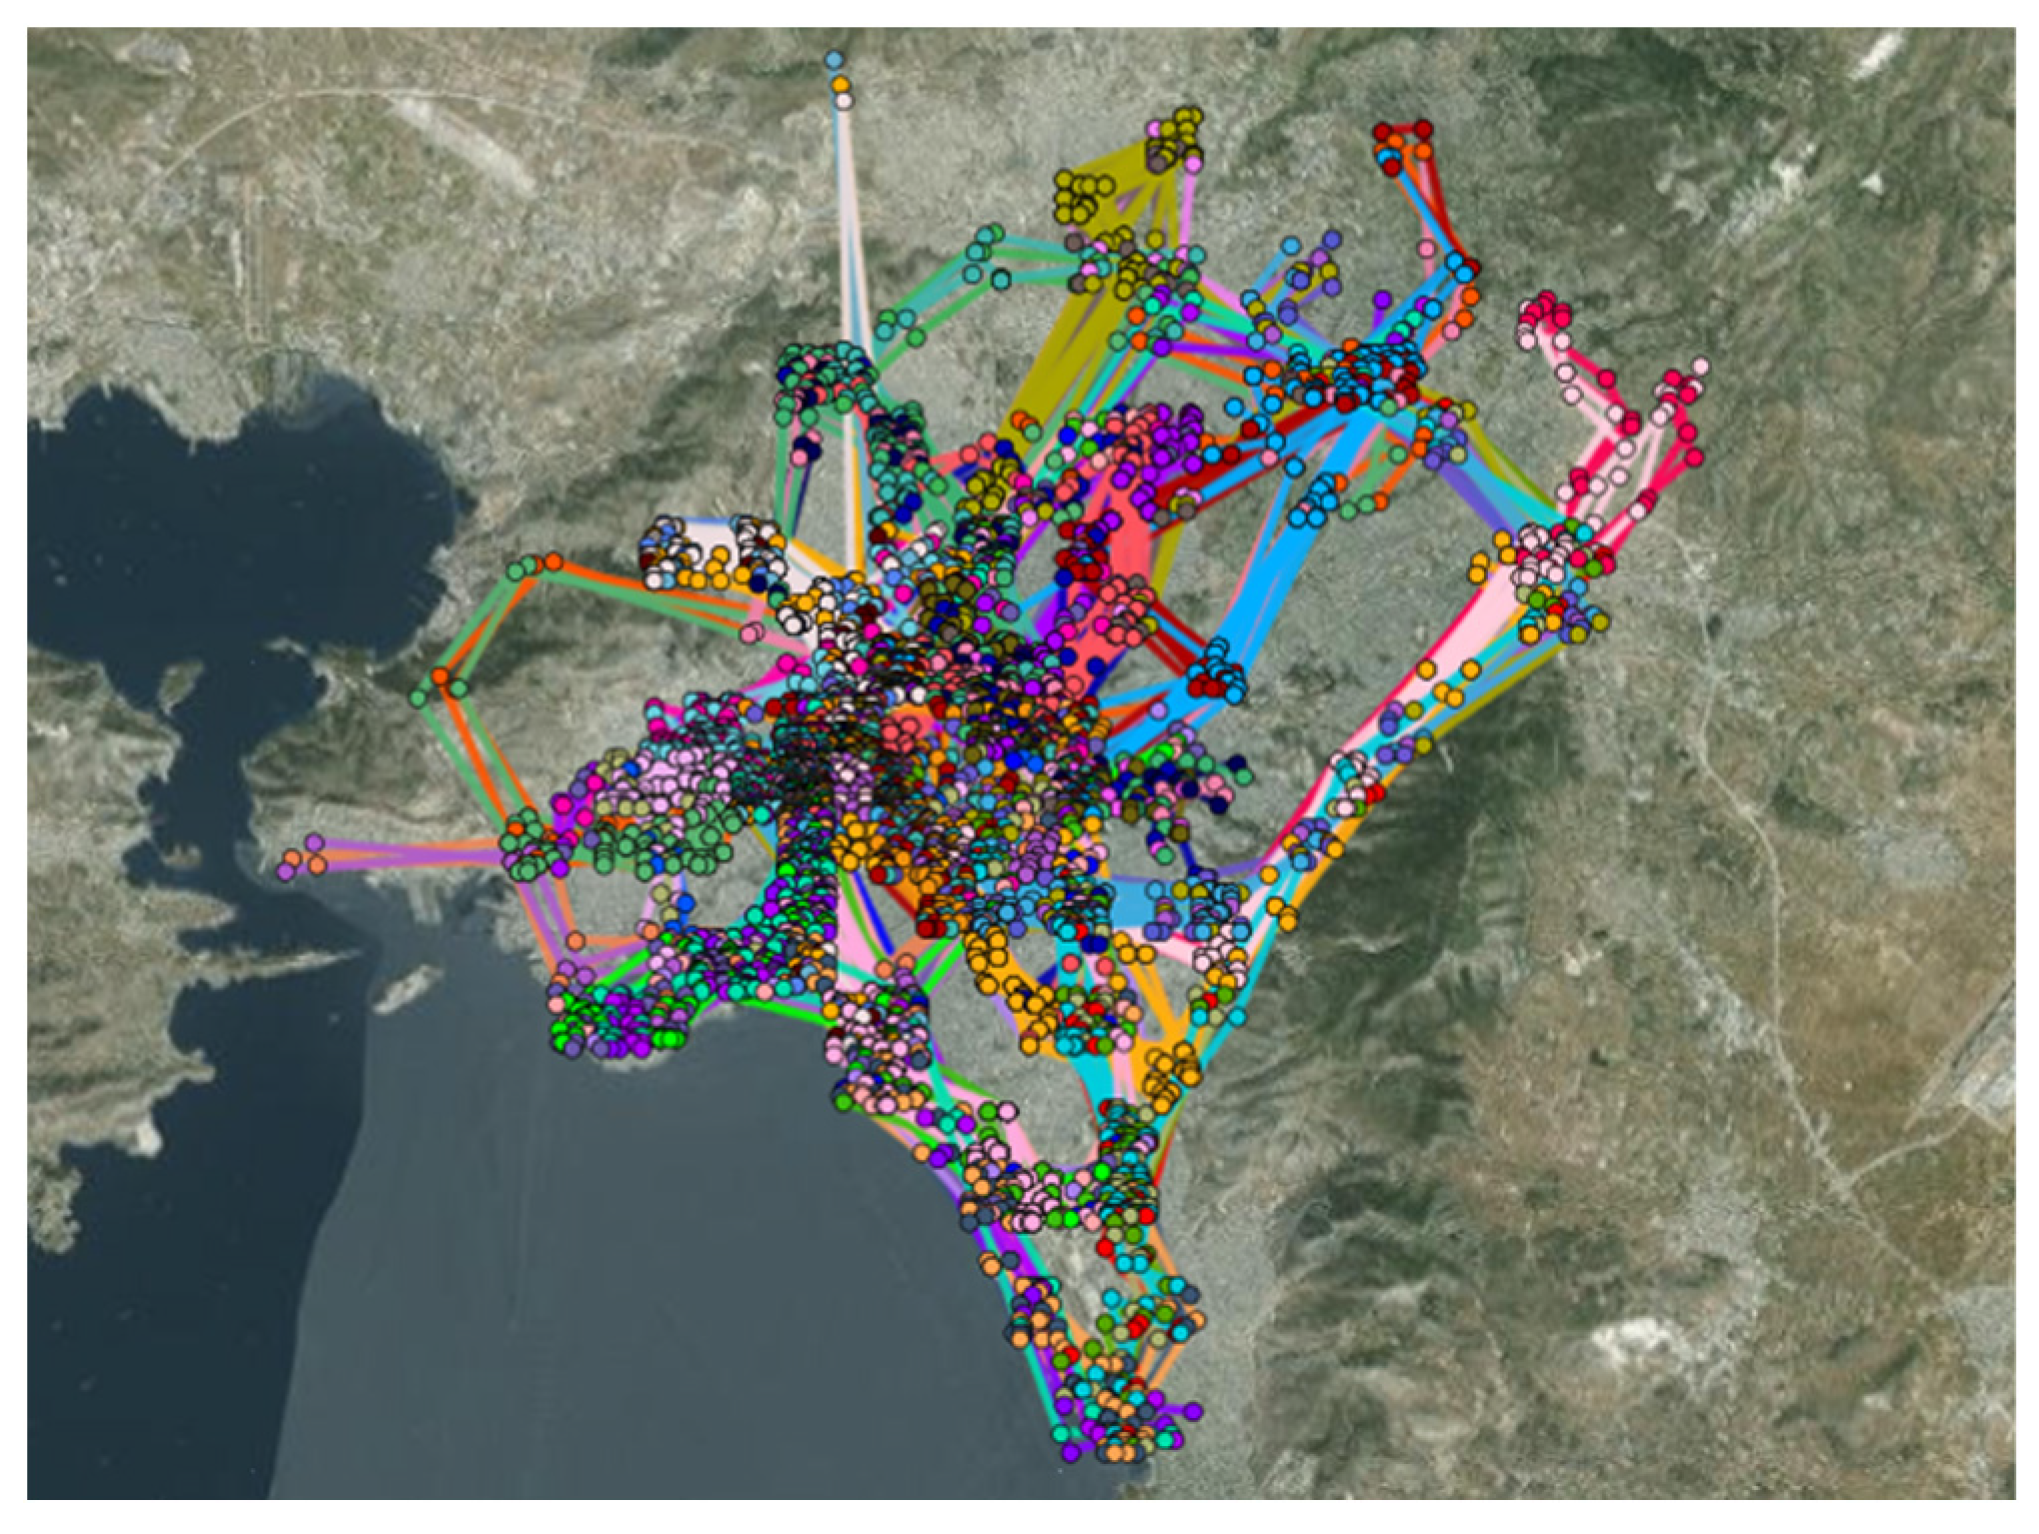
A vehicle ride-sharing algorithm is proposed, which exploits the potentiality of spatial, temporal, and social behavior passengers’ contextual information in a daily life commute route within a city. The proposed research effort provides real solutions to passengers’ routing trips facing emerging daily requirements on real time during a week in the smart city of Athens, Greece. Passengers consent to use services provided by the algorithm. Concretely, real data were collected by passengers during the training phase, who annotated their daily commute route movements in the smart city of Athens, Greece. The annotation of passengers’ data was performed within a range of a week, including the working week, along with the consecutive weekend. Intuitively, this process encodes passengers’ spatial, temporal, and social behavior context into the provided knowledge base. Such features provide the capability of stored stochastic data to be retrieved for similar algorithm invocations by certain passengers’ requirements in the future. Concretely, to a demanding service data encoding process should be performed according to specific instructions given to passengers during the training phase. Subsequently, failure to conform to such instructions results in poor efficiency of the vehicle ride-sharing algorithm, which leads to underutilization of the commute route service during passengers’ daily commute route in the city.
Concretely, it is a fact that the provided data sample does not represent the broader population of ride-sharing users, such as professionals, elderly passengers, or tourists. In addition, observed data are collected exclusively from university students in Athens, Greece, which introduces severe demographic bias. Intuitively, the number of participants (67 students) is too small to validate the effectiveness of the algorithm at a city-wide scale. Subsequently, it is not clear how these biases affect the algorithm’s performance in diverse urban settings. Concretely, it should be noted that, to face such inefficiencies, there was a need for more real data sources. However, the authors did not have enough energy to invite and support more users from other environments except university students at the time that the current research study was conducted. Intuitively, this situation would be faced by having more reach data, including many more participants such as passengers from other social groups, which might optimally treat the problem of bias in diverse urban areas. Concretely, this is a current research limitation, which authors would treat in future research directions and develop to make the proposed system more accessible to a wider audience, thus leading to safer and sound results.
The observed results’ essence of Algorithms 2–4 as presented in this research effort is closely the same. However, results emerged by performing experiments in the real environment, which differentiates the notion of the trend curves indicated in
Figure 3 and
Figure 4, respectively. Concretely, discussing further the results, it can be observed that Algorithms 2–4 have two input values,
and
, which are common to all of them. Intuitively,
, is any user, which may wish to assess the proposed algorithm routing trip services. Concretely, a rider,
, is a specific type of an available passenger,
. Subsequently,
has the role of invoking the algorithm to assess the ride-sharing service. Specifically,
invokes a certain ride for a certain routing trip at a certain time within a specific day of the week. According to proposed reasoning,
triggers the algorithm to invoke a certain routing trip as well as to select specific passengers,
, to share the ride. Intuitively, Algorithms 5–7 have three input variables, where only the
variable is common, since the other two variables are different in each algorithm, in pairs, focusing on certain domain knowledge of spatial (i.e.,
,
), temporal (i.e.,
,
), and social (i.e.,
,
) rider’s context.
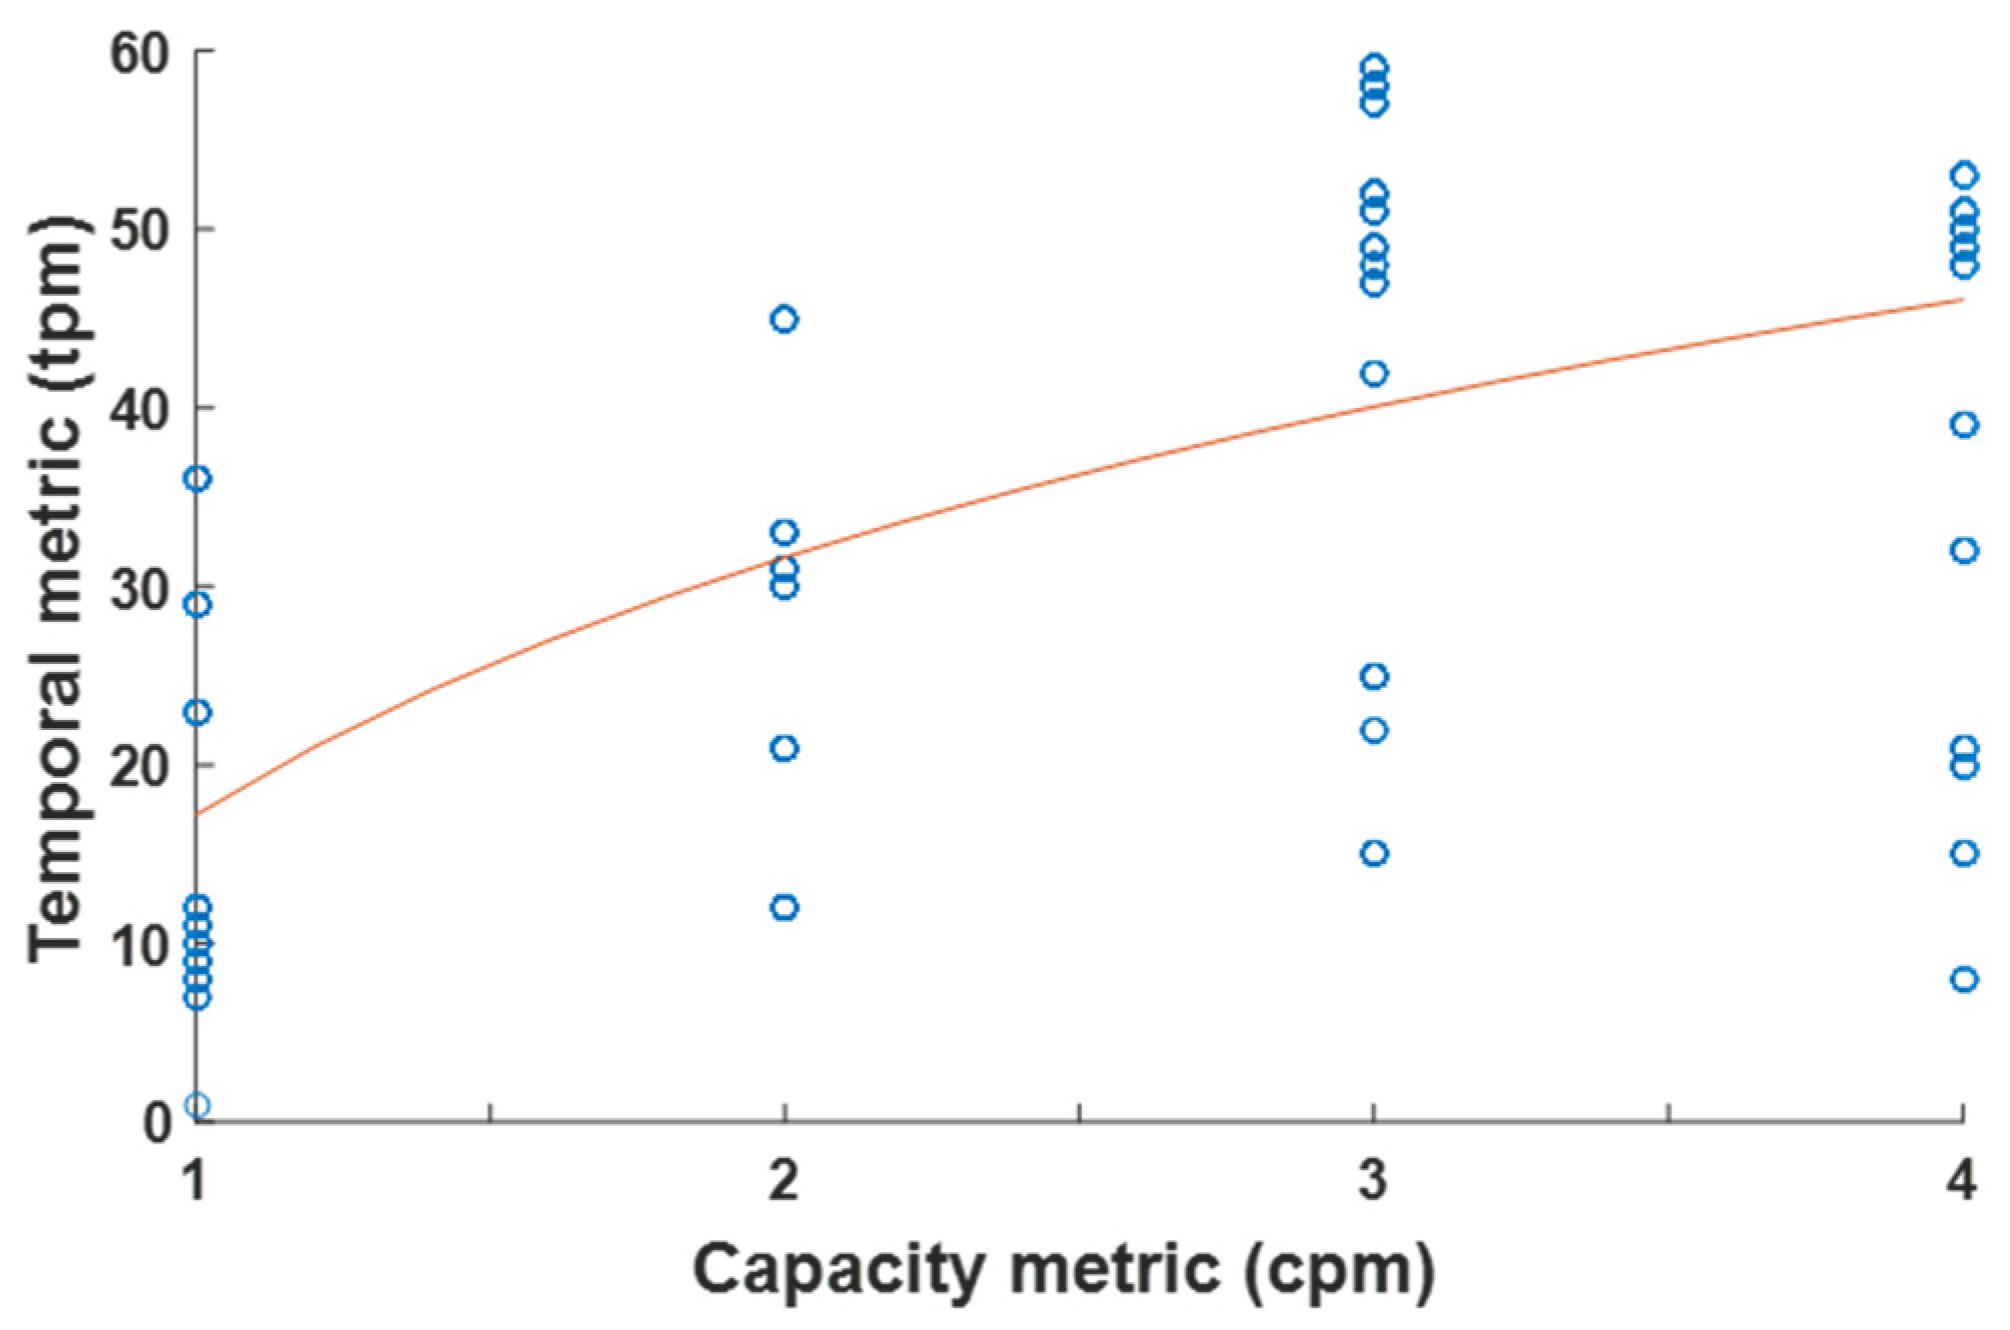
Concretely, observing the trend curves in
Figure 3 and
Figure 4, they may seem the same but actually are slightly different, thus similar, since, in
Figure 3, the relation is visualized between capacity,
, vs. spatial,
, metrics’ values, while, in
Figure 4, the relation is visualized between capacity,
, vs. temporal,
, metrics’ values. The results of
Figure 3 and
Figure 4 are explained and further explored by observing the trend curve of
Figure 5, which visualizes the relation between temporal,
, vs. spatial,
, metrics’ values. Specifically, the trend curve in
Figure 5 is not a linear trend line but rather a logarithmic trend curve, which means that temporal,
, vs. spatial,
, do not have a linear relation. Intuitively, trend curves of all
Figure 3,
Figure 4,
Figure 5,
Figure 6,
Figure 7,
Figure 8,
Figure 9 and
Figure 10 are not linear trend lines but rather logarithmic trend curves, which means that, for a specific rider’s,
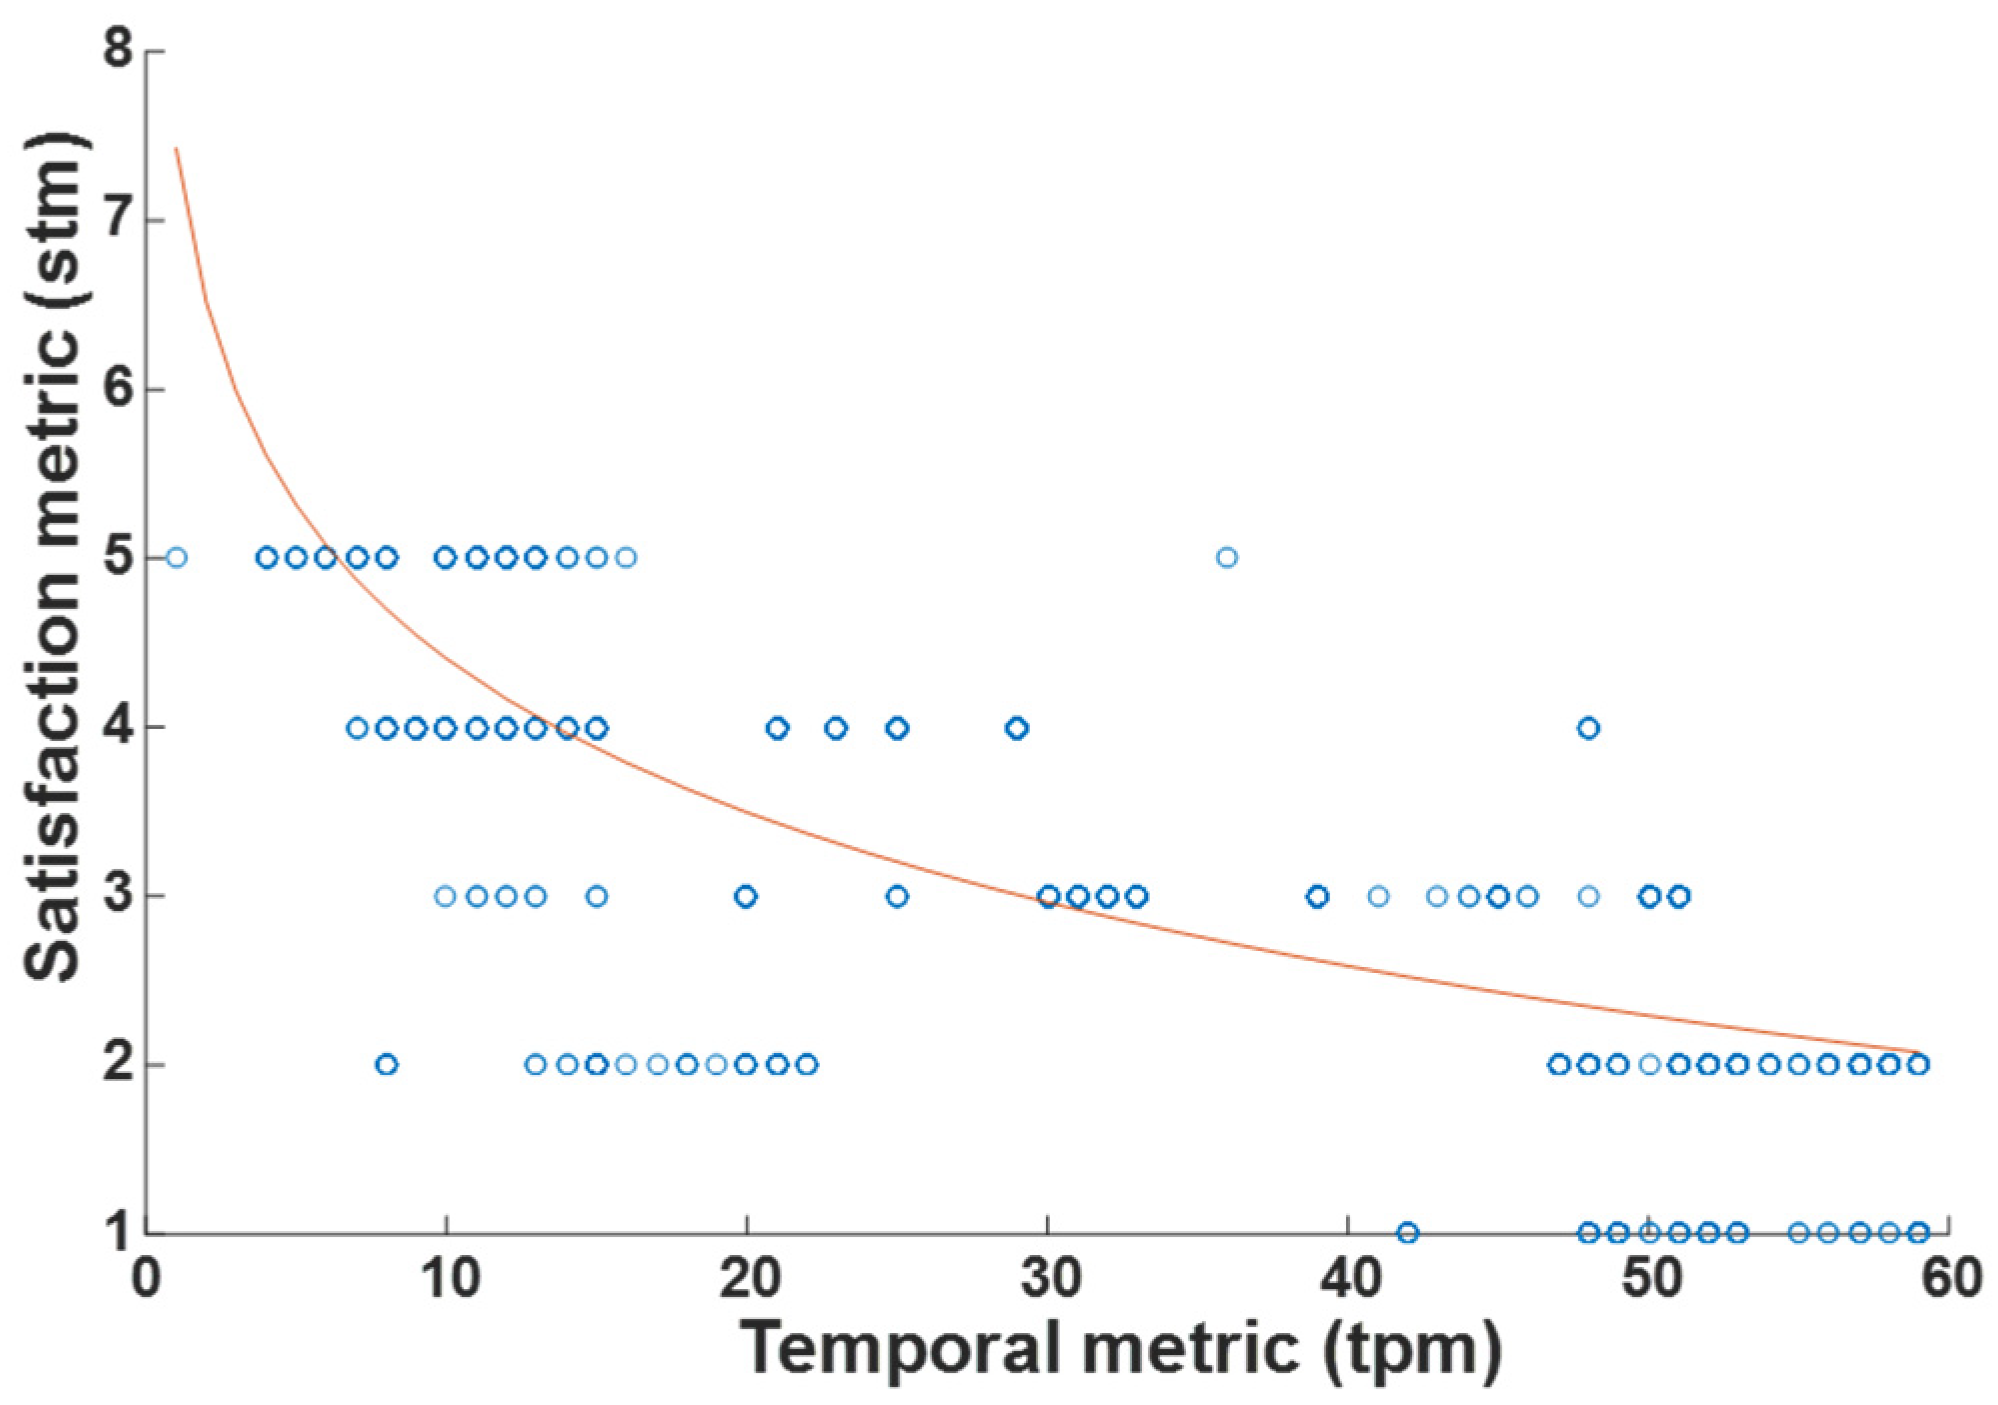
, invocation for a certain ride of a specific routing trip at a given time within a certain day of the week, the output variables, i.e., the observed metrics’ values, have non-linear relations. Instead, since data sources used are from real users who express the non-linearity of the physical world.
Intuitively, the presentation of Algorithms 2–4 could be performed by using a flowchart and not a pseudocode as adopted in the current research study since these algorithms especially are all using the same inputs, i.e., and . This type of presentation with the use of a flowchart diagram could also be applied for all Algorithms 1–7. Initially, it might seem to be an interesting presentation form; however, this form of presentation (i.e., by adopting flowcharts) is mostly abstract, as flowcharts use symbols and text to represent the main steps and logic of an algorithm. Instead, pseudocode is less abstract, as it uses natural language and some programming concepts to describe the details and logic of the adopted algorithms, thus providing the reader with a tool to easily convert the observed algorithm to a program according to a programming language that they are familiar with. Concretely, by combining all the proposed algorithms to a flowchart diagram, it might be much more difficult to observe, in deep detail, regarding the logic represented as well as further transformation efforts required to encode it into a program that could result in a less easy task.
Intuitively, the current research effort implicitly treats the dynamic traffic conditions (e.g., congestion, detours, road closures), which indicates that such conditions are not incorporated explicitly during the spatial, temporal, and social matching phase. However, this is an issue that will be examined in future research work to provide a more robust model able to be adopted by real world ride-sharing services. In addition, this proposed research study does not test how the algorithm reacts to variations in passengers’ demand, unexpected ride cancelations, or varying vehicle fleet sizes, since, in the context of the current work, such inefficiencies were not considered. This is a limitation, which will be treated in the next research directions and further development. Concretely, in this research study, cases were not observed where the ride demands exceeded the vehicle supply. Subsequently, this is a research area that needs more consideration to be examined in further detail in future research studies.
Although the ride-sharing algorithm evaluated with real data provided by passengers, which cover a significant spatial, temporal, and social mobility area of their activity in the smart city, there is also a need to collect more detailed data. Specifically, more spatial data should be retrieved by additional passengers, who will consent to use the algorithm’s potentiality, thus covering a wider area of the provided ride-sharing service in the spatial area of the entire smart city. Intuitively, there is also a need to provide more temporal data to exploit excessive daily life activities in the city within a period of 24 h per 7 days a week of passengers’ observed context. Concretely, more passengers’ social data should be collected, thus enabling the ride-sharing algorithm to be integrated in a wider range of an efficient social mobility service. Such rich behavioral context should be able to cover additional social movement requirements of a variety of unique passengers’ personalities in the smart city. Intuitively, social context would be enriched with more detailed information, such as containing more insights for each of the predefined categories expressed as subcategories of a certain social category. Subsequently, an example might be to include more data in a sport’s contextual information, such as what types of sports that a passenger is interested in (i.e., football and/or basketball sports), as well as an internal ranking of interest for the specified sport subcategories (i.e., prefer football more than basketball), or, even further, what are the favorite sports’ teams affiliated with (i.e., in football, a passenger’s preference is Chelsea, while, in basketball, a passenger’s preference is London Lions).
Comparison with Other Algorithms
Proposed algorithms are compared with other algorithms in the literature to indicate their strengths and weaknesses for future research purposes and further development. Specifically, comparison performed with the algorithms presented in the research studies of [
35,
36,
37]. The comparison algorithms are as follows: (1) Multi-Agent Transport Simulation (MATSim) presented in the study of [
35], (2) Latent Dirichlet Allocation (LDA) presented in the study of [
36], and (3) Metropolitan Activity Relocation Simulator (MARS) presented in the study of [
37], respectively. Each algorithm exploits the potentiality of spatial, temporal, social, and capacity context, which is minimum contextual requirements for a fare comparison. Concretely, comparison parameters are the following: (1) execution environment (i.e., denoted as P1, which stands for parameter number one), (2) data incorporated in the experiments (i.e., denoted as P2), (3) satisfaction metric (i.e., denoted as P3), (4) sentiment context analyses (i.e., denoted as P4), (5) environmental road conditions (i.e., denoted as P5), (6) coverage area (i.e., denoted as P6), (7) detour handling (i.e., denoted as P7), (8) traffic congestion faced (i.e., denoted as P8), (9) user fees required for the commute route (i.e., denoted as P9), and (10) proposed policies emerged (i.e., denoted as P10).
Subsequently, each comparison parameter takes certain encoded values. The execution environment (i.e., P1) could have the following values: (1) simulation (i.e., denoted as 1, which stands for value one) or (2) real-time and online execution (i.e., denoted as 2). Data (i.e., P2) may have the following values: (1) synthetic (i.e., denoted as 1) or (2) real (i.e., denoted as 2). Satisfaction (i.e., P3) would be either of the following: (1) there is no satisfaction information provided (i.e., denoted as 1) or (2) yes, there is satisfaction information provided (i.e., denoted as 2). Sentiment analyses (i.e., P4) are either of the following: (1) there is no sentiment analysis information provided (i.e., denoted as 1) or (2) yes, sentiment analysis information is provided (i.e., denoted as 2). Environmental road conditions (i.e., P5) could have the following values: (1) no information about road conditions provided (i.e., denoted as 1) or (2) yes, information about road conditions is provided (i.e., denoted as 2). Coverage areas (i.e., P6) may have the following values: (1) urban areas are used for the experiments (i.e., denoted as 1) or (2) rural areas are used for the experiments (i.e., denoted as 2). Detour information (i.e., P7) could be either of the following: (1) detour is not handled (i.e., denoted as 1) or (2) yes, detour is handled (i.e., denoted as 2). Traffic congestion (i.e., P8) would have the following values: (1) traffic congestion is not investigated (i.e., denoted as 1) or (2) yes, traffic congestion is investigated (i.e., denoted as 2). User fees (i.e., P9) could be either of the following: (1) not examined (i.e., denoted as 1) or (2) yes, they are examined (i.e., denoted as 2). Intuitively, the policies proposed (i.e., P10) can have the following values: (1) they are not investigated (i.e., denoted as 1) or (2) yes, they are investigated (i.e., denoted as 2). Comparison of the algorithms based on certain parameters is presented in
Table 4, where the current research effort algorithm is denoted as [AL].
Concretely, it could be observed that the proposed algorithm of the current research study has certain strengths and weaknesses. Among the strengths of the algorithm is that it is the only algorithm, compared with others, that was executed in real time and an online execution environment. In addition, it incorporated only real data, which enhanced its validity over the other algorithms, although the algorithm proposed in the study of [
37] also uses partially real and simulated data sources. The satisfaction metric is evaluated by the proposed algorithm along with the algorithm proposed in the study of [
36]. However, the adopted algorithm does not exploit the potentiality of sentiment analyses, which, however, is only exploited by the algorithm in the study of [
36]. Environmental road conditions are among the weaknesses of the proposed algorithm, and this is a future issue for further analyses and research development. Regarding the coverage area, the algorithm supports experimentation in both urban and rural spatial areas. Detour handling and traffic congestion comparison parameters are treated implicitly in the current research effort. This is a strength; however, more research is needed to incorporate such a parameter explicitly in future work. User fees are considered in the current study since commute routes were engaged among university students. However, in future work where the algorithm will be tested with a vast number of participants, such parameters should be treated in deep detail. Regarding emerging policies, the proposed algorithm does not incorporate any development in the current state, which is a weakness that will be faced in future research work.
5. Conclusions
The current research effort introduces a vehicle ride-sharing algorithm, which incorporates certain spatial, temporal, and social behavior context restrictions to propose a satisfactory routing trajectory that serves the daily needs of smart city passengers. Real solutions to passengers’ routing trips are provided, which aim to face emerging daily requirements in real time during a week in the smart city of Athens, Greece. Concretely, passengers consent to use services provided by the algorithm. Intuitively, real data sources were collected by passengers during the training phase, who annotated their daily commute route movements in the smart city of Athens, Greece. The proposed ride-sharing algorithm is evaluated experimentally based on specific evaluation metrics assessing its efficiency with regard to certain spatial, temporal, social, capacity, and satisfaction contexts. Subsequently, there are proposed certain spatial, temporal, and social matching distance functions, which define specific spatial, temporal, and social matching similarity thresholds of passengers’ social mobility behavior. Intuitively, a routing trajectory output for certain smart city commuters’ trip is proposed by the vehicle ride-sharing algorithm, which is based on the adopted matching distance functions and defined matching thresholds. Concretely, the evaluation process has impact on the adoption of the proposed algorithm in areas of the vehicle ride-sharing commute in environments beyond smart cities.
Concretely, it should be noted that the current research effort had limited energy (i.e., a rather small number of students that engaged voluntarily in this study) available to use for affiliating with other ride-sharing algorithms such as those incorporated by vehicle ride-sharing companies like Uber POOL, Lif Line, and Didi Hitch, which have access to a vast population of users in a global level. So, the results are significant in this domain case study since they are derived from experiments conducted in the physical world, but there is a need to generalize to a vast population of users who will be able to use the services of other ride-sharing algorithm services as well. This is a significant issue, which should be addressed in consecutive work with energy that would be acquired and designed to be provided in the future research effort directions. Intuitively, in the current research study, it is observed that more passenger capacity per certain commute rode results in lower service satisfaction. However, more experiments with other ride-sharing services should be performed, such as Uber POOL to be able to generalize the observed results in scaling environments. Specifically, the authors believe that such a generalization should be performed with high precision since, when handling soft system architecture parameters, such as social context and user satisfaction metrics, research must consider cultural ethics and native behaviors, which is also an interesting issue for future research treatments and developments to be explored.


