
Influence of Differentiated Tolling Strategies on Route Choice Behavior of Heterogeneous Highway Users


Abstract
1. Introduction
2. Literature Review
2.1. User Heterogeneity
2.2. Factors Influencing Travel Route Choice
2.3. Willingness to Pay
2.4. Modeling
2.5. Summary
3. Methodology
3.1. Travel Option Selection Considering Utility
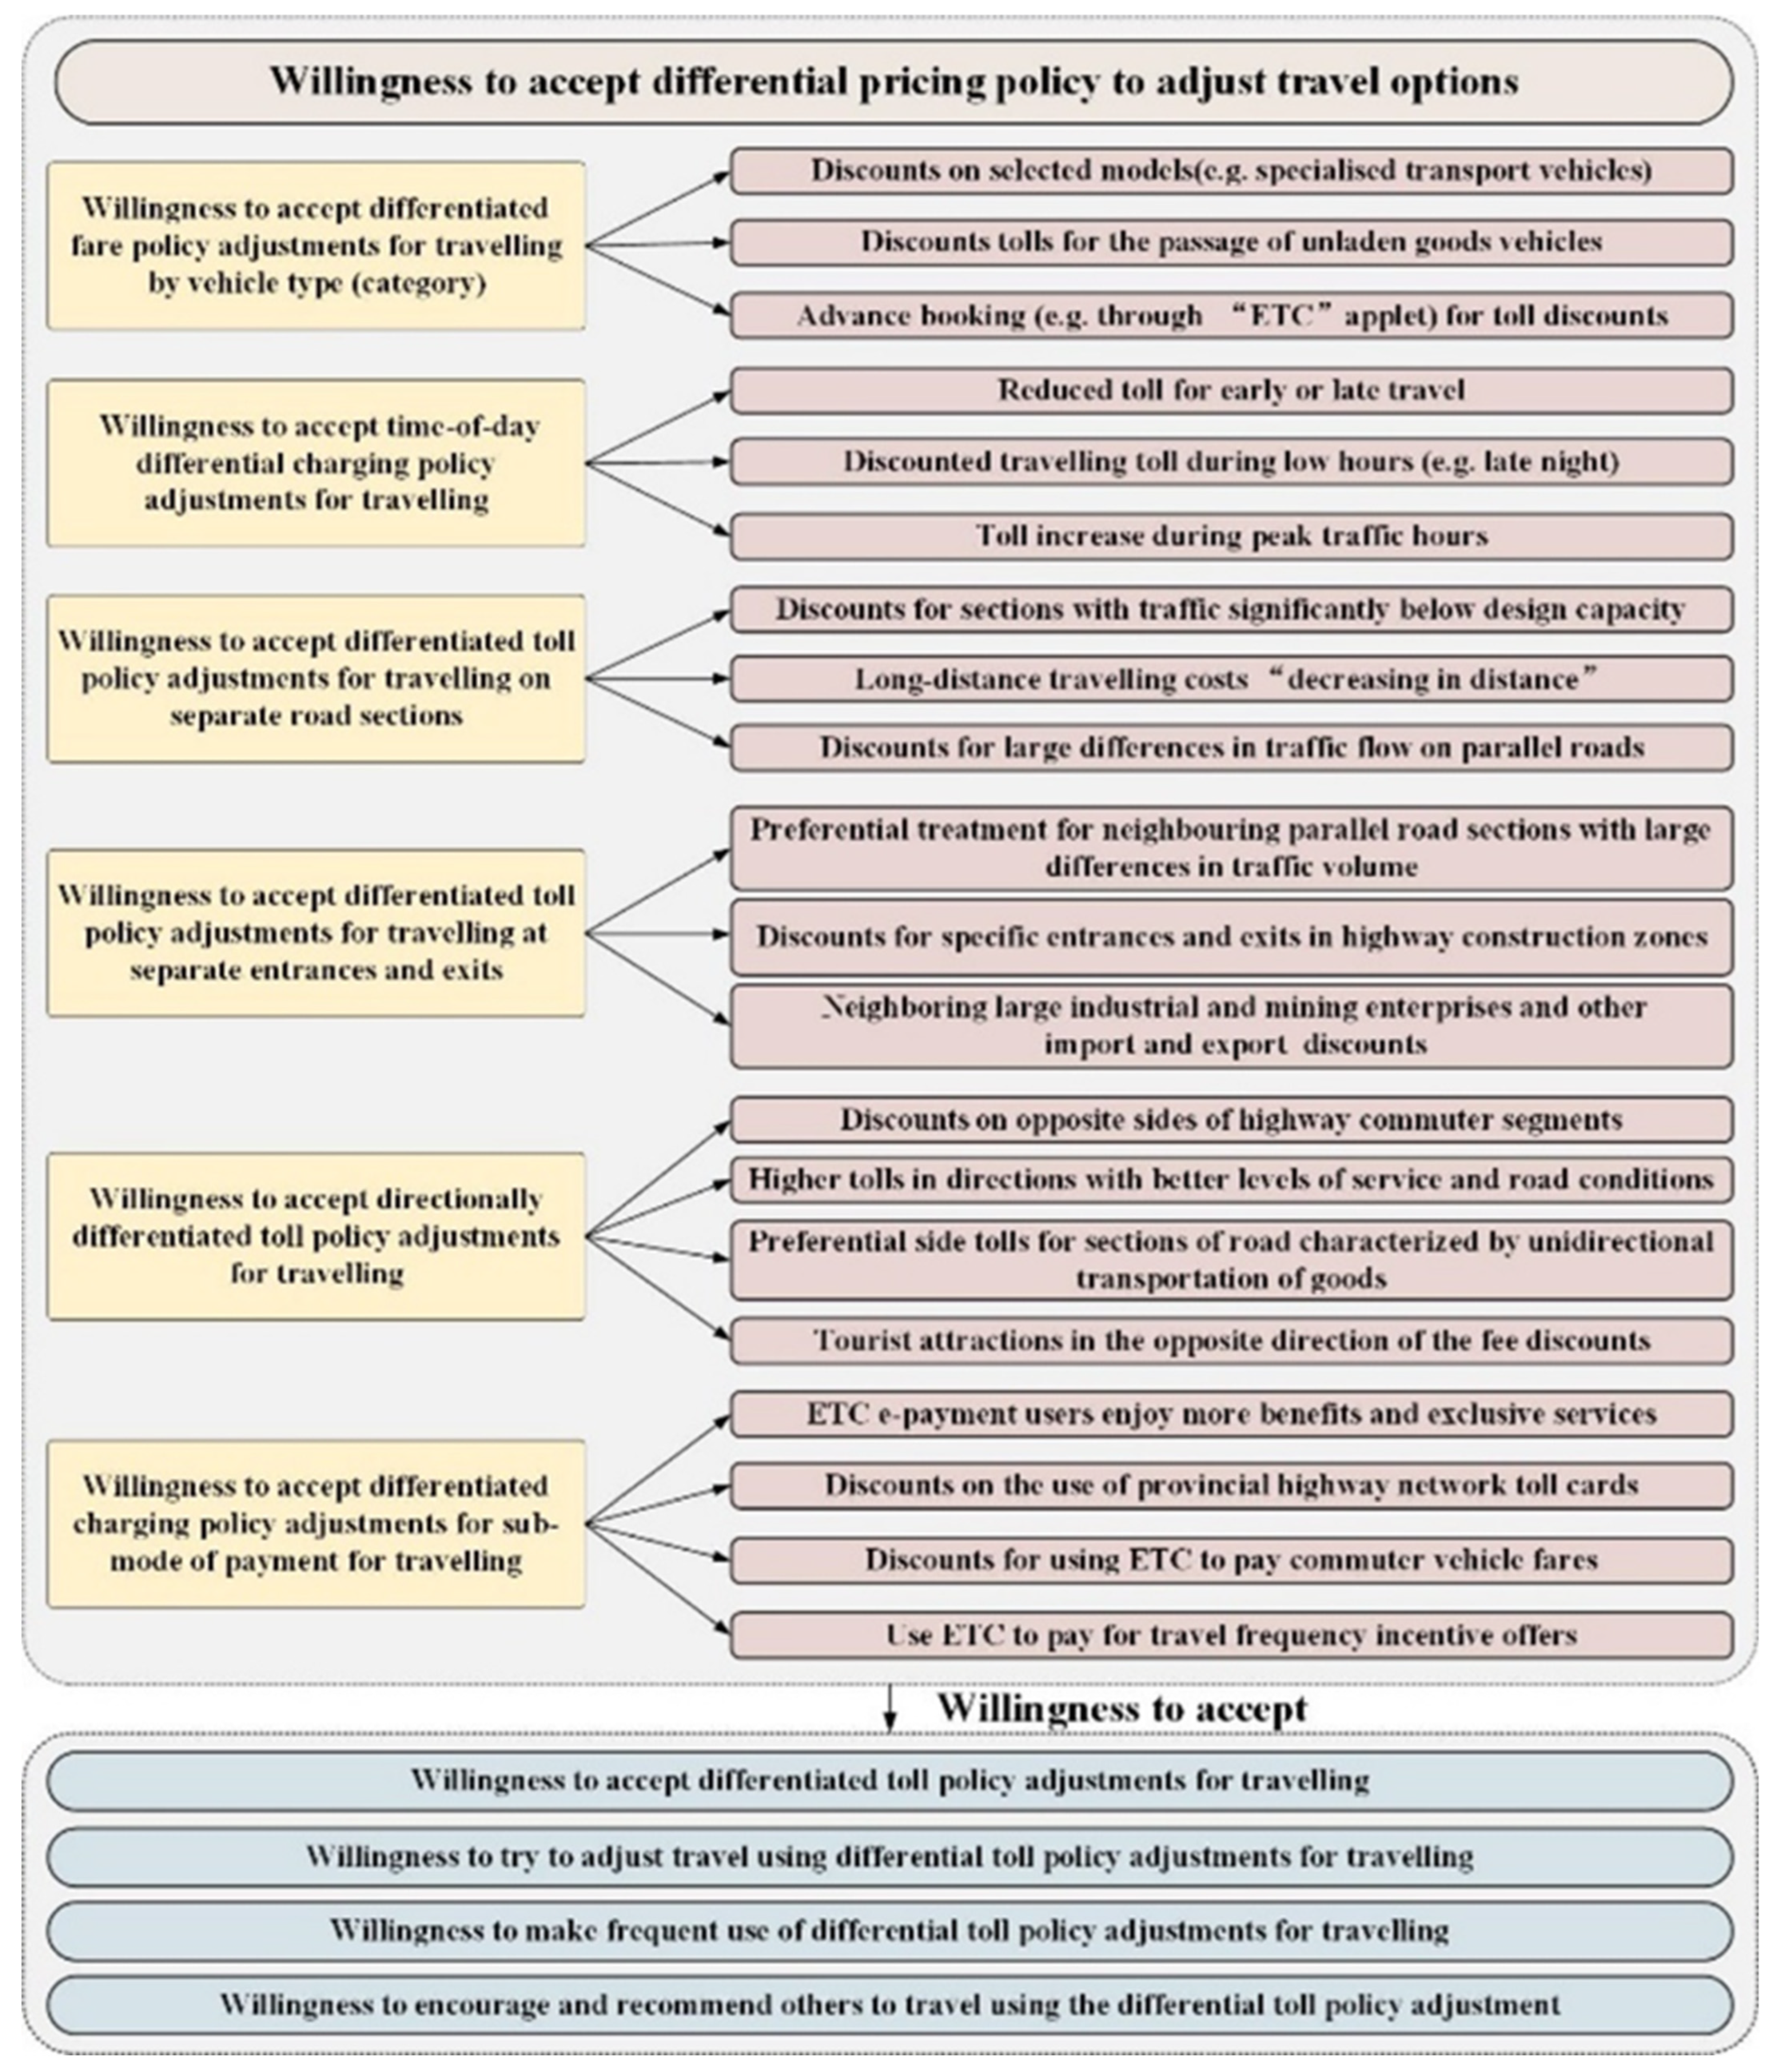
3.2. Questionnaire Survey
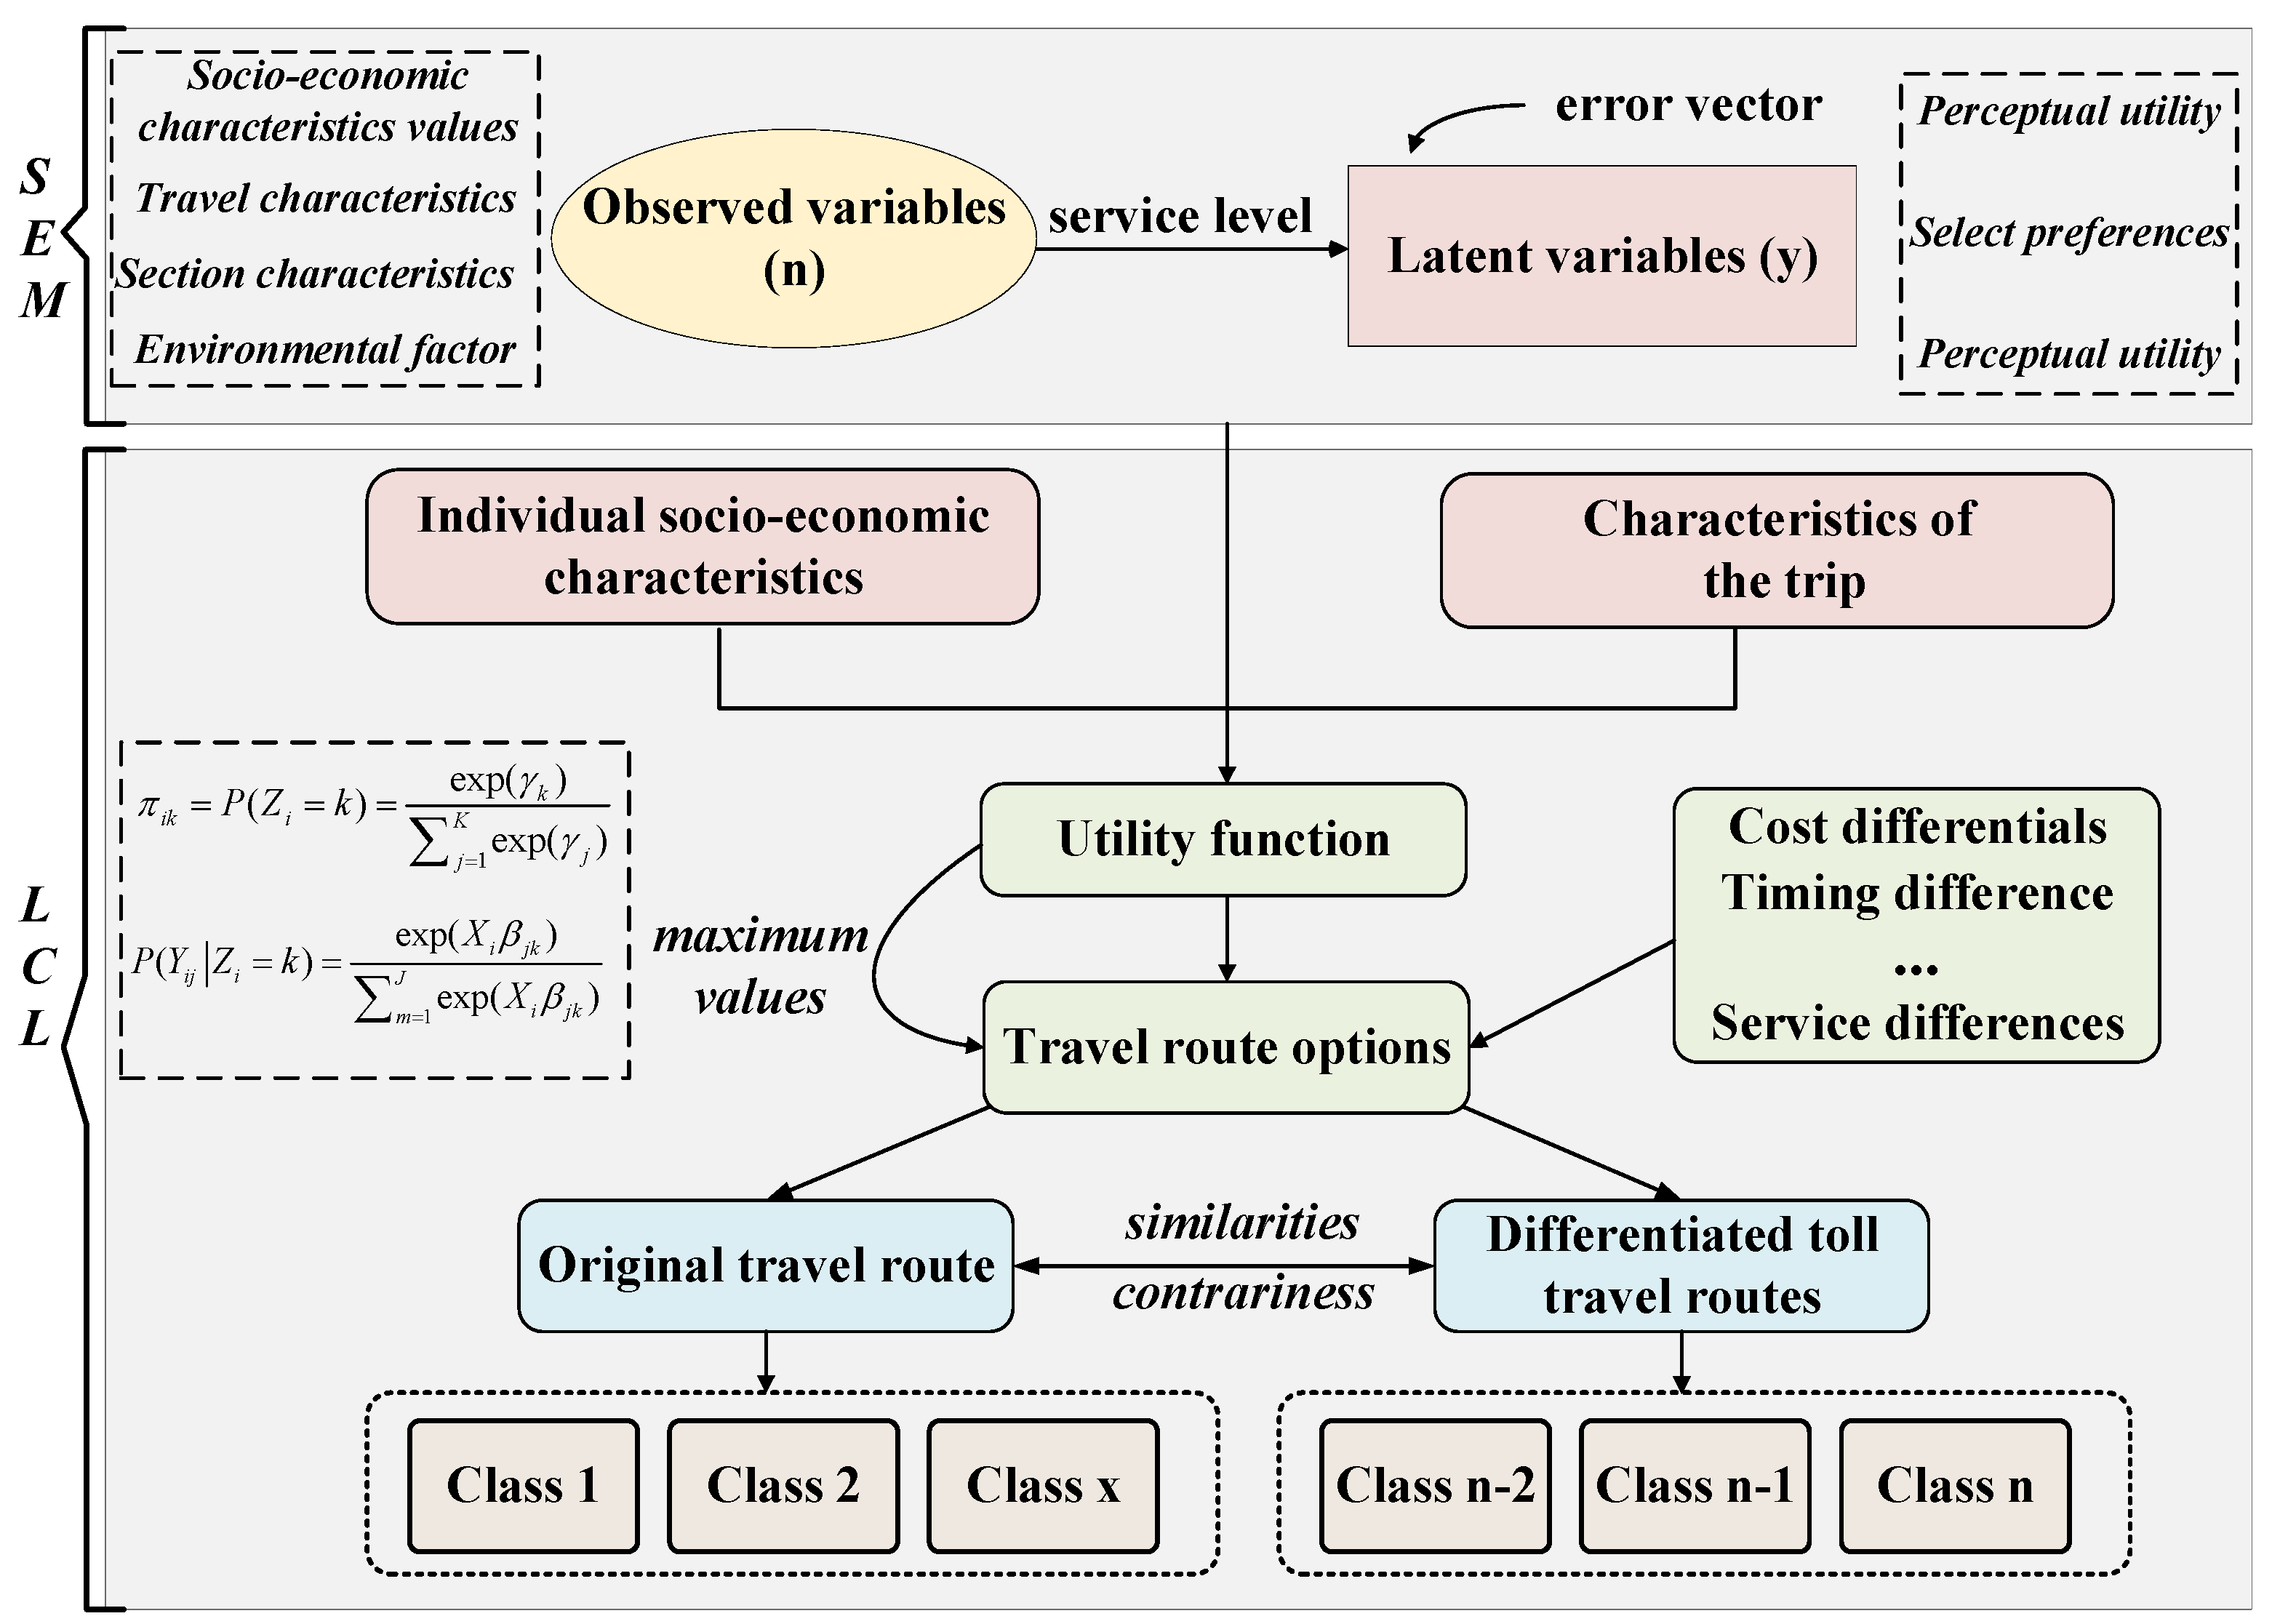
3.3. Modeling Framework
3.4. Factors Influencing Choice Preferences
4. Case Study
4.1. Data Collection
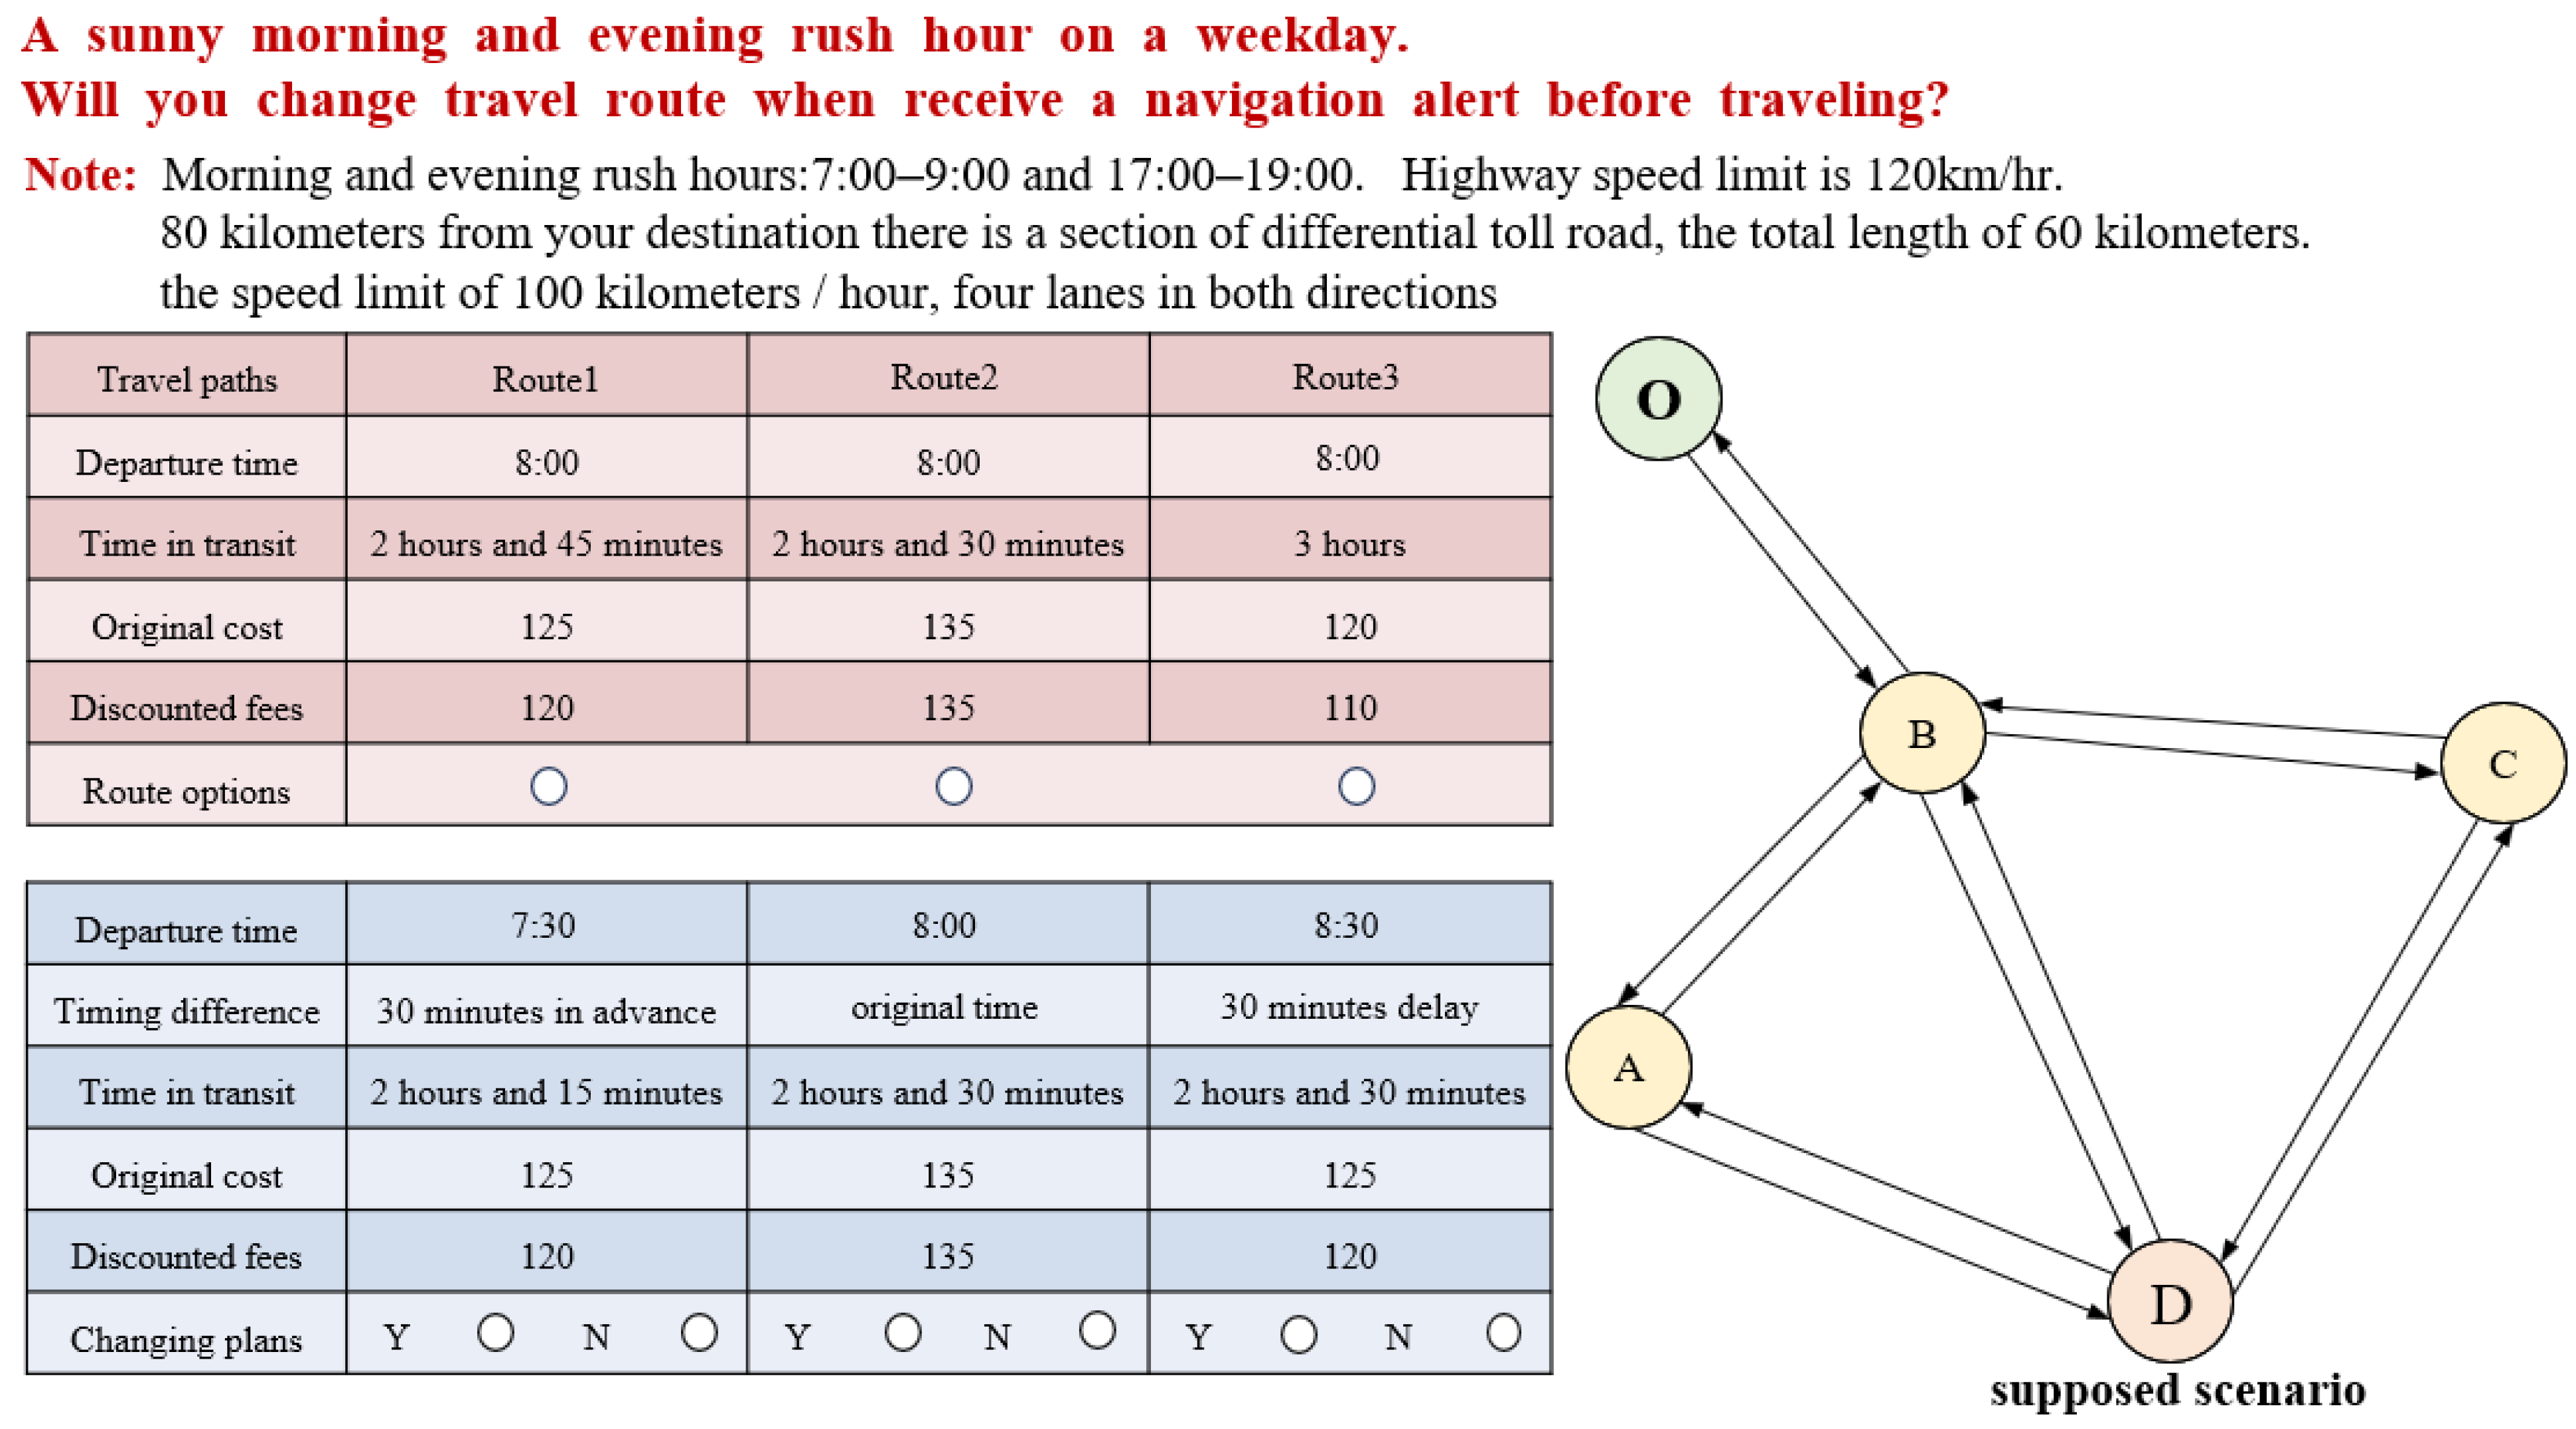
4.2. Research Scenario
4.3. Data Description
4.4. Model Fitness
4.4.1. SEM Model
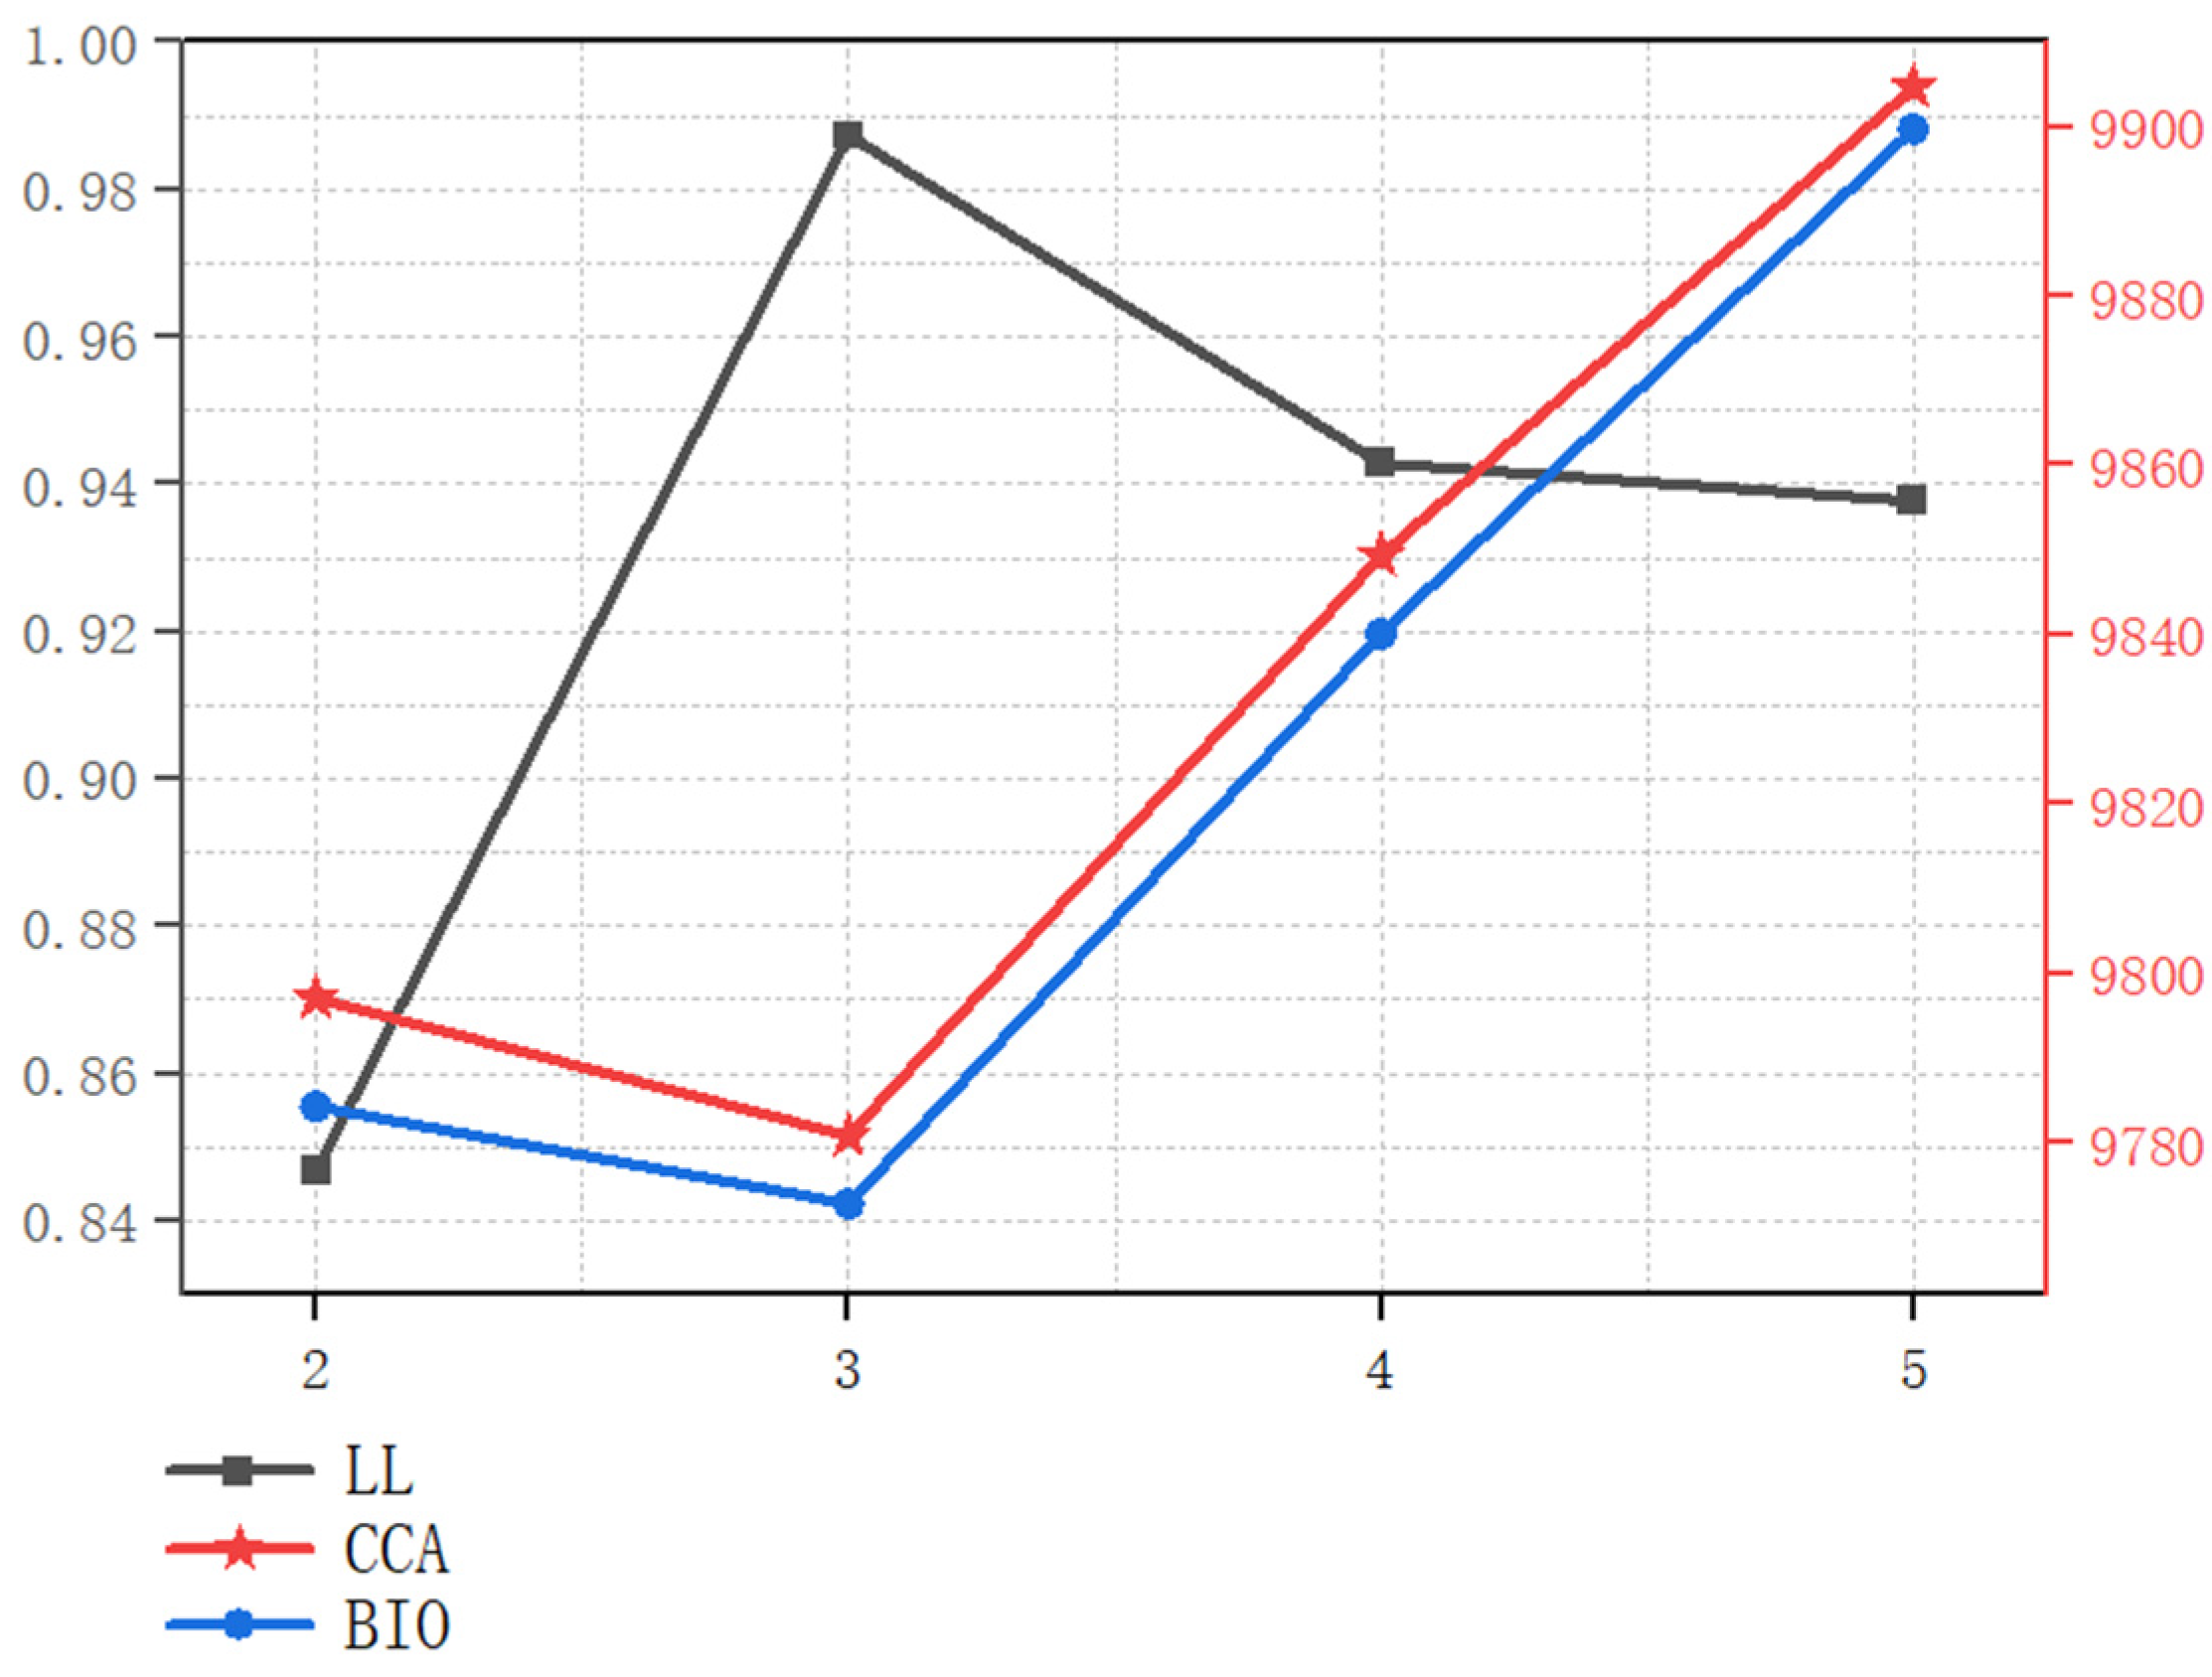
4.4.2. LCL Model
5. Model Results and Discussion
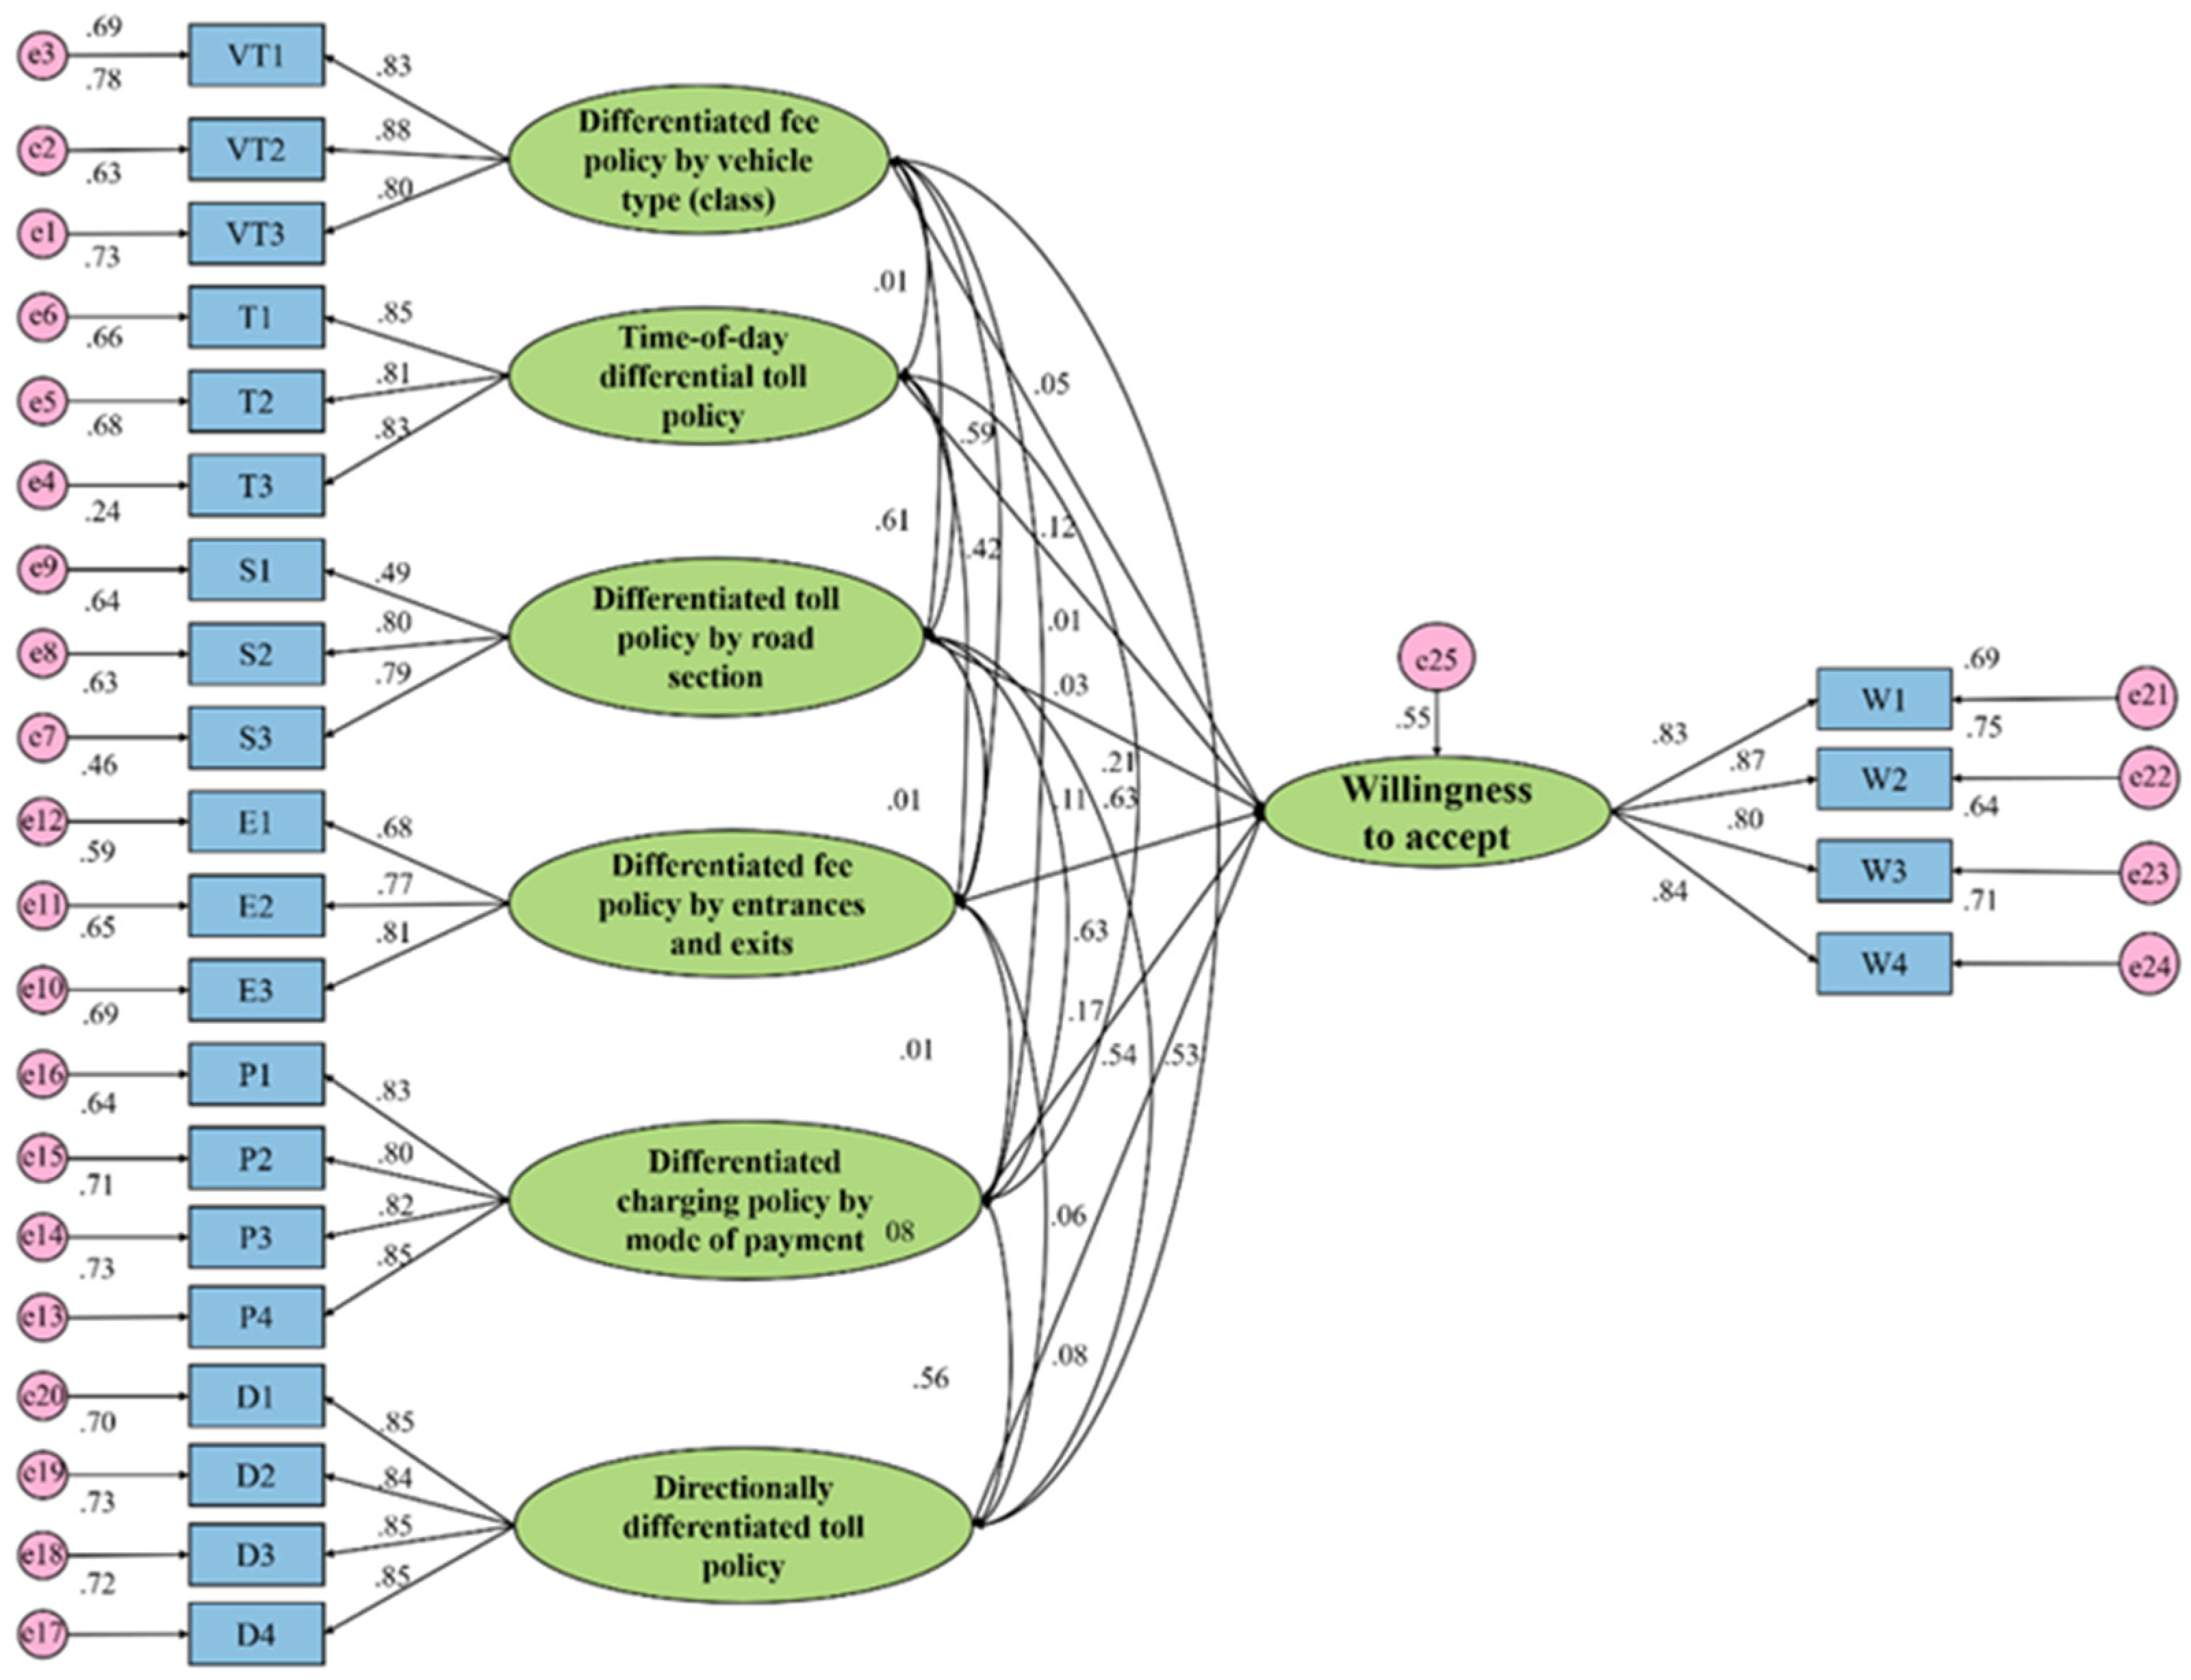
5.1. SEM Model Analysis
5.2. LCL Model Analysis
5.2.1. Analysis of Socio-Economic Characteristics
5.2.2. Analysis of Trip Characteristics
5.3. Policy Implications
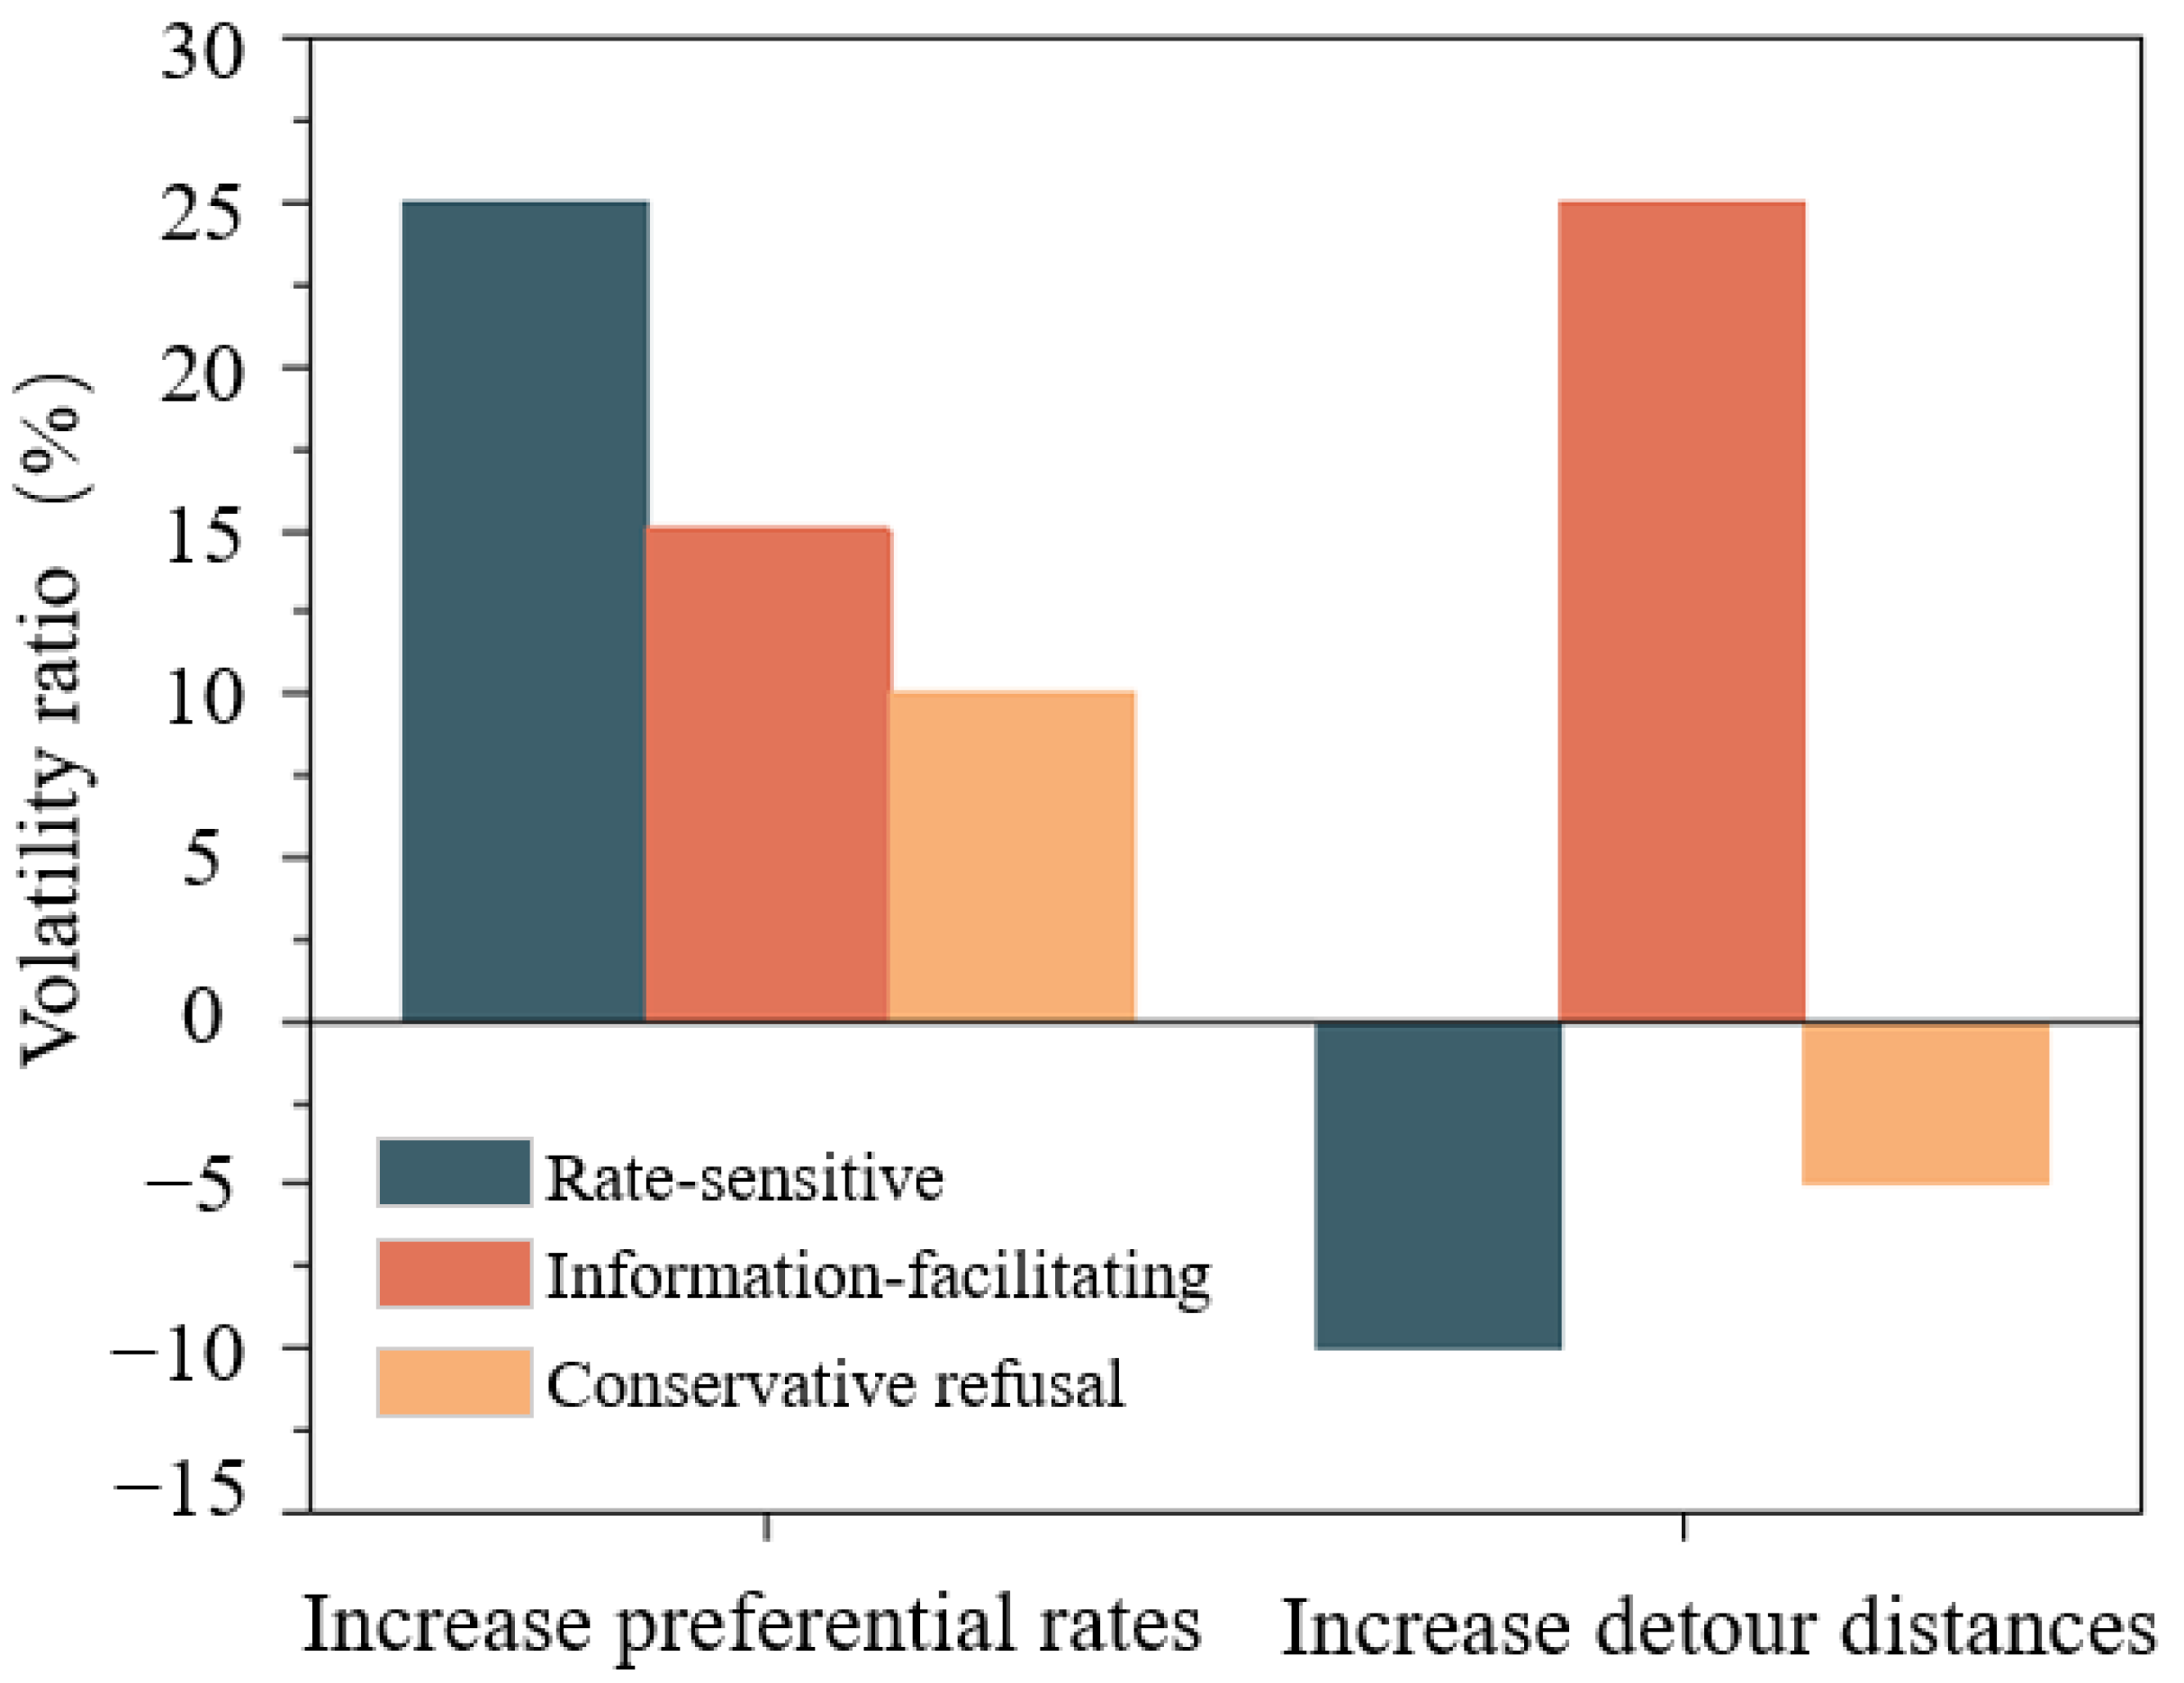
5.3.1. Transfer Intentions Under Different Rates
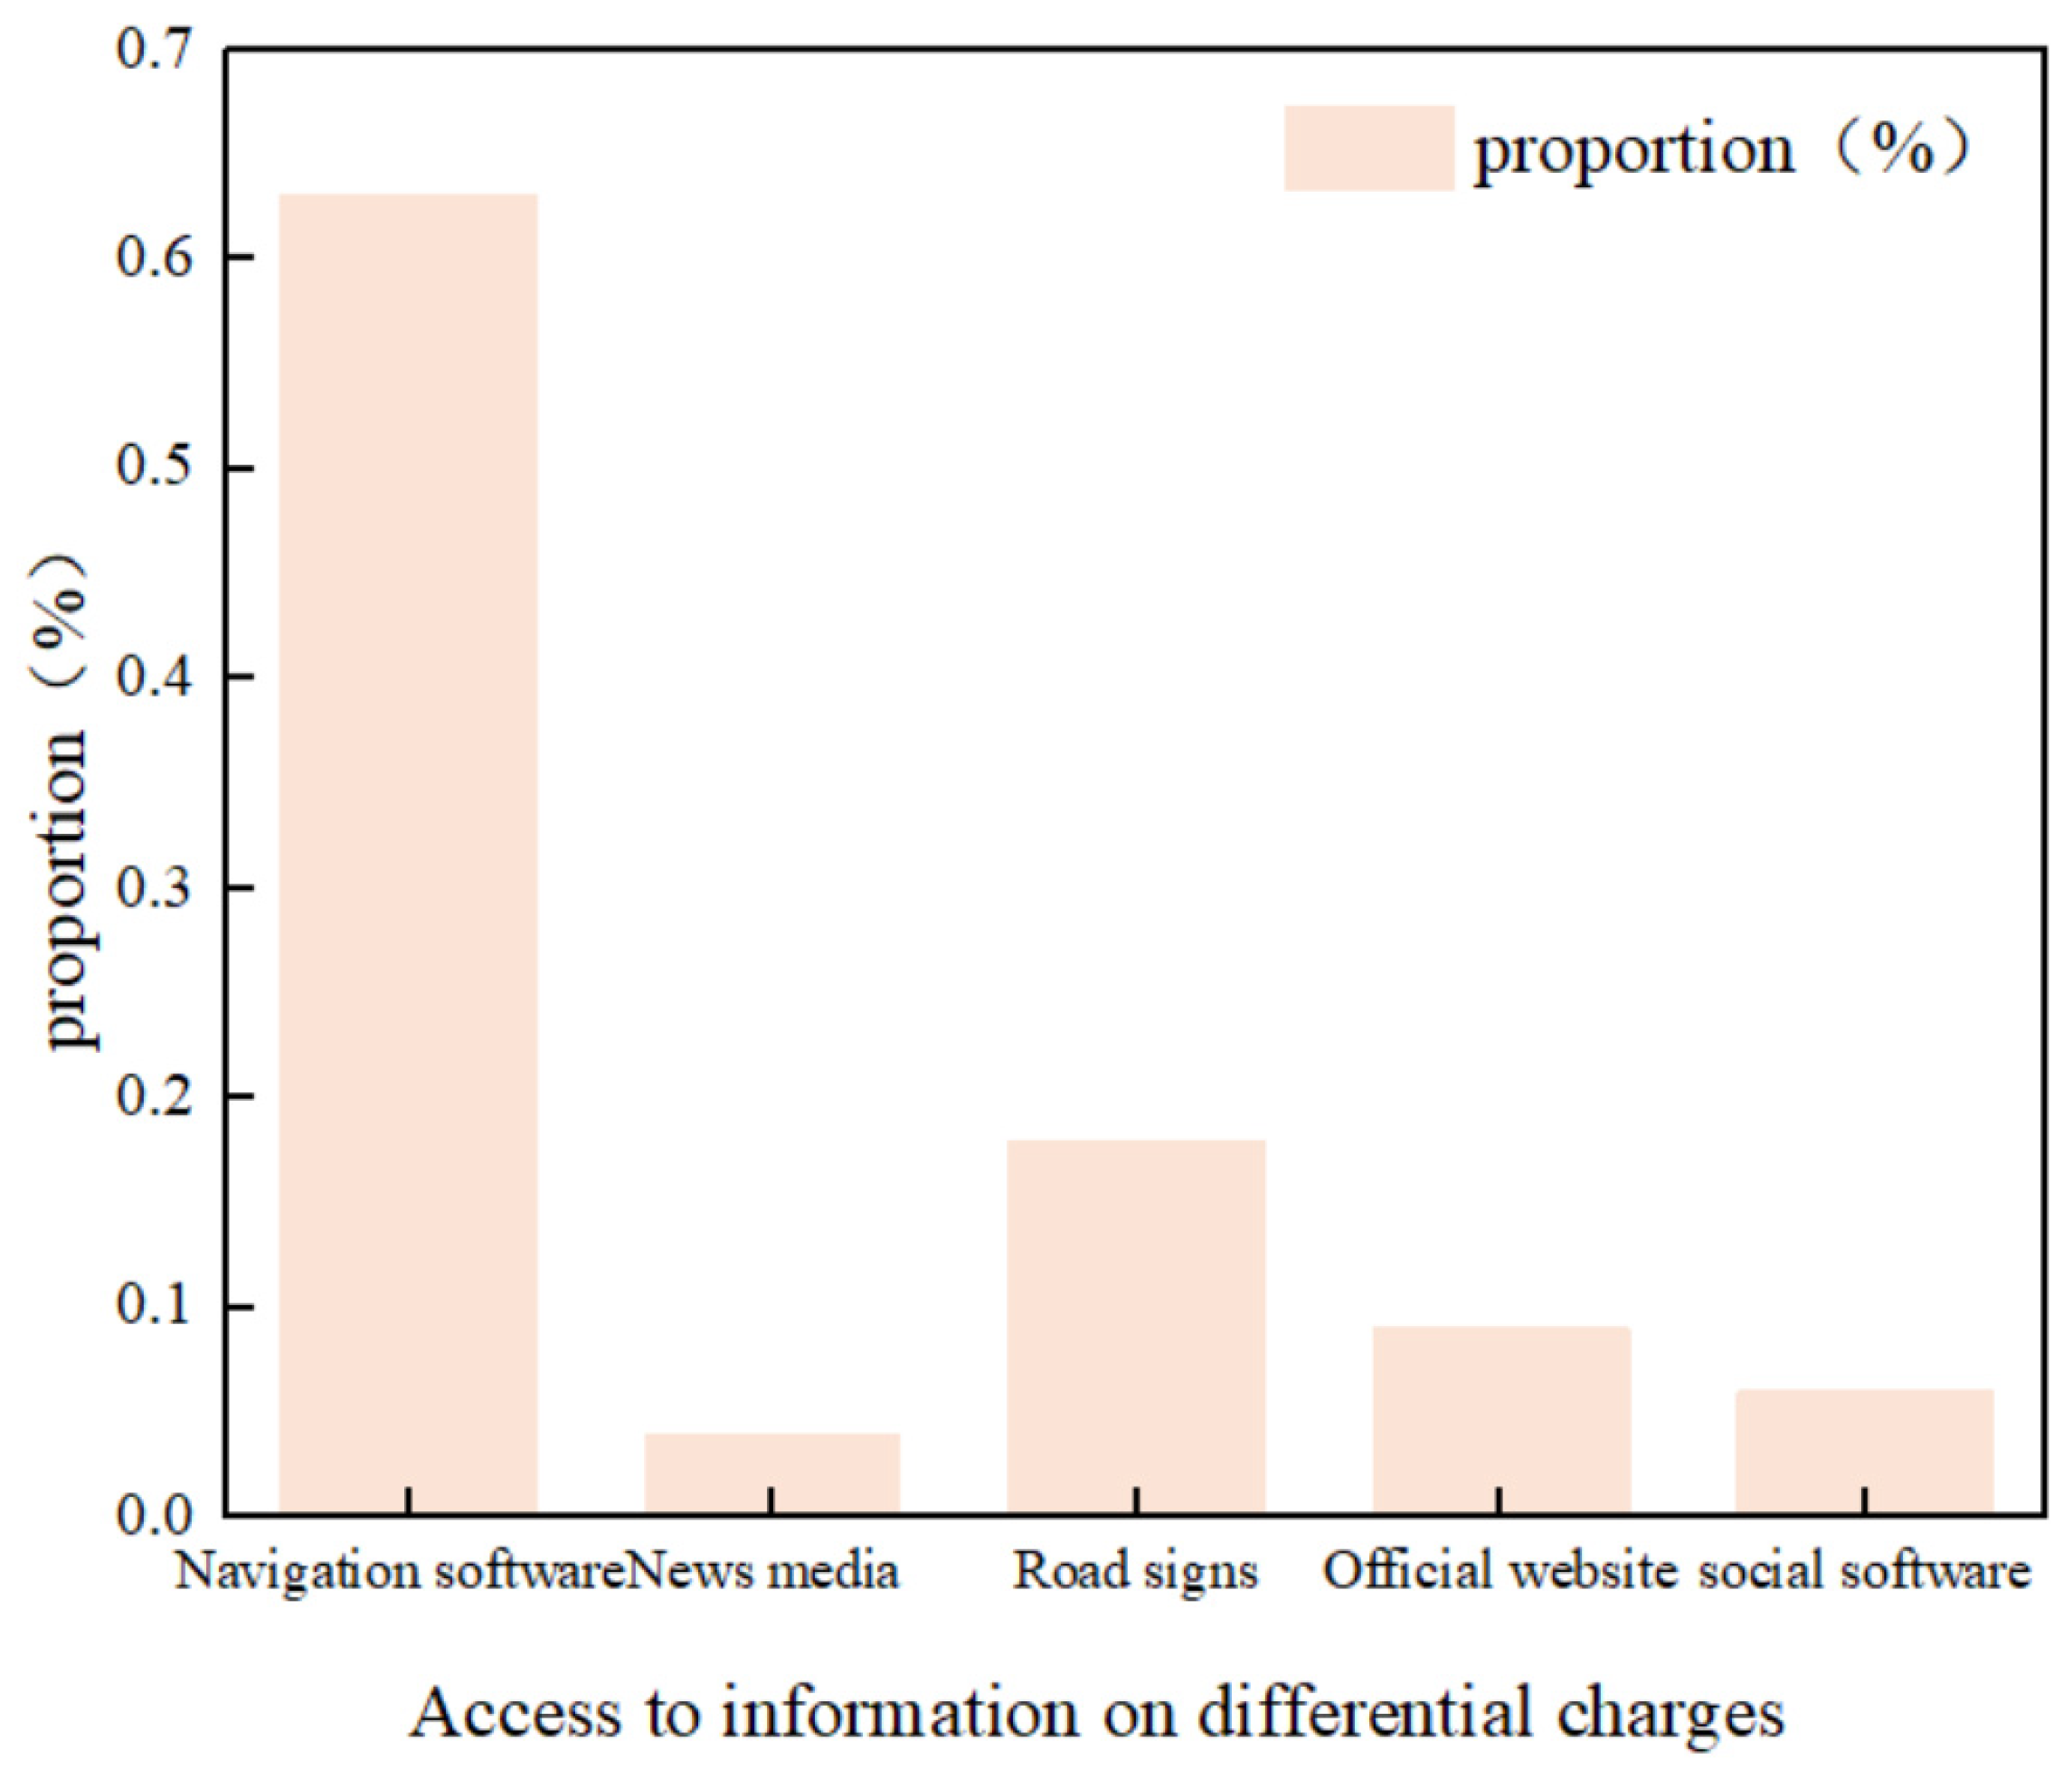
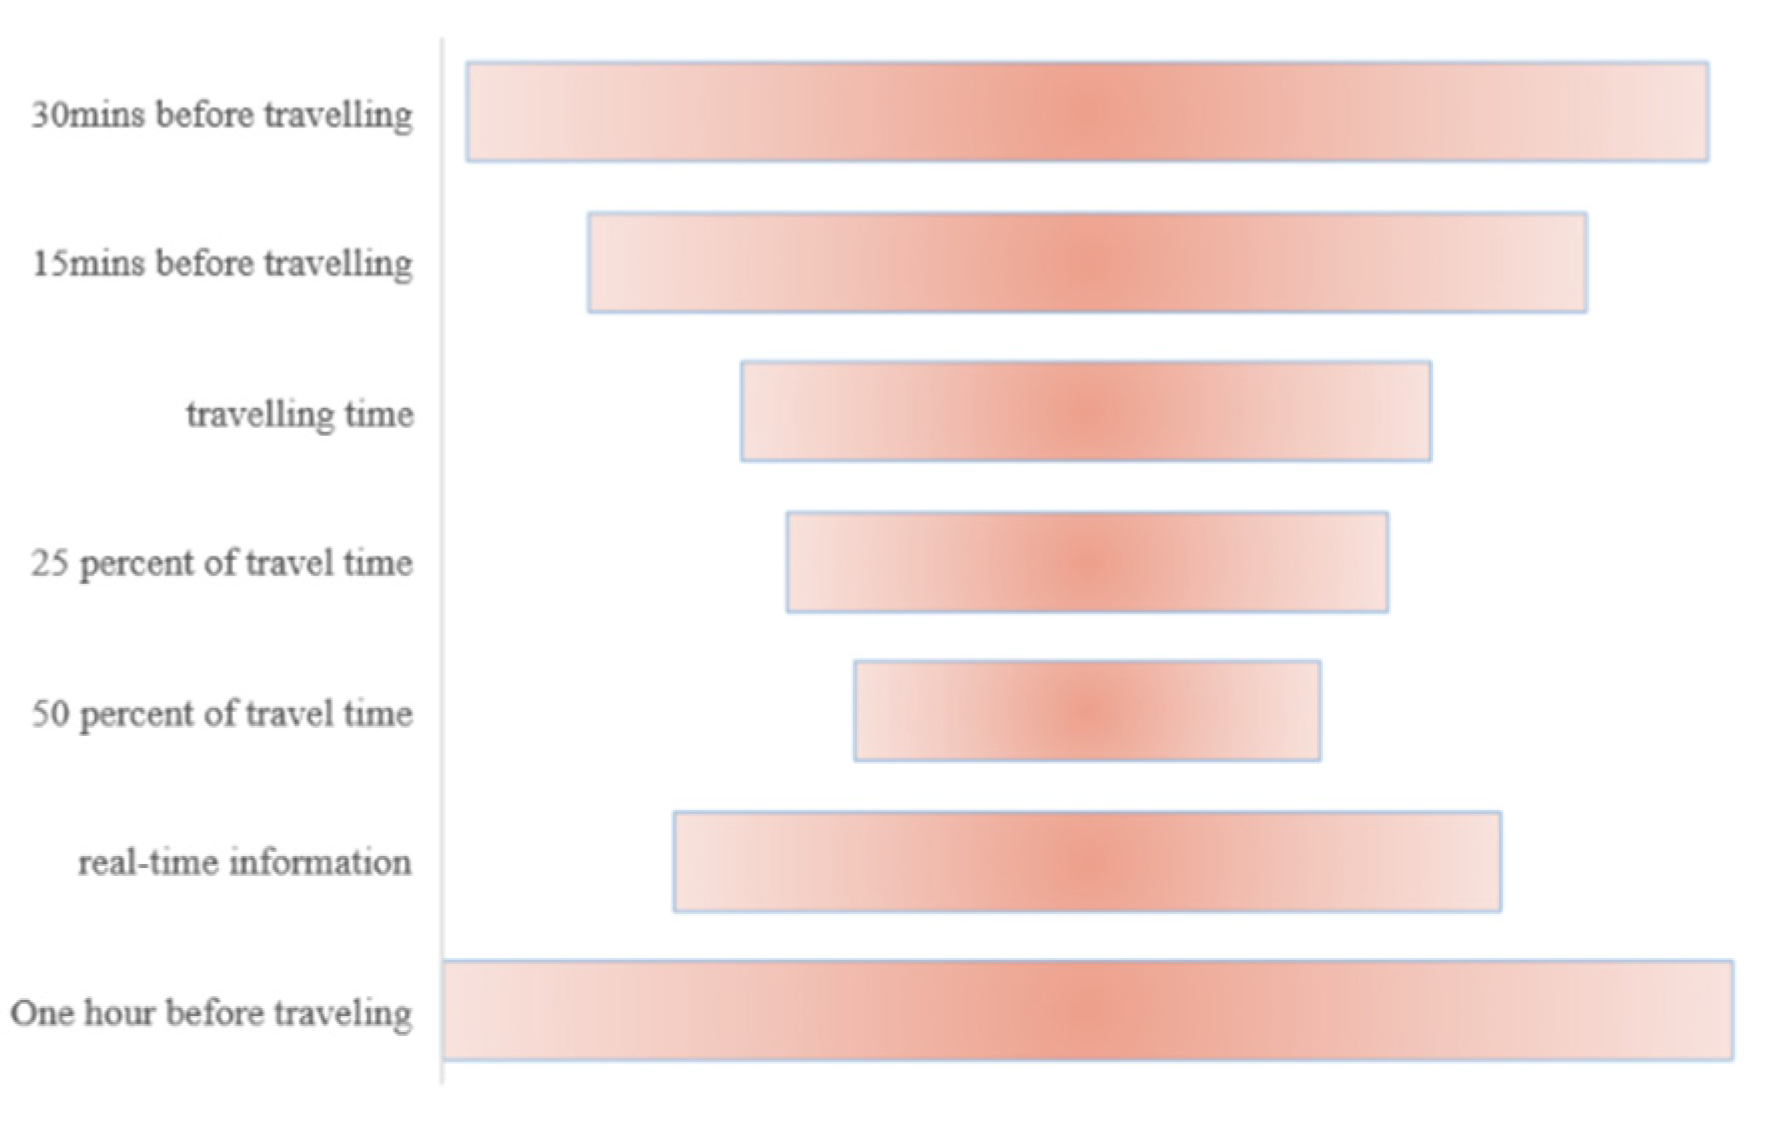
5.3.2. Information Pathways and Bypass Thresholds
6. Conclusions
- (1)
- Different charging strategies and rate discounts appeal to users in distinct ways; lower rates in certain programs can encourage users to select alternative routes, while other programs require more substantial discounts to sway user choices. The current differentiated tolling scheme, which varies by section, time period, and payment method, has a more pronounced effect on users’ decisions regarding alternative travel routes, particularly influencing the choices of large trucks.
- (2)
- Users’ preferences for selecting differentiated routes for alternative trips exhibit significant heterogeneity. Based on the analysis of the SEM-LCL model, users can be categorized into three distinct types: rate-sensitive, information-promoting, and conservative-rejecting.
- (3)
- Users’ willingness to travel via differentiated route alternatives is significantly affected by various factors, including gender, age, experience, type of vehicle, travel time, travel distance, payment method, and familiarity with differentiated tolls.
Author Contributions
Funding
Institutional Review Board Statement
Informed Consent Statement
Data Availability Statement
Conflicts of Interest
References
- Zhang, Q.; Shi, Y.; Yin, R.; Tao, H.; Xu, Z.; Wang, Z.; Chen, S.; Xing, P. An integrated framework for real-time intelligent traffic management of smart highways. J. Transp. Eng. Part A Syst. 2023, 149, 04023055. [Google Scholar]
- Li, Z.C.; Zhang, L. The two-mode problem with bottleneck queuing and transit crowding: How should congestion be priced using tolls and fares? Transp. Res. Part B Methodol. 2020, 138, 46–76. [Google Scholar] [CrossRef]
- Liu, Y.; Duan, R.; Shen, K.; Luan, Q.; Gao, H.; Deng, H. An investigation into the determinants of satisfaction concerning varied toll policies on highways using the random forest model. AIMS Math. 2024, 9, 4161–4177. [Google Scholar] [CrossRef]
- Lin, X.M.; Shao, C.F.; Qian, J.P.; Zhang, Y. Evolution dynamic of the expressway toll-free policy impact on the mode choice in a bimodal transportation network during holidays. Adv. Mech. Eng. 2017, 9, 1687814017711080. [Google Scholar]
- Lin, X.; Susilo, Y.O.; Shao, C.; Liu, C. The implication of road toll discount for mode choice: Intercity travel during the Chinese Spring Festival holiday. Sustainability 2018, 10, 2700. [Google Scholar] [CrossRef]
- Wu, H.; van den Brink, R.; Estévez-Fernández, A. Highway toll allocation. Transp. Res. Part B Methodol. 2024, 180, 102889. [Google Scholar]
- Do, W.; Rouhani, O.M.; Geddes, R.R.; Beheshtian, A. Social impact analysis of various road capacity expansion options: A case of managed highway lanes. J. Transp. Eng. Part A Syst. 2021, 147, 04021033. [Google Scholar] [CrossRef]
- Bari, C.; Chandra, S.; Dhamaniya, A. Toll Rate Policies of India: A Review, Comparison, and Inferences. Transp. Res. Rec. 2024, 2678, 334–351. [Google Scholar]
- Soza-Parra, J.; Raveau, S.; Muñoz, J.C. Travel preferences of public transport users under uneven headways. Transp. Res. Part A Policy Pract. 2021, 147, 61–75. [Google Scholar]
- Bellizzi, M.G.; dell’Olio, L.; Eboli, L.; Mazzulla, G. Heterogeneity in desired bus service quality from users’ and potential users’ perspective. Transp. Res. Part A Policy Pract. 2020, 132, 365–377. [Google Scholar]
- Gholi, H.; Kermanshah, M.; Mamdoohi, A.R. Investigating the sources of heterogeneity in passengers’ preferences for transit service quality. J. Public Transp. 2022, 24, 100014. [Google Scholar]
- Bellizzi, M.G.; dell’Olio, L.; Eboli, L.; Mazzulla, G. Detecting passengers’ heterogeneity on airlines’ services using SP data. J. Air Transp. Manag. 2021, 96, 102123. [Google Scholar]
- Yun, J.; Lee, J.; Kim, J. Automated Mobility-on-Demand Service Improvement Strategy through Latent Class Analysis of Stated Preference Survey. J. Adv. Transp. 2022, 1, 8281988. [Google Scholar]
- Moller, M.; Raveau, S. Behavioural modelling of metro car choice. Transp. Res. Part A Policy Pract. 2024, 180, 103970. [Google Scholar]
- Shao, Q.; Wang, H.; Zhu, P.; Dong, M. Group emotional contagion and simulation in large-scale flight delays based on the two-layer network model. Phys. A Stat. Mech. Its Appl. 2021, 573, 125941. [Google Scholar]
- Hou, Q.; Huo, X.; Leng, J.; Cheng, Y. Examination of driver injury severity in freeway single-vehicle crashes using a mixed logit model with heterogeneity-in-means. Phys. A Stat. Mech. Its Appl. 2019, 531, 121760. [Google Scholar]
- Zheng, F.; Li, J.; Van Zuylen, H.J.; Lu, C. Influence of driver characteristics on emissions and fuel consumption. IET Intell. Transp. Syst. 2019, 13, 1770–1779. [Google Scholar]
- Yang, Y.; Chen, M.; Wu, C.; Easa, S.; Zheng, X. Structural equation modeling of drivers’ situation awareness considering road and driver factors. Front. Psychol. 2020, 11, 549186. [Google Scholar]
- Yang, L.; Song, Y.; Hu, Z.; Wang, Z.; Li, X. Recognition of typical driving stressors and driver stress level in a Chinese sample. J. Transp. Saf. Secur. 2023, 15, 774–794. [Google Scholar]
- Li, Y.; Guo, B.; Zhao, W.; Lv, M.; Lu, P.; Wang, C.; Ji, Z.; Xu, Q. Influence of Expressway Construction Area Information on Drivers’ Route Choice Behaviours. J. Adv. Transp. 2024, 1, 9966775. [Google Scholar]
- Wei, P.; Huang, J.; Chen, Y.; Zhou, R.; Chen, N.; Zhang, Y. Familiar Road Loyalty Modeling Considering the Effect of Truckers’ Emotional Value. J. Adv. Transp. 2023, 1, 6045467. [Google Scholar]
- Payyanadan, R.P.; Sanchez, F.A.; Lee, J.D. Influence of familiarity on the driving behavior, route risk, and route choice of older drivers. IEEE Trans. Hum. Mach. Syst. 2018, 49, 10–19. [Google Scholar]
- Yang, Y.; Chen, J. Analysis of the Influencing Factors of Differentiated Parking Fees Based on Structural Equation Modeling. J. Transp. Eng. Part A Syst. 2024, 150, 04023130. [Google Scholar] [CrossRef]
- Li, X.; Qiu, H.; Yang, Y.; Zhang, H. Differentiated fares depend on bus line and time for urban public transport network based on travelers’ day-to-day group behavior. Phys. A Stat. Mech. Its Appl. 2022, 593, 126883. [Google Scholar]
- Ren, X.; Pan, N.; Jiang, H. Differentiated pricing for airline ancillary services considering passenger choice behavior heterogeneity and willingness to pay. Transp. Policy 2022, 126, 292–305. [Google Scholar] [CrossRef]
- Zhu, H.; Guan, H.; Han, Y.; Li, W. Can Road Toll Convince Car Travelers to Adjust Their Departure Times? Accounting for the Effect of Choice Behavior under Long and Short Holidays. Sustainability 2020, 12, 10470. [Google Scholar] [CrossRef]
- Song, H.; Yin, G.; Wan, X.; Guo, M.; Xie, Z.; Gu, J. Increasing bike-sharing users’ willingness to pay—A study of China based on perceived value theory and structural equation model. Front. Psychol. 2022, 12, 747462. [Google Scholar] [CrossRef]
- Alhassan, I.B.; Matthews, B.; Toner, J.P.; Susilo, Y. Public transport users’ willingness-to-pay for a multi-county and multi-operator integrated ticket: Valuation and policy implications. Res. Transp. Bus. Manag. 2022, 45, 100836. [Google Scholar]
- Ortega, A.; Vassallo, J.M.; Pérez, J.I. Modelling some equality and social welfare impacts of road tolling under conditions of traffic uncertainty. Res. Transp. Econ. 2021, 88, 101110. [Google Scholar] [CrossRef]
- Hak Lee, E.; Kim, K.; Kho, S.Y.; Kim, D.; Cho, S. Estimating express train preference of urban railway passengers based on extreme gradient boosting (XGBoost) using smart card data. Transp. Res. Rec. 2021, 2675, 64–76. [Google Scholar]
- Kong, X.; Zhang, Y.; Eisele, W.L.; Xiao, X. Using an Interpretable Machine Learning Framework to Understand the Relationship of Mobility and Reliability Indices on Truck Drivers’ Route Choices. IEEE Trans. Intell. Transp. Syst. 2021, 23, 13419–13428. [Google Scholar] [CrossRef]
- Lee, E.H.; Kim, K.; Kho, S.Y.; Kim, D.K.; Cho, S.H. Exploring for route preferences of subway passengers using smart card and train log data. J. Adv. Transp. 2022, 2022, 6657486. [Google Scholar] [CrossRef]
- Meng, S.; Zheng, H. A personalized bikeability-based cycling route recommendation method with machine learning. Int. J. Appl. Earth Obs. Geoinf. 2023, 121, 103373. [Google Scholar] [CrossRef]
- Mou, N.; Jiang, Q.; Zhang, L.; Niu, J.; Zheng, Y.; Wang, C.; Yang, T. Personalized tourist route recommendation model with a trajectory understanding via neural networks. Int. J. Digit. Earth 2022, 15, 1738–1759. [Google Scholar] [CrossRef]
- Hua, C.; Fan, W.; Song, L.; Liu, S. Analyzing the injury severity in overturn crashes involving sport utility vehicles: Latent class clustering and random parameter logit model. J. Transp. Eng. Part A Syst. 2023, 149, 04022153. [Google Scholar] [CrossRef]
- Si, Y.; Guan, H.; Cui, Y. Research on the choice behavior of taxis and express services based on the SEM-logit model. Sustainability 2019, 11, 2974. [Google Scholar] [CrossRef]
- Lu, J.; Wang, Z.; Gu, Y.; Yang, W. Modelling the air ticket purchase behavior incorporating latent class model. Math. Probl. Eng. 2020, 2020, 2046106. [Google Scholar] [CrossRef]
- Yao, E.; Wang, X.; Yang, Y.; Pan, L.; Song, Y. Traffic flow estimation based on toll ticket data considering multitype vehicle impact. J. Transp. Eng. Part A Syst. 2021, 147, 04020158. [Google Scholar] [CrossRef]
- Avila, A.M.; Mezić, I. Data-driven analysis and forecasting of highway traffic dynamics. Nat. Commun. 2020, 11, 2090. [Google Scholar] [CrossRef]
- Zou, Y.; Han, W.; Lin, B.; Wu, B.; Li, L.; Wu, S.; Abid, M. Cross-Border Travel Behavior Analysis of Hong Kong-Zhuhai-Macao Bridge Using MXL-BMA Model. J. Adv. Transp. 2023, 1, 6690346. [Google Scholar] [CrossRef]
- Prasad, P.; Maitra, B. Identifying areas of interventions for improvement of shared modes for school trips. Transp. Res. Part A Policy Pract. 2019, 121, 122–135. [Google Scholar]
- Márquez, L.; Cantillo, V.; Arellana, J. Assessing the influence of indicators’ complexity on hybrid discrete choice model estimates. Transportation 2020, 47, 373–396. [Google Scholar]
- Wang, J.; Zhao, S.; Zhang, W.; Evans, R. Why people adopt smart transportation services: An integrated model of TAM, trust and perceived risk. Transp. Plan. Technol. 2021, 44, 629–646. [Google Scholar]
- Ahmed, U.; Roorda, M.J. Modelling carrier type and vehicle type choice of small and medium size firms. Transp. Res. Part E Logist. Transp. Rev. 2022, 160, 102655. [Google Scholar]
- Lee, E.H.; Lee, I.; Cho, S.H.; Kho, S.; Kim, D. A travel behavior-based skip-stop strategy considering train choice behaviors based on smartcard data. Sustainability 2019, 11, 2791. [Google Scholar] [CrossRef]
- Zhu, C.; Dadashova, B.; Lee, C.; Xin, Y.; Brown, C.l. Equity in non-motorist safety: Exploring two pathways in Houston. Transp. Res. Part D Transp. Environ. 2024, 132, 104239. [Google Scholar] [CrossRef]
- Yun, H.; Kim, E.; Ham, S.W.; Kim, D. Navigating the non-compliance effects on system optimal route guidance using reinforcement learning. Transp. Res. Part C Emerg. Technol. 2024, 165, 104721. [Google Scholar]
- Wu, W.; Daziano, R.A. On assignment to classes in latent class logit models. Transp. Res. Rec. 2023, 2677, 1137–1150. [Google Scholar] [CrossRef]
- Cho, S.H.; Park, S.H.; Choo, S. Exploring the travel behavioral differences for the elderly mobility on public transit. Transp. Lett. 2024, 1, 1–11. [Google Scholar] [CrossRef]
- Qin, Y.; Yang, N.; Cherry, C.R.; Li, X.; Zhao, S.; Wang, Y. Effects of emotionally charged advertisements on driver behavior in risky scenarios: A driving simulator study. Transp. Res. Part F Traffic Psychol. Behav. 2024, 101, 423–436. [Google Scholar]


| Factor | Attributes | Frequency | Proportion (%) |
|---|---|---|---|
| Individual socio-economic characteristics | |||
| Gender | Male | 204 | 68.1 |
| Female | 96 | 31.9 | |
| Age | <20 (Year) | 50 | 16.7 |
| 20–35 (Year) | 175 | 58.3 | |
| 35–50 (Year) | 52 | 17.3 | |
| >50 (Year) | 23 | 7.7 | |
| Monthly income | <4000 (RMB) | 78 | 26.1 |
| 4000–8000 (RMB) | 104 | 34.8 | |
| 8001–12,000 (RMB) | 79 | 26.4 | |
| >12,000 (RMB) | 39 | 12.7 | |
| occupation | Student | 49 | 16.4 |
| Self-employed/retired | 40 | 13.5 | |
| Government employee | 91 | 30.5 | |
| Private employee | 120 | 39.6 | |
| Driving experience | <3 (Year) | 71 | 23.7 |
| 3–6 (Year) | 88 | 29.3 | |
| 7–10 (Year) | 92 | 30.6 | |
| >10 (Year) | 49 | 16.4 | |
| Educational level | High school and below | 42 | 14.2 |
| Junior college/Undergraduate | 179 | 59.5 | |
| Master’s degree or above | 79 | 26.3 | |
| Trip-related characteristics | |||
| Vehicle type | Private car | 235 | 78.3 |
| Passenger car | 41 | 13.7 | |
| Truck | 20 | 6.7 | |
| Special-purpose vehicle | 4 | 1.3 | |
| Travel purpose | Business travel | 29 | 9.6 |
| Leisure tourism | 40 | 13.5 | |
| Visit relatives | 80 | 26.7 | |
| Commute travel | 51 | 50.2 | |
| Travel pattern | Rigid travel | 236 | 78.4 |
| Flexible mobility | 64 | 21.6 | |
| Travel time | Daytime | 209 | 69.8 |
| Night | 91 | 30.2 | |
| Travel range | Within the province | 197 | 65.7 |
| Transit travel | 71 | 34.3 | |
| Travel distance | <50 km | 31 | 10.3 |
| 50–100 km | 104 | 34.6 | |
| 100–200 km | 128 | 42.8 | |
| >200 km | 37 | 12.3 | |
| Travel frequency | Almost everyday | 14 | 4.7 |
| 1–4 times per week | 76 | 25.3 | |
| 1–3 times per month | 142 | 47.3 | |
| Less used | 68 | 22.7 | |
| Number of peers | Only one | 55 | 18.4 |
| 2 | 166 | 55.2 | |
| >3 | 79 | 26.4 | |
| Payment methods | ETC | 218 | 72.6 |
| Cash or other | 82 | 27.4 | |
| Differentiated tooling experience | Yes | 229 | 76.3 |
| No | 71 | 23.7 | |
| Fit Indicators | Standard | Measured Values | Judgment |
|---|---|---|---|
| 1–3 | 2.006 | Acceptance | |
| GFI | >0.9 | 0.899 | Acceptance |
| AGFI | >0.9 | 0.869 | Acceptance |
| NFI | >0.9 | 0.909 | Acceptance |
| IFI | >0.9 | 0.952 | Acceptance |
| RFI | >0.9 | 0.891 | Acceptance |
| CFI | >0.9 | 0.952 | Acceptance |
| TLI | >0.9 | 0.942 | Acceptance |
| RMSEA | <0.08 | 0.056 | Acceptance |
| Estimate | S.E. | C.R. | p | |
|---|---|---|---|---|
| Differentiated charges by vehicle type (category) | 0.112 | 0.061 | 1.849 | - |
| Differentiated toll collection by section | 0.444 | 0.079 | 5.603 | *** |
| Differentiated tolls for different time periods | 0.232 | 0.085 | 2.732 | ** |
| Differentiated tolls for separate entrances and exits | −0.11 | 0.066 | −1.672 | - |
| Differentiated tolls by payment method | 0.187 | 0.079 | 2.365 | * |
| Directionally differentiated tolls | 0.056 | 0.062 | 0.913 | - |
| Factor | Attributes | Rate Sensitive | Information Facilitating | Conservative Refusal |
|---|---|---|---|---|
| Individual socio-economic characteristics | ||||
| Gender | Male | 0.54 *** (4.66) | 0.23 ** (2.08) | — |
| Age | 20–35 | 0.64 *** (3.80) | — | |
| 35–50 | 0.35 ** (2.20) | 0.43 *** (2.77) | — | |
| >50 | — | — | 1.02 *** (2.00) | |
| Trip-related characteristics | ||||
| Travel frequency | almost everyday | 0.82 ** (4.79) | −0.29 ** (−2.00) | — |
| 1–4 times per week | 0.60 *** (3.49) | 0.37 ** (2.29) | — | |
| Type | Private car | 2.66 ** (2.26) | 2.03 ** (2.10) | −1.1 ** (−2.00) |
| Truck | 3.02 *** (6.32) | 1.84 *** (2.86) | ||
| Travel time | Daytime | 2.55 *** (10.16) | 1.78 *** (3.73) | 1.27 *** (3.44) |
| Travel range | Transit | 1.27 *** (4.44) | 0.7 *** (4.16) | 0.46 *** (2.84) |
| Travel distance | 100–200 km | 0.72 ** (6.12) | 0.11 ** (2.32) | −0.07 *** (−1.47) |
| Payment methods | ETC | 0.56 *** (4.23) | 0.26 ** (2.43) | — |
| Differentiated charging experience | Yes | 0.11 *** (12.13) | 0.12 *** (14.85) | −0.08 *** (−11.47) |
Disclaimer/Publisher’s Note: The statements, opinions and data contained in all publications are solely those of the individual author(s) and contributor(s) and not of MDPI and/or the editor(s). MDPI and/or the editor(s) disclaim responsibility for any injury to people or property resulting from any ideas, methods, instructions or products referred to in the content. |
© 2025 by the authors. Licensee MDPI, Basel, Switzerland. This article is an open access article distributed under the terms and conditions of the Creative Commons Attribution (CC BY) license (https://creativecommons.org/licenses/by/4.0/).
Share and Cite
Dong, X.; Zeng, Y.; Luo, R.; Lyu, N.; Xu, D.; Zhou, X. Influence of Differentiated Tolling Strategies on Route Choice Behavior of Heterogeneous Highway Users. Future Transp. 2025, 5, 41. https://doi.org/10.3390/futuretransp5020041
Dong X, Zeng Y, Luo R, Lyu N, Xu D, Zhou X. Influence of Differentiated Tolling Strategies on Route Choice Behavior of Heterogeneous Highway Users. Future Transportation. 2025; 5(2):41. https://doi.org/10.3390/futuretransp5020041
Chicago/Turabian StyleDong, Xinyu, Yuekai Zeng, Ruyi Luo, Nengchao Lyu, Da Xu, and Xincong Zhou. 2025. "Influence of Differentiated Tolling Strategies on Route Choice Behavior of Heterogeneous Highway Users" Future Transportation 5, no. 2: 41. https://doi.org/10.3390/futuretransp5020041
APA StyleDong, X., Zeng, Y., Luo, R., Lyu, N., Xu, D., & Zhou, X. (2025). Influence of Differentiated Tolling Strategies on Route Choice Behavior of Heterogeneous Highway Users. Future Transportation, 5(2), 41. https://doi.org/10.3390/futuretransp5020041