Article

Shared Lightweight Autonomous Vehicles for Urban Food Deliveries: A Simulation Study

MIT Media Lab, Cambridge, MA 02139, USA
*
Author to whom correspondence should be addressed.
Future Transp. 2024, 4(2), 634-658; https://doi.org/10.3390/futuretransp4020030
Submission received: 1 March 2024 / Revised: 3 April 2024 / Accepted: 20 May 2024 / Published: 11 June 2024

Abstract

:
In recent years, the rapid growth of on-demand delivery services, especially in food deliveries, has spurred the exploration of innovative mobility solutions. In this context, lightweight autonomous vehicles have emerged as a potential alternative. However, their fleet-level behavior remains largely unexplored. To address this gap, we have developed an agent-based model and an environmental impact study assessing the fleet performance of lightweight autonomous food delivery vehicles. This model explores critical factors such as fleet sizing, service level, operational strategies, and environmental impacts. We have applied this model to a case study in Cambridge, MA, USA, where results indicate that there could be significant environmental benefits in replacing traditional car-based deliveries with shared lightweight autonomous vehicle fleets. Lastly, we introduce an interactive platform that offers a user-friendly means of comprehending the model’s performance and potential trade-offs, which can help inform decision-makers in the evolving landscape of food delivery innovation.

1. Introduction

Over the past century, many cities have undergone substantial transformations. The global population has increased year-by-year, and this trajectory is projected to continue, reaching the 9.7 billion mark by 2050 [1]. This would entail a growth of 1.7 billion people relative to 2022, with most of this growth being concentrated in urban areas [1]. This demographic shift will pose diverse challenges in cities, including a surge in urban mobility demand and subsequent traffic-related problems, which could lead to adverse environmental and socioeconomic outcomes [2].
In the United States (US), a significant share of the rising urban mobility demand is attributed to on-demand deliveries. While in 2009, online sales represented only 4% of total US retail sales, by 2019, this figure had risen to 11%, and by 2021, it had reached 15% [3]. E-commerce, while potentially reducing the number of trips to physical stores, tends to encourage more frequent purchases, resulting in complex delivery routes with high stop frequency [4,5]. Consequently, the environmental implications of e-commerce have been found to have a high dependency on factors such as demand consolidation, delivery network, vehicle types, and return rates [6].
Within the sector of e-commerce deliveries, food delivery services have exhibited remarkably rapid growth. According to McKinsey et al. [7], the market grew four- to seven-fold between 2018 and 2021, with a global market estimated to be worth more than $150 billion. This exponential market growth has led to a surge in the exploration of innovative mobility solutions for food deliveries.
Academic and industrial players are currently exploring lightweight autonomous vehicles that could provide an on-demand food delivery service. For instance, companies like DoorDash have established DoorDash Labs to develop automation and robotics systems for last-mile logistics (https://doordash.news/company/introducing-doordash-labs-doordashs-robotics-and-automation-arm/ (accessed on 30 May 2024)). Similarly, Uber Eats has recently partnered with Nuro, a startup working on autonomous delivery vehicles (https://www.washingtontimes.com/news/2022/sep/13/uber-eats-partners-with-nuro-for-driverless-delive/ (accessed on 21 May 2024)), and Amazon has developed an autonomous delivery system, the Amazon Scout (https://www.aboutamazon.com/news/transportation/whats-next-for-amazon-scout (accessed on 21 May 2024)). Concurrently, academia is exploring an alternative approach, focusing on multi-functional shared lightweight autonomous vehicles capable of serving as a mobility-on-demand system during peak hours and transition into package or food delivery during periods of reduced user demand [8,9].
These innovative vehicles hold the promise of delivering several advantages. Firstly, they offer the potential to facilitate a transition to lighter vehicles that are more suitable for delivering small food packages due to their lower environmental emissions. Secondly, these shared lightweight autonomous vehicles (SLAV) are purposefully designed to operate on sidewalks or bike lanes, eliminating the necessity for additional road infrastructure in urban areas, which could, in turn, support the shift toward more human-centric and less car-centric urban environments [10].
However, despite the substantial efforts invested in industry and academia to develop lightweight autonomous systems for food deliveries, there is a research gap concerning their performance at the fleet level. Notably, a comprehensive review of agent-based models on autonomous vehicles up to 2020 by Li et al. [11] highlights the need for more logistics-related studies, underscoring the need for further research in this field. The significance of this research gap is particularly evident when considering prior studies that highlight the crucial role of fleet-level investigations in understanding the performance and environmental effects of emerging mobility systems [12,13,14].
To bridge this gap, this paper presents three fundamental contributions: (1) an agent-based model that simulates the behavior of lightweight autonomous fleets for food deliveries, (2) an environmental impact assessment of the shift from car-based deliveries to fleets of shared lightweight autonomous vehicles, and (3) an interactive simulation tool that offers a user-friendly means of understanding the model’s performance and potential trade-offs. In a process that incorporates realistic data on food deliveries and considers different design parameters and operational strategies, our study provides an extensive analysis evaluating the performance and potential implications of these new systems. In particular, the outcomes of this study provide insights into essential parameters related to food delivery fleets, encompassing aspects such as optimal fleet size, service level, operational strategies, and environmental impacts.
The remainder of the paper is structured as follows. The first two subsections (Section 1.1 and Section 1.2) address the literature review and contribution of this paper. Section 2 presents the details of the modeling approach. Section 3 shows the experimental setup of the defined model. Section 4 gathers and discusses the obtained results. Next, Section 5 presents a tangible simulation tool that allows the exploration of the model’s outcomes in an interactive way. Finally, Section 6 summarizes the main conclusions of this study.

1.1. Literature Review

The field of shared autonomous micro-mobility (SAmM) encompasses the use of shared lightweight autonomous vehicles as a mobility on-demand system. Numerous studies have examined the fleet-level behavior within this field, focusing on aspects such as service quality and environmental impacts [15,16,17]. However, the literature is relatively scarce when it comes to utilizing shared lightweight autonomous vehicles for logistics. Li et al. [11] reviewed all of the Agent-Based Models (ABMs) published in this field until 2020 and highlighted the limited number of relevant studies in the field of autonomous robots for deliveries, emphasizing the need for further research. Out of a total of four studies that they identify, two focus on package deliveries [10,18] and only the other two are related to food deliveries [19,20]. On one hand, Samouh et al. [19] presented an ABM for food delivery considering three scenarios involving drones, ground robots, and a combination of both. This study analyzes the fleet sizes needed to answer a specific demand profile during a particular hour of the day. On the other hand, De Capitani Da Vimercate [20], instead, studied the use of autonomous sidewalk robots to serve food delivery trips. Below, we discuss how our research differs from such studies, and what our contribution is.

1.2. Contribution

The research presented in this article differs from previous related studies in several aspects. First, regarding the input demand dataset, our model is based on a fine-grained food delivery demand dataset with high-resolution time and location information (see Section 3.3). The aforementioned studies, instead, utilize simplistic datasets such as the one-hour uniform distribution of orders in the case of Samouh et al. [19] or the random and uniform distribution of customers and restaurants in the case of De Capitani Da Vimercate [20]. Realistic demand patterns produce more accurate results and, therefore, our research poses a significant step forward in this sense [11].
Secondly, our model allows for the analysis of the performance of SLAVs across various vehicle configurations and charging operational strategies and enables a comparison to a baseline scenario represented by cars. Previous studies, instead, study simpler vehicle configurations and lack a baseline that allows for a comparison with the current scenario [19,20]. Lastly, unlike previous studies, our work includes an environmental impacts analysis, which is an increasingly important aspect in evaluating the performance of mobility systems [21]. In light of previous work, it can be concluded that there is still a relevant literature gap in developing an in-depth study of the fleet-level performance and environmental impacts of SLAVs for food deliveries.
In order to fill the existing literature gap, this study aims to comprehensively examine the use of SLAVs for food deliveries. To achieve this goal, we have developed an ABM that leverages a high-resolution synthetic database based on real-world data to compare the current car-based scenario with the lightweight autonomous system, analyzing its implications in terms of fleet sizing, service level, and environmental impacts. Additionally, we explore the impact of different vehicle configurations and operational strategies, enhancing the understanding of the system’s performance under varying conditions. The modular design of our model enables its easy adaptability to other urban areas. Lastly, our model has been integrated into an interactive tool that allows stakeholders to explore the model’s performance in real time, helping to understand the system’s behavior and trade-offs collaboratively.
This research sheds light on the transformative potential of SLAVs in the food delivery industry, offering valuable insights for stakeholders such as policymakers, mobility operators, and citizens. Through our evaluation of the performance of lightweight autonomous systems in urban food deliveries, informed decisions can be made regarding fleet design and implementation, with particular attention to environmental considerations. This study represents a crucial step towards understanding the capabilities and impacts of lightweight autonomous systems, paving the way for future advancements in the field.

2. Modeling Approach

To study the performance of shared lightweight autonomous vehicles for food deliveries and compare their performance to the current car-based systems, we have developed an Agent-Based Model (ABM) and an environmental impact study which are detailed in Section 2.1 and Section 2.2, respectively.

2.1. Simulation Model Architecture

ABMs have emerged as a popular method to analyze the meso- and macroscopic behavior of autonomous vehicles [11]. Their effectiveness lies in their ability to capture the complex interactions between various actors, such as vehicle fleets, users, and the infrastructure. Additionally, these models offer flexibility in exploring different scenarios and hypotheses, which is essential for understanding the uncertainties associated with emerging technologies.
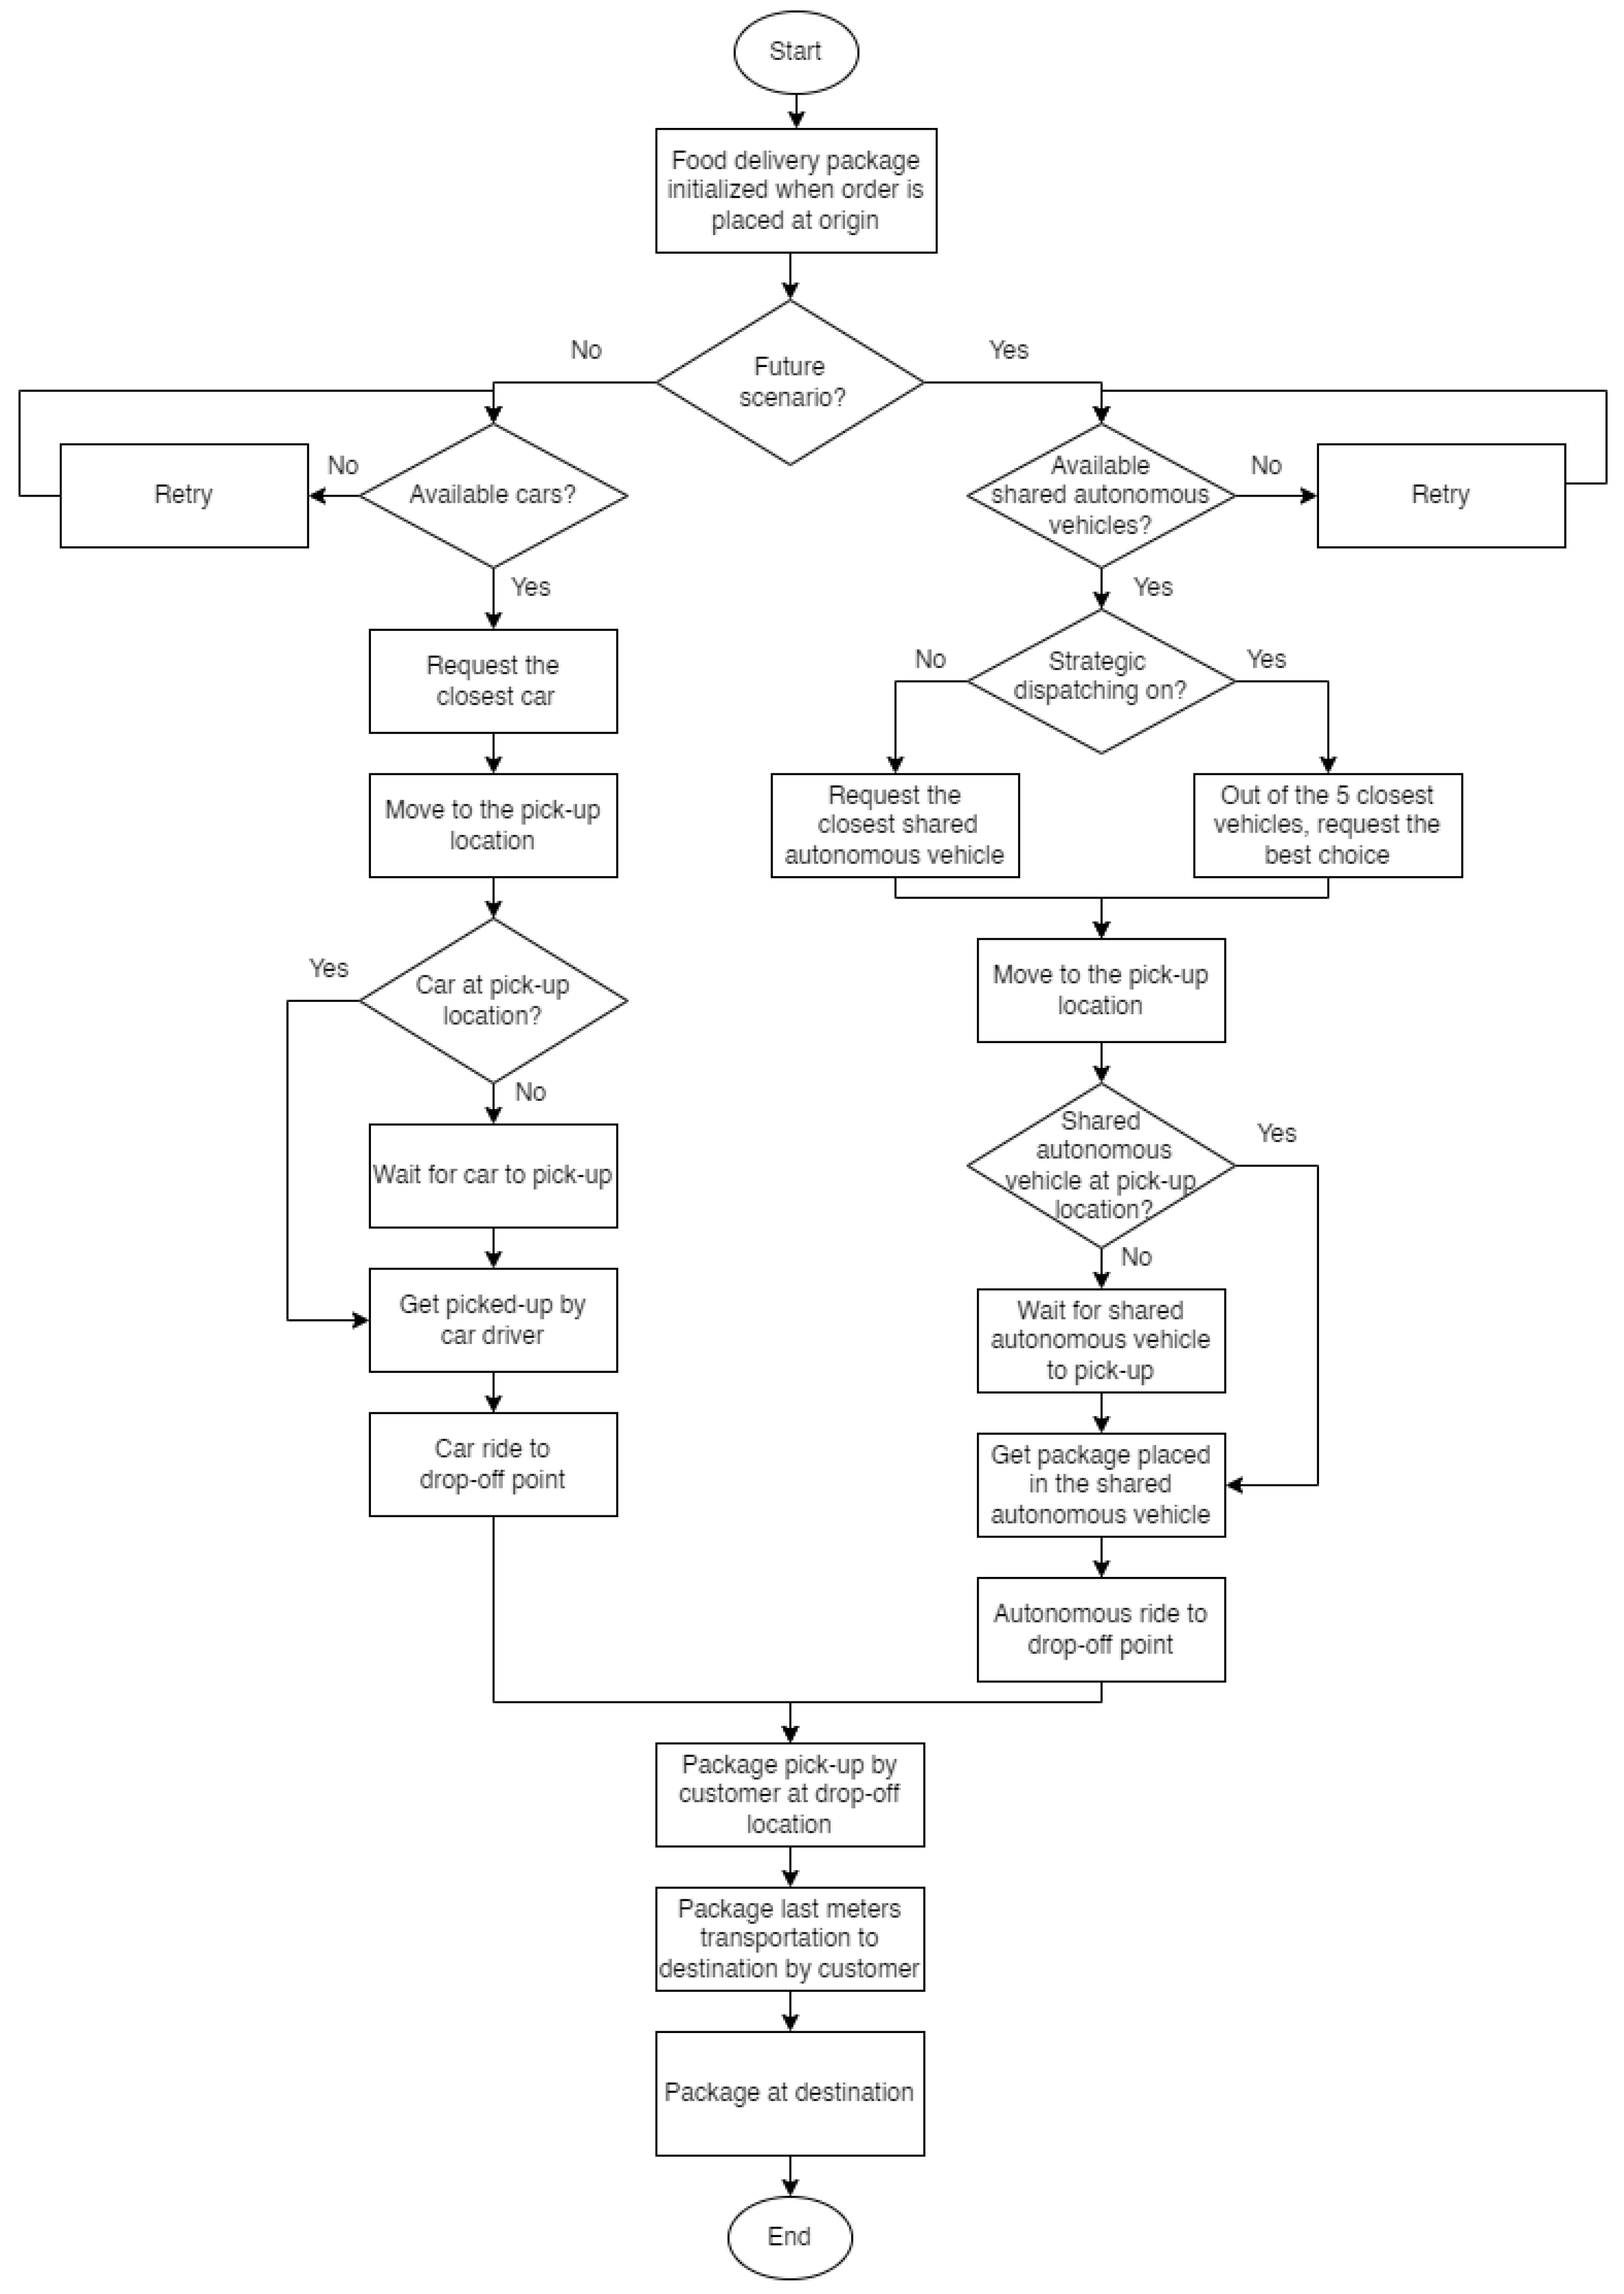
The ABM in this study is designed to capture the dynamics and interactions between the different agents involved in food delivery processes. Figure 1 provides a visual representation of the defined activities and their flow. First, the customer places a food delivery order in a particular restaurant. Subsequently, a vehicle is assigned to fulfill the delivery trip. The assigned vehicle drives to the restaurant and picks up the package. With the food onboard, the vehicle proceeds to the destination location where it will deliver the order.
The ABM architecture consists of three interconnected layers, as shown in Figure 2: (A) the urban infrastructure, (B) the delivery vehicle fleet, and (C) the user demand. The following subsections will detail what these layers represent and how they have been modeled.

2.1.1. Urban Infrastructure

The urban infrastructure plays a crucial role in shaping the operations and dynamics of the food delivery system. In this model, the urban infrastructure is represented by several components (Figure 2A). Firstly, the city road network represents the paths that vehicles will follow for their trips. It encompasses the network of streets and intersections within the area under study. Secondly, the buildings serve as the origins (i.e., restaurants) and destinations of the food delivery trips. Thirdly, the currently existing gas and charging stations represent the locations where vehicles will refuel or recharge their batteries. More details on the specific datasets used will be provided in Section 3.

2.1.2. Vehicle Behavior

The ABM considers different scenarios with distinct fleets of vehicles to fulfill food deliveries (Figure 2B). In the baseline scenario, conventional cars are used, while the rest of the scenarios model a fleet of shared lightweight autonomous vehicles. The behaviors of these vehicle systems are defined as follows:
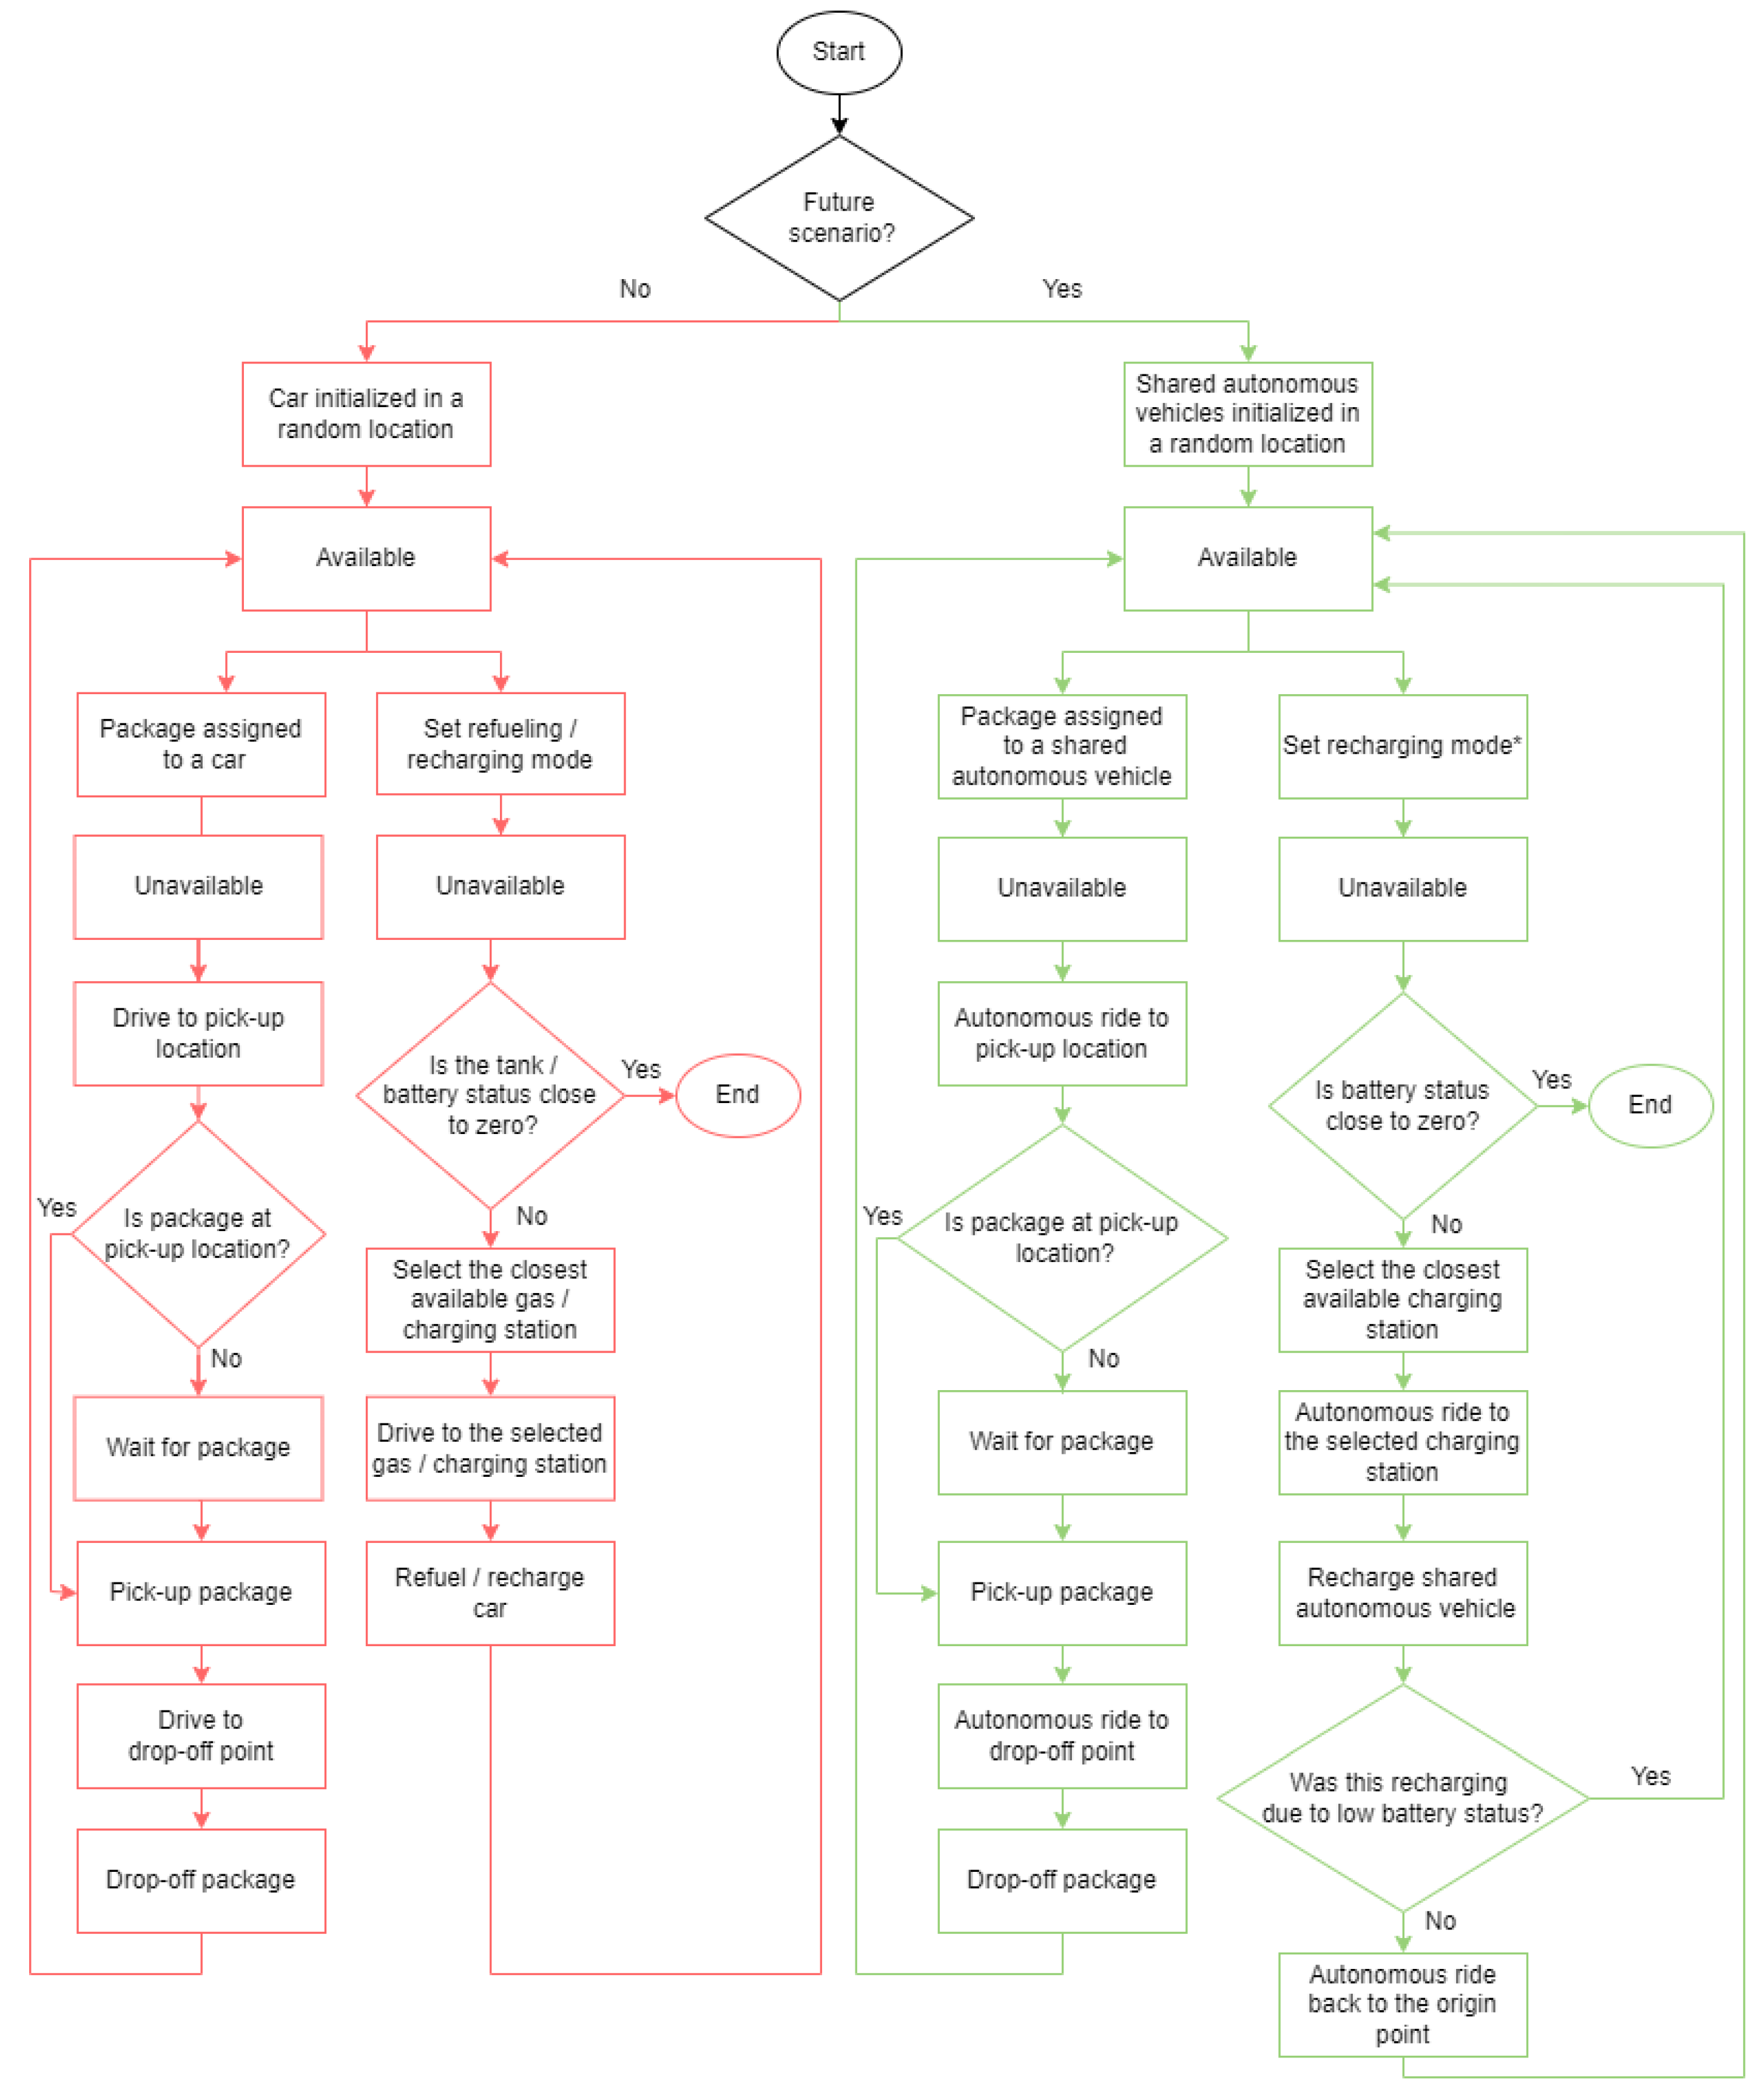
  • Baseline scenario: Current car-based deliveries. This scenario models combustion cars to represent current food deliveries and electric cars to represent a futuristic but closer-to-date evolution of such deliveries. The behavior of these vehicles is modeled as a Finite State Machine (FSM), illustrated in red in Figure 3.
    Initially, cars are randomly placed on the city roads with a fuel/battery level set between the maximum and minimum values. All vehicles start in an available state, ready to respond to any food delivery request. When a customer orders at a specific restaurant, a package pick-up request is sent to the nearest available car with sufficient fuel/charge to complete the trip. The car then travels to the restaurant to collect the food order and delivers it to the designated drop-off location. After completing the delivery, the vehicle becomes available again and idles until it gets assigned a new pick-up request. If the fuel/battery level is low, it drives to the closest gas/charging station for refueling/recharging. Once refueled/recharged, the vehicle becomes available for further deliveries. While in our model, vehicles simply choose the closest station in order to minimize traveled distance, future versions could implement more advanced decisions, such as considering the availability of each station and the distance that can be covered with the remaining fuel/battery.
  • Future scenario: Shared lightweight autonomous vehicles. The behavior of shared lightweight autonomous vehicles is also modeled as a FSM, as depicted in green in Figure 3. The FSM captures various operational states of the vehicles, such as idle, in route, and delivering, and describes the transitions between these states.
    Shared lightweight autonomous vehicles are initialized at random locations within the road network, with an arbitrary battery level between the minimum and maximum thresholds. All vehicles start in an available state for food delivery trips. When an order is placed, a package pick-up request is assigned to the nearest available vehicle or the vehicle with the best distance-to-battery-level ratio, depending on the charging strategy being analyzed. The chosen vehicle autonomously travels to the restaurant, collects the package, and drives to the drop-off point. After completing the delivery, the vehicle becomes available again and idles until a new order is assigned. If the battery level falls below the minimum threshold, it autonomously drives to the closest available charging station, recharges, and becomes available again. Since different charging operational strategies have been studied (Section 3.4), the conditions under which vehicles initiate a recharge trip vary depending on the specific strategy being analyzed.

2.1.3. Customer Behavior

This layer represents the customers who place food delivery orders (Figure 2C). The customers’ behavior is also modeled as a FSM, which is illustrated in Figure 4. Whenever a user places a food delivery order at a specific restaurant, a food delivery package is generated at that location. As a first step, the system checks for the availability of vehicles. If no vehicles are available, the package will continuously attempt to find an available vehicle. If multiple vehicles are available, the system will determine which vehicle to assign to that delivery based on either the closest distance or the one with the best proximity-to-battery ratio, as defined in Section 3.4. Once a delivery vehicle is assigned, the package will be transported to its designated delivery location, where the customer will receive it.

2.2. Environmental Impact Modeling

While the ABM in Section 2.1 aims to analyze the systems from a performance perspective, understanding the corresponding environmental impacts is key in analyzing the potential implications of shared lightweight autonomous vehicles for food deliveries. In the context of analyzing a new mobility mode, it is important to not only consider the emissions of the new system, but also to compare them to the status quo that they are replacing. To do so, we model the environmental impacts of lightweight autonomous vehicles, and compare their performance to current combustion engine cars. Moreover, in order to represent an alternative scenario which is closer to the current status quo, we also model battery electric cars fueled by a zero-carbon grid.
The environmental impacts considered for this study are based on a life cycle assessment (LCA). LCA is a standardized environmental impact calculation method that considers the impacts from the entire life cycle: from raw material extraction to production, use, and waste management [22,23]. This study focuses on the impacts in terms of CO 2 emissions because it is a metric that plays a central role in the transportation and governmental decision-making processes [24].
The environmental assessments in this study draw upon the methodologies outlined in [16], which have been suitably adapted to this specific case study. These adaptations involve the customization of vehicle utilization rates and battery ranges, guided by simulation outcomes. Notably, infrastructure-related impacts are intentionally omitted from the analysis because all scenarios consider a consistent number of charging stations. This approach is adopted to prevent potential bias introduced by not sizing charging infrastructure proportionally to the number of vehicles in operation.
Our assessment of the environmental impacts unfolds through several key steps. Firstly, the simulation results in Section 4.1 provide data on average kilometers covered by both vehicle types (cars and shared lightweight autonomous vehicles) across various vehicle configurations (speeds and battery ranges). Second, leveraging the environmental impacts calculation process presented in [16], we have calculated the grams of CO 2 per kilometer traveled. Lastly, for the purpose of comparing environmental impact reductions between scenarios, the total distance traveled by each system and the associated grams of CO 2 per kilometer traveled are taken into consideration. In order to model the fast-charging method, twice as many batteries per vehicle have been considered to account for the battery-swapping process.

2.3. Limitations

One of the limitations of this study is that we do not explicitly consider the dynamic effect of traffic congestion on system performance. While the speed for the baseline scenario is based on average urban speeds, it is important to note that congestion levels may vary throughout the day, which is not captured in our model. Similarly, while autonomous vehicles may navigate through traffic more efficiently, their speed may still be affected by interactions with other vehicles and pedestrians. While the speed considered for lightweight autonomous vehicles in this study reflects an average that would account for such interactions, explicitly modeling dynamic interactions and their impact on system performance remains an open question for future research. Further investigations in this area could provide valuable insights into understanding the operation of fleets of lightweight autonomous vehicles in busy urban environments.
Another limitation of this study pertains to its reliance on a single case study, which may limit the generalizability of the results to other cities or contexts. For this reason, we have focused on developing a tool that can be readily adapted for use in any city with available food delivery demand data. By ensuring the tool’s easy transferability and open-sourcing it, we aim to facilitate future case studies that address the question of the diverse implications across different cities.

3. Experimental Setup

3.1. Agent-Based Modeling Software

The ABM in this study has been developed using the GAMA Platform [25]. GAMA is an open-source tool specifically designed for spatially explicit multi-layer agent-based simulations. It has successfully been employed in various domains, including urban decision-making tools [26], epidemiology representation [27], and social simulation [28].

3.2. Case Study Location

While the model can be easily applied to any US city, we have chosen Cambridge, MA, as the case study for this research. Cambridge has a population of approximately 118,403 residents and covers an area of 17 square kilometers [29]. The boundary of the city can be observed in Figure 5.
The road network and buildings information have been integrated in the model in the form of GIS data, extracted from OpenStreetMap [30], and the Cambridge, MA, government website [31]. The data regarding the gas and charging station locations has been collected from OpenStreetMap [30] and Bluebikes [32] data, and also provides detailed information including their current capacity and location.

3.3. Input Demand Dataset

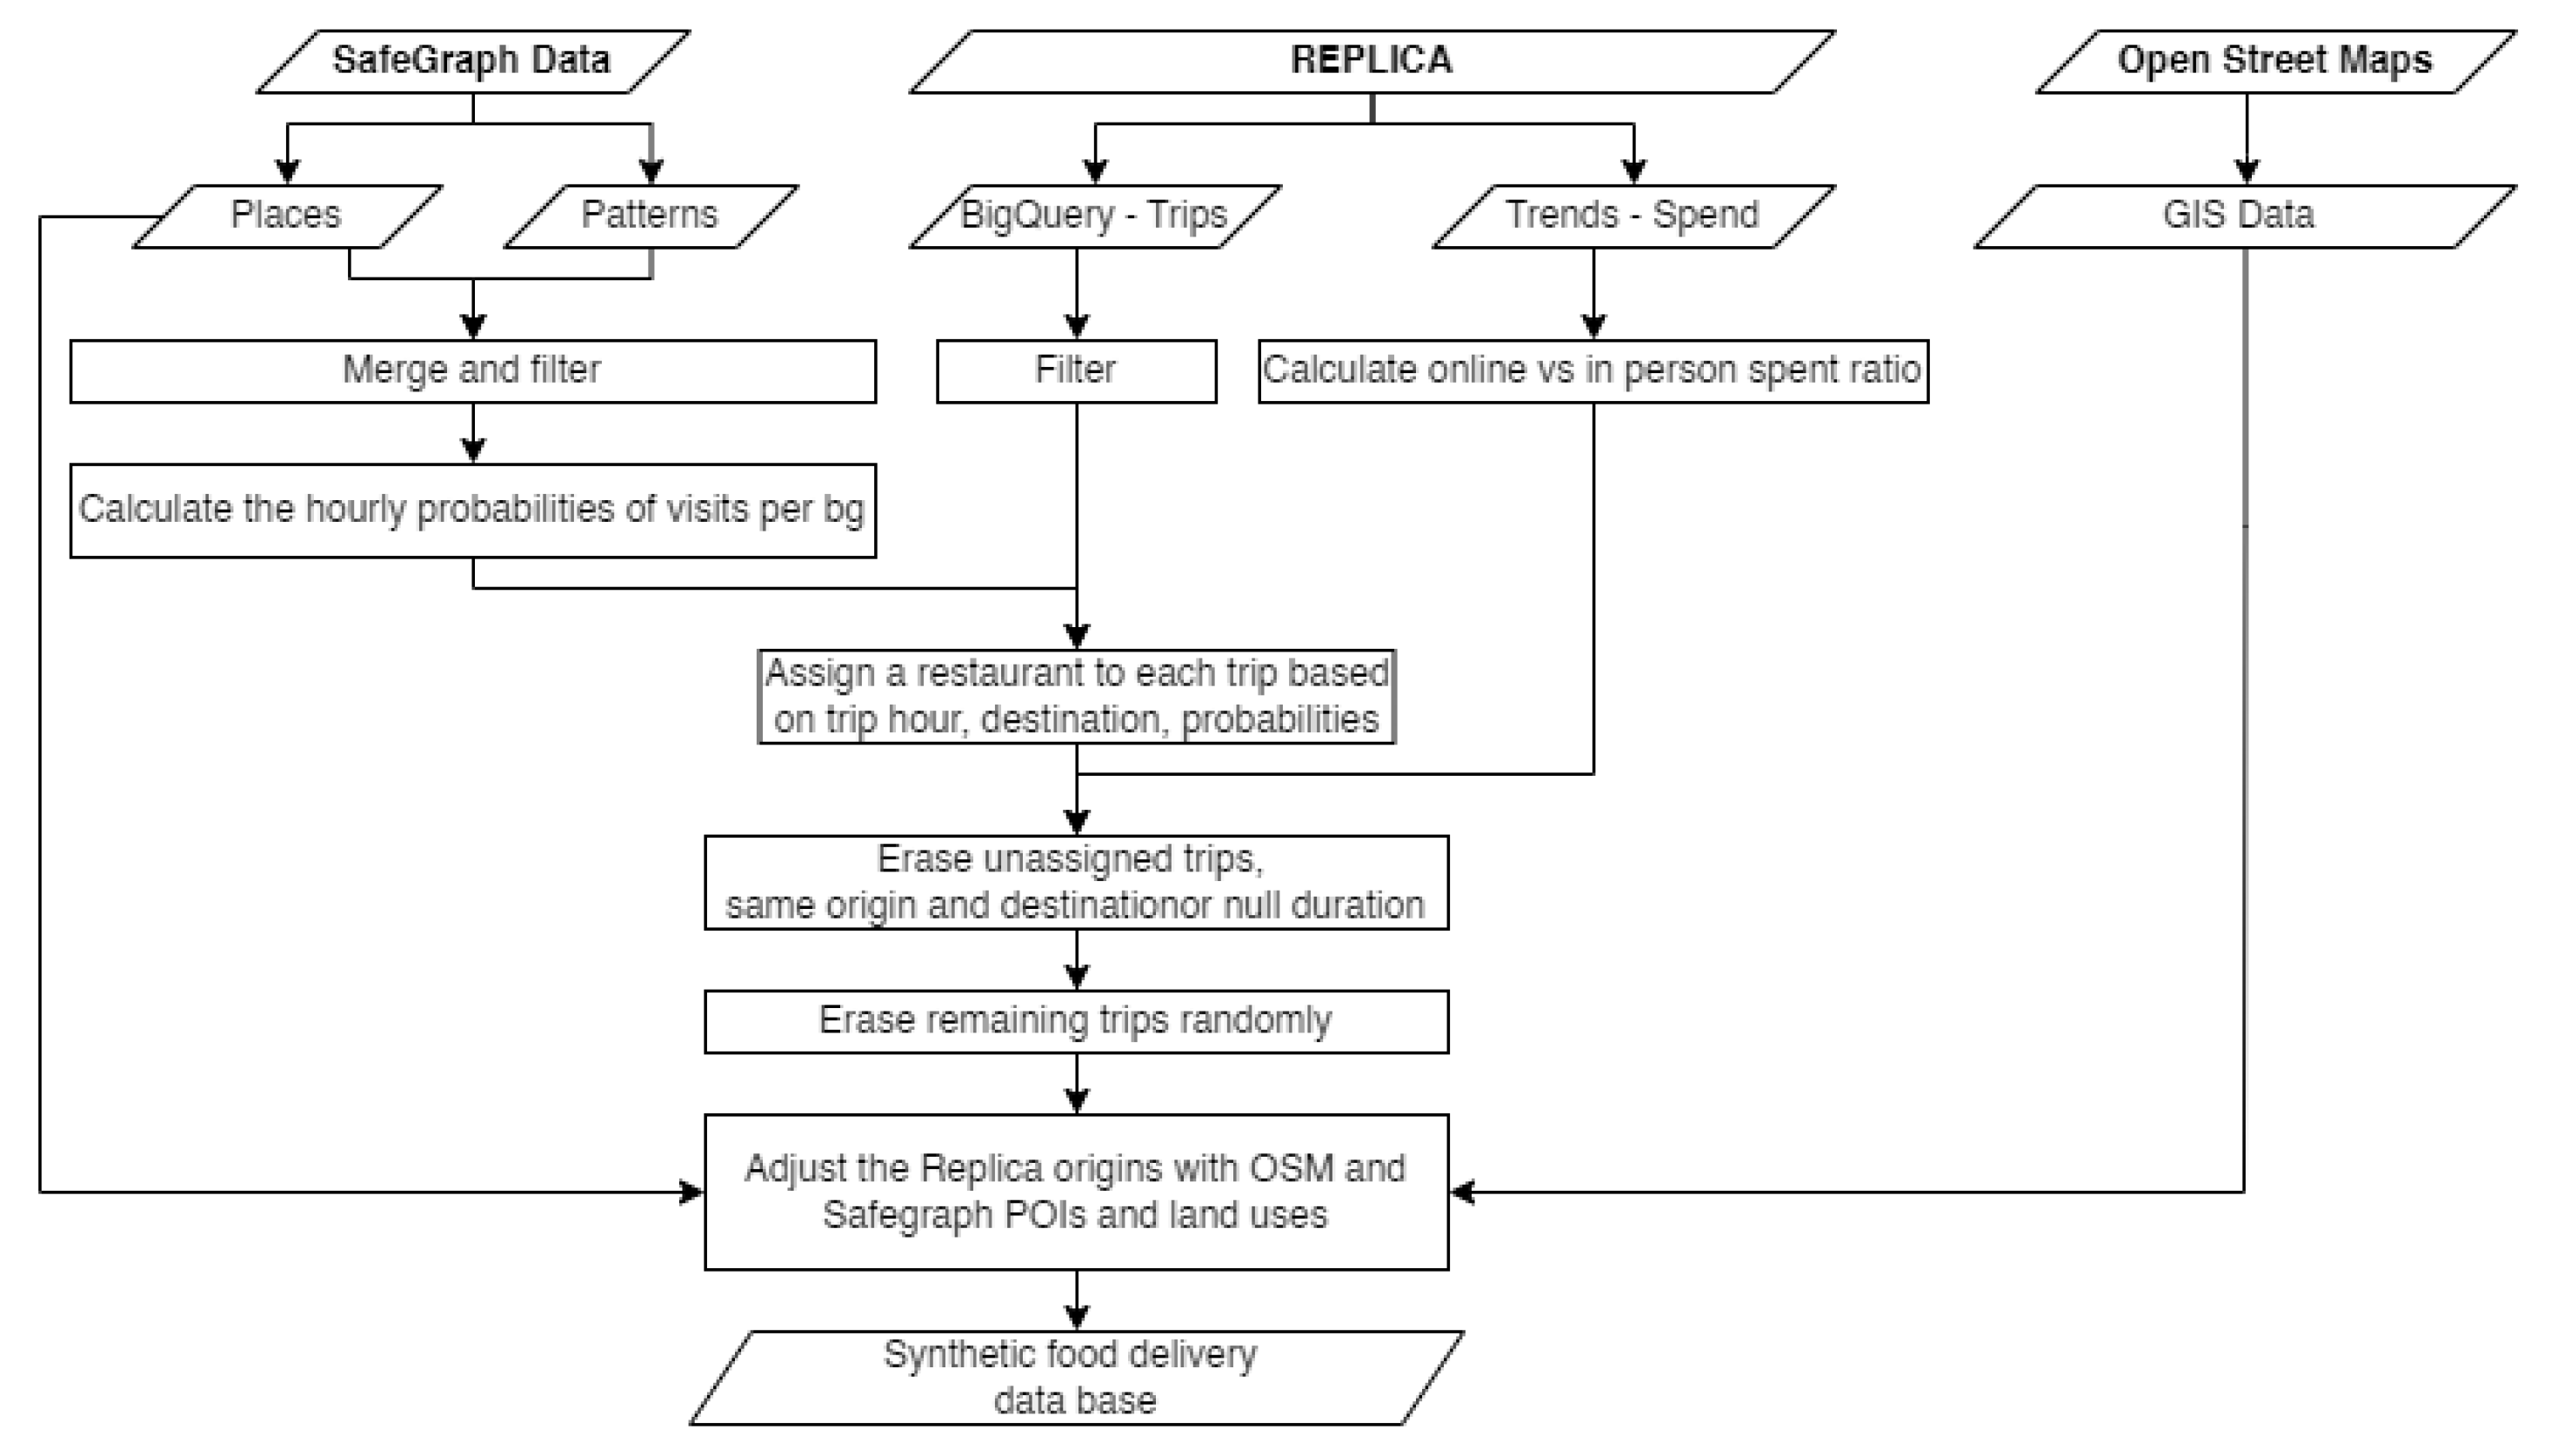
Since open-source data on food deliveries is limited, we have generated a synthetic demand dataset, based on three different sources. Firstly, general land use data was obtained from OpenStreetMap [30]. Secondly, data on trips made to go to restaurants and bars was obtained through Replica [33], which also provided a breakdown of online versus in-person food expenditures. Lastly, data on the popularity of specific restaurants within each block group was obtained through SafeGraph [34]. A simplified outline of methodology for generating the demand dataset is depicted in Figure 6. For more detailed information, please refer to Appendix A, Figure A1.
The first step was to filter Replica trips with origin and destination in Cambridge, and travel purpose of eating. Since Replica provides origins and destinations at block-group level, we assigned a specific restaurant from SafeGraph to each trip based on the popularity and open hours of the restaurants. To assign the origin of the trips, we created two association tables (Appendix A Table A1 and Table A2) that link the building land use types defined in Replica with the land uses provided by SafeGraph and Open Street Map. This allowed us to assign an exact location to each trip based on the land use of the origin building.
After assigning specific origins and destinations to each trip, the dataset was filtered to eliminate any unreasonable trips: we dropped all trips without a restaurant assignment, trips without a duration, and trips with the same coordinates for the origin and destination. Then, the number of trips was scaled proportionally to in-person versus online expenditures reported by Replica [33] and their average order size [7,35,36,37,38]. Since there are fewer online orders than in-person orders, the extra trips were removed randomly. As a last step, the origin and destination of the trips were inverted to represent how food delivery trips work (from the restaurant to any other location).
Using this methodology, we generated the food delivery demand dataset, consisting of 3989 trips. Figure 5 illustrates heat maps of the spatial density of trip origins and destinations and the number of food delivery orders placed at different times of the day.

3.4. Scenario Definition

In order to understand and analyze the performance of shared lightweight autonomous vehicles for food deliveries, we compared them to a baseline scenario that represents the way food deliveries are handled now.
The baseline scenario is composed of two different sub-scenarios: The first sub-scenario models food deliveries using internal combustion engine cars (ICE) as a baseline, while the second sub-scenario models battery electric vehicles (BEV) to account for the ongoing transition towards them.
In addition to the baseline scenario, a lightweight autonomous vehicle-based future scenario has also been studied through several operational decisions. Various system design parameters can be defined when designing a new mobility service to achieve the desired performance. Hence, we have examined the potential implications of different choices for these design parameters, including different vehicle configurations (i.e., battery sizes and autonomous driving speeds) and operational strategies related to vehicle charging (i.e., conventional, fast, and night charging, and strategic dispatching). The sub-scenarios considered in the lightweight autonomous vehicle scenario are the following:
  • Conventional charging (CC): This sub-scenario represents vehicles being charged at conventional plug-in charging stations, taking 4.5 h for a full-battery recharge, which reflects the performance of current lightweight electric vehicle charging processes [39].
  • Night charging (NC): In this sub-scenario, charging stations are conventional charging stations like in the CC scenario. However, vehicles with less than 90% battery charge are recharged during the night, coinciding with the lowest demand period (2–5 am).
  • Strategic dispatching (SD): This sub-scenario builds upon the NC scenario by adding a strategic condition for dispatching. In such strategic dispatching, instead of assigning the nearest available vehicle to each food delivery order, the dispatcher considers up to five nearest available vehicles and then assigns the one with the manually adjusted best distance to battery level ratio.
  • Fast charging (FC): In this sub-scenario, stations are battery swapping stations instead of plug-in stations. Battery swapping is a process where depleted batteries are replaced with fully charged ones. This process eliminates the need to wait for the battery to recharge. Therefore, the charging process is considered to take 1.85 min, which is an average of the two battery-swapping scenarios studied in [40].
A comprehensive summary of the scenarios analyzed and their parameters can be found in Table 1.

3.5. Vehicle Modeling

The analysis of the different scenarios and sub-scenarios described in Section 3.4 required different vehicles to be modeled in the ABM. In this section, we define the modeling assumptions for each vehicle type, which are also summarized in Table 1.
In the baseline scenario, ICE cars are considered to have a driving autonomy of 500 km and a refueling rate of 3 min [41,42]. For BEV cars, instead, the study assumes an autonomy of 342 km, which is the average range reported by EV-database [43] and a recharging rate of 30 min [44]. In both cases, cars have been modeled to travel at a constant speed of 30 km/h [33,45]. In addition, they are also considered to transition into the refuel/recharging state when their low gas/charge level is below 15% of the total tank/battery [46]. Gas and charging stations are located at the same locations as current gas stations in Cambridge [30] and considered to have the same capacity as them. Due to this limited capacity, vehicles are served in a first-come first-serve basis.
In the future scenario that models shared lightweight autonomous vehicles, instead of modeling their behavior with fixed parameters, we have analyzed different operational decisions that include several values proposed in Sanchez et al. [15]. This is due to the fact that modeling this emerging technology holds uncertainties regarding its real-world performance and, as indicated by previous studies, vehicle configuration parameters and charging operational strategies have a direct and very significant influence on fleet-level performance [13]. As a consequence, we have modeled several battery sizes (35–50–65 km), driving speeds (8–11–14 km/h), and charging strategies defined in Section 3.4. Shared lightweight autonomous vehicles are considered to enter a low battery state when their battery level is below 25% of their total capacity, and charging stations have been considered to be at the same locations and have the same capacities as the current Bluebikes [32] docking stations. Since the capacity of the stations is limited, the vehicles are charged in a first-come first-serve basis. The charging threshold has been considered to be higher than it is for cars because autonomous vehicle operators need to be more conservative in ensuring that vehicles never run out of battery before reaching a charging station.

4. Results and Discussion

This section presents the simulations’ results aimed at evaluating the performance of shared lightweight autonomous systems for food deliveries. As discussed in Section 3.4, we compare the performance of this new system with the current car-based delivery system, considering both internal combustion engine (ICE) cars and battery electric vehicles (BEV). Moreover, we analyze different vehicle configurations and operational strategies in lightweight autonomous systems. The summary of all the scenarios and sub-scenarios considered can be found in Table 1.
To facilitate a fair comparison, all systems in the study adhere to the same design criteria. In line with previous studies [13], this criteria has been based on a desired service level. Specifically, we have defined a quality standard requiring all trips to be served, with 95% of the trips taking less than 40 min from order to delivery, based on a national survey data by US-Foods [47].
The assessment of the lightweight autonomous system’s performance has been approached from two distinct angles. Firstly, in Section 4.1, an in-depth exploration of fleet-level performance is conducted, analyzing the interplay of various scenarios and parameters on the overall system performance. Secondly, in Section 4.2, these findings are leveraged to evaluate the corresponding environmental impacts. This comprehensive approach not only sheds light on aspects like user wait times and fleet sizes, but also delves into the environmental consequences of this potential transition to shared lightweight autonomous vehicles.

4.1. Fleet-Level Performance

This section evaluates the fleet-level performance across the different scenarios and sub-scenarios considered in this study. The exploration encompasses a detailed analysis of diverse vehicle configurations and charging operational strategies.
We first analyze the baseline scenario, which represents the current car-based deliveries in Section 4.1.1. Subsequently, we analyze the fleet-level performance of lightweight autonomous systems, as elaborated in Section 4.1.2.

4.1.1. Baseline Scenario: Current Car-Based Deliveries

This scenario’s main objective, described in Section 3.4, is to provide a baseline scenario against which we can evaluate shared lightweight autonomous systems. We present the main results obtained from the simulation in Figure 7 and Table 2.
As can be observed in Table 2, the specified service requirements can be met by serving the total demand of 3989 trips with 40 ICE cars. Figure 7 shows how the average wait time decreases with increased fleet sizes until the service level requirement is met. The main impact that can be expected from the transition towards BEVs from the fleet performance perspective is a slight increase in the required fleet size. As shown in Table 2, the same demand can be served with 45 BEVs. This is due to the longer recharge time for BEVs than the refueling time for ICE cars. However, it is noteworthy that the overall behavior and the relationship between service level and fleet size remain similar in both cases.

4.1.2. Future Scenario: Shared Lightweight Autonomous Vehicles

This scenario presents the results of the fleet performance of shared lightweight autonomous vehicle-based food deliveries, considering different vehicle configurations and charging operational strategies.
-
Vehicle configurations
The variations in service level under different vehicle configurations and fleet sizes are summarized in Table 3 and illustrated in Figure 8. Table 3 demonstrates that the fleet size required to meet the demand with the desired service level ranges from 170 to 310, depending on the chosen vehicle configurations. As anticipated, these fleet sizes are notably larger than the corresponding car fleets due to the lower speeds of vehicles (8–14 km/h versus 30 km/h). However, as discussed in Section 4.2, despite the increased fleet sizes, the lightweight nature of each vehicle offers potential improvements in environmental impacts.
The results in Table 3 and Figure 8 highlight the significant dependence of vehicle configurations on the required fleet sizes. The largest fleet size is almost twice as big as the smallest one, due to a number of factors: Firstly, faster vehicles can complete tasks quicker, reducing the number of vehicles needed. Additionally, larger battery ranges minimize the frequency of charging trips, resulting in greater vehicle availability and smaller required fleet size.
Notably, the transition from small to medium batteries has a more pronounced effect on fleet size improvement than the transition from medium to large batteries. Similarly, the increase in autonomous driving speed has a more substantial impact when transitioning from medium to high speed compared to the transition from low to medium speeds. These findings indicate that fleet operators can make specific cost-benefit trade-offs when deciding on vehicle configurations.
-
Charging operational strategies
This section examines different charging strategies and their potential impact on system performance and fleet size requirements. As discussed in Section 3.4, four charging strategies were studied: conventional charging (CC), night charging (NC), strategic dispatching (SD), and fast charging (FC). The fleet size variation in each scenario is presented in Table 4. This table reveals that the NC strategy can reduce the fleet size needed for small and medium battery sizes and low to medium travel speeds, but it has a negative impact at high speeds. Similarly, the SD strategy only shows a positive impact at slower speeds.
On the other hand, the FC strategy consistently and significantly reduces the required fleet size across all scenarios, with reductions ranging from 28.57% to 62.5%. Notably, the impact is more pronounced for smaller battery sizes due to their higher reliance on charging events. In fact, in the FC scenario, the minimum fleet size needed to meet the quality standard is independent of the battery size. However, it should be noted that, while cost is not explicitly modeled in this study, the cost of battery swapping (FC) stations tends to be higher than that of conventional charging stations. Consequently, determining the best solution will depend on context-specific cost trade-offs related to infrastructure and its operation versus having additional vehicles.
For further insights to understand the reasons behind these phenomena, refer to Figure A2, Figure A3, Figure A4 and Figure A5 in Appendix A. These figures demonstrate that in CC, NC, and SD scenarios, the fleet size is strongly influenced by the dynamics of vehicle charging. However, in the FC scenario, this dependency is significantly reduced because the battery-swapping process is fast.
Figure A2 and Figure A3 also illustrate that the peak of the concurrent number of vehicles charging in the NC scenario is comparable to that of the CC scenario. The peak is even higher in the SD scenario (Figure A4), while no peak is observed in the FC scenario (Figure A5). These results can be attributed to two synergistic effects: Firstly, charging vehicles at night in the NC and SD scenarios homogenizes the battery level across the fleet. Consequently, when vehicles start to deplete their batteries later in the day, there is a sudden surge of vehicles reaching low battery levels within a short period, resulting in the observed abrupt increase in the number of vehicles charging. Secondly, the SD strategy homogenizes the average distance traveled by vehicles per day by selecting vehicles based on the best distance-to-battery level ratio for trip assignments. This further concentrates the charging needs of vehicles in a specific period, leading to a more pronounced peak in the charging events.
In conclusion, two key findings emerge. Firstly, in the three scenarios involving conventional charging, the fleet size is constrained by the charging events. In contrast, in the fast charging (FC) scenario, the primary constraint is the demand itself. This significantly impacts the required fleet size, with the fast charging scenario requiring roughly half the fleet size compared to the other three scenarios. However, it should be noted that this scenario might lead to higher costs, depending on the relative costs of battery swapping infrastructure compared to the savings from needing fewer vehicles. Secondly, night charging (NC) and strategic dispatching (SD) strategies provide limited benefits in reducing the required fleet size due to the homogenization of battery levels and vehicle kilometers traveled. Consequently, a delayed and more abrupt peak of charging events still limits the fleet sizing.

4.2. Environmental Impacts

This section presents an overview of the potential reductions in the equivalent CO 2 emissions of a shared lightweight autonomous vehicle-based system with the different vehicle configurations and charging operational strategies analyzed in Section 4.1.2 and how they compare to current car-based systems analyzed in Section 4.1.1. Moreover, since current trends point towards the electrification of car fleets and a decarbonization of the electricity grid, we have also considered a scenario in which all cars would be electric, and the grid would be zero-carbon. This allows us to understand whether lightweight autonomous vehicles could also be environmentally beneficial in this potential future. The results of this analysis have been consolidated in Table 5.
In contrasting the existing car-based baseline scenario with the shared lightweight autonomous vehicle-based scenario, a consistently positive environmental impact is observed across all assessed vehicle configurations and charging strategies. Notably, as detailed in Table 5, under the current US electricity composition, transitioning food deliveries from combustion car-based to shared lightweight autonomous vehicle-based approach showcases potential for reducing CO 2 equivalent emissions between 81.33 % and 89.66%. Furthermore, even when contemplating a prospective car-based scenario utilizing BEVs in conjunction with a zero-carbon electricity grid, the reductions remain significant, ranging from 48.34% to 78.58%.
A recurring pattern emerges regarding the implications of the distinct autonomous driving speeds explored within this study: elevating the speed typically corresponds to a greater reduction in CO 2 emissions. Specifically, the reduction is particularly pronounced when transitioning from a slow configuration to a medium-speed variant, compared to the shift from medium to high speed. This trend is inherently tied to the system’s minimal performance-driven fleet size requisites. With increased vehicle speed, the time required to serve each trip is lower, subsequently decreasing the necessary fleet size to meet demand. Despite the potential increase in total kilometers traveled due to fewer vehicles, this drawback is counterbalanced by the reduction in environmental impact resulting from a decreased fleet size.
Concerning battery ranges, in scenarios in which conventional charging is employed (CC, NC, and SD), a bigger battery range is correlated with a smaller fleet size, thereby reducing the environmental impact. Since the fleet size reduction is higher in changing from small to medium batteries than in changing medium to large batteries (see Section 4.1.2), the environmental impact reductions are also more considerable from small to medium batteries. However, a divergent trend emerges in fast charging (FC) scenarios: a larger battery range yields a smaller reduction in CO 2 emissions. As the charging events in the FC scenario do not influence fleet sizing, increasing the battery range results in larger and more environmentally intensive batteries, with no subsequent reduction in fleet sizes. For this reason, increasing the battery range in the FC scenario has a negative impact.
Finally, considering the impact of the different charging operational strategies, it is concluded that the reductions in the CC, NC, and SD scenarios are similar, while the FC scenario exhibits the most substantial reductions. Consequently, despite the necessity for twice as many batteries per vehicle in the FC scenario, the resultant reduction in fleet size contributes to reducing the environmental impact.
In conclusion, while shared lightweight autonomous systems require more vehicles than current car-based systems, this study underscores their potential to effectively and significantly mitigate environmental impacts. Moreover, the results highlight a high dependency of the environmental impacts on the configuration metrics. This indicates that fleet design and operation-related decisions can have a determinant effect. Therefore, decision-making processes and regulations can play a significant role in defining the environmental outcomes of lightweight autonomous vehicles for food deliveries.

5. Interactive Simulation Tool

With the goal of making the results of this study more accessible, we developed an interactive version of the simulation model. This tool provides stakeholders with a firsthand exploration of the model’s outcomes. The model is dynamically linked to the ABM and environmental impact study outlined in Section 2, enabling users to interact with the design variables discussed in Section 3 and receive real-time feedback.
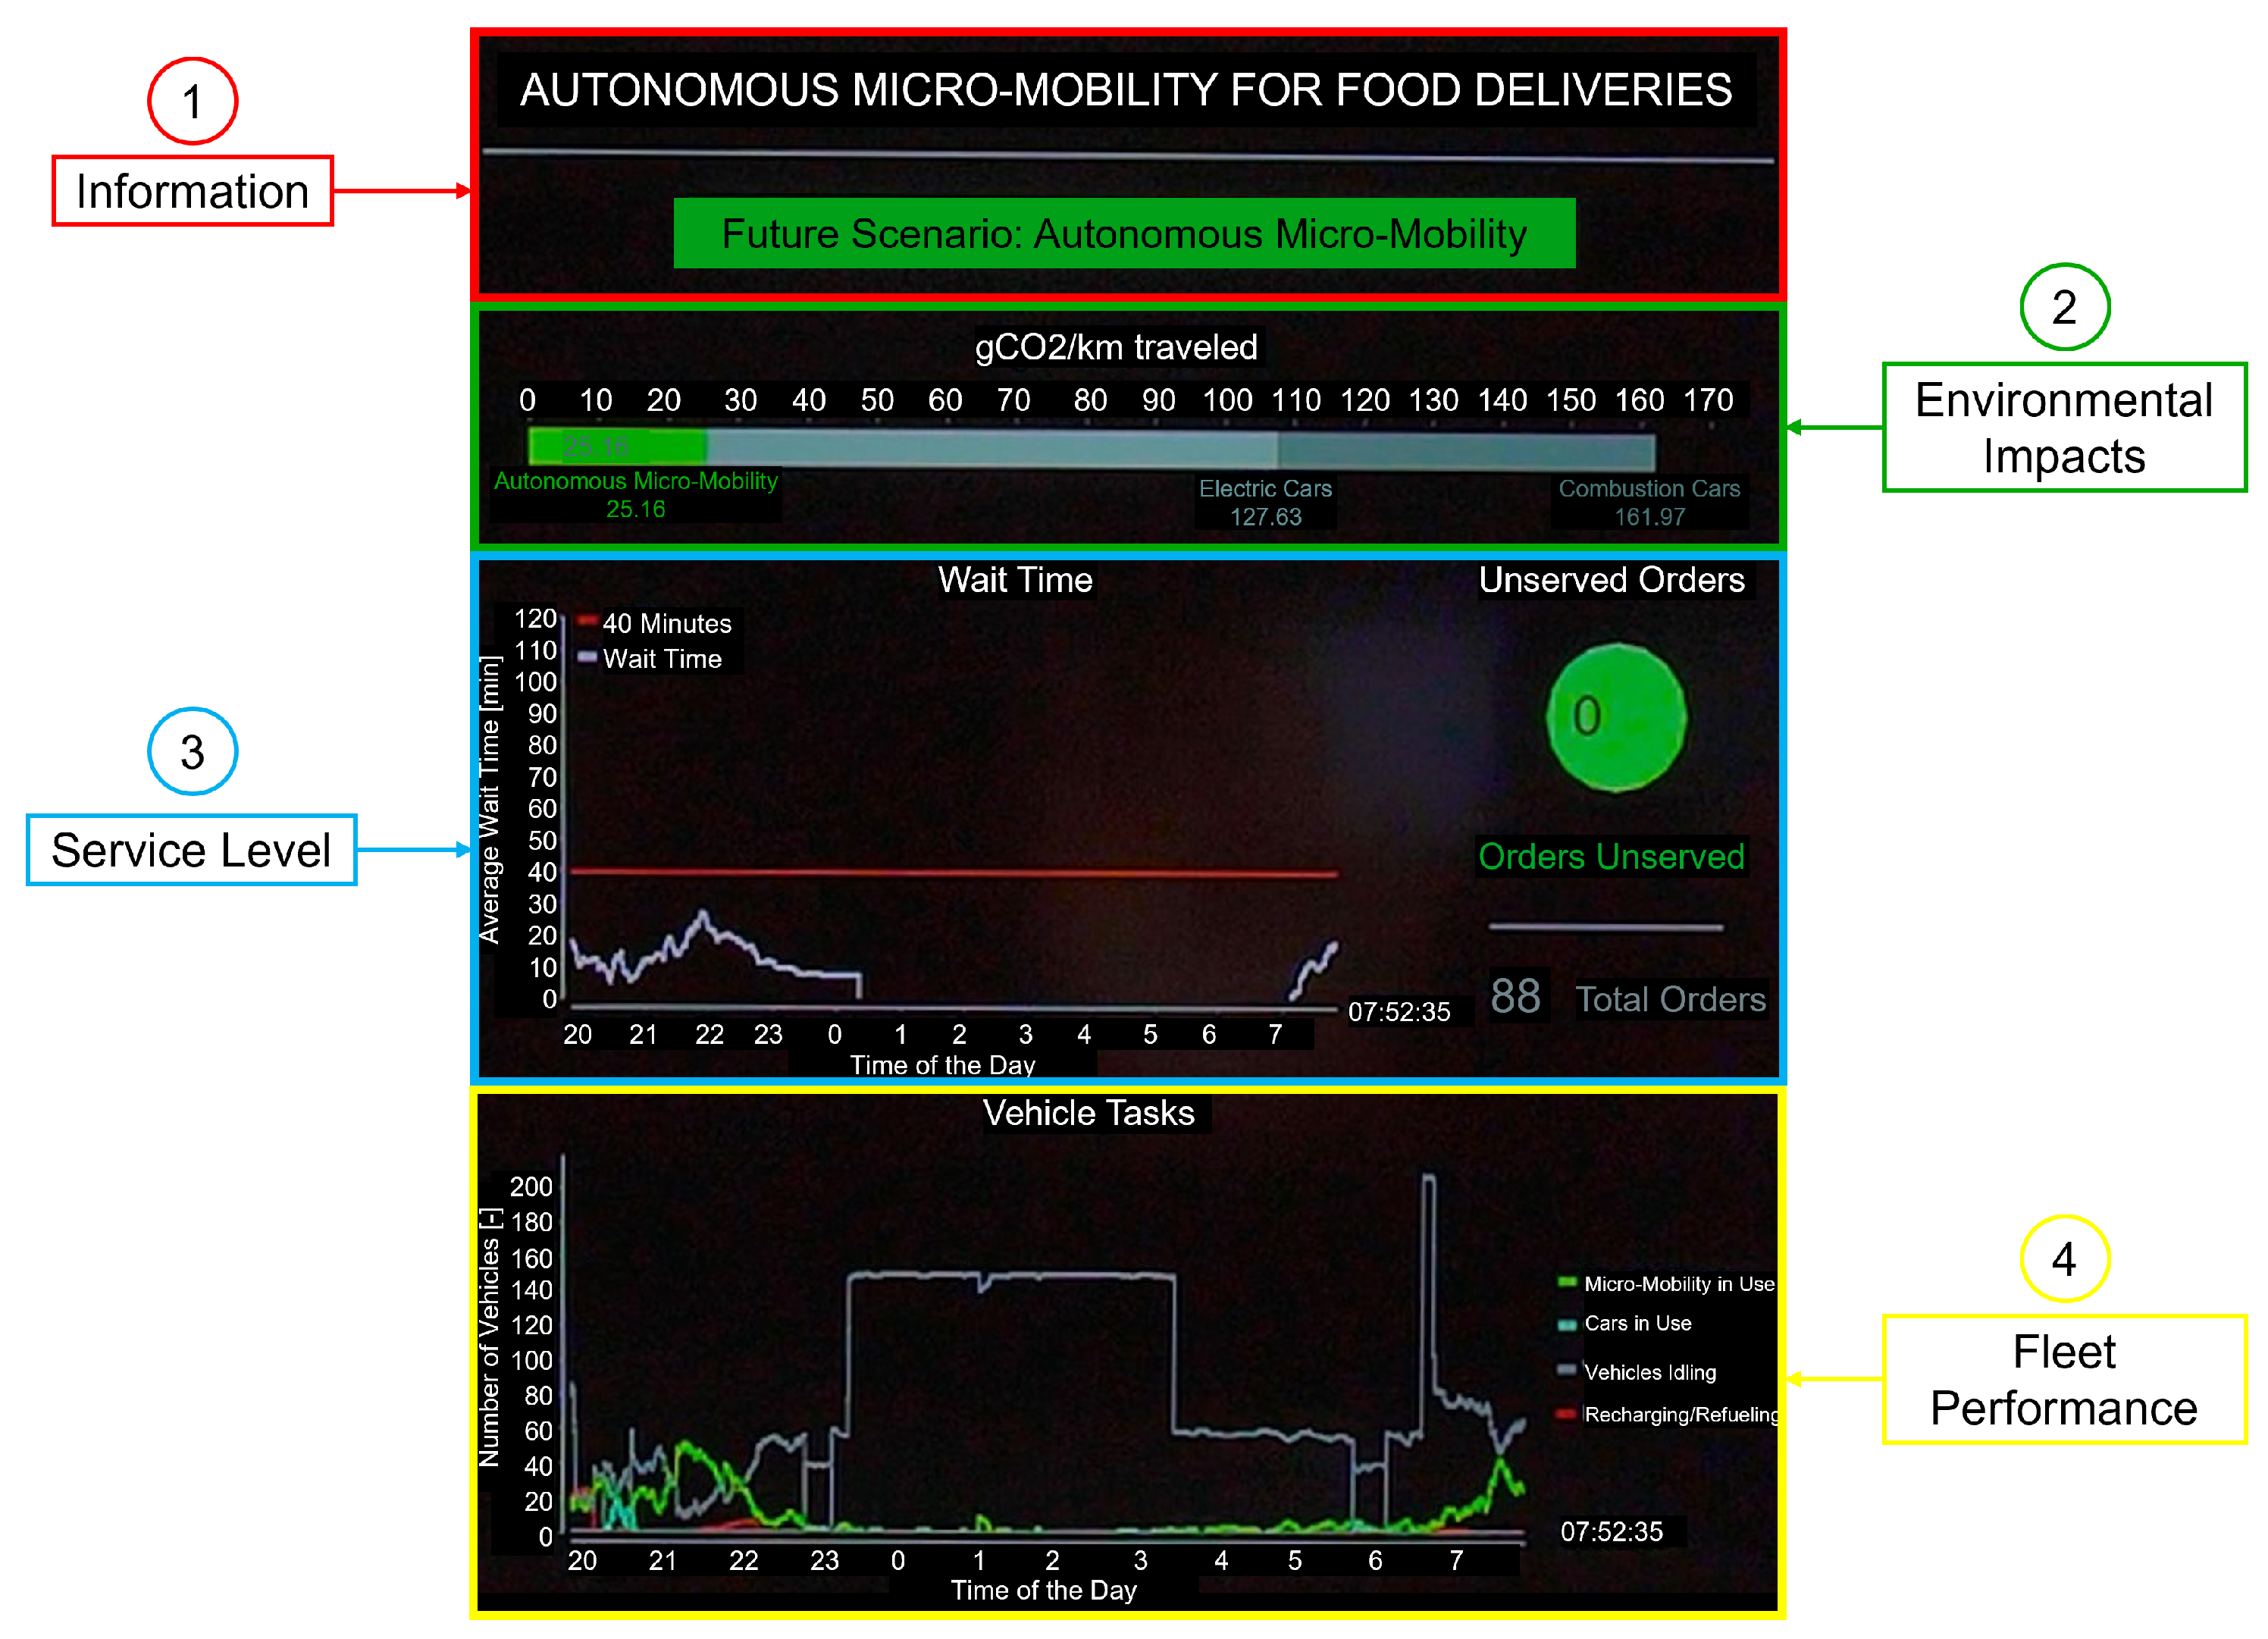
Inspired by projects like the CityScope, we have developed a tangible tool that allows for collaborative manipulation by different users [26]. The configuration comprises two main components: (1) a television monitor showcasing various performance indicators (Figure 9), and (2) a dynamic map display projected onto a horizontal surface (Figure 10).
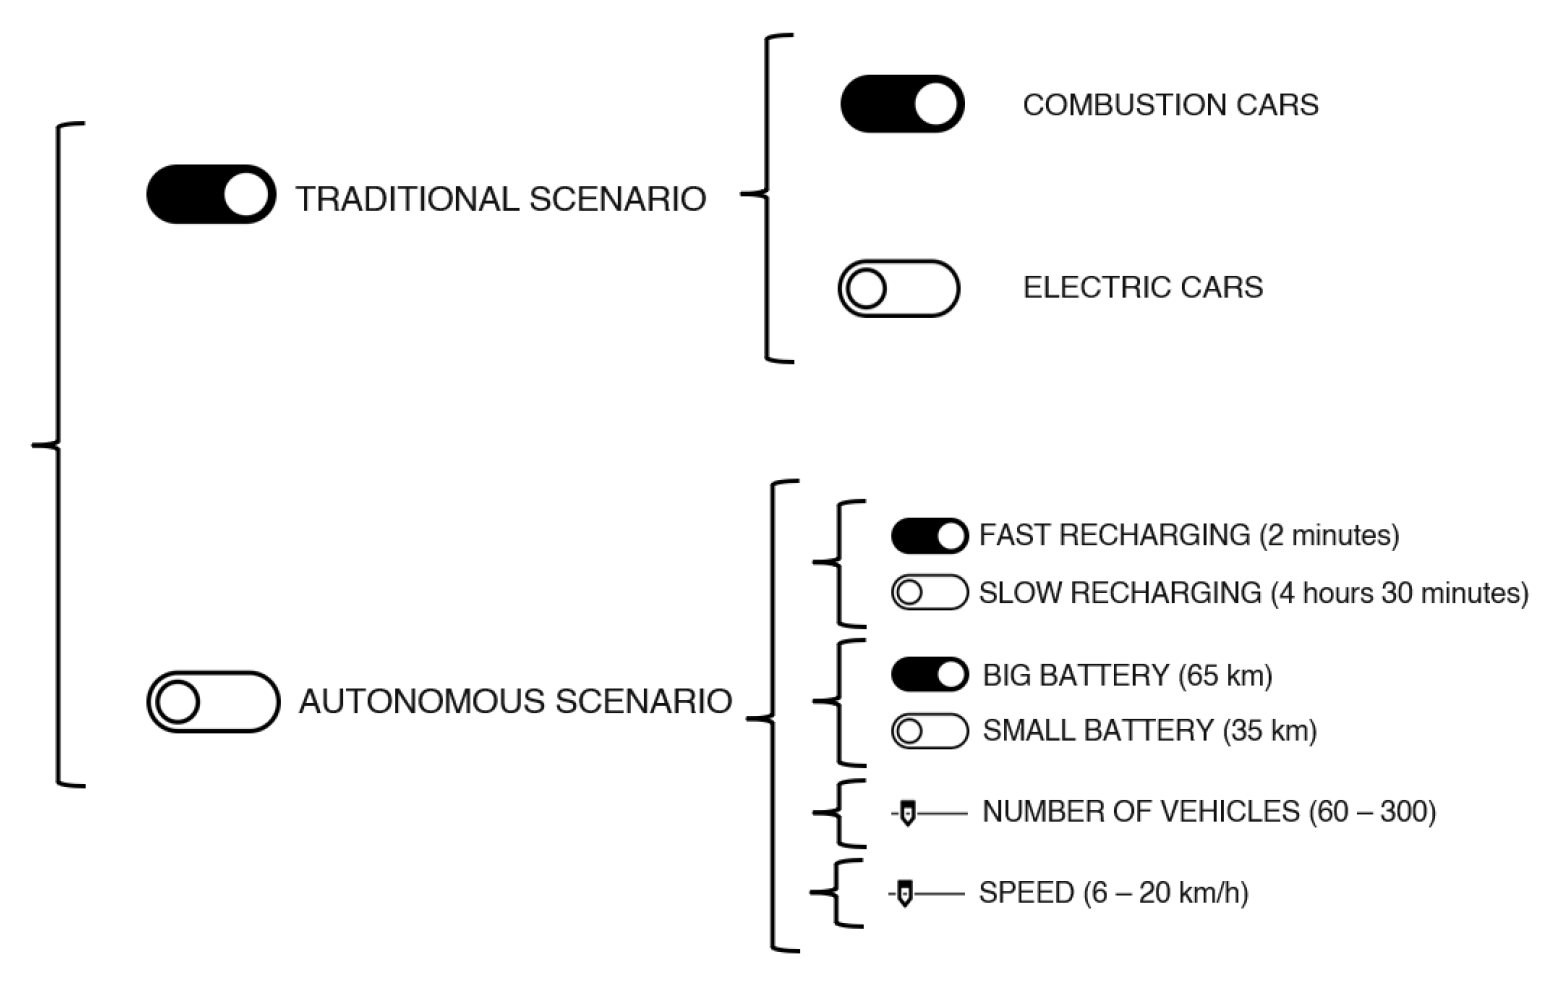
Users engage with the model through a custom-made interactive board (Figure 10(1)). This board allows users to select the simulation scenarios and define their lightweight autonomous vehicle fleet system, customizing vehicle configurations and charging strategies, as depicted in Figure 11.
The indicators’ display, illustrated in Figure 9, offers insights into environmental impacts, service levels, and fleet performance. It begins with an informative category showcasing the project’s title and visualized scenarios. Environmental impacts are presented through a dynamic bar chart depicting CO 2 emissions per vehicle kilometer, updating in real-time according to user interactions. Service level indicators are comprised of an average wait time chart for food delivery orders and a counter for unfulfilled orders. Additionally, real-time vehicle activities are showcased, representing the tasks (idle, pick up/delivery, charging) that different vehicles are performing and how they evolve over time. While cost considerations have not been included in the current version of the tool, we plan to include them in future versions.
Lastly, the dynamic map display in Figure 10 provides a detailed visual overview of the study area’s map, agents’ movements on roads, and relevant simulation activities. This display incorporates: a city road network map, moving agents with real-time activities represented using distinct colors and shapes, and an accompanying legend.
As mobility systems grow in complexity, so does decision-making. This interactive and adaptable method fosters consensus in complex, multi-stakeholder scenarios. By facilitating meaningful discussions, it could help stakeholders grasp trade-offs and perspectives, ultimately informing better decisions in mobility system design, development, and deployment. We have performed preliminary evaluations of the effectiveness of this tool with diverse stakeholders. However, we anticipate conducting more comprehensive testing in the future to evaluate its usefulness in real decision-making processes.

6. Conclusions

This study focuses on the mobility innovations that have been catalyzed by the surge in online food deliveries in recent years. As researchers and delivery companies explore lightweight autonomous vehicles to serve food deliveries, this research focuses on the fleet-level performance and environmental implications of these new vehicles. We assess the impact of diverse autonomous vehicle configurations and charging strategies in fleet-level performance through an agent-based model, and we evaluate the corresponding environmental implications through a life cycle assessment.
The findings of our analysis reveal that driving speed and battery range influence fleet size, with faster speeds and extended ranges leading to reduced fleet requirements. Charging strategies exhibit diverse impacts on fleet size, with fast charging proving to be the most efficient in reducing fleet sizes and environmental impacts. Overall, the potential for substantial environmental mitigation is significant despite the larger fleet sizes required for autonomous systems compared to current car-based services. These conclusions pose an important step in evaluating the viability of lightweight autonomous vehicles as a transformative alternative to conventional food delivery practices.
Lastly, the interactive decision-making tool developed offers stakeholders a user-friendly platform to extract valuable insights and facilitate informed discussions, supporting decision-making within this evolving landscape.

Author Contributions

Conceptualization, A.G.C., N.C.S. and K.L.; Methodology, A.G.C. and N.C.S.; Software, A.G.C., N.C.S., A.G. and E.L.W.; Validation, A.G.C. and N.C.S.; Formal Analysis, A.G.C.; Investigation, A.G.C.; Resources, A.G.C. and E.L.W.; Data Curation, A.G.C.; Writing—Original Draft Preparation, A.G.C. and N.C.S.; Writing—Review & Editing, A.G.C., N.C.S., A.G. and E.L.W.; Visualization, A.G.C. and N.C.S.; Supervision, K.L.; Project Administration, K.L. and N.C.S.; Funding Acquisition, K.L. All authors have read and agreed to the published version of the manuscript.

Funding

This research received no external funding.

Institutional Review Board Statement

Not applicable.

Informed Consent Statement

Not applicable.

Data Availability Statement

Restrictions apply to the availability of the raw data used for this project. Data were obtained from Replica and SafeGraph and are available from the authors with the permission of the aforementioned companies. The synthetic database generated based on the raw data and the code utilized for this study can be found on GitHub: https://github.com/CityScope/FoodDeliveries/ (accessed on 22 May 2024).

Acknowledgments

We thank the GAMA Platform developer community for their support in this project.

Conflicts of Interest

The authors declare no conflict of interest.

Appendix A

Figure A1. Complete diagram of the synthetic database generation process for obtaining the fine-grained food delivery demand dataset.
Futuretransp 04 00030 g0a1
Table A1. Land use tag association to each of the Replica trips based on their origin building land use information.
Land UseOrigin Building Land Use
ResidentialResidential
Mixed-use—Residential
Mixed-use—Retail—Previous activity = Home or Work from home
IndustrialIndustrial
Mixed-use—Industrial
OfficeMixed-use—Office
Commercial—Office
ShopMixed-use—Retail—Previous activity = Shop
Commercial—Retail—Previous activity = Shop
HotelCommercial—Retail—Previous activity = Lodging
RestaurantsMixed-use—Retail—Previous activity = Eat, Social or Other Activity Commercial—Retail—Previous activity = Eat, Social or Other Activity
WorkMixed-use—Retail—Previous activity = Work or Maintenance
Commercial—Retail—Previous activity = Work or Maintenance
Non-Retail AttractionsMixed-use—Non-retail attraction
Commercial—Non-retail attraction
ParkOpen space
Mixed-use—Open Space
Mixed-use—Retail—Previous activity = Recreation
Commercial—Retail—Previous activity = Recreation
Transportation UtilitiesTransportation utilities
Mixed-use—Transportation utilities
Civic InstitutionalCivic institutional—Civic institutional
Mixed-use—Civic institutional
EducationCivic-institutional—Education
Mixed-use—Education
Mixed-use—Retail—Previous Activity = School
Commercial—Retail—Previous Activity = School
HealthcareCivic-institutional—Healthcare
Mixed-use—Healthcare
Figure A2. Number of SLAVs carrying out different activities throughout the day in the conventional charging (CC) sub-scenario.
Futuretransp 04 00030 g0a2
Figure A3. Number of SLAVs carrying out different activities throughout the day in the night charging (NC) sub-scenario.
Futuretransp 04 00030 g0a3
Table A2. Land use tag association to each of the SafeGraph and Open Street Map points of interest (Part 1/3).
Land UseOrigin Building Land Use
ResidentialOpen Street Map:
- Residential.
- Mixed-use residential.
- Assisted living/boarding house.
- Education residential.
IndustrialSafeGraph:
- Gambling Industries.
- Coating, engraving, heat treating, and allied activities.
- Machinery, equipment, and supplies merchant wholesalers.
- Motion picture and video industries.
- Converted paper product manufacturing.
- Glass and glass product manufacturing.
- Electric power generation, transmission, and distribution.
- Beverage manufacturing.
- Sound recording industries.
- Bakeries and tortilla manufacturing.
- Other amusement and recreation industries.
- Other miscellaneous manufacturing.
OfficeSafeGraph:
- Offices of real estate agents and brokers.
- Management of companies and enterprises.
- Agencies, brokerages, and other insurance-related activities.
- Electronic and precision equipment repair and maintenance.
- Architectural, engineering, and related services.
- Personal and household goods repair and maintenance.
- Other professional, scientific, and technical assistance.
- Building equipment contractors.
- Automobile dealers.
- Activities related to real estate.
- Other financial investment activities.
- Travel arrangement and reservation services.
- Radio and television broadcasting.
- Automotive equipment rental and leasing.
- Management, scientific, and technical consulting services.
- Building materials and supplies dealers.
- Consumer goods rental.
- Building finishing contractors.
- Couriers and express delivery services.
- Cable and other subscription programming.
- Advertising, public relations, and related services.
- Administration of human resource programs.
- Other specialty trade contractors.
Figure A4. Number of SLAVs carrying out different activities throughout the day in the strategic dispatching (SD) sub-scenario.
Futuretransp 04 00030 g0a4
Figure A5. Number of SLAVs carrying out different activities throughout the day in the fast charging (FC) sub-scenario.
Futuretransp 04 00030 g0a5
Table A3. Land use tag association to each of the SafeGraph and Open Street Map points of interest (Part 2/3).
ShopSafeGraph:
- Jewelry, luggage, and leather goods stores.
- Clothing stores.
- Office supplies, stationery, and gift stores.
- Furniture stores.
- Beer, wine, and liquor stores.
- Grocery stores.
- Specialty food store.
- Shoe stores.
- Florists.
- Health and personal care stores.
- Printing and related support activities.
- Home furnishing stores.
- Electronics and appliance stores.
- Department stores.
- Used merchandise stores.
- Drugs and druggists’ sundries merchant wholesalers.
- General merchandise stores, including warehouse clubs and supercenters.
- Lawn and garden equipment and supplies stores.
- Other motor vehicle dealers.
- Book stores and new dealers.
- Other miscellaneous store retailers.
HotelSafeGraph:
- Traveler accommodation.
RestaurantsSafeGraph:
- Restaurants and other eating places.
- Drinking places (alcoholic beverages).
- Special food services.
WorkSafeGraph: All the shops, hotels, and restaurants
Non-Retail AttractionsSafeGraph:
- Sporting goods, hobbies, and musical instrument stores.
- Museums, historical sites, and similar instructions.
- Amusement parks and arcades.
- Performing arts companies.
- Promoters of performing arts, sports, and similar events.
- Religious organizations.
ParkOpen Street Map:
- Public open space.
- Private own open space.
Table A4. Land use tag association to each of the SafeGraph and Open Street Map points of interest (Part 3/3).
Transportation UtilitiesOpen Street Map:
- Bicycle parking.
- Bicycle repair station.
- Bicycle rental.
- Boat rental.
- Boat sharing.
- Bus station.
- Car rental.
- Car sharing.
- Car wash.
- Vehicle inspection.
- Charging station.
- Ferry terminal.
- Fuel.
- Grit bin.
- Motorcycle parking.
- Parking.
- Parking entrance.
- Parking space.
- Taxi.
Civic InstitutionalOpen Street Map:
- Courthouse.
- Embassy.
- Fire station.
- Police.
- Post box.
- Post depot.
- Post office.
- Prison.
- Ranger station.
- Townhall.
EducationSafeGraph:
- Colleges, universities, and professional schools.
- Technical trade and trade schools.
- Administration of economic programs.
- Elementary and secondary schools.
- Child day care services.
- Other schools and instruction.
HealthcareSafeGraph:
- Offices of physicians.
- Offices of dentists.
- Offices of other health practitioners.
- Outpatient care centers.
- Nursing care facilities (skilled nursing facilities).
- Nursing and residential care facilities.
- Medical and diagnostic laboratories.
- General medical and surgical hospitals.
- Specialty (except psychiatric and substance abuse) hospitals.
- Insurance carriers.
- Personal care services.
- Individual and family services.
- Death care services.
- Other personal services.
- Home health care services.

References

  1. United Nations, Department of Economic and Social Affairs, Population Division. World Population Prospects 2022: Summary of Results; UN DESA/POP/2022/TR/NO. 3; Technical Report; United Nations: New York, NY, USA, 2022. [Google Scholar]
  2. Li, D.; Ma, J.; Cheng, T.; van Genderen, J.L.; Shao, Z. Challenges and opportunities for the development of megacities. Int. J. Digit. Earth 2019, 12, 1382–1395. [Google Scholar] [CrossRef]
  3. Jaller, M.; Dennis, S. E-Commerce and Mobility Trends During COVID-19. In Pandemic in the Metropolis; Springer: Berlin/Heidelberg, Germany, 2023; pp. 79–93. [Google Scholar]
  4. Mokhtarian, P.L. A conceptual analysis of the transportation impacts of B2C e-commerce. Transportation 2004, 31, 257–284. [Google Scholar] [CrossRef]
  5. Pettersson, F.; Winslott Hiselius, L.; Koglin, T. E-commerce and urban planning–comparing knowledge claims in research and planning practice. Urban Plan. Transp. Res. 2018, 6, 1–21. [Google Scholar] [CrossRef]
  6. Mangiaracina, R.; Marchet, G.; Perotti, S.; Tumino, A. A review of the environmental implications of B2C e-commerce: A logistics perspective. Int. J. Phys. Distrib. Logist. Manag. 2015, 45, 565–591. [Google Scholar] [CrossRef]
  7. Ahuja, K.; Chandra, V.; Lord, V.; Peens, C. Ordering in: The rapid evolution of food delivery. McKinsey Co. 2021, 22, 1–13. [Google Scholar]
  8. Sanchez, N.C.; Pastor, L.A.; Larson, K. Autonomous bicycles: A new approach to bicycle-sharing systems. In Proceedings of the 2020 IEEE 23rd International Conference on Intelligent Transportation Systems (ITSC), Virtual, 20–23 September 2020; IEEE: New York, NY, USA, 2020; pp. 1–6. [Google Scholar]
  9. Lin, M.C.L. Affordable Autonomous Lightweight Personal Mobility. Ph.D. Thesis, Massachusetts Institute of Technology, Cambridge, MA, USA, 2021. [Google Scholar]
  10. Poeting, M.; Schaudt, S.; Clausen, U. Simulation of an optimized last-mile parcel delivery network involving delivery robots. In Interdisciplinary Conference on Production, Logistics and Traffic; Springer: Berlin/Heidelberg, Germany, 2019; pp. 1–19. [Google Scholar]
  11. Li, J.; Rombaut, E.; Vanhaverbeke, L. A systematic review of agent-based models for autonomous vehicles in urban mobility and logistics: Possibilities for integrated simulation models. Comput. Environ. Urban Syst. 2021, 89, 101686. [Google Scholar] [CrossRef]
  12. Fagnant, D.J.; Kockelman, K.M. The travel and environmental implications of shared autonomous vehicles, using agent-based model scenarios. Transp. Res. Part C Emerg. Technol. 2014, 40, 1–13. [Google Scholar] [CrossRef]
  13. Chen, T.D.; Kockelman, K.M.; Hanna, J.P. Operations of a shared, autonomous, electric vehicle fleet: Implications of vehicle & charging infrastructure decisions. Transp. Res. Part A Policy Pract. 2016, 94, 243–254. [Google Scholar]
  14. Romano Alho, A.; Sakai, T.; Oh, S.; Cheng, C.; Seshadri, R.; Chong, W.H.; Hara, Y.; Caravias, J.; Cheah, L.; Ben-Akiva, M. A simulation-based evaluation of a Cargo-Hitching service for E-commerce using mobility-on-demand vehicles. Future Transp. 2021, 1, 639–656. [Google Scholar] [CrossRef]
  15. Sanchez, N.C.; Martinez, I.; Pastor, L.A.; Larson, K. On the performance of shared autonomous bicycles: A simulation study. Commun. Transp. Res. 2022, 2, 100066. [Google Scholar] [CrossRef]
  16. Sanchez, N.C.; Pastor, L.A.; Larson, K. Can autonomy make bicycle-sharing systems more sustainable? An environmental impact analysis. Transp. Res. Part D Transp. Environ. 2022, 113, 103489. [Google Scholar] [CrossRef]
  17. Kondor, D.; Zhang, X.; Meghjani, M.; Santi, P.; Zhao, J.; Ratti, C. Estimating the potential for shared autonomous scooters. IEEE Trans. Intell. Transp. Syst. 2021, 23, 4651–4662. [Google Scholar] [CrossRef]
  18. Haas, I.; Friedrich, B. Developing a micro-simulation tool for autonomous connected vehicle platoons used in city logistics. Transp. Res. Procedia 2017, 27, 1203–1210. [Google Scholar] [CrossRef]
  19. Samouh, F.; Gluza, V.; Djavadian, S.; Meshkani, S.; Farooq, B. Multimodal Autonomous Last-Mile Delivery System Design and Application. In Proceedings of the 2020 IEEE International Smart Cities Conference (ISC2), Virtual, 28 September–1 October 2020; IEEE: New York, NY, USA, 2020; pp. 1–7. [Google Scholar]
  20. Da Vimercate, A.D.C. Autonomous Robots in Food Delivery: A Simulation Study. Master’s Thesis, Politecnico di Milano, Milano, Italy, 2019. [Google Scholar]
  21. Tiboni, M.; Rossetti, S.; Vetturi, D.; Torrisi, V.; Botticini, F.; Schaefer, M.D. Urban policies and planning approaches for a safer and climate friendlier mobility in cities: Strategies, initiatives and some analysis. Sustainability 2021, 13, 1778. [Google Scholar] [CrossRef]
  22. ISO 14044:2006; Environmental Management—Life Cycle Sssessment—Requirements and Guidelines. ISO: Geneva, Switzerland, 2006.
  23. Finnveden, G.; Hauschild, M.Z.; Ekvall, T.; Guinée, J.; Heijungs, R.; Hellweg, S.; Koehler, A.; Pennington, D.; Suh, S. Recent developments in life cycle assessment. J. Environ. Manag. 2009, 91, 1–21. [Google Scholar] [CrossRef] [PubMed]
  24. United States Environmental Protection Agency (EPA). Inventory of U.S. Greenhouse Gas Emissions and Sinks 1990–2019; United States Environmental Protection Agency: Washington, DC, USA, 2021. [Google Scholar]
  25. Taillandier, P.; Gaudou, B.; Grignard, A.; Huynh, Q.N.; Marilleau, N.; Caillou, P.; Philippon, D.; Drogoul, A. Building, composing and experimenting complex spatial models with the GAMA platform. GeoInformatica 2019, 23, 299–322. [Google Scholar] [CrossRef]
  26. Noyman, A. CityScope: An Urban Modeling and Simulation Platform. Ph.D. Thesis, Massachusetts Institute of Technology, Cambridge, MA, USA, 2022. [Google Scholar]
  27. Drogoul, A.; Taillandier, P.; Gaudou, B.; Choisy, M.; Chapuis, K.; Quang, N.H.; Nguyen-Ngoc, D.; Philippon, D.; Brugière, A.; Larmande, P. Designing social simulation to (seriously) support decision-making: COMOKIT, an agent-based modelling toolkit to analyse and compare the impacts of public health interventions against COVID-19. Rev. Artif. Soc. Soc. Simul.-RofASSS 2020. [Google Scholar] [CrossRef] [PubMed]
  28. Caillou, P.; Gaudou, B.; Grignard, A.; Truong, C.Q.; Taillandier, P. A simple-to-use BDI architecture for agent-based modeling and simulation. In Advances in Social Simulation 2015; Springer: Berlin/Heidelberg, Germany, 2017; pp. 15–28. [Google Scholar]
  29. Bureau, U.S.C. QuckFacts Cambridge City, Massachusetts. 2020. Available online: https://www.census.gov/quickfacts/cambridgecitymassachusetts (accessed on 22 May 2024).
  30. OpenStreetMap. Open Street Maps. 2023. Available online: https://www.openstreetmap.org/ (accessed on 22 May 2024).
  31. Cambridge, C. Geographic Information System City of Cambridge, MA. 2023. Available online: https://www.cambridgema.gov/GIS (accessed on 22 May 2024).
  32. Bluebikes. Bluebikes System Data. 2020. Available online: https://www.bluebikes.com/system-data (accessed on 22 May 2024).
  33. Replica. Data to Drive Decisions about the Built Environment. 2022. Available online: https://www.replicahq.com/ (accessed on 22 May 2024).
  34. SafeGraph. Your Partner in Places Data. 2022. Available online: https://www.safegraph.com/ (accessed on 22 May 2024).
  35. Kimes, S.E.; Collier, J. Customer-Facing Payment Technology in the US Restaurant Industry; Cornell University Press: New York, NY, USA, 2014. [Google Scholar]
  36. NPD News. Solo Diners Represent the Largest Share of the US Restaurant Visits among Party Sizes. 2020. Available online: https://www.prweb.com/releases/solo-diners-represent-the-largest-share-of-u-s-restaurant-visits-among-party-sizes-864492473.html (accessed on 30 May 2024).
  37. 1010data. 1010data Market Insights Restaurant Delivery Report. 2016. Available online: https://tinyurl.com/tu75yp54 (accessed on 22 May 2024).
  38. Coppola, D. Sales Distribution among Leading Food Delivery Services in Selected Cities in the United States as of April 2021. 2022. Available online: https://www.statista.com/statistics/1170093/food-delivery-sales-share-us-cities/ (accessed on 22 May 2024).
  39. International Transport Forum. Good to Go? Assessing the Environmental Performance of New Mobility Corporate Partnership Board Report. 2020. Available online: https://www.itf-oecd.org/sites/default/files/docs/environmental-performance-new-mobility.pdf (accessed on 22 May 2024).
  40. Huang, F.H. Understanding user acceptance of battery swapping service of sustainable transport: An empirical study of a battery swap station for electric scooters, Taiwan. Int. J. Sustain. Transp. 2020, 14, 294–307. [Google Scholar] [CrossRef]
  41. Straus, L. Vehicles with Long Range on One Tank on Fuel. 2022. Available online: https://www.blog.ontariocars.ca/vehicles-with-long-range-on-one-tank-on-fuel/ (accessed on 22 May 2024).
  42. Wishart, J. Fuel Cells vs. Batteries in the Automotive Sector. 2014. Available online: https://www.researchgate.net/publication/311210193_Fuel_cells_vs_Batteries_in_the_Automotive_Sector (accessed on 22 May 2024).
  43. EV-Database. Range of Full Electric Vehicles. 2022. Available online: https://ev-database.org/cheatsheet/range-electric-car (accessed on 22 May 2024).
  44. Sanguesa, J.A.; Torres-Sanz, V.; Garrido, P.; Martinez, F.; Márquez-Barja, J.M. A Review on Electric Vehicles: Technologies and Challenges. Smart Cities 2021, 4, 372–404. [Google Scholar] [CrossRef]
  45. Huang, Y.A. Speed Limits in Cambridge. 2022. Available online: https://www.cambridgema.gov/StreetsAndTransportation/PoliciesOrdinancesAndPlans/VisionZero/SpeedLimitsInCambridge (accessed on 22 May 2024).
  46. Rhoda, M. How Far Can You Drive on an Empty Tank of Gas? 2022. Available online: https://www.aceable.com/blog/empty-tank-of-gas/ (accessed on 22 May 2024).
  47. US-Foods. New Food Delivery Study Shows What Consumers Crave in a Service. 2019. Available online: https://www.usfoods.com/our-services/business-trends/2019-food-delivery-statistics.html (accessed on 22 May 2024).
Figure 1. Diagram that depicts the process of food delivery orders.
Futuretransp 04 00030 g001
Figure 2. Diagram for the depiction of the structure and interdependencies among the agent-based simulation layers: (A) urban infrastructure, (B) delivery vehicle fleet, (C) user demand.
Futuretransp 04 00030 g002
Figure 3. Diagram of the Finite State Machine (FSM), representing the behavior and transitions between states of the cars (in red), which are modeled as part of the baseline scenario, and shared lightweight autonomous vehicles (in green), as part of the future scenario.
Futuretransp 04 00030 g003
Figure 4. Diagram of the Finite State Machine (FSM), representing the behavior and transitions between states of the food delivery orders that have been placed by the consumers.
Futuretransp 04 00030 g004
Figure 5. Top: Heat map illustrating the spatial density of trip origins (left, restaurants) and destinations (right), with areas of highest density represented in violet. The map also shows the boundary of the study area, which encompasses Cambridge, MA, USA. Bottom: Demand profile of food delivery orders in the study area (Cambridge, MA, USA) demonstrating the temporal distribution of orders throughout the day, aggregated by time intervals of 7.5 min.
Futuretransp 04 00030 g005
Figure 6. Simplified diagram of the synthetic database generation process for obtaining the fine-grained food delivery demand dataset.
Futuretransp 04 00030 g006
Figure 7. Variation of the average wait time for food delivery orders with an increasing number of electric and combustion engine cars. The dashed horizontal line represents the desired service level requirement.
Futuretransp 04 00030 g007
Figure 8. Variation in the average wait time for food delivery orders for different fleet sizes. Each figure represents a certain battery capacity (35 km, 50 km, and 65 km, left to right).
Futuretransp 04 00030 g008
Figure 9. Information on the scenario (1—red), environmental impacts (2—green), service level (3—blue), and fleet performance (4—yellow) display that the users analyze to generate insights.
Futuretransp 04 00030 g009
Figure 10. Interactive board (1—red), legend (2—green), road network (3—blue), and agents (4—yellow) displays that the user needs to analyze to generate insights.
Futuretransp 04 00030 g010
Figure 11. Schema depicting the different scenarios and parameters users can explore in the interactive simulation tool.
Futuretransp 04 00030 g011
Table 1. Overview of the scenarios examined in the study, including detailed specifications of parameter values that define their operational characteristics and behavior.
ScenarioNomenclatureCharging TechnologyFull Recharge TimeMinimum Battery LevelRiding Speeds [km/h]Battery Autonomy [km]
Baseline (Cars)ICECombustion3 min15%30500
Baseline (Cars)BEVElectric30 min15%30342
Future (SLAV)CCConventional Charging4 h 30 min25%8–11–1435–50–65
Future (SLAV)NCNight Charging4 h 30 min25%8–11–1435–50–65
Future (SLAV)SDStrategic Dispatching4 h 30 min25%8–11–1435–50–65
Future (SLAV)FCFast Charging1.85 min25%8–11–1435–50–65
Table 2. Summary of the main performance metrics in the baseline scenario, which models the way food deliveries are currently handled by ICE vehicles, as well as BEV.
Baseline Scenario Results
MetricICEBEV
Num. of cars [-]4045
Food delivery demand [-]39893989
Avg. trip time [min]12.716.19
Trips under 40 min [%]99.82%100%
Avg. trips/car/day [-]99.7288.64
Total refuelings/day [-]3337
Total vehicle km [km]10,089.488681.82
| Avg. km for pick-up [%]54.03%46.58%
| Avg. km for delivery [%]45.66%53.06%
| Avg. km to refill [%]0.31%0.36%
Avg. km/car [km/car]252.24192.93
Table 3. Summary of the main performance metrics in a food delivery system based on a fleet of shared lightweight autonomous vehicles. Different sub-scenarios account for different battery sizes and autonomous driving speeds.
Future Scenario (SLAV) Results
Battery SizeSmallMediumLarge
SpeedSlowMediumFastSlowMediumFastSlowMediumFast
Num. of SLAV [-]310280240250230190210190170
Food delivery demand [-]398939893989398939893989398939893989
Avg. trip time [min]15.914.9415.9316.3912.099.6716.9812.3415.2
Trips under 40 min [%]97.77%98.09%97.72%97.39%99.72%100.00%96.14%99.65%97.27%
Avg. trips/SLAV/day [-]12.814.2516.6215.9617.3420.991920.9923.46
Total charges/day [-]317351449261239244202198242
Total vehicle km [km]6695.456935.29209.016919.226892.966899.587178.077046.088902.37
| Average km for pick-up [%]30.30%32.60%49.02%32.69%32.47%32.55%35.24%34.05%47.68%
| Average km for delivery [%]68.80%66.42%50.02%66.58%66.83%66.77%64.18%65.38%51.75%
| Average km to recharge [%]0.89%0.97%0.95%0.74%0.70%0.68%0.58%0.57%0.57%
Average km/SLAV [km/SLAV]21.624.7738.3727.6829.9736.3134.1837.0852.37
Table 4. Fleet size needed to meet the service requirements under different operational strategies related to charging. The minimum required fleet size for each operational strategy is calculated for sub-scenarios with varying battery sizes and autonomous driving speeds.
BatterySpeedConventional Charging (CC)Night Charging (NC)Strategic Dispatching (SD)Fast Charging (FC)
Slow310260−16.13%300−3.23%150−51.61%
SmallMedium280260−7.14%2800.00%110−60.71%
Fast2402400.00%27012.50%90−62.50%
Slow250240−4.00%240−4.00%140−44.00%
MediumMedium230210−8.70%2300.00%110−52.17%
Fast19021010.53%23021.05%90−52.63%
Slow210200−4.76%180−14.29%150−28.57%
LargeMedium1901900.00%180−5.26%110−42.11%
Fast1701805.88%1805.88%90−47.06%
Table 5. Results showing the fleet size needed to cover the demand with the desired service requirements, total system kilometers traveled, grams of CO 2 per km traveled and CO 2 reductions compared to the baseline scenario.
US Electricity Mix100% Renewable
Fleet SizeBattery kmSpeed km/hAvg. Distance kmTotal System kmg CO 2 /km% Red. vs. ICEg CO 2 /km% Red. vs. BEV
Combustion Cars (ICE)4050030252.2410,090161.97 161.97
Electric Cars (BEV)4534230192.938682107.53 53.85
Conventional Charging (CC)31035821.6669644.95−81.58%36.07−48.34%
280351124.77693641.08−82.57%32.20−52.23%
240351438.37920931.16−82.44%22.27−56.13%
25050827.68692038.79−83.57%29.90−55.74%
230501129.97689336.91−84.43%28.03−58.67%
190501436.31689932.65−86.22%23.77−64.92%
21065834.18717834.48−84.86%25.60−60.70%
190651137.08704532.91−85.81%24.03−63.79%
170651452.37890327.15−85.21%18.27−65.21%
Night Charging (NC)26035828.53741837.34−83.05%28.46−54.84%
260351127.63718438.06−83.27%29.17−55.18%
240351433.7808833.63−83.36%24.74−57.20%
24050829.49707837.13−83.92%28.25−57.23%
210501137.21781432.23−84.59%23.34−60.99%
210501438.27803731.68−84.42%22.80−60.81%
20065835.28705633.82−85.40%24.94−62.36%
190651140.67772731.19−85.25%22.30−63.14%
180651441.92754630.60−85.87%21.72−64.94%
Strategic Dispatching (SD)30035824.76742841.08−81.33%32.20−48.84%
280351126.26735339.35−82.30%30.46−52.09%
270351428.46768437.34−82.44%28.46−53.22%
24050829.31703437.36−83.92%28.47−57.16%
230501133.70775134.23−83.76%25.34−57.99%
230501430.28696436.49−84.45%27.60−58.89%
18065840.90736231.07−86.00%22.18−65.07%
180651141.70750630.72−85.89%21.83−64.95%
180651439.74715331.50−88.21%22.67−65.31%
Fast Charging (FD)15035846.3694529.11−87.63%20.22−69.96%
110351166.98736824.25−89.07%15.36−75.79%
90351486.11775021.81−89.66%12.92−78.58%
14050852.7737827.98−87.37%19.10−69.86%
110501169.2761224.46−88.61%15.56−74.67%
90501483.95755622.51−89.59%13.63−77.97%
15065846.13692030.96−86.89%22.07−67.34%
110651167.38741225.36−88.50%16.47−73.89%
90651482.52742723.15−89.48%14.27−77.33%
Disclaimer/Publisher’s Note: The statements, opinions and data contained in all publications are solely those of the individual author(s) and contributor(s) and not of MDPI and/or the editor(s). MDPI and/or the editor(s) disclaim responsibility for any injury to people or property resulting from any ideas, methods, instructions or products referred to in the content.