Analysis of Passenger Car Tailpipe Emissions in Different World Regions through 2050
Abstract
1. Introduction
2. Materials and Methods
2.1. Bottom-Up Emission Calculation Procedure
2.1.1. Market Development of Drivetrain Technologies
2.1.2. CO2 Emission Factors
2.1.3. Pollutant Emission Factors
| Region/ Country | Pollutant EF Estimation Method/Model | Source |
|---|---|---|
| Australia | EF weighting according to Euro class fleet shares; Estimation of the composition of the vehicle fleet by Euro class based on the time lag of the introduction of the Euro classes corresponding to Australian standards compared to that of Europe. | [35] |
| South America (Brazil) | Based on the São Paulo official vehicular emissions inventory (CETESB) and the stock distribution of vehicles by age of use (VEIN model). | [36,37] |
| China | Emission factors for gasoline vehicles (which constitute approximately 90% of the stock fleet in 2015) until 2030 based on literature values [38]. Gap filling for remaining powertrains using Euro-based emission values from HBEFA 4.1 database [35]. | [35,38] |
| OECD Europe (Germany) | Based on the HBEFA 4.1 database | [35] |
| India | Based on the literature from [39] on vehicle stock based in New Delhi with estimates up to 2030. | [39] |
| Japan | Based on the literature for PM2.5 and NOx for diesel and gasoline vehicles for 2015 [36]. Extrapolation to future years based on ratios of emission factor trend development in Germany [35]. | [35,40] |
| Eastern Europe (Russia) | EF weighting according to Euro-class fleet shares; Estimation of the composition of the vehicle fleet by Euro classe based on the literature and the time lag of the introduction of the Euro classes in Russia compared to that of Europe. | [35,41] |
| Africa (South Africa) | EF weighting according to Euro class fleet shares; Estimation of the composition of the vehicle fleet by Euro class based on the literature and the time lag of the introduction of the Euro classes in South Africa compared to that in Europe. | [35,42] |
| North America (the USA) | Based on the EMFAC2017 database | [43] |
- passenger cars using gasoline blended with 25% ethanol;
- passenger cars with engines that use pure ethanol;
- passenger car with flex-fuel engines using gasoline blended with 25% of ethanol;
- passenger cars with flex-fuel engines that use pure ethanol.
2.1.4. Transport Demand
3. Results
3.1. Passenger Car Market Modelling
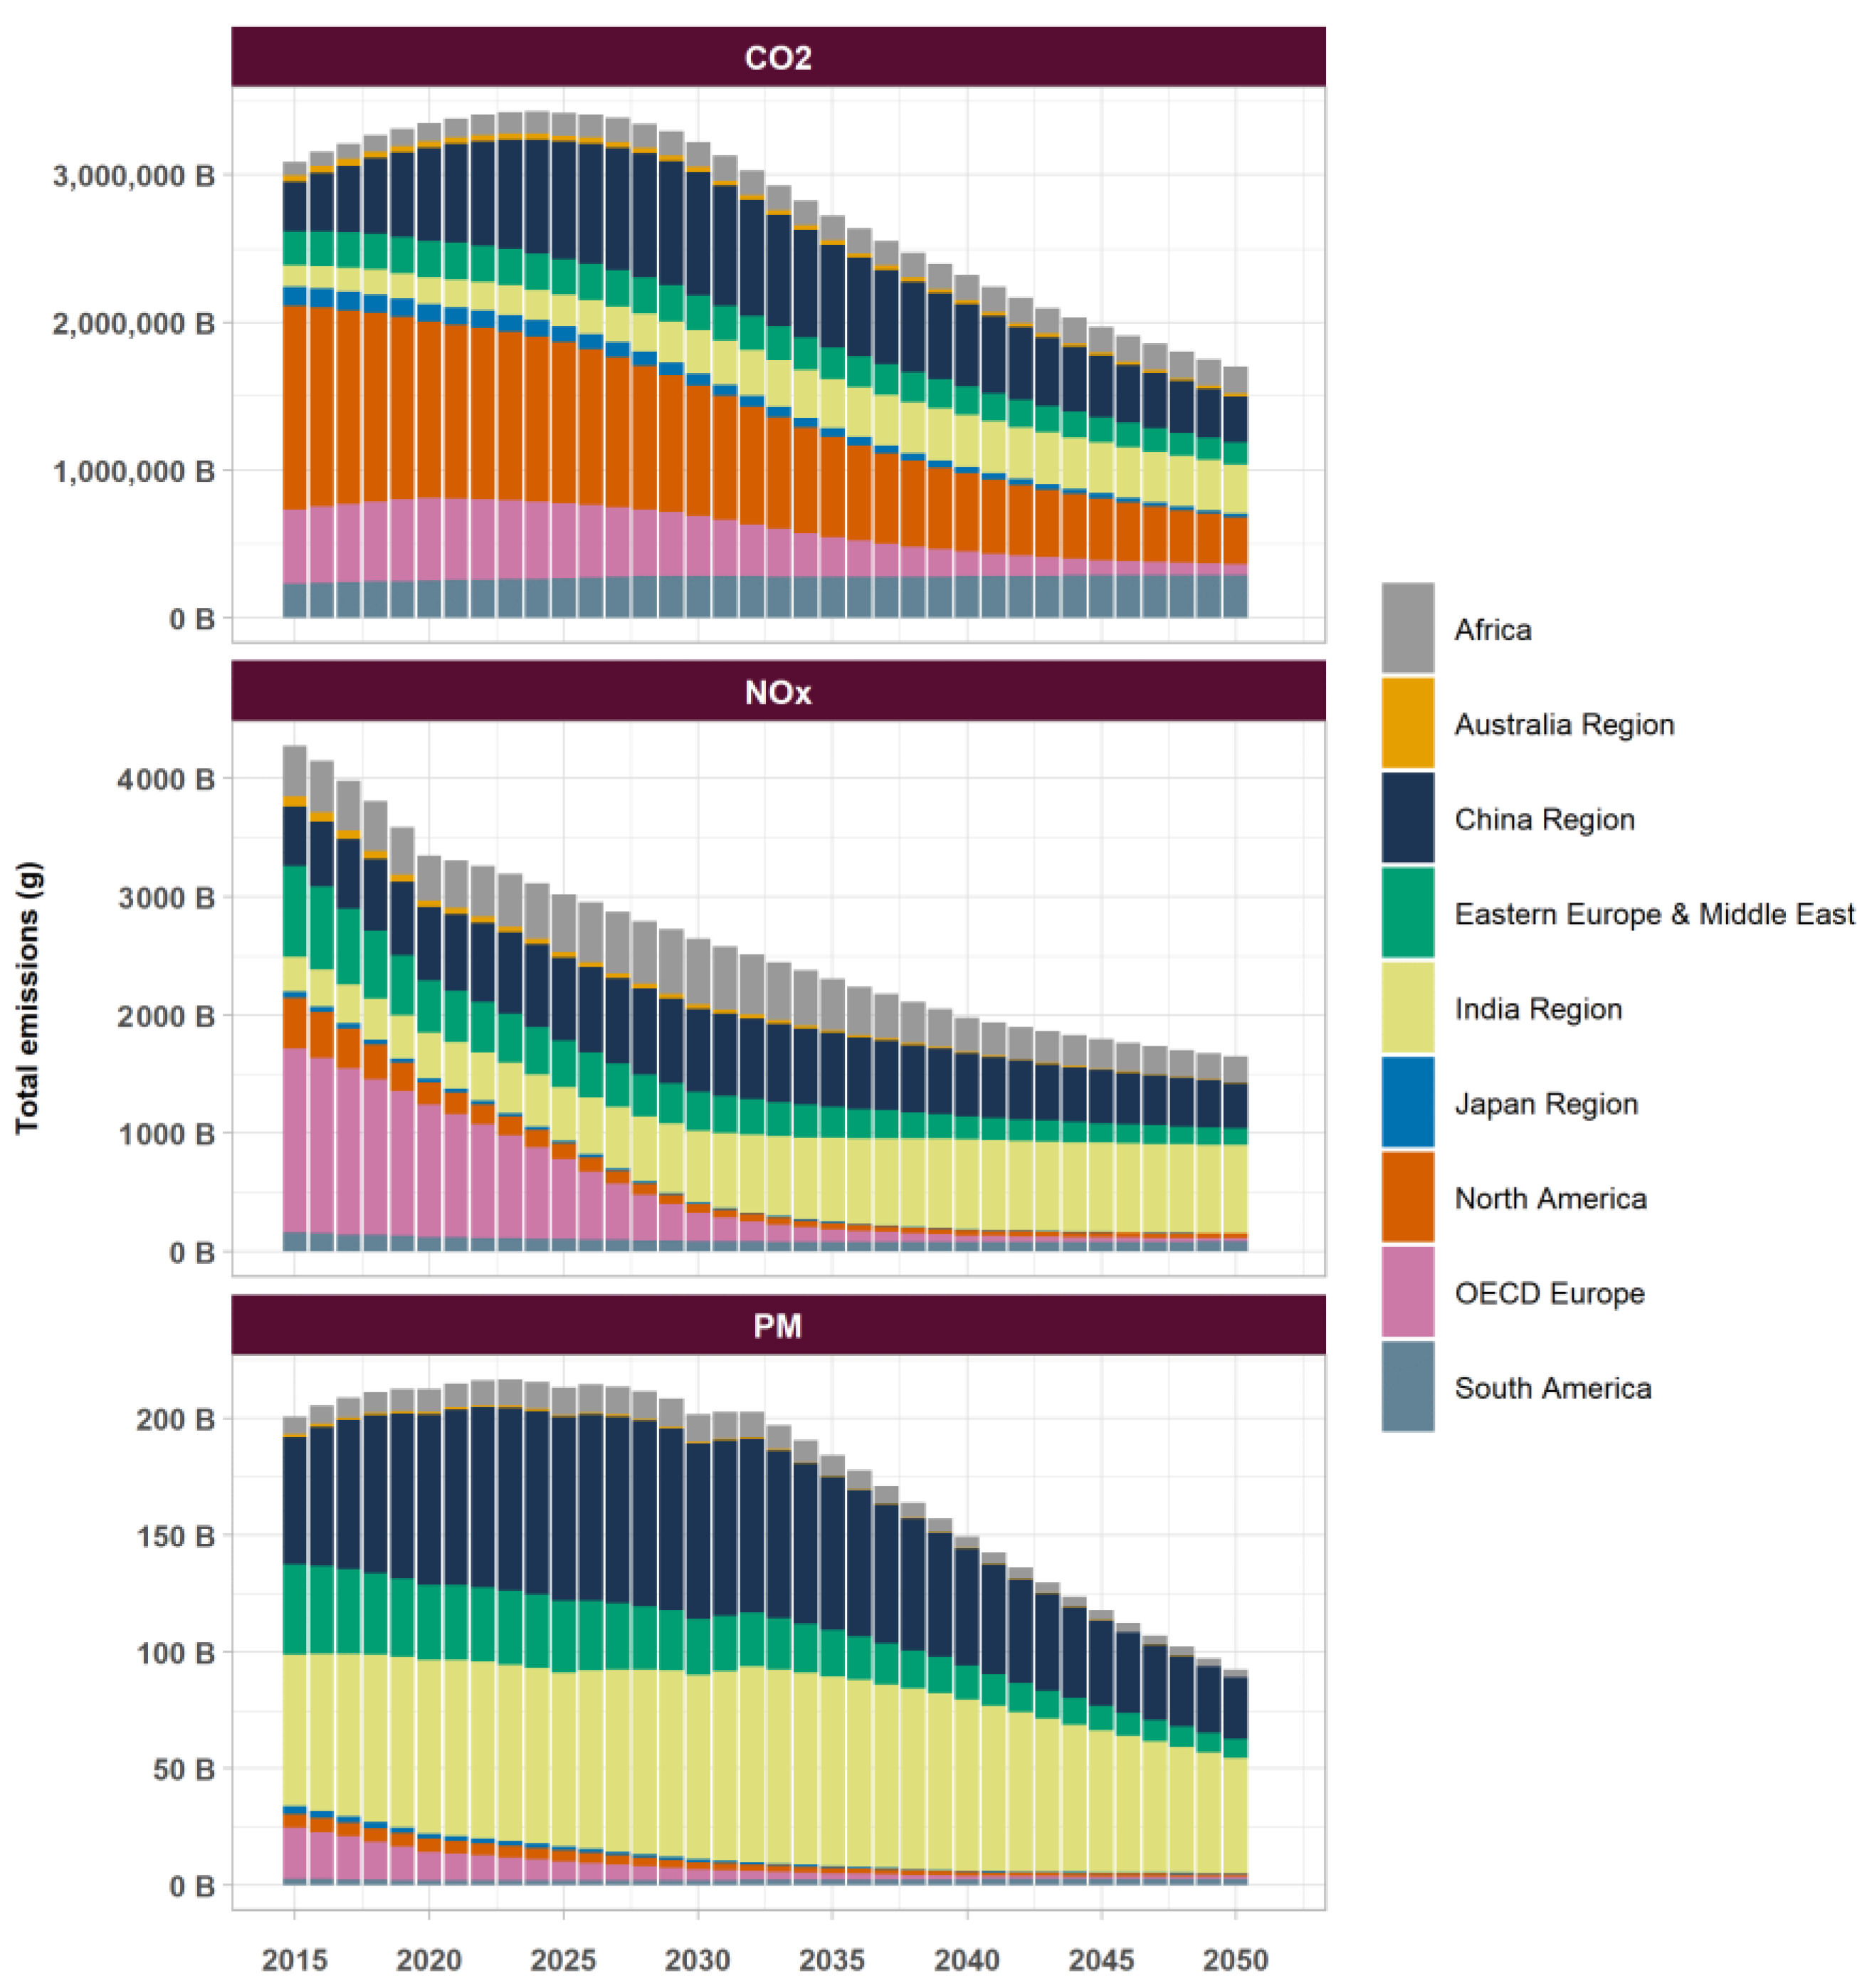
3.2. Overview of Global Emissions
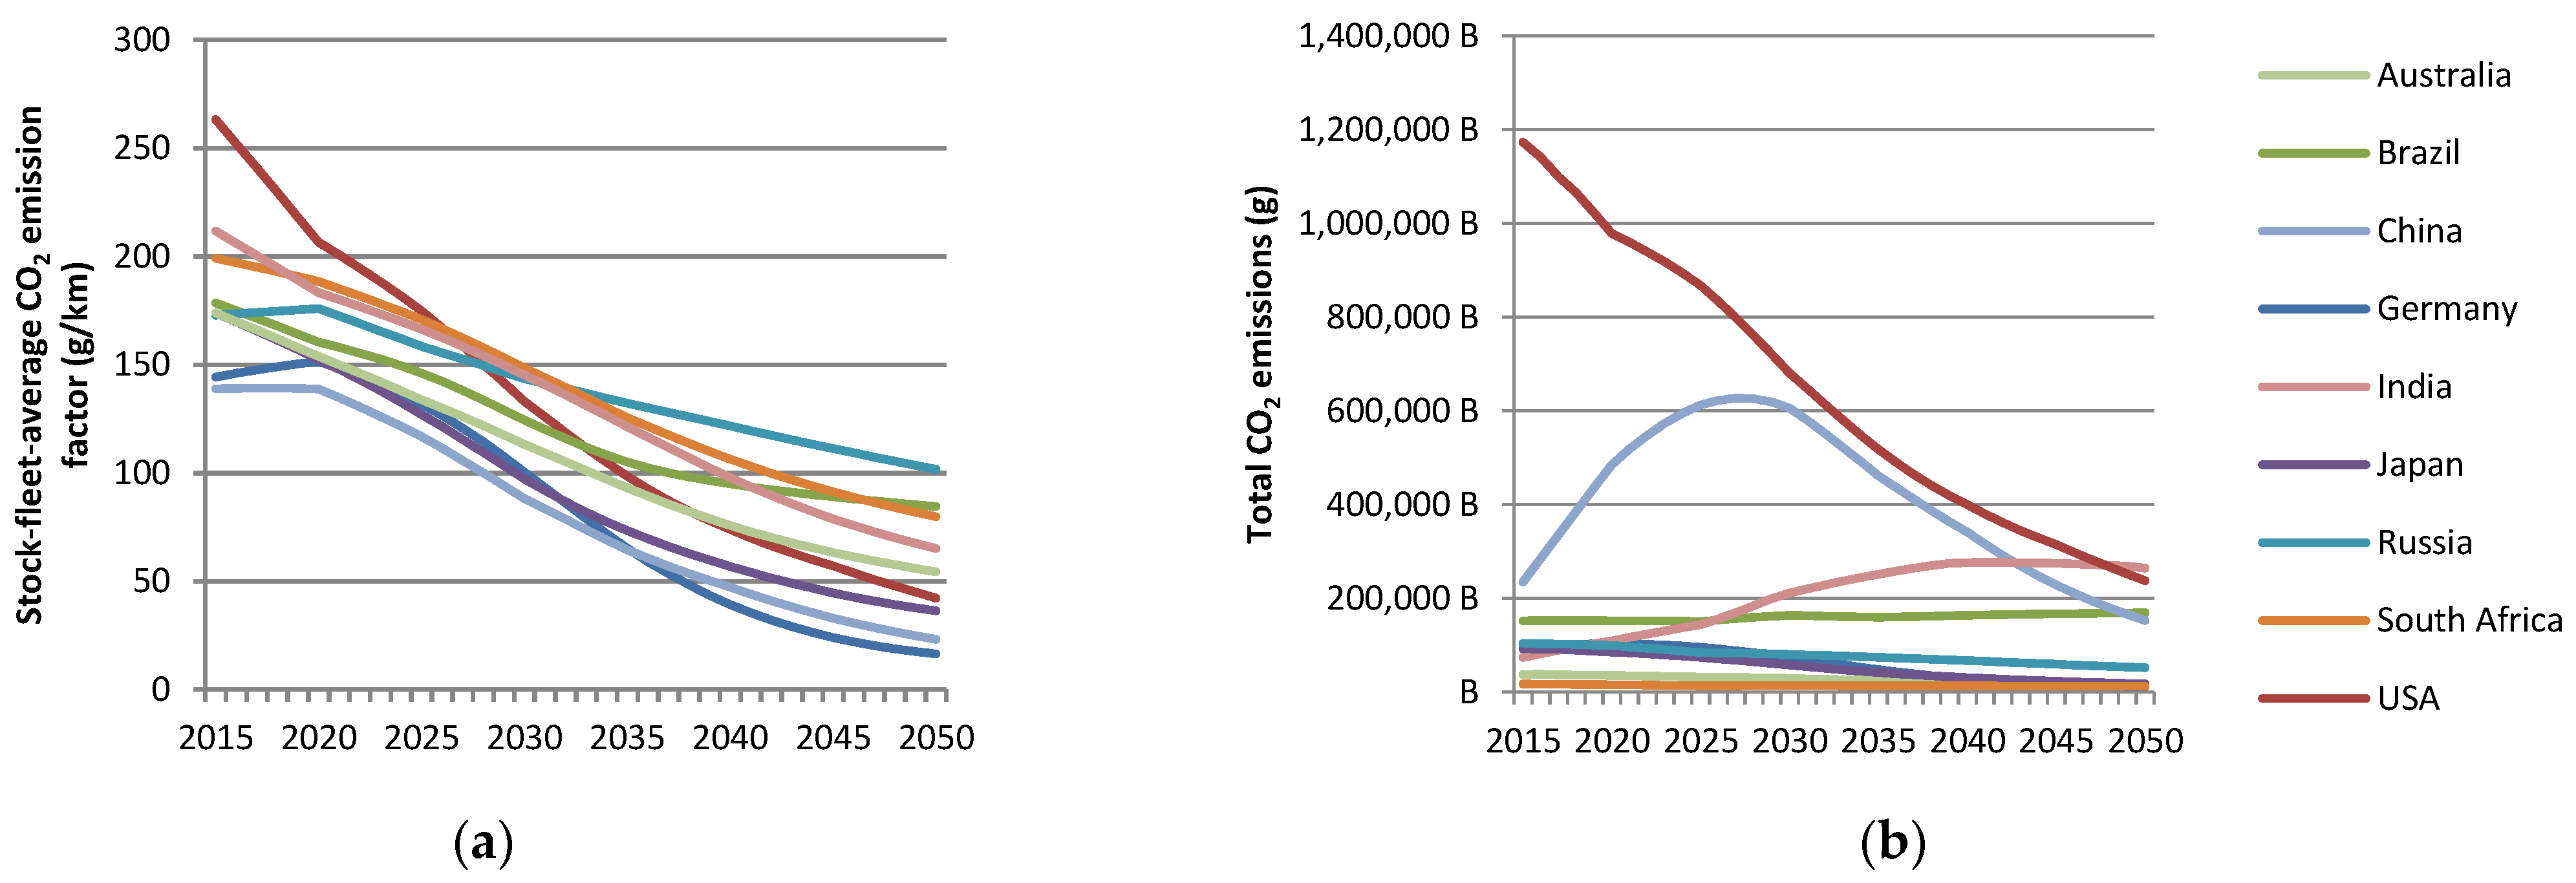
3.3. CO2 Emissions per Country
3.4. NOx and PM2.5 Emissions per Country
4. Discussion
Limitations and Uncertainties
5. Conclusions
Supplementary Materials
Author Contributions
Funding
Institutional Review Board Statement
Informed Consent Statement
Data Availability Statement
Acknowledgments
Conflicts of Interest
Appendix A. Details of Equation (1)
Appendix B
| Country | Fuel | Biofuel Rate (%) | |||||||
|---|---|---|---|---|---|---|---|---|---|
| 2015 | 2020 | 2025 | 2030 | 2035 | 2040 | 2045 | 2050 | ||
| Australia | Ethanol | 0.006 | 0.003 | 0.001 | 0.001 | 0.0 | 0.0 | 0.0 | 0.0 |
| Biodiesel | 0.0 | 0.0 | 0.0 | 0.0 | 0.0 | 0.0 | 0.0 | 0.0 | |
| Brazil | Ethanol | 15.0 | 14.0 | 14.0 | 15.0 | 15.0 | 14.0 | 14.0 | 14.0 |
| Biodiesel | 1.0 | 1.5 | 2.0 | 2.5 | 2.5 | 3.0 | 3.0 | 3.0 | |
| China | Ethanol | 1.1 | 4.6 | 12.5 | 18.6 | 20.5 | 20.9 | 21.0 | 21.0 |
| Biodiesel | 1.0 | 4.4 | 11.9 | 17.7 | 19.5 | 19.9 | 20.0 | 20.0 | |
| Germany | Ethanol | 4.4 | 5.1 | 6.3 | 7.6 | 8.4 | 8.8 | 8.9 | 9.0 |
| Biodiesel | 4.0 | 4.3 | 5.1 | 7.0 | 8.4 | 8.9 | 9.0 | 9.0 | |
| India | Ethanol | 0.3 | 0.6 | 1.0 | 1.2 | 1.5 | 1.7 | 1.8 | 2.0 |
| Biodiesel | 0.0 | 0.0 | 0.0 | 0.0 | 0.0 | 0.0 | 0.0 | 0.0 | |
| Japan | Ethanol | 0.006 | 0.003 | 0.001 | 0.001 | 0.0 | 0.0 | 0.0 | 0.0 |
| Biodiesel | 0.0 | 0.0 | 0.0 | 0.0 | 0.0 | 0.0 | 0.0 | 0.0 | |
| Russia | Ethanol | 0.015 | 0.007 | 0.004 | 0.002 | 0.001 | 0.0 | 0.0 | 0.0 |
| Biodiesel | 0.0 | 0.0 | 0.0 | 0.0 | 0.0 | 0.0 | 0.0 | 0.0 | |
| South Africa | Ethanol | 0.009 | 0.005 | 0.2 | 0.3 | 0.3 | 0.4 | 0.5 | 0.6 |
| Biodiesel | 0.0 | 0.0 | 0.0 | 0.0 | 0.0 | 0.0 | 0.0 | 0.0 | |
| USA | Ethanol | 6.0 | 7.0 | 11.0 | 16.0 | 18.0 | 20.0 | 25.0 | 35.0 |
| Biodiesel | 0.0 | 0.0 | 1.0 | 2.0 | 3.0 | 3.5 | 3.8 | 5.0 | |
Appendix C. Country Clusters
| Africa: Algeria, Angola, Benin, Botswana, Burkina Faso, Burundi, Cameroon, Cape Verde, Central African Republic, Chad, Comoros, Congo, Côte d’Ivoire, Democratic Republic of the Congo, Djibouti, Egypt, Equatorial Guinea, Eritrea, Ethiopia, Gabon, Gambia, Ghana, Guinea, Guinea-Bissau, Kenya, Lesotho, Liberia, Libyan Arab Jamahiriya, Madagascar, Malawi, Mali, Mauritania, Mauritius, Morocco, Mozambique, Namibia, Niger, Nigeria, Réunion, Rwanda, Senegal, Sierra Leone, Somalia, South Africa, Sudan, Swaziland, Togo, Tunisia, Uganda, United Republic of Tanzania, Zambia, Zimbabwe |
| Australia Region: Australia, New Zealand |
| China Region: Cambodia, China, Hong Kong Special Administrative Region, Macao Special Administrative Region, Democratic People’s Republic of Korea, Fiji, French Polynesia, Guam, Haiti, Indonesia, Lao People’s Democratic Republic, Malaysia, Mongolia, Myanmar, New Caledonia, Papua New Guinea, Philippines, Samoa, Singapore, Solomon Islands, Thailand, Timor-Leste, Vanuatu, Viet Nam |
| Eastern Europe & Middle East: Albania, Armenia, Azerbaijan, Bahrain, Belarus, Bosnia and Herzegovina, Bulgaria, Croatia, Cyprus, Georgia, Iraq, Israel, Jordan, Kuwait, Latvia, Lebanon, Lithuania, Malta, Occupied Palestinian Territory, Oman, Qatar, Russian Federation, Saudi Arabia, Serbia, Syrian Arab Republic, The former Yugoslav Republic of Macedonia, Turkey, Ukraine, United Arab Emirates, Yemen |
| India Region: Afghanistan, Bangladesh, Bhutan, Brunei Darussalam, India, Iran (Islamic Republic of), Kazakhstan, Kyrgyzstan, Maldives, Nepal, Pakistan, Sri Lanka, Tajikistan, Turkmenistan, Uzbekistan |
| Japan Region: Japan, Republic of Korea |
| North America: Canada, Mexico, United States of America |
| OECD Europe: Austria, Belgium, Czech Republic, Denmark, Estonia, Finland, France, Germany, Greece, Hungary, Iceland, Ireland, Italy, Luxembourg, Netherlands, Norway, Poland, Portugal, Republic of Moldova, Romania, Slovakia, Slovenia, Spain, Sweden, Switzerland, United Kingdom of Great Britain and Northern Ireland |
| South America: Argentina, Bahamas, Barbados, Belize, Bolivia (Plurinational State of), Brazil, Chile, Colombia, Costa Rica, Cuba, Dominican Republic, Ecuador, El Salvador, Guadeloupe, Guatemala, Guyana, Honduras, Jamaica, Martinique, Nicaragua, Panama, Paraguay, Peru, Puerto Rico, Suriname, Trinidad and Tobago, Uruguay, Venezuela (Bolivarian Republic of) |
Appendix D
| Country | Year | PM2.5 EF (g/km) | NOx EF (g/km) | ||||||||
|---|---|---|---|---|---|---|---|---|---|---|---|
| G/G-HEV | D/D-HEV | CNG | G-PHEV | D-PHEV | G/G-HEV | D/D-HEV | CNG | G-PHEV | D-PHEV | ||
| Australia | 2015 | 0.004 | 0.027 | 0.009 | 0.001 | 0.002 | 0.28 | 1.15 | 0.34 | 0.02 | 0.41 |
| 2030 | 0.002 | 0.005 | 0.002 | 0.001 | 0.001 | 0.11 | 0.65 | 0.02 | 0.04 | 0.05 | |
| 2050 | 0.001 | 0.001 | 0.002 | 0.001 | 0.0003 | 0.04 | 0.11 | 0.02 | 0.02 | 0.05 | |
| Brazil | 2015 | 0.001 | 0.012 | 0.009 | 0.0004 | 0.001 | 0.07 | 1.08 | 0.34 | 0.004 | 0.39 |
| 2030 | 0.001 | 0.002 | 0.002 | 0.0004 | 0.0003 | 0.04 | 0.35 | 0.02 | 0.01 | 0.02 | |
| 2050 | 0.001 | 0.001 | 0.002 | 0.0004 | 0.0003 | 0.03 | 0.05 | 0.02 | 0.02 | 0.03 | |
| China | 2015 | 0.006 | 0.012 | 0.009 | 0.002 | 0.001 | 0.13 | 1.08 | 0.34 | 0.01 | 0.39 |
| 2030 | 0.002 | 0.002 | 0.002 | 0.001 | 0.0003 | 0.03 | 0.35 | 0.02 | 0.01 | 0.02 | |
| 2050 | 0.002 | 0.001 | 0.002 | 0.001 | 0.0003 | 0.01 | 0.05 | 0.02 | 0.01 | 0.03 | |
| Germany | 2015 | 0.003 | 0.011 | 0.009 | 0.001 | 0.001 | 0.16 | 1.08 | 0.34 | 0.01 | 0.39 |
| 2030 | 0.001 | 0.002 | 0.002 | 0.001 | 0.0003 | 0.05 | 0.35 | 0.02 | 0.02 | 0.02 | |
| 2050 | 0.001 | 0.001 | 0.002 | 0.001 | 0.0003 | 0.04 | 0.05 | 0.02 | 0.01 | 0.03 | |
| India | 2015 | 0.045 | 0.15 | 0.014 | 0.016 | 0.012 | 0.22 | 0.65 | 0.17 | 0.01 | 0.23 |
| 2030 | 0.022 | 0.067 | 0.006 | 0.008 | 0.012 | 0.10 | 0.59 | 0.05 | 0.03 | 0.04 | |
| 2050 | 0.009 | 0.028 | 0.002 | 0.004 | 0.015 | 0.04 | 0.52 | 0.01 | 0.02 | 0.26 | |
| Japan | 2015 | 0.003 | 0.037 | 0.009 | 0.001 | 0.003 | 0.06 | 0.18 | 0.34 | 0.004 | 0.06 |
| 2030 | 0.001 | 0.006 | 0.002 | 0.001 | 0.001 | 0.02 | 0.06 | 0.02 | 0.01 | 0.004 | |
| 2050 | 0.001 | 0.002 | 0.002 | 0.001 | 0.001 | 0.01 | 0.01 | 0.02 | 0.01 | 0.004 | |
| Russia | 2015 | 0.007 | 0.052 | 0.009 | 0.002 | 0.007 | 0.65 | 1.06 | 0.34 | 0.04 | 0.38 |
| 2030 | 0.002 | 0.005 | 0.002 | 0.001 | 0.001 | 0.11 | 0.65 | 0.02 | 0.04 | 0.05 | |
| 2050 | 0.001 | 0.001 | 0.002 | 0.001 | 0.0003 | 0.04 | 0.11 | 0.02 | 0.02 | 0.05 | |
| South Africa | 2015 | 0.010 | 0.115 | 0.009 | 0.003 | 0.010 | 0.97 | 0.91 | 0.34 | 0.06 | 0.33 |
| 2030 | 0.008 | 0.069 | 0.002 | 0.003 | 0.012 | 0.50 | 1.17 | 0.02 | 0.16 | 0.08 | |
| 2050 | 0.002 | 0.004 | 0.002 | 0.001 | 0.002 | 0.11 | 0.80 | 0.02 | 0.06 | 0.39 | |
| The USA | 2015 | 0.001 | 0.015 | 0.009 | 0.0004 | 0.001 | 0.08 | 0.18 | 0.34 | 0.01 | 0.06 |
| 2030 | 0.001 | 0.001 | 0.002 | 0.0002 | 0.0002 | 0.01 | 0.01 | 0.02 | 0.004 | 0.001 | |
| 2050 | 0.0003 | 0.0004 | 0.002 | 0.0001 | 0.0002 | 0.01 | 0.01 | 0.02 | 0.01 | 0.003 | |
References
- International Energy Agency. Greenhouse Gas Emissions by Sector. 2019. Available online: https://www.iea.org/data-and-statistics/charts/greenhouse-gas-emissions-by-sector-2019 (accessed on 10 February 2023).
- O’Neill, B.C.; Kriegler, E.; Ebi, K.L.; Kemp-Benedict, E.; Riahi, K.; Rothman, D.S.; van Ruijven, B.J.; van Vuuren, D.P.; Birkmann, J.; Kok, K.; et al. The roads ahead: Narratives for shared socioeconomic pathways describing world futures in the 21st century. Glob. Environ. Change 2017, 42, 169–180. [Google Scholar] [CrossRef]
- Riahi, K.; van Vuuren, D.P.; Kriegler, E.; Edmonds, J.; O’Neill, B.C.; Fujimori, S.; Bauer, N.; Calvin, K.; Dellink, R.; Fricko, O.; et al. The Shared Socioeconomic Pathways and their energy, land use, and greenhouse gas emissions implications: An overview. Glob. Environ. Change 2017, 42, 153–168. [Google Scholar] [CrossRef]
- van Vuuren, D.P.; Edmonds, J.; Kainuma, M.; Riahi, K.; Thomson, A.; Hibbard, K.; Hurtt, G.C.; Kram, T.; Krey, V.; Lamarque, J.-F.; et al. The representative concentration pathways: An overview. Clim. Change 2011, 109, 5–31. [Google Scholar] [CrossRef]
- O’Neill, B.C.; Kriegler, E.; Riahi, K.; Ebi, K.L.; Hallegatte, S.; Carter, T.R.; Mathur, R.; van Vuuren, D.P. A new scenario framework for climate change research: The concept of shared socioeconomic pathways. Clim. Change 2014, 122, 387–400. [Google Scholar] [CrossRef]
- van Vuuren, D.P.; Stehfest, E.; Gernaat, D.E.; Doelman, J.C.; van den Berg, M.; Harmsen, M.; Boer, H.S.d.; Bouwman, L.F.; Daioglou, V.; Edelenbosch, O.Y.; et al. Energy, land-use and greenhouse gas emissions trajectories under a green growth paradigm. Glob. Environ. Change 2017, 42, 237–250. [Google Scholar] [CrossRef]
- S&P Global Mobility. Vehicles in Operation 2022. 2023. Available online: https://www.spglobal.com/mobility/en/research-analysis/index.html (accessed on 18 October 2023).
- Marklines. Sales Data by Models. 2022. Available online: https://www.marklines.com/en/vehicle_sales/ (accessed on 15 February 2023).
- International Energy Agency. Global EV Outlook 2022. 2022. Available online: https://www.iea.org/reports/global-ev-outlook-2022 (accessed on 14 February 2023).
- European Comission. Zero Emission Vehicles: First ‘Fit for 55’ Deal Will End the Sale of New CO2 Emitting Cars in Europe by 2035; European Comission: Brussels, Brussels, 2022.
- Plötz, P.; Gnann, T.; Wietschel, M. Modelling market diffusion of electric vehicles with real world driving data—Part I: Model structure and validation. Ecol. Econ. 2014, 107, 411–421. [Google Scholar] [CrossRef]
- Collett, K.A.; Bhagavathy, S.M.; McCulloch, M.D. Forecast of electric vehicle uptake across counties in England: Dataset from S-curve analysis. Data Brief 2021, 39, 107662. [Google Scholar] [CrossRef] [PubMed]
- Rietmann, N.; Hügler, B.; Lieven, T. Forecasting the trajectory of electric vehicle sales and the consequences for worldwide CO2 emissions. J. Clean. Prod. 2020, 261, 121038. [Google Scholar] [CrossRef]
- Kucharavy, D.; de Guio, R. Application of S-shaped curves. Procedia Eng. 2011, 9, 559–572. [Google Scholar] [CrossRef]
- Teske, S. (Ed.) Achieving the Paris Climate Agreement Goals: Global and Regional 100% Renewable Energy Scenarios with Non-Energy GHG Pathways for +1.5 °C and +2 °C; Springer International Publishing: Cham, Switzerland, 2019; ISBN 978-3-030-05842-5. [Google Scholar]
- Bureau of Infrastructure, Transport and Regional Economics. Electric Vehicle Uptake: Modelling a Global Phenomenon, Research Report 151; Canberra ACT. 2019. Available online: https://www.bitre.gov.au/sites/default/files/bitre-report-151.pdf (accessed on 15 October 2023).
- Australian Government Department of Industry, Science, Energy and Resources. Future Fuels and Vehicles Strategy. 2021. Available online: https://apo.org.au/sites/default/files/resource-files/2021-11/apo-nid315003.pdf (accessed on 10 February 2023).
- Shepardson, D.; Klayman, B. U.S. Government to End Gas-Powered Vehicle Purchases by 2035 under Biden Order. Reuters. 2021. Available online: https://www.reuters.com/world/us/biden-pledges-end-gas-powered-federal-vehicle-purchases-by-2035-2021-12-08 (accessed on 16 February 2023).
- The White House. FACT SHEET: President Biden Announces Steps to Drive American Leadership Forward on Clean Cars and Trucks; The White House: Washington, DC, USA, 2021.
- ZEV Alliance. International ZEV Alliance Announcement; ZEV Alliance: 2021. Available online: https://zevalliance.org/wp-content/uploads/2021/11/izeva-2021-announcement.pdf (accessed on 12 May 2023).
- Bloomberg News. China Isn’t Moving Away From Polluting Cars Fast Enough. 2022. Available online: https://www.bloomberg.com/news/articles/2022-01-24/china-isn-t-moving-away-from-polluting-cars-fast-enough (accessed on 20 February 2023).
- Kamboj, P.; Ankur, M.; Kaur, H.; Jain, H.; Chaturvedi, V. India Transport Energy Outlook, New Delhi. 2022. Available online: https://www.ceew.in/sites/default/files/ceew-research-transport-energy-use-carbon-emissions-decarbonisation.pdf (accessed on 10 May 2023).
- Jain, D.; Sampat, M.; Keum, S.; Kumbakonam, S. Electric Vehicles are Poised to Create a $100B+ Opportunity in India by 2030; 2022. Available online: https://www.bain.com/insights/electric-vehicles-are-poised-to-create-a-$100-billion-opportunity-in-india-by-2030 (accessed on 16 October 2023).
- The International Energy Agency. India Energy Outlook 2021. 2022. Available online: https://iea.blob.core.windows.net/assets/1de6d91e-e23f-4e02-b1fb-51fdd6283b22/India_Energy_Outlook_2021.pdf (accessed on 9 February 2023).
- Nikkei. Japan Aims to Electrify Nation’s New Car Fleet by Mid-2030s [Online]. 2020. Available online: https://asia.nikkei.com/Spotlight/Environment/Climate-Change/Japan-aims-to-electrify-nation-s-new-car-fleet-by-mid-2030s (accessed on 17 October 2023).
- Goosen, M.; Africa’s Electric Vehicle Revolution. Energy Capital & Power [Online]. 2022. Available online: https://energycapitalpower.com/africas-electric-vehicle-revolution/ (accessed on 8 May 2023).
- Chege, W.W. 2022 Electric Vehicles Market Intelligence Report. 2022. Available online: https://www.westerncape.gov.za/110green/files/atoms/files/EV_MIR_29_3_22_FINAL.pdf (accessed on 12 May 2023).
- Ahjum, F.; Merven, B.; Stone, A.; Caetano, T. Road transport vehicles in South Africa towards 2050: Factors influencing technology choice and implications for fuel supply. J. Energy S. Afr. 2018, 29, 33–50. [Google Scholar] [CrossRef]
- Feil, A.S. Electromobility in Brazil: Lithium versus Ethanol. 2020. Available online: https://fsr.eui.eu/electromobility-in-brazil-lithium-versus-ethanol/ (accessed on 5 February 2023).
- Russia Briefing. Electric Cars in Russia to Be Exempt from Toll Road Payments. Russia Briefing [Online]. 2021. Available online: https://www.russia-briefing.com/news/electric-cars-in-russia-to-be-exempt-from-toll-road-payments.html/ (accessed on 1 February 2023).
- Regulation No 101: UN R101. 2012. Available online: https://op.europa.eu/en/publication-detail/-/publication/3e025a95-5004-481c-b48d-02fd5d01a9cc/language-en (accessed on 15 May 2023).
- Eder, A.; Schütze, N.; Rijnders, A.; Riemersma, I.; Steven, H.; Development of a European Utility Factor Curve for OVC-HEVs for WLTP. Appendix 1—Utility Factors In. 2016. Available online: https://www.unece.org/fileadmin/DAM/trans/doc/2015/wp29grpe/GRPE-72-02-Rev.1.pdf (accessed on 25 April 2024).
- Timmers, V.R.J.H.; Achten, P.A.J. Non-exhaust PM emissions from electric vehicles. Atmos. Environ. 2016, 134, 10–17. [Google Scholar] [CrossRef]
- Piscitello, A.; Bianco, C.; Casasso, A.; Sethi, R. Non-exhaust traffic emissions: Sources, characterization, and mitigation measures. Sci. Total Environ. 2021, 766, 144440. [Google Scholar] [CrossRef] [PubMed]
- Infras. Handbook Emission Factors for Road Transport (HBEFA). 2019. Available online: https://www.hbefa.net/e/index.html (accessed on 4 February 2023).
- Environmental Agency of São Paulo State. Relatórios e Publicações: Relatórios de Emissões Veiculares no Estado São Paulo. Available online: https://cetesb.sp.gov.br/veicular/relatorios-e-publicacoes/ (accessed on 1 February 2023).
- Ibarra-Espinosa, S.; Ynoue, R.; O’Sullivan, S.; Pebesma, E.; Andrade, M.d.F.; Osses, M. VEIN v0.2.2: An R package for bottom–up vehicular emissions inventories. Geosci. Model Dev. 2018, 11, 2209–2229. [Google Scholar] [CrossRef]
- Wu, Y.; Zhang, S.; Hao, J.; Liu, H.; Wu, X.; Hu, J.; Walsh, M.P.; Wallington, T.J.; Zhang, K.M.; Stevanovic, S. On-road vehicle emissions and their control in China: A review and outlook. Sci. Total Environ. 2017, 574, 332–349. [Google Scholar] [CrossRef] [PubMed]
- Goel, R.; Guttikunda, S.K. Evolution of on-road vehicle exhaust emissions in Delhi. Atmos. Environ. 2015, 105, 78–90. [Google Scholar] [CrossRef]
- Kurokawa, J.; Ohara, T. Long-term historical trends in air pollutant emissions in Asia: Regional Emission inventory in ASia (REAS) version 3. Atmos. Chem. Phys. 2020, 20, 12761–12793. [Google Scholar] [CrossRef]
- Ginzburg, V.; Trofimenko, Y.; Komkov, V.; Lytov, V. Influence of various approaches to the structuring of vehicle fleet on the inventory of black carbon and greenhouse gas emissions in Russia. In Proceedings of the International Transport and Air Pollution Conference, Thessaloniki, Greece, 15–17 May 2019. [Google Scholar]
- Thambiran, T.; Diab, R.D. Air pollution and climate change co-benefit opportunities in the road transportation sector in Durban, South Africa. Atmos. Environ. 2011, 45, 2683–2689. [Google Scholar] [CrossRef]
- CARB. EMFAC2017 Web Database. Available online: https://arb.ca.gov/emfac/2017/ (accessed on 6 February 2023).
- Matthias, V.; Bieser, J.; Mocanu, T.; Pregger, T.; Quante, M.; Ramacher, M.O.; Seum, S.; Winkler, C. Modelling road transport emissions in Germany–Current day situation and scenarios for 2040. Transp. Res. Part D Transp. Environ. 2020, 87, 102536. [Google Scholar] [CrossRef]
- DieselNet. Emission Standards: Australia: On-Road Vehicles and Engines. Available online: https://dieselnet.com/standards/au/ (accessed on 12 May 2023).
- Ntziachristos, L.; Samaras, Z. EMEP/EEA Air Pollutant Emission Inventory Guidebook 2019: 1.A.3.b.i-iv Road Transport 2019. Available online: https://www.eea.europa.eu/publications/emep-eea-guidebook-2019/part-b-sectoral-guidance-chapters/1-energy/1-a-combustion/1-a-3-b-i/view (accessed on 12 May 2023).
- BorgWarner. Worldwide Emissions Standards 2022/2023. Available online: https://www.borgwarner.com/technologies/emissions-standards (accessed on 12 May 2023).
- S&P Global Mobility. Automotive Global Vehicle Registrations; S&P Global Mobility. Available online: https://www.spglobal.com/mobility/en/products/automotive-market-data-analysis.html (accessed on 20 October 2023).
- Seum, S.; Eisenmann, C. Projecting global land-based transportation up to 2100. In Proceedings of the European Transport Conference, Mailand, Italy, 9–11 September 2020. [Google Scholar]
- Seum, S.; Schulz, A.; Phleps, P. The Future of Driving in the Brics Countries. (Study Update 2019). 2019. Available online: https://elib.dlr.de/135710/1/2019_ifmo_BRICS_reloaded_en1.pdf (accessed on 20 April 2024).
- Samir, K.C.; Lutz, W. The human core of the shared socioeconomic pathways: Population scenarios by age, sex and level of education for all countries to 2100. Glob. Environ. Change 2017, 42, 181–192. [Google Scholar] [CrossRef]
- Dellink, R.; Chateau, J.; Lanzi, E.; Magné, B. Long-term economic growth projections in the Shared Socioeconomic Pathways. Glob. Environ. Change 2017, 42, 200–214. [Google Scholar] [CrossRef]
- European Commision. EU Transport in Figures–Statistical Pocketbook 2019; Publications Office: 2019. Available online: https://transport.ec.europa.eu/facts-funding/studies-data/eu-transport-figures-statistical-pocketbook/statistical-pocketbook-2019 (accessed on 10 February 2023).
- OECD/ITF. 2019 ITF Transport Outlook. 2019. Available online: https://www.itf-oecd.org/itf-statistical-activities-2019-itf-transport-outlook (accessed on 25 April 2024).
- Tomtom. Traffic Index 2019; Tomtom: Amsterdam, The Netherlands, 2019. [Google Scholar]
- World Health Organization. Global Status Report on Road Safety 2018; World Health Organization: Geneva, Switzerland, 2018. [Google Scholar]
- IEA. The Future of Rail, Paris. 2019. Available online: https://www.iea.org/reports/the-future-of-rail (accessed on 24 May 2023).
- BloombergNEF. Electric Vehicle Outlook 2022. 2022. Available online: https://bnef.turtl.co/story/evo-2022/page/1?teaser=yes (accessed on 5 May 2023).
- McKinsey Center for Future Mobility. Why the Automotive Future Is Electric: Mainstream EVs Will Transform the Automotive Industry and Help Decarbonize the Planet. 2021. Available online: https://www.mckinsey.com/industries/automotive-and-assembly/our-insights/why-the-automotive-future-is-electric (accessed on 29 April 2024).
- Niese, N.; Anculle, E.; Arora, A.; Gökbulut, A.; Khandelia, A.; Li, E.; Möncks, T. A Tale of Two Tomorrows in Ev Sales. BCG Glob. 2023. Available online: https://www.bcg.com/publications/2023/exploring-divergent-futures-of-ev-sales (accessed on 30 April 2024).
- Kapustin, N.O.; Grushevenko, D.A. Long-term electric vehicles outlook and their potential impact on electric grid. Energy Policy 2020, 137, 111103. [Google Scholar] [CrossRef]
- Jung, F.; Schröder, M.; Timme, M. Exponential adoption of battery electric cars. PLoS ONE 2023, 18, 295692. [Google Scholar] [CrossRef] [PubMed]
- Gajbhiye, M.D.; Lakshmanan, S.; Aggarwal, R.; Kumar, N.; Bhattacharya, S. Evolution and mitigation of vehicular emissions due to India’s Bharat Stage Emission Standards—A case study from Delhi. Environ. Dev. 2023, 45, 100803. [Google Scholar] [CrossRef]
- Raparthi, N.; Debbarma, S.; Phuleria, H.C. Development of real-world emission factors for on-road vehicles from motorway tunnel measurements. Atmos. Environ. X 2021, 10, 100113. [Google Scholar] [CrossRef]
- Oliver, F.R. Methods of Estimating the Logistic Growth Function. Appl. Stat. 1964, 13, 57. [Google Scholar] [CrossRef]




| Region/ Country | Target Stock BEV Share | Target Year | Literature Considered | Source |
|---|---|---|---|---|
| Australia | 70% | 2065 | 65% sales in 2050 | [16] |
| Total BEV and PHEV sales share will be 30% in 2030 | [17] | |||
| OECD Europe (Germany) | 100% | 2060 | 100% BEV new registrations in 2035 | [10] |
| North America (the USA) | 100% | 2060 | 100% government vehicles in 2035 | [18] |
| 50% electric vehicle sales share in 2030 | [19] | |||
| 10 US states are in the ZEV Alliance, which is aiming for 100% EV sales between 2035 and 2050. | [20] | |||
| China | 100% | 2060 | Net 0 in 2060 | [21] |
| India | 75% | 2070 | 30% sales in 2030 and 75% in 2050 | [22] |
| 15–20% sales in 2030 | [23] | |||
| EV stock in 2040 is 10% in Stated Policies Scenario and 60% in Sustainable Development Scenario | [24] | |||
| Japan | 60% | 2050 | 100% HEV or EV sales in 2030 | [25] |
| Africa (South Africa) | 65% | 2070 | 40% of fleet will be EV by 2050 | [26] |
| 50% stock share in 2050 | [27] | |||
| 80% new sales will be EVs in 2045 | [28] | |||
| South America (Brazil) | 15% | 2050 | 61% hybrid and 11% BEV fleet in 2050 | [29] |
| Eastern Europe (Russia) | 10% | 2055 | 10% sales in 2030 | [30] |
| Region/ Country | Year | CO2 EF (g/km) | ||||||
|---|---|---|---|---|---|---|---|---|
| G | G-HEV | D | D-HEV | CNG | G-PHEV | D-PHEV | ||
| Australia | 2015 | 174.7 | 121.9 | 190.0 | 138.2 | 178.9 | 109.3 | 123.9 |
| 2030 | 127.9 | 96.2 | 136.5 | 109.8 | 132.8 | 86.0 | 98.2 | |
| 2050 | 96.1 | 65.0 | 110.5 | 76.4 | 90.3 | 62.5 | 73.4 | |
| South America (Brazil) | 2015 | 177.7 | 106.8 | 179.9 | 136.7 | 192.4 | 96.2 | 123.2 |
| 2030 | 142.0 | 93.6 | 154.7 | 119.9 | 167.9 | 84.6 | 108.3 | |
| 2050 | 120.1 | 81.5 | 134.5 | 104.7 | 135.0 | 75.0 | 96.3 | |
| China | 2015 | 138.2 | 116.4 | 162.6 | 119.2 | 182.1 | 125.9 | - |
| 2030 | 109.0 | 76.5 | 114.1 | 80.8 | 135.3 | 106.4 | - | |
| 2050 | 82.7 | 55.5 | 89.5 | 59.6 | 90.8 | 83.9 | - | |
| OECD Europe (Germany) | 2015 | 147.6 | 94.8 | 141.8 | 96.9 | 152.8 | 116.1 | 118.8 |
| 2030 | 136.7 | 89.4 | 125.9 | 94.1 | 139.4 | 94.3 | 99.3 | |
| 2050 | 117.8 | 69.0 | 113.5 | 73.1 | 107.1 | 73.3 | 77.6 | |
| India | 2015 | 223.8 | 113.7 | 203.9 | 143.6 | 184.5 | 147.8 | 186.5 |
| 2030 | 150.3 | 95.4 | 174.7 | 135.5 | 155.6 | 117.6 | 167.0 | |
| 2050 | 112.8 | 77.6 | 133.0 | 121.9 | 117.0 | 94.9 | 149.1 | |
| Japan | 2015 | 174.7 | 121.9 | 190.0 | 138.2 | 178.9 | 109.3 | 123.9 |
| 2030 | 127.9 | 96.2 | 136.5 | 109.8 | 132.8 | 86.0 | 98.2 | |
| 2050 | 96.1 | 65.0 | 110.5 | 76.4 | 90.3 | 62.5 | 73.4 | |
| Eastern Europe (Russia) | 2015 | 176.1 | 121.0 | 166.4 | 130.2 | 160.3 | 113.0 | 121.7 |
| 2030 | 149.3 | 99.1 | 142.4 | 109.1 | 136.7 | 99.3 | 109.3 | |
| 2050 | 117.7 | 80.4 | 123.8 | 90.6 | 109.8 | 84.3 | 95.1 | |
| Africa (South Africa) | 2015 | 200.9 | 133.1 | 196.8 | 141.4 | 196.9 | 144.5 | 138.6 |
| 2030 | 164.3 | 114.0 | 152.9 | 122.4 | 196.9 | 116.5 | 111.5 | |
| 2050 | 130.8 | 91.7 | 132.1 | 100.6 | 197.0 | 99.0 | 94.4 | |
| North America (the USA) | 2015 | 268.1 | 144.0 | - | - | 172.0 | 102.7 | - |
| 2030 | 165.9 | 99.5 | - | - | 128.5 | 79.6 | - | |
| 2050 | 94.3 | 52.9 | - | - | 40.7 | 52.4 | - | |
Disclaimer/Publisher’s Note: The statements, opinions and data contained in all publications are solely those of the individual author(s) and contributor(s) and not of MDPI and/or the editor(s). MDPI and/or the editor(s) disclaim responsibility for any injury to people or property resulting from any ideas, methods, instructions or products referred to in the content. |
© 2024 by the authors. Licensee MDPI, Basel, Switzerland. This article is an open access article distributed under the terms and conditions of the Creative Commons Attribution (CC BY) license (https://creativecommons.org/licenses/by/4.0/).
Share and Cite
Senzeybek, M.; Feinauer, M.; Dasgupta, I.; Ehrenberger, S. Analysis of Passenger Car Tailpipe Emissions in Different World Regions through 2050. Future Transp. 2024, 4, 608-633. https://doi.org/10.3390/futuretransp4020029
Senzeybek M, Feinauer M, Dasgupta I, Ehrenberger S. Analysis of Passenger Car Tailpipe Emissions in Different World Regions through 2050. Future Transportation. 2024; 4(2):608-633. https://doi.org/10.3390/futuretransp4020029
Chicago/Turabian StyleSenzeybek, Murat, Mario Feinauer, Isheeka Dasgupta, and Simone Ehrenberger. 2024. "Analysis of Passenger Car Tailpipe Emissions in Different World Regions through 2050" Future Transportation 4, no. 2: 608-633. https://doi.org/10.3390/futuretransp4020029
APA StyleSenzeybek, M., Feinauer, M., Dasgupta, I., & Ehrenberger, S. (2024). Analysis of Passenger Car Tailpipe Emissions in Different World Regions through 2050. Future Transportation, 4(2), 608-633. https://doi.org/10.3390/futuretransp4020029


