1. Introduction
Bike sharing has emerged as an innovative public transportation and shared micromobility system, offering individuals the opportunity to rent bicycles for short-distance trips. Bikeshare systems have gained significant popularity, providing a sustainable, health-conscious, and cost-effective alternative to other transportation modes. Beyond personal benefits, these systems contribute to mitigating traffic congestion, reducing air pollution, and fostering active transportation. Furthermore, these systems enhance the overall transit accessibility by seamlessly bridging the gap as a first-mile and/or last-mile connectivity solution.
The advent of the COVID-19 pandemic brought about unprecedented changes in global travel behaviors and impacted transportation systems on a large scale. Governments worldwide implemented stringent measures to curb the spread of the virus, resulting in a substantial shift in people’s commuting habits. In the initial phases of the pandemic, major transit agencies experienced a decline in ridership due to stay-at-home orders, emphasizing social distancing, and minimizing transmission risks. Concurrently, numerous bikeshare systems temporarily halted or scaled back their services, driven by concerns about virus transmission. This collective response led to a noticeable reduction in bikeshare ridership. However, as the pandemic progressed and restrictions eased, many bikeshare systems gradually resumed operations, witnessing a resurgence in ridership. Some systems even observed a surge in popularity, as individuals sought alternative transportation modes to steer clear of crowded buses and trains.
2. Background
The impact of the COVID-19 pandemic on bikeshare systems varied depending on the location and system type. Urban areas experienced more significant effects than rural counterparts, and systems that were heavily reliant on tourism were more adversely affected compared to those primarily dependent on local ridership. For Budapest, Hungary, it was shown that public transportation declined, while cycling saw growth during the pandemic [
1]. Another study analyzed bikeshare trips in Budapest for 2019 and 2020, uncovering that mobility and government stringency efforts had a positive impact on bike sharing system usage, particularly in residential areas near public parks, leading to increased usage during the pandemic [
2]. In a separate study, the trip volume and duration patterns among members and non-members of five U.S. bikeshare systems were examined. The results indicated that neither member nor non-member ridership rebounded to pre-pandemic levels, except for the membership ridership in Minneapolis and non-membership ridership in Washington D.C. The research also revealed that both members and non-members had been making longer trips during the pandemic [
3]. According to the survey’s results in Greece, people wanted to stay safe from COVID-19, and bike sharing provided a safe mobility option for them [
4]. In London, a quantitative study explored bikeshare usage trends from 2019 to the mid-2020, revealing an immediate drop during the lockdown but no significant change when restrictions eased. Morning peak and short-duration trips remained reduced, while trips to locations near parks experienced higher growth [
5]. A study in New York, Boston, and Chicago during different COVID-19 phases found a decrease in the number of bike trips but an increase in the average trip duration [
6]. The analysis of bikeshare usage changes in Brooklyn, New York City, highlighted a shift from commuting to leisure trips [
7]. Comparing bikeshare and subway systems in New York City, the bike sharing system proved more resilient during the pandemic, with a smaller drop in ridership and increased trip duration. Some subway users switched to the bike sharing system [
8]. In Seoul, South Korea, the pandemic influenced the bike sharing demand, with the number of daily new confirmed COVID-19 cases impacting public bike usage. Social distancing and changes in bike usage patterns varied based on the bike station’s location [
9]. Additional Seoul studies observed increased ridership and longer durations during COVID-19 period, especially for commuters and recreational users [
10]. A daily ridership data analysis from 2017 to 2021 revealed bikeshare usage resilience during mild weather conditions, weekdays, weekends, and national holidays [
11]. In Barcelona, Spain, the bike sharing usage increased during the pandemic, with notable factors affecting usage before and during the pandemic [
12]. For Lisbon, Portugal, a spatiotemporal analysis highlighted bike sharing system trips’ highest occurrence during weekday afternoons in 2018, with weather conditions influencing travel behavior [
13]. In Colorado, a study using bike sharing systems and county-level COVID-19 data found income, education level, and total population to be crucial factors affecting bicycle usage during different pandemic phases [
14]. Governments globally responded to the decline in carsharing usage due to pandemic restrictions by implementing sustainable measures, emphasizing the need to strengthen shared mobility services, such as bike sharing, to promote sustainable urban mobility [
15,
16].
Our study aims to investigate the impact of the COVID-19 pandemic outbreak on bikeshare ridership, with a case study in Houston, Texas. According to the U.S. Census Bureau’s population estimates program, as of 2021, Houston, Texas, is the fourth most populous city in the U.S., with an estimated population of 2.3 million. Houston is also one of the fastest-growing cities in the U.S., with a 2020 growth rate of 1.08%, according to World Population Review. Houston is a diverse and multicultural city and has a large and diverse economy. Because of the diverse economy, diverse population, and its large geographic area, the city’s development and planning efforts are complex and multifaceted. Houston has a relatively low-density and sprawling urban form compared to other large cities. This is partly due to a lack of zoning regulations, which has allowed for a more laissez-faire approach to development. This has led to a mix of land uses, with residential, commercial, and industrial areas often being located in close proximity to one another. Houston has also been criticized for its lack of walkability and bike-friendly infrastructure, making it difficult for people to get around without a car. However, in recent years, the city has been actively working to improve its walkability, bike infrastructure, and bikeshare system. Houston’s bikeshare program promotes sustainability and accessibility and has implemented policies to address these issues.
The COVID-19 pandemic underscored the importance of sustainable transportation options that are capable of withstanding crises, as it significantly impacted how many vehicle miles were traveled and public transportation [
17]. Houston and all of Harris County experienced a substantial decline in traffic levels from mid-March to early June 2021 due to the COVID-19 pandemic. The total vehicle miles traveled (VMT) in the county decreased from 154,205,000 miles (in January 2020) to its lowest point, 51,900,000 miles, on 21 March 2021, representing a 66% reduction. However, with the expiration of the state’s stay-at-home order on April 30 and the commencement of business reopening in Texas, the daily VMT began to rise [
18]. Furthermore, an assessment conducted by Air Alliance Houston, LINK Houston, and Texas Southern University found a 79% decrease in the transit vehicle miles traveled (VMT) in Harris County in April 2020. The pandemic also resulted in decreased ridership in Houston’s transit agency due to concerns about virus transmission (the COVID-19 pandemic induced a 40% decrease in public transportation use due to fear of the virus) [
19]. Therefore, comprehending the impact of COVID-19 on bike sharing systems in this large and important city is crucial for researchers and policy makers alike.
Previous studies analyzed the influence of important factors such as trip characteristics, infrastructure, weather conditions, user demographics, and land use on bike sharing ridership. However, there is a lack of understanding about the impact of COVID-19 on bike sharing system usage in Houston. Furthermore, the existing studies mostly considered and compared two periods that occurred before and during the outbreak of COVID-19. They did not consider the post-pandemic period in their analyses. Therefore, the aim of this study is to address these gaps by examining the relevance of COVID-19, temporal, and weather factors in predicting Houston bike sharing system usage before the pandemic, during the outbreak, and after the pandemic. The study employs a ridership data approach to analyze the usage of the bike sharing system and make conjectures based on real-world data analysis of the entire population of interest. The results of the study will provide valuable insights for future research on the factors that predict bikeshare system usage in the city. This will be important, since the findings will illuminate the changes in people’s travel behaviors regarding biking, especially in big metropolitan cities during similar pandemics.
3. Methodology
3.1. Data Collection and Preparation
Houston bikeshare program is operated by Houston BCycle, a local 501(c)(3) nonprofit organization with support from the city of Houston, local businesses, and other sponsors. It was launched in 2012 with only three stations and 18 bikes. Houston BCycle has grown its network to connect more people to more places and expanded its bicycle facilities and fleet to 153 stations with over 1000 bicycles. The bikeshare stations are located throughout the city, mainly within the I-610 loop, including popular tourist destinations, parks, and major employment centers. The bikeshare ridership data used in this study were provided by Houston BCycle. The original dataset of bikeshare records (raw data) for 2019, 2020, and 2021 included the following information for each bicycle trip: trip ID, user program name, user ID, user role (RFID card member and non-RFID card member), user city, user state, user zip, user country, membership type (annual membership, single-use pass, and monthly membership), bike ID, bike type, check-out kiosk name, return-kiosk name, duration (minutes), adjusted duration (minutes), usage fee, adjustment flag, distance, estimated carbon offset, estimated calories burned, local check-out date, local return date, local checkout time, local return time, trip over 30 min, local program flag, trip route category (round trip or one way), and trip program name. For this study, trips with durations of one minute or less were excluded from the analysis. The reason was that a trip duration of one minute or less was considered too short to be taken as a valid trip. During data processing and cleaning, two attributes were utilized: “check-out kiosk names” and “duration”. Each trip duration was extracted from the “duration” attribute, and trips were tallied based on the “check-out date local” attribute. The “check-out time local” attribute was also used to capture the timing of each trip. The bike data were aggregated from trip level to day level to match the COVID-19 data.
The daily COVID-19-positive cases in Houston were downloaded from Harris County and the City of Houston COVID-19 data hub. The Harris County and the City of Houston data hub is a comprehensive resource that provides up-to-date information on the COVID-19 pandemic in the Houston metropolitan area. The data hub is an initiative by the local government to provide residents with accurate and reliable information about the pandemic, including the number of cases, deaths, hospitalizations, and vaccination rates. The daily cases data contained attributes such as object ID, date, total cases, new cases, old cases, source, and date label. The Houston daily reported cases were extracted for the year 2020.
The temperature and the precipitation data that were required for the analysis were downloaded from the National Oceanic and Atmospheric Administration (NOAA) website for each day of 2019 and 2020. The daily temperatures included both maximum and minimum values on that specific day. For the analysis, daily average temperatures were calculated. The precipitation data indicated the amount of rainfall in inches on any given day.
To assess the pandemic’s impact on different parameters, previous studies have used indicators for the level of COVID-19 effect (i.e., effect factor). For example, Qi et al. conducted a study and used a composite index to measure the level of public fear towards COVID-19 for their model development; and the results of the study revealed that the level of public fear in a metropolitan area had a significant impact on the public transit ridership reduction [
20]. Liu et al. used the Google search trend index for the keyword “Coronavirus” to measure public awareness and concern about COVID-19 [
21]. In our study, we utilized a reported case index to consider the time-related effect of COVID-19 in the study area. This means that a temporal lag must be considered between COVID-19 infection on a given day and its effect on the daily ridership. Moreover, the portion of the data from mid-November to the end of December 2020 was excluded from the analysis to eliminate the effect of the holiday season (including Thanksgiving, Christmas, and New Year holidays).
To study the impact of the COVID-19 pandemic on bikeshare activities, the relationship between different variables of interest must be examined. Therefore, bikeshare daily ridership was selected as a dependent variable, while COVID-19 daily cases, day of the week, temperature, and precipitation were independent variables. Furthermore, the day of the week (weekday or weekend) and temperature were coded as binary variables for the analysis. During the variable selection process, it is crucial to conduct a multicollinearity test to assess the relationship among variables to minimize potential errors in the model and attain more accurate outcomes. Variance Inflation Factor (VIF) measures the amount of multicollinearity that estimates the correlation between independent variables and determines the extent to which multicollinearity inflates the error or variance of a regression coefficient in the modeling process. A VIF value smaller than 2.5 indicates that independent variables are not significantly correlated, whereas a VIF value between 2.5 and 10 implies a moderate correlation among independent variables. A high correlation between independent variables is indicated when the VIF value is greater than 10. A multicollinearity test was conducted for the Houston bikeshare data for the complete duration of the analysis. The results showed that all the VIF values were less than 2.5. This means that there are no noteworthy correlations between these independent variables, and the independent variables are independent of each other.
The dependent variable in the study, i.e., bikeshare ridership, is count data. Conventional linear regression models assume a normal distribution for data. However, there are other methods for modeling count data. The most common method is the Poisson regression model, which assumes a Poisson distribution for the dependent variable. This model has a restrictive assumption that the variance is equal to the mean. Unlike Poisson, Negative Binomial regression allows the variance to be greater than the mean. Count variables often exhibit overdispersion, which means that the variance of the data is greater than the mean.
3.2. Model Selection
As previously mentioned, a key limitation of the Poisson model is its underlying assumption that the variance of y
i is equal to their mean. This is a restrictive property and often fails to be held in practice, as there is over-dispersion in the data. When the dependent variable is over-dispersed, e.g., the variance of average daily ridership data is greater than their mean, the Poisson regression model cannot be employed. In order to relax the over-dispersion constraint, a Negative Binomial regression model is used. Deriving the Negative Binomial regression model can start with a Poisson model, which is defined by the following equation [
22]:
where P(n
i) is the probability of bikeshare i having n
i average daily ridership, and λ
i is the Poisson parameter, which is equal to the expected average daily ridership of the bikeshare i. When applying Poisson model, the average daily ridership is assumed to be a function of explanatory variables, so that
where x
i is a vector of explanatory variables; and β is a vector of estimated coefficients and can be estimated by the maximum likelihood method, with the likelihood function being as follows:
To overcome the overdispersion problem, Negative Binomial regression can be applied to relax the assumption that the mean of accident frequencies equals the variance. To do this, an error term is added to the average daily ridership (λ
i) so that Equation (2) becomes
where exp(ε
i) is a gamma-distributed error term with mean 1 and variance 1/θ. This gives a conditional probability.
Integrating ε out of this expression produces the unconditional distribution of n
i. The formulation of the Negative Binomial distribution will be
where u
i = θ/(θ + λ
i) and θ = 1/α, and Γ is a value of gamma distribution. The parameters of the Negative Binomial regression model β and α can be estimated by using the following maximum likelihood function:
To identify the appropriate statistical model for data, a likelihood ratio test is performed to compare the effectiveness of Poisson and Negative Binomial regression models. In this study, the likelihood ratio test yielded a p-value of less than 5%, meaning that the null hypothesis was rejected, and a Negative Binomial model must be used. Moreover, the Akaike Information Criterion (AIC) value for Negative Binomial regression model was lower than the value for the Poisson regression model; and the log-likelihood value for the Negative Binomial regression model was higher than for the Poisson regression model.
3.3. Marginal Effects and Incidence Rate Ratios (IRRs)
Marginal effects and Incidence Rate Ratios (IRRs) are important output measures for the Negative Binomial regression model, as they help us understand the relationship between independent variables and count data. These measures are used to draw conclusions and make predictions about the effect of predictor variables on the count outcome. Marginal effect refers to the change in the expected count outcome associated with a one-unit change in an independent variable. It can be calculated by taking the exponential of the estimated coefficient for the predictor variable. On the other hand, IRR is the ratio of the expected count rate associated with one level of the predictor variable relative to another level of the predictor variable. It can be calculated by taking the exponential of the difference between the estimated coefficients for the two levels of the predictor variable. Both measures are useful in analyzing and interpreting Negative Binomial regression models.
5. Conclusions
The establishment of the Houston bikeshare scheme aimed to provide a healthier, more sustainable, and equitable transportation option for the people of Houston. This system was designed to encourage active transportation and reduce the reliance on cars, thereby improving air quality, alleviating traffic congestion, and promoting public health. However, the onset of the COVID-19 pandemic had a profound impact on various transportation modes and programs, including bikeshare systems. Several previous studies have analyzed the influence of significant factors on bike sharing ridership in different locations. Some of these studies relied on surveys to capture user behavior, while others conducted observations and experiments in specific areas. However, these approaches lacked a comprehensive understanding of bikeshare activities throughout the entire system. To gain a holistic view of the bikeshare program’s dynamics, it is crucial to explore its responses to the unique challenges posed by the pandemic on a broader scale, considering the system as a whole. This comprehensive approach will facilitate a deeper understanding of the pandemic’s impact on bikeshare usage patterns and help devise effective strategies to adapt and promote its continued success in the face of such extraordinary circumstances.
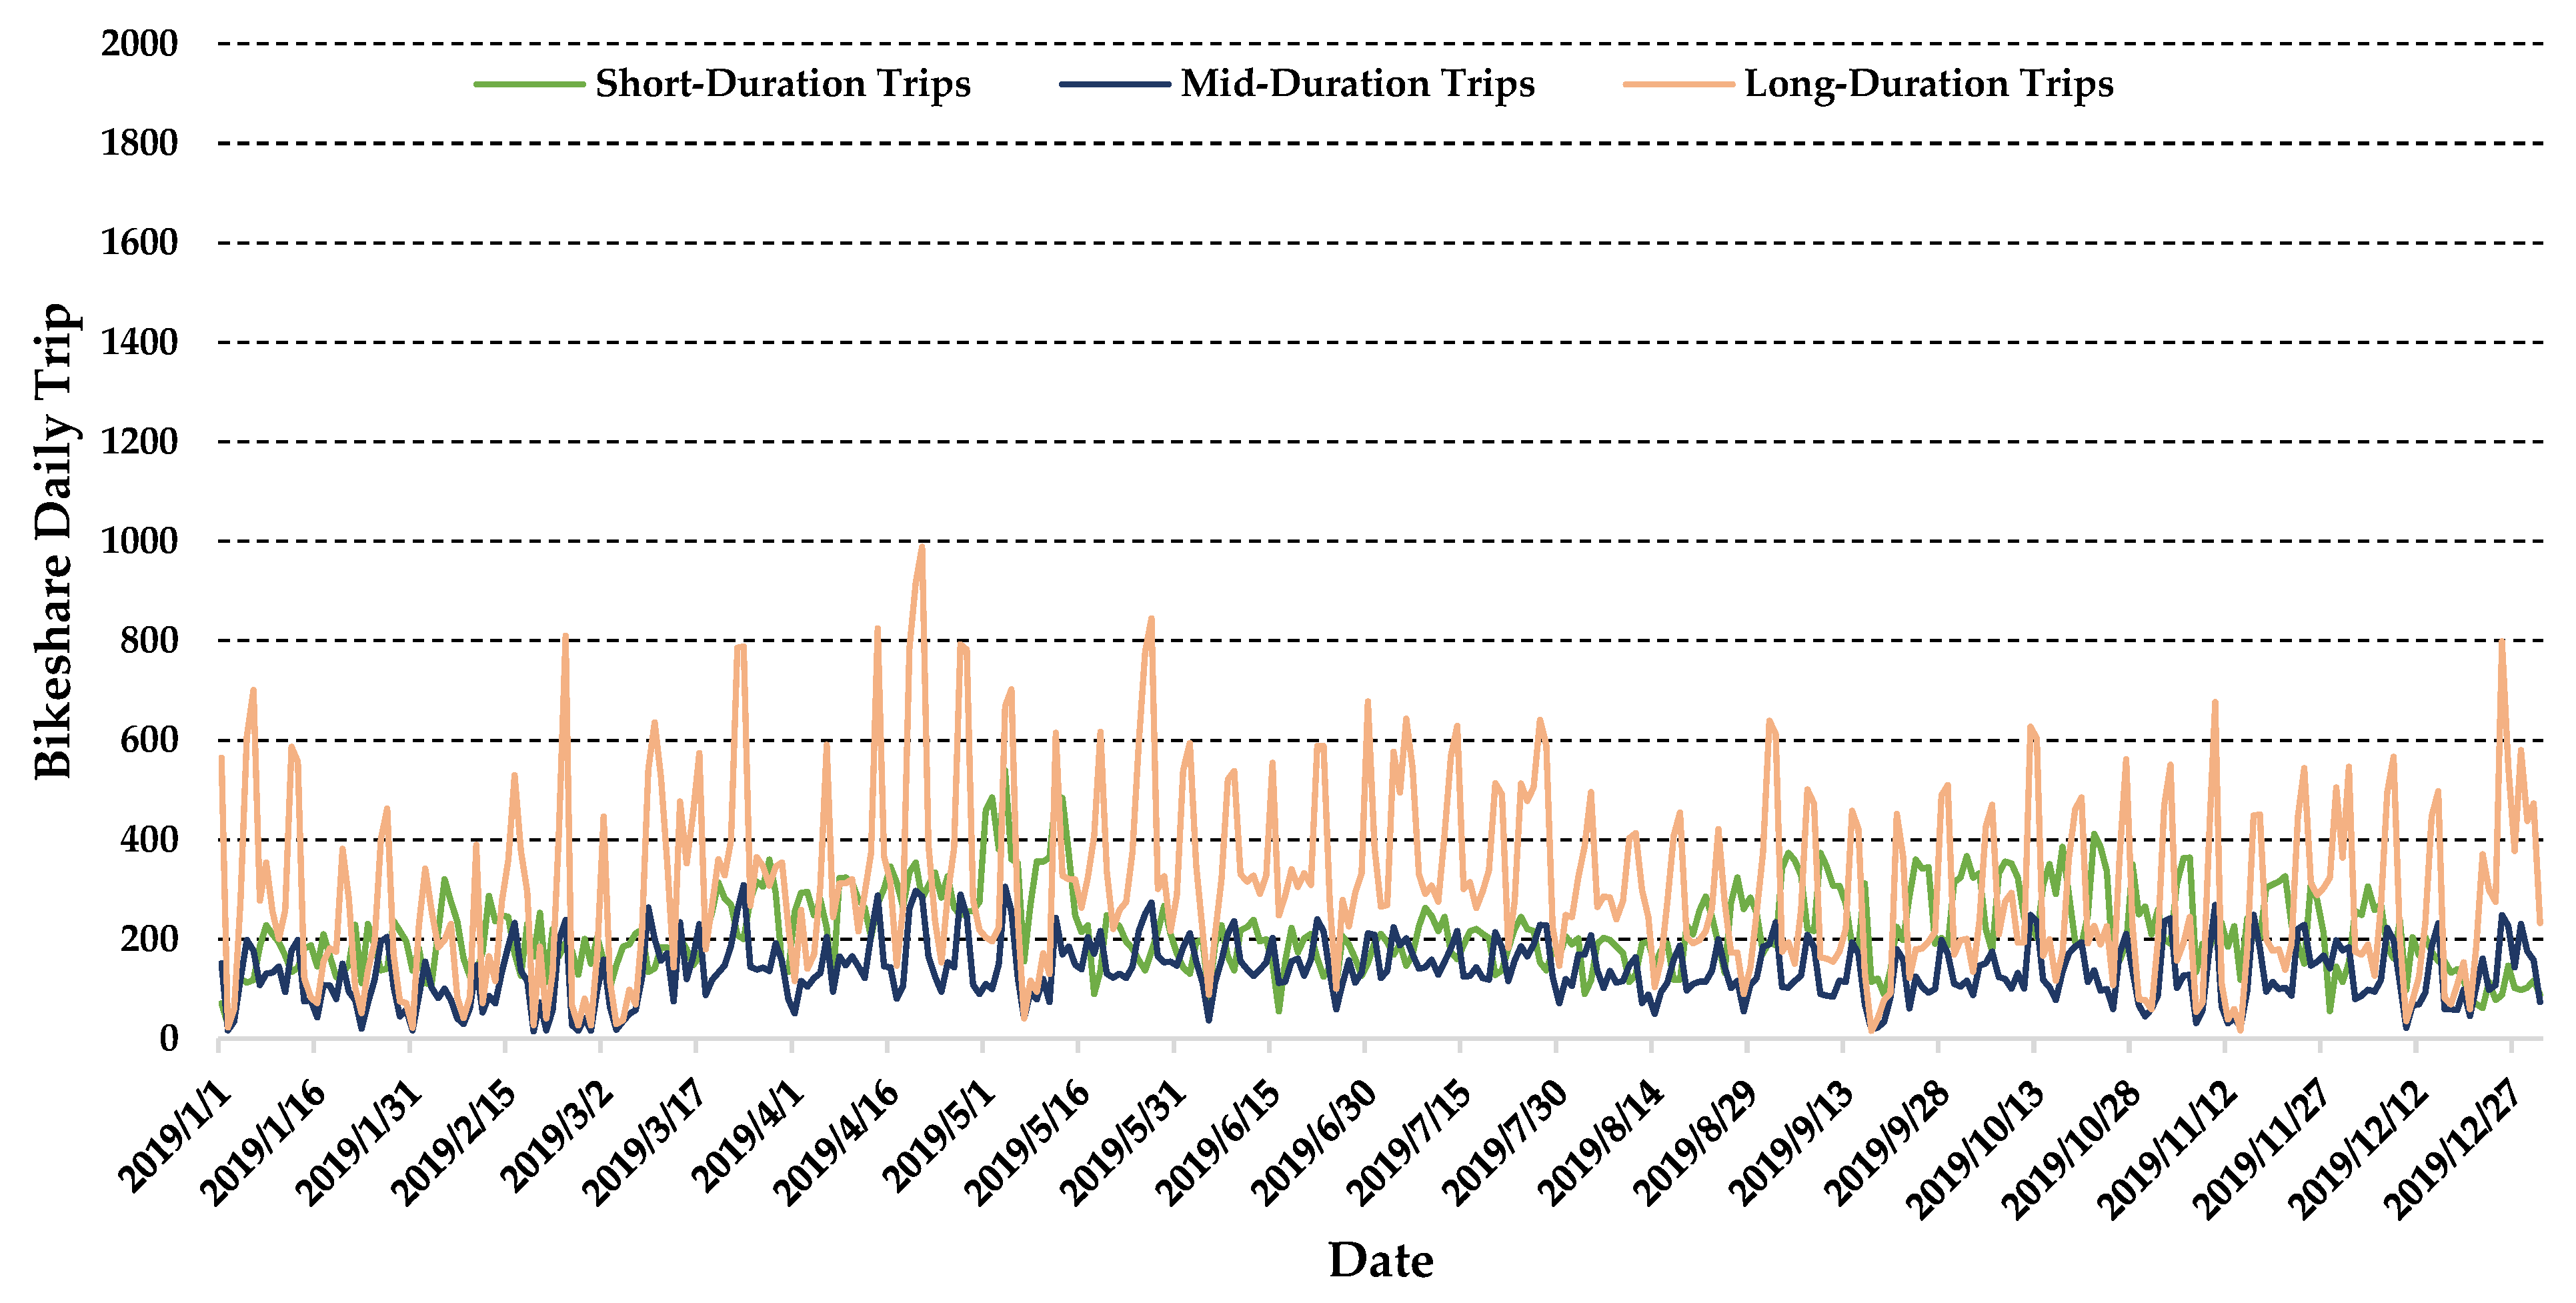
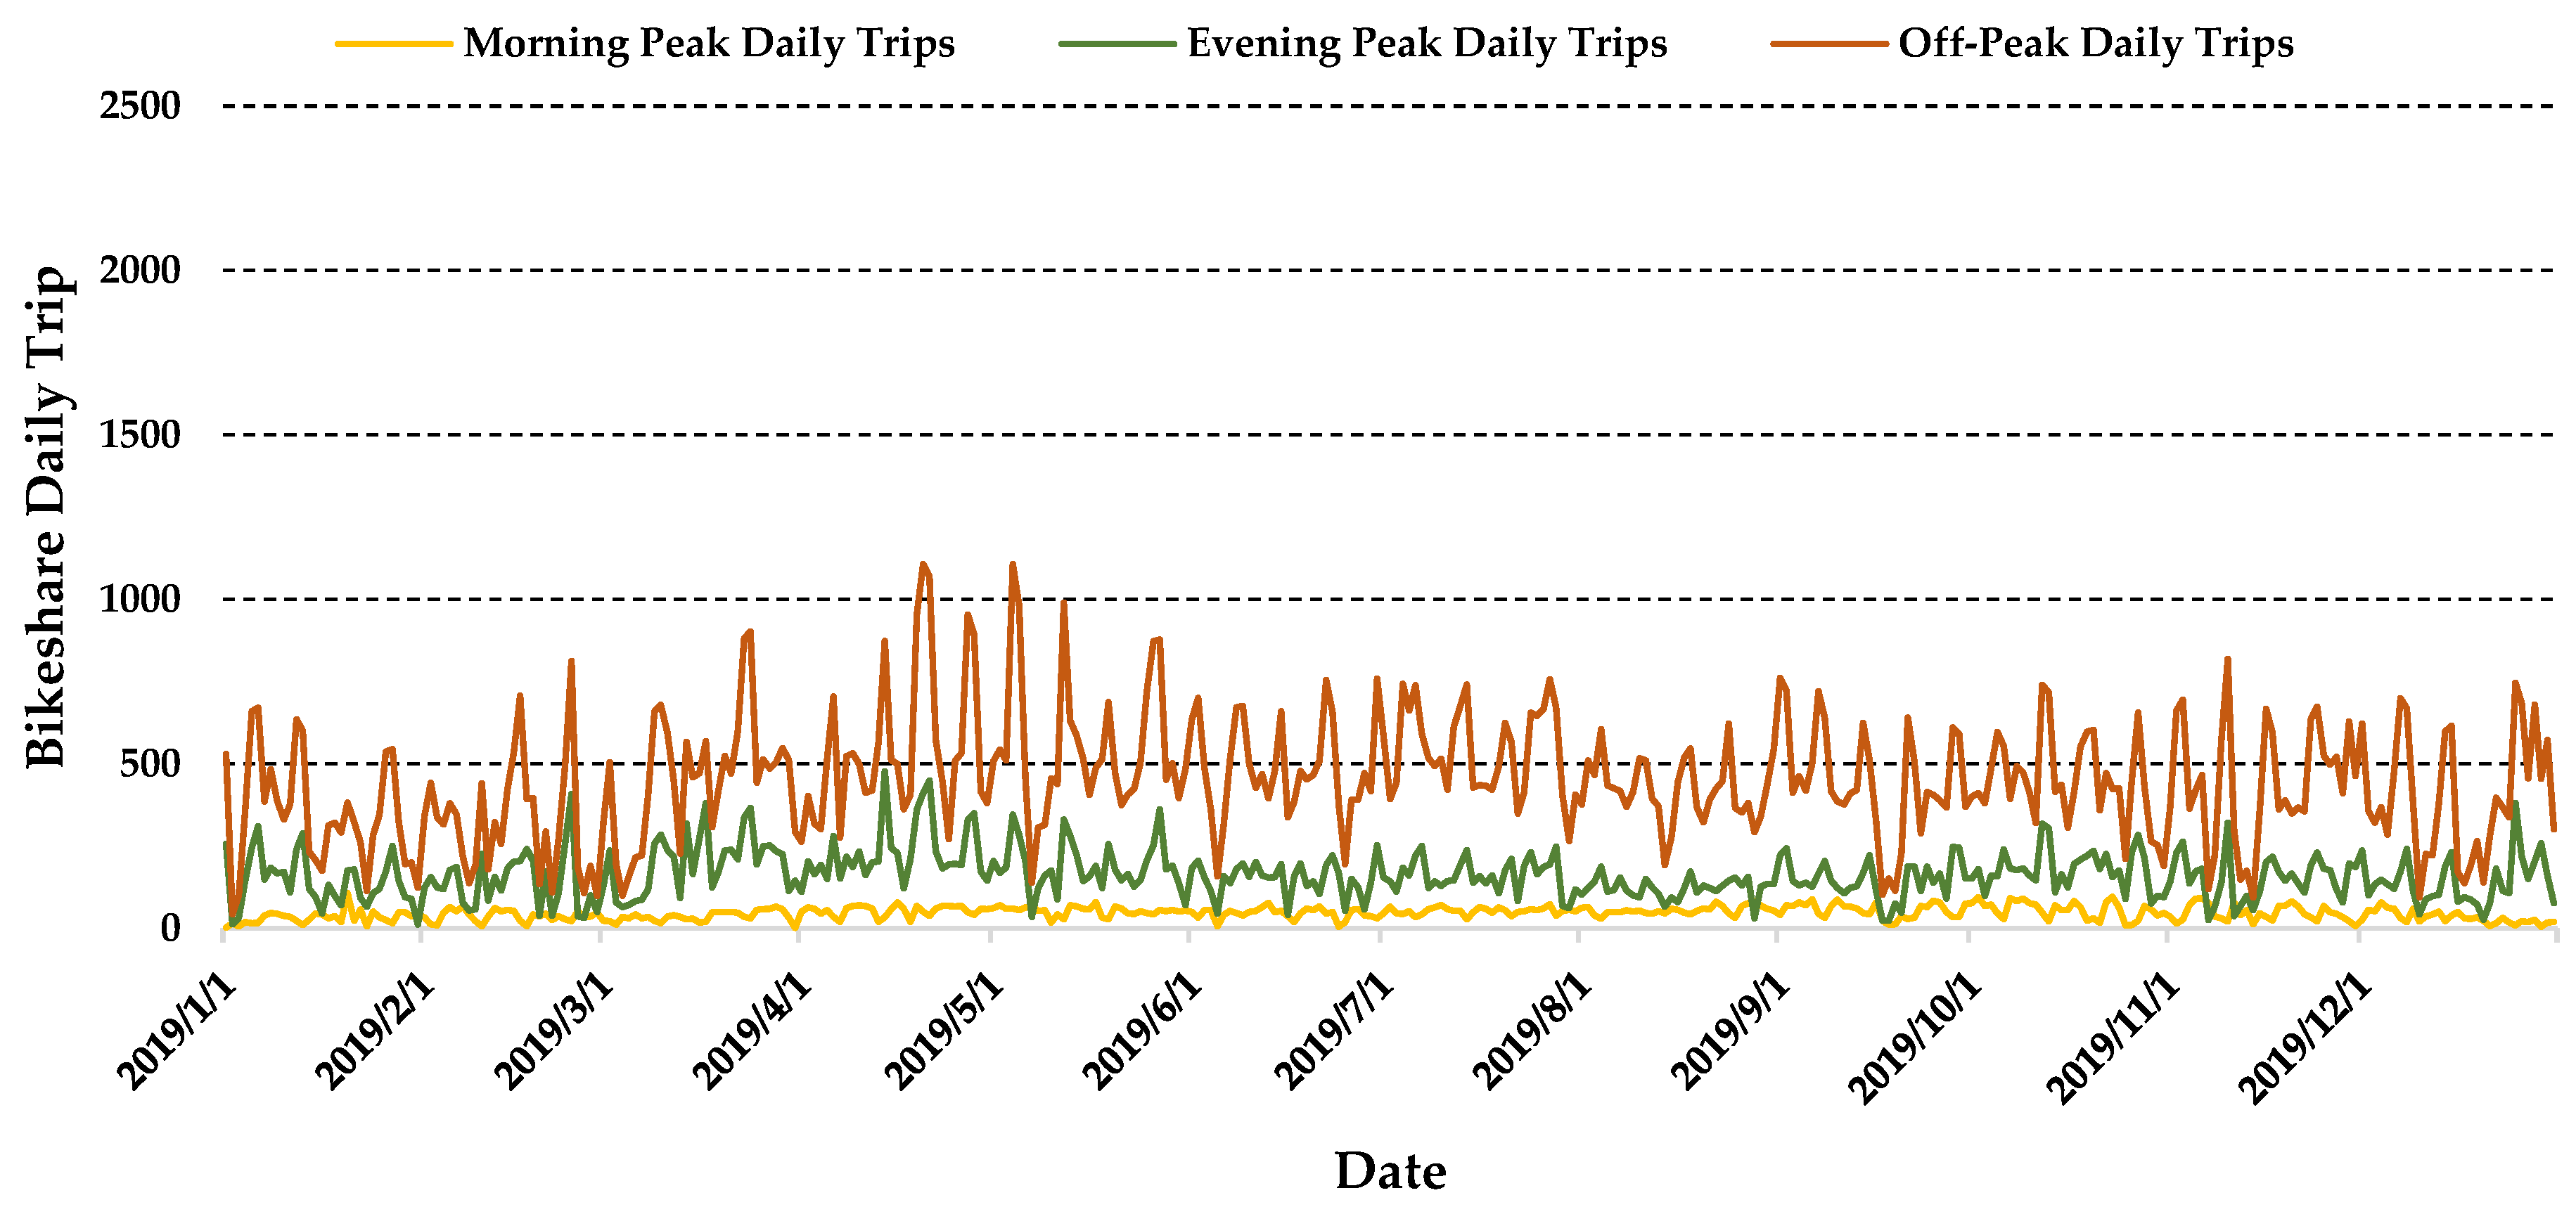
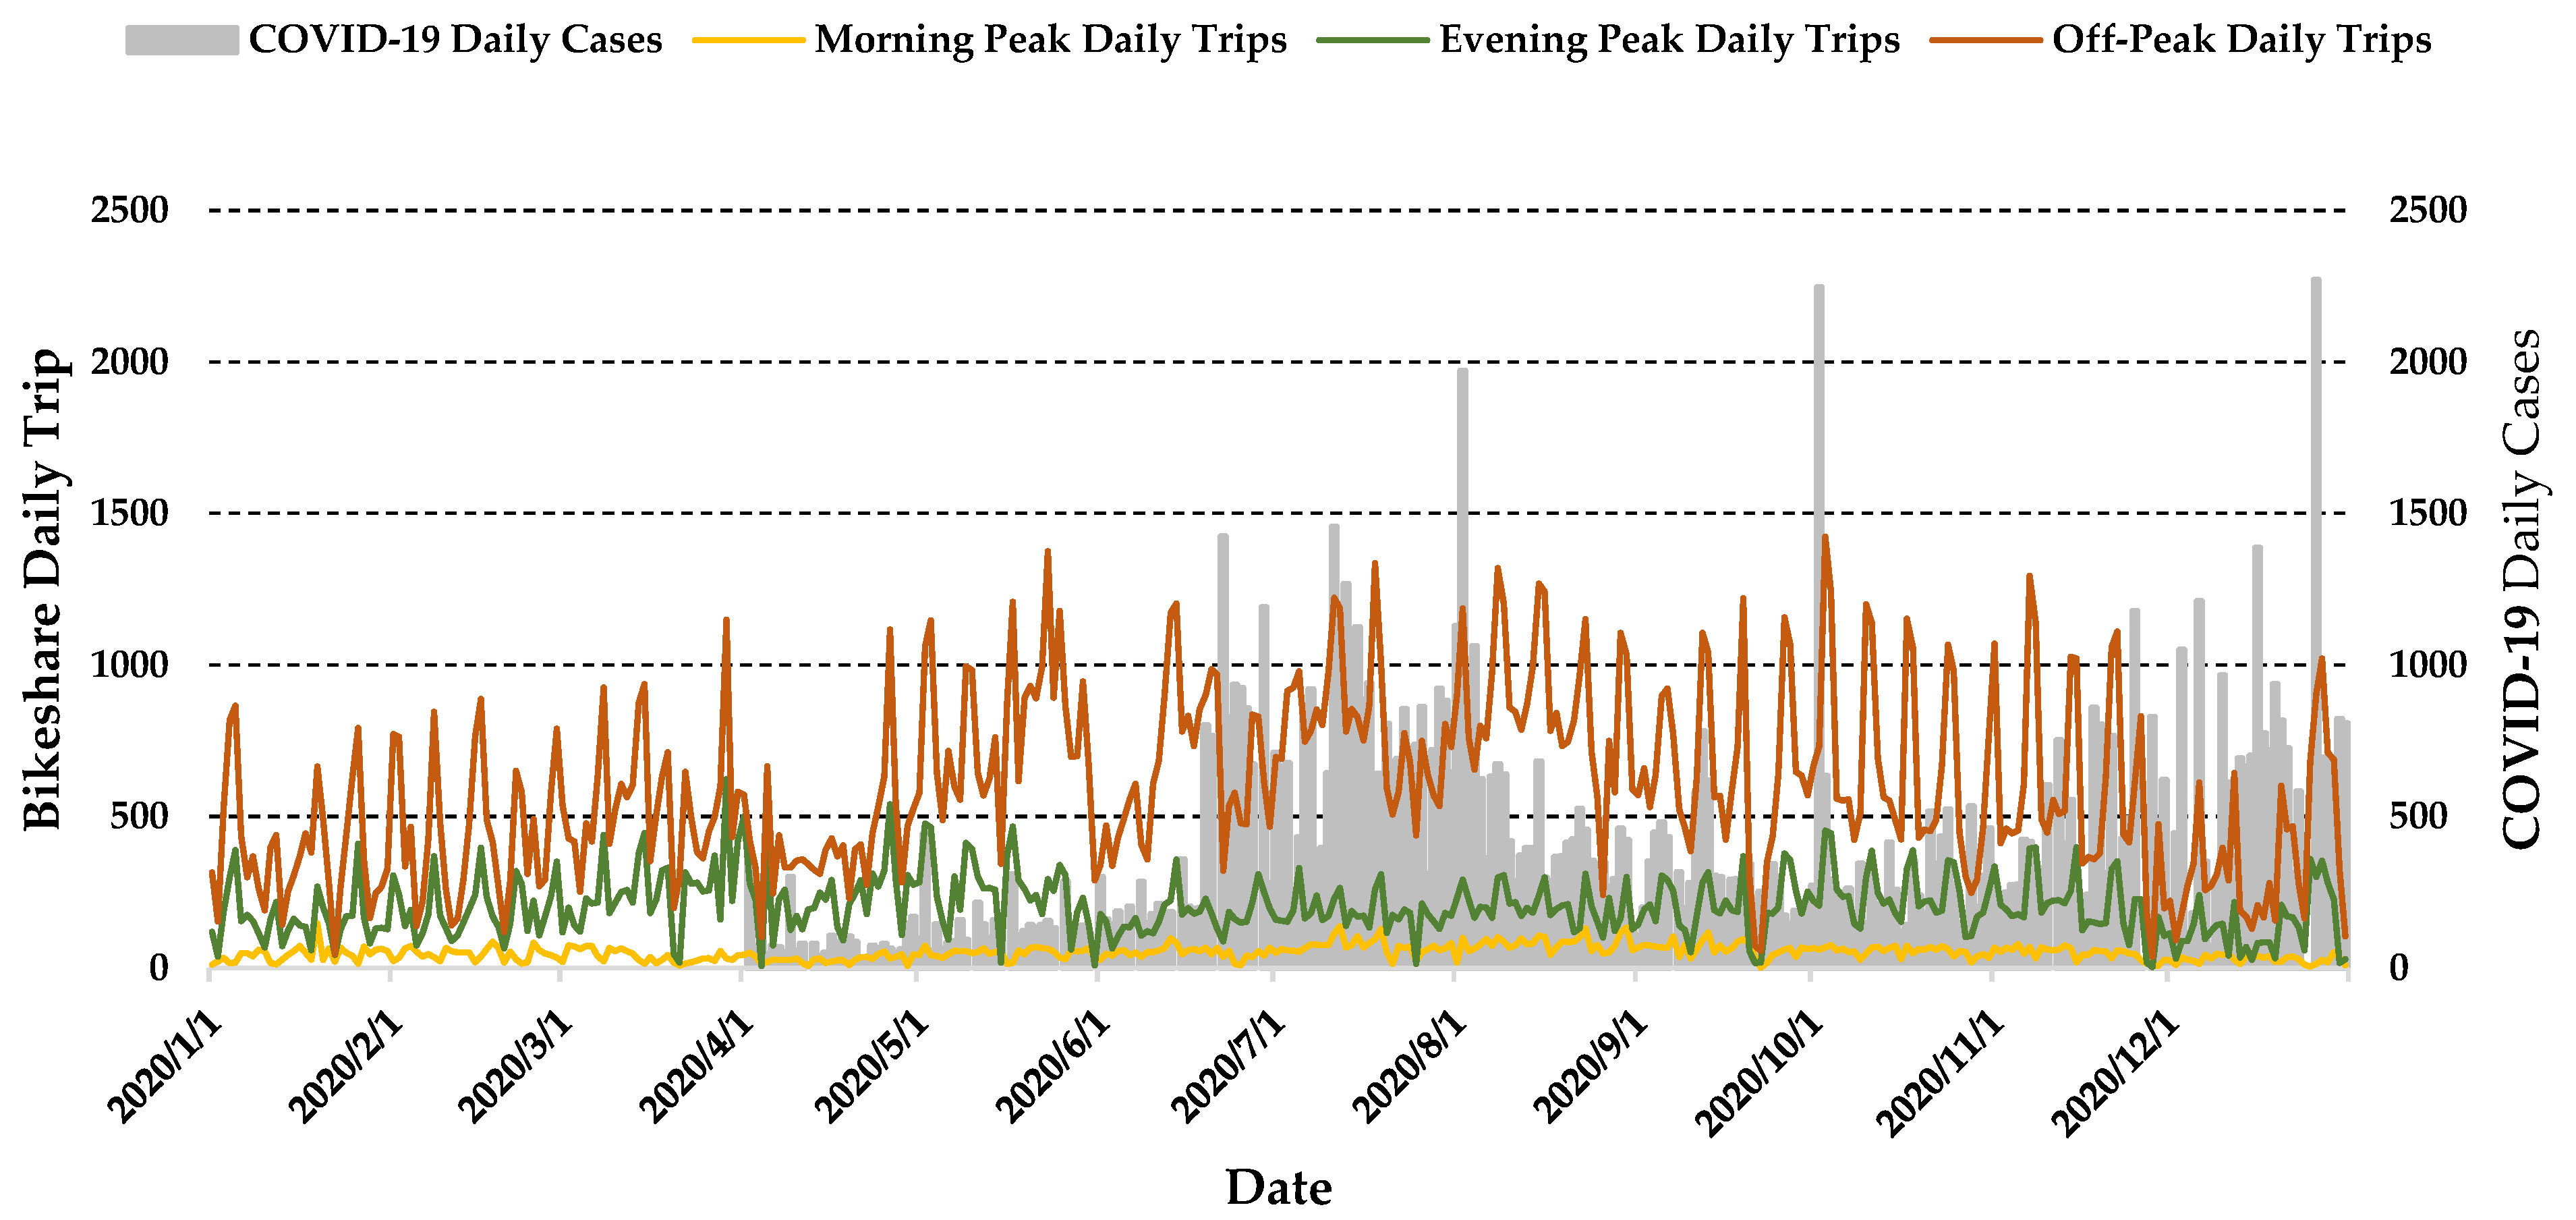
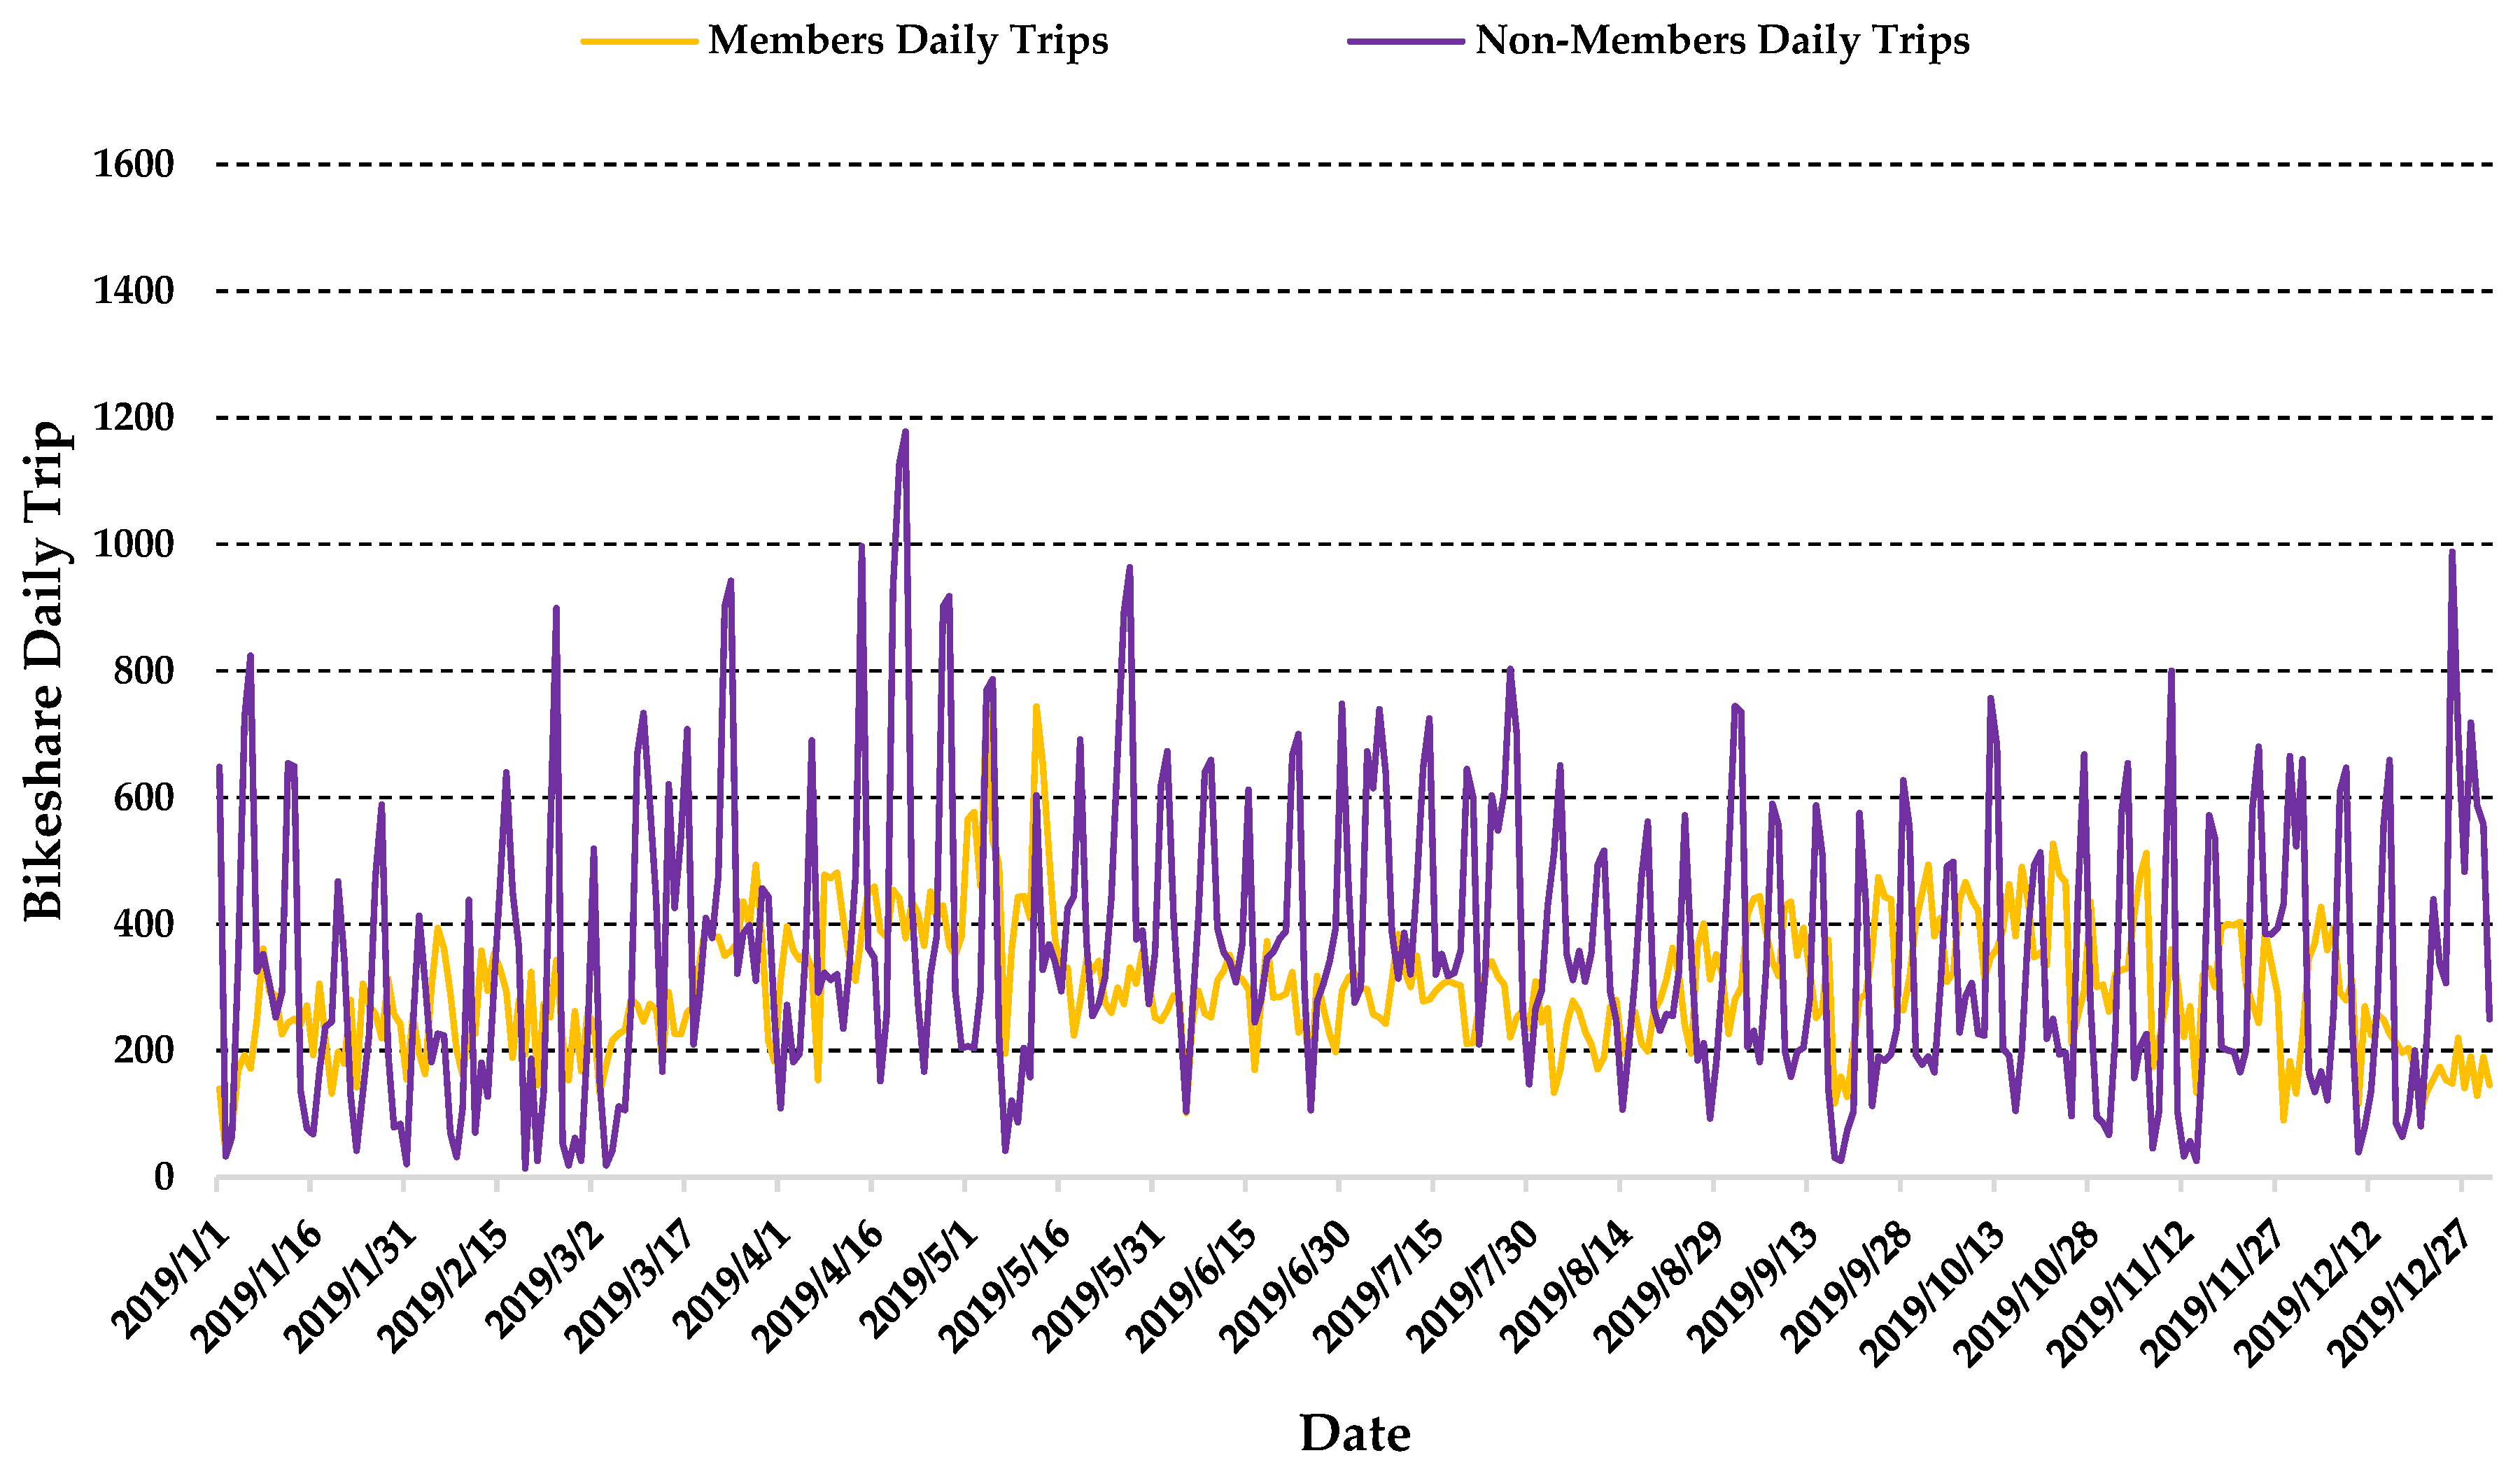
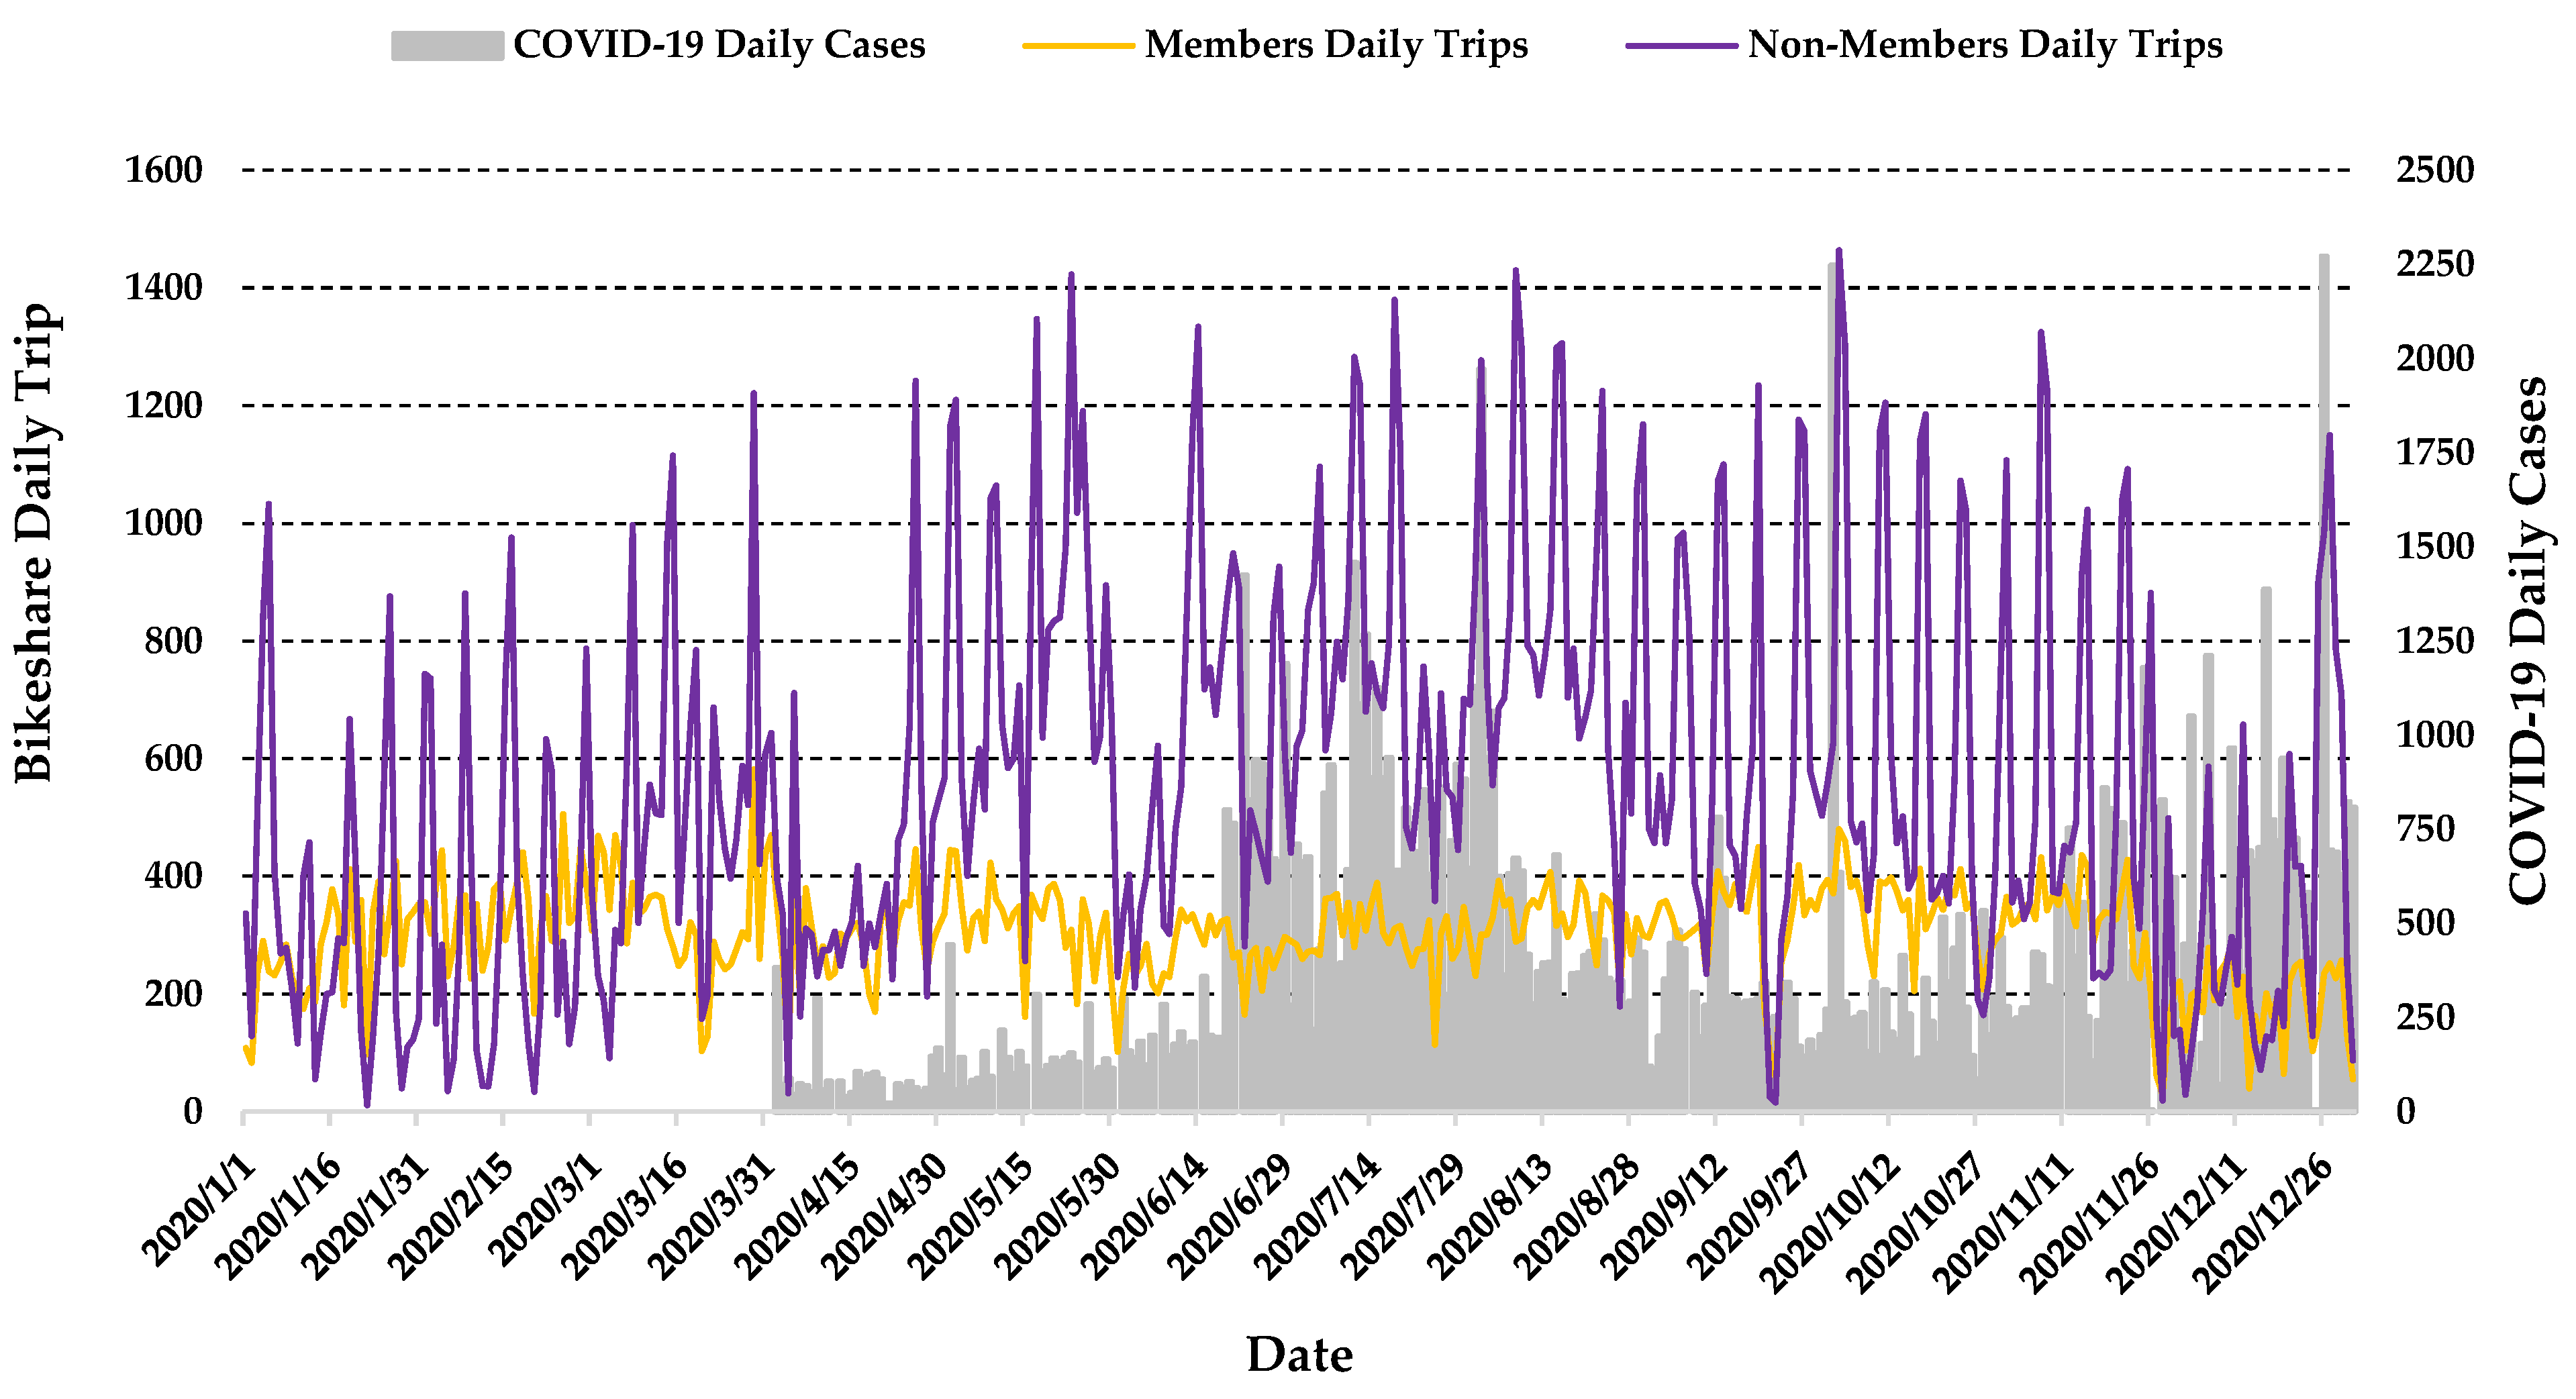
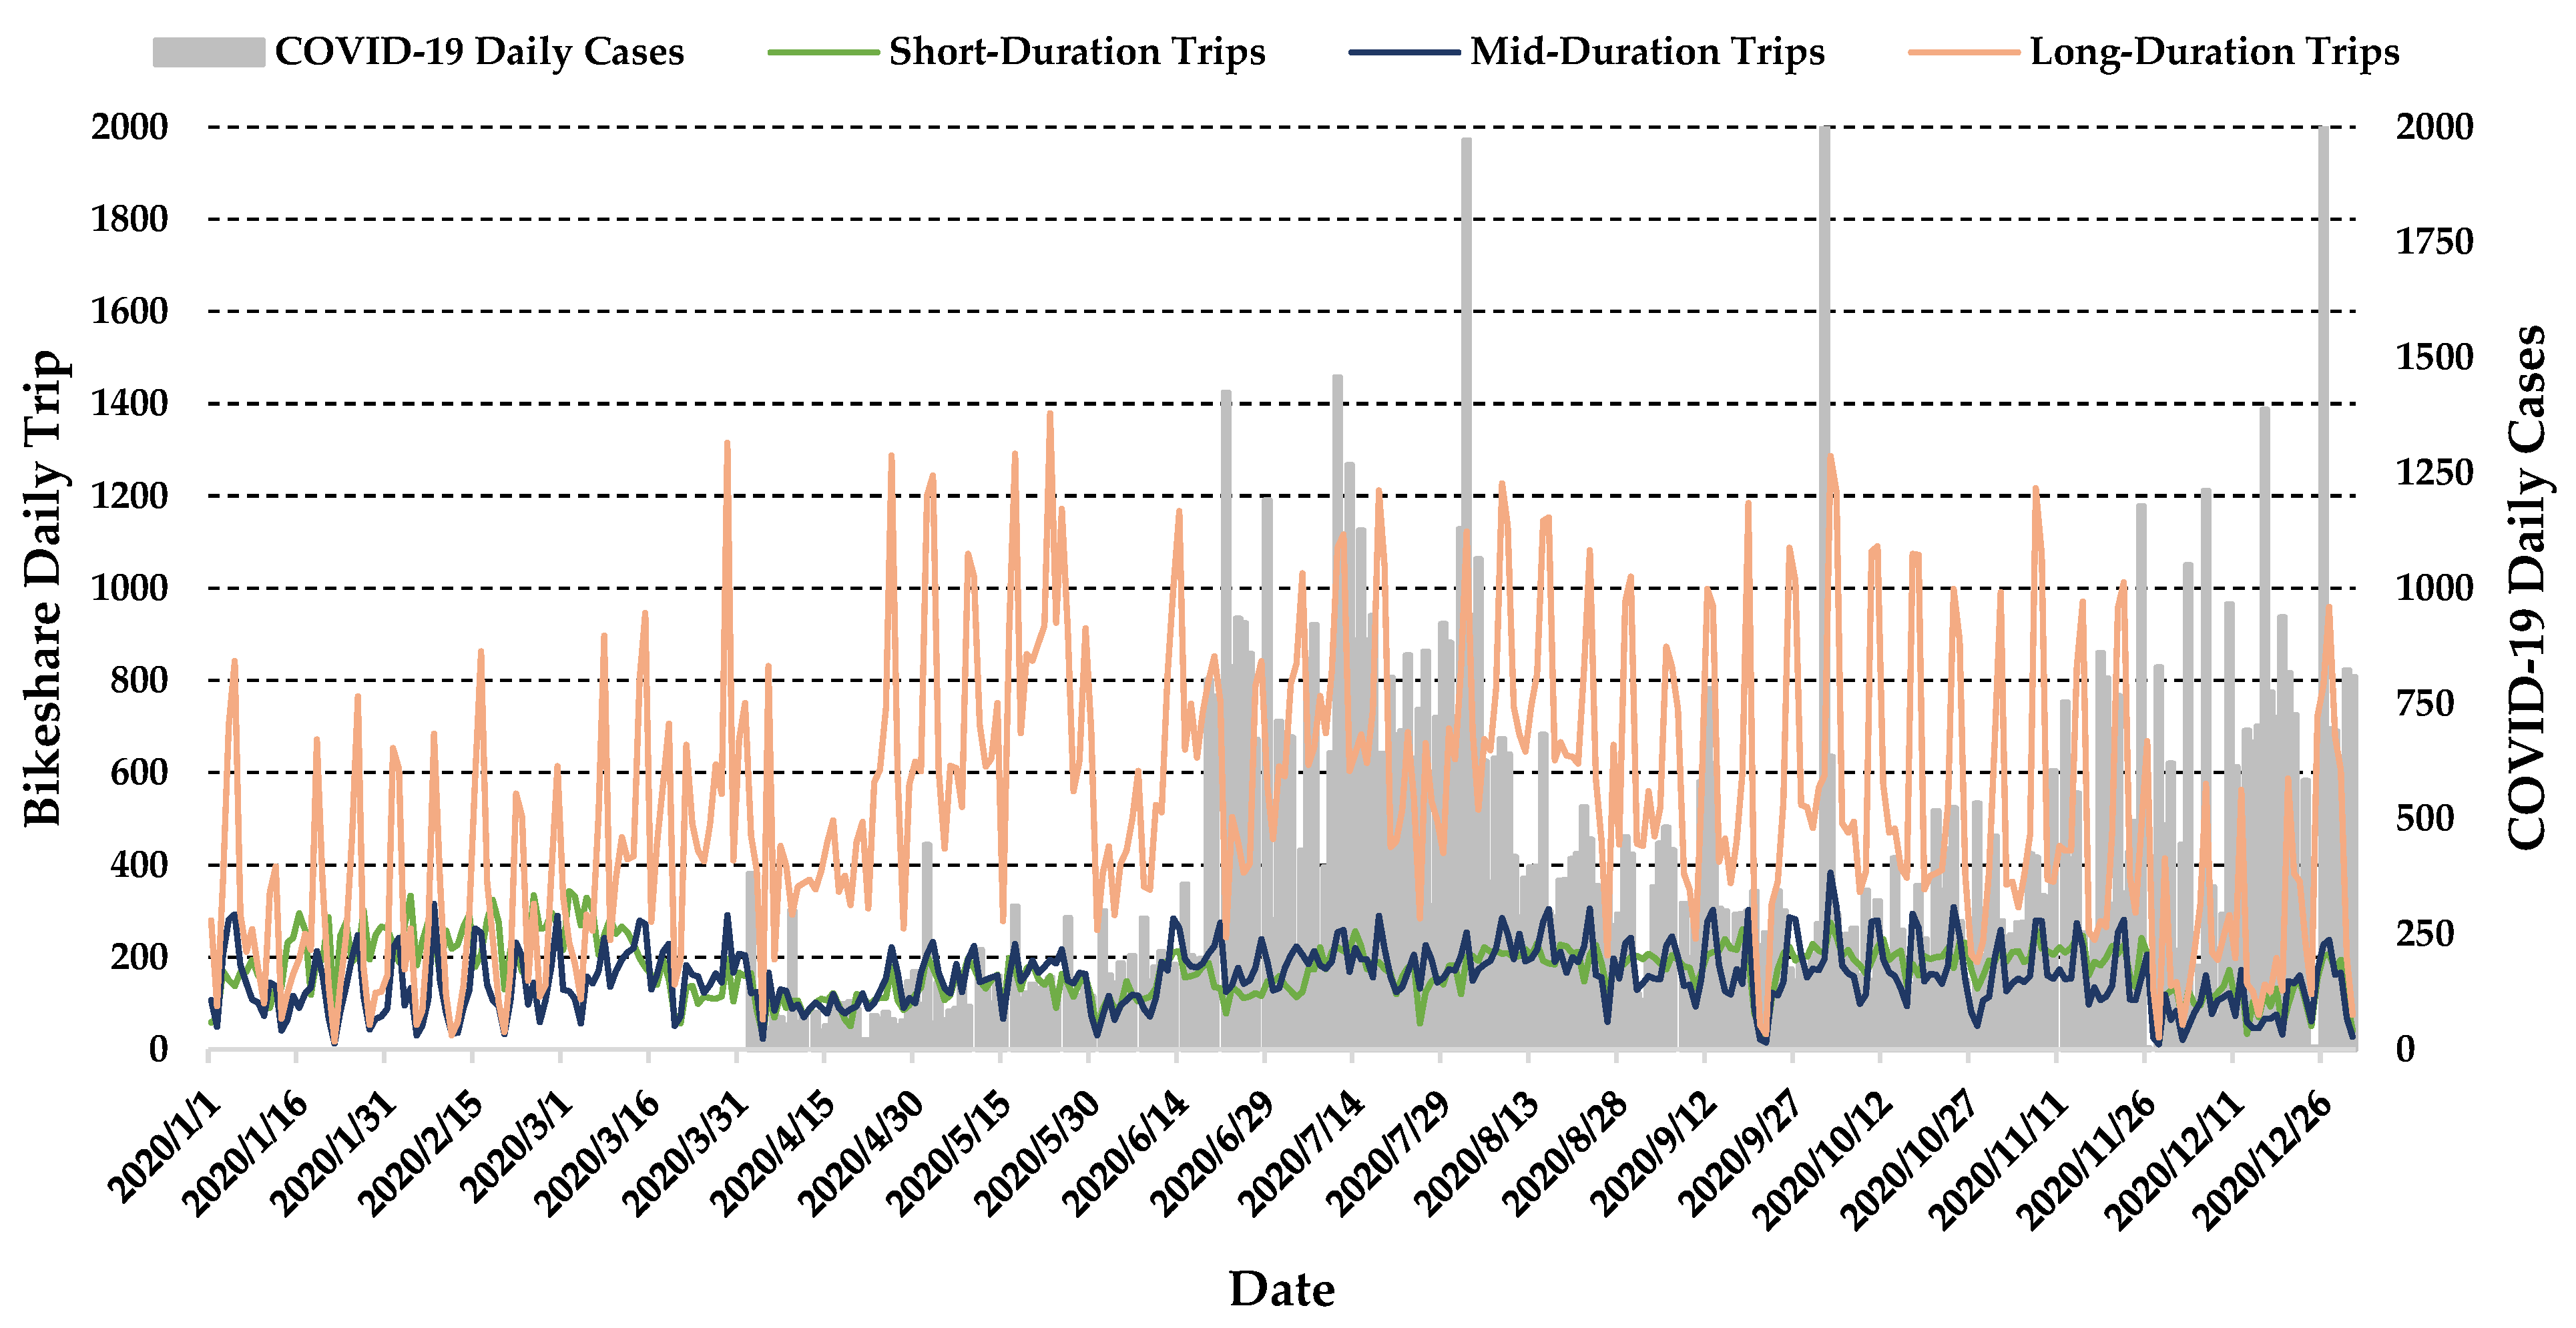
This study employed a Negative Binomial regression model to examine the effects of the COVID-19 pandemic on the average daily ridership of the Houston bikeshare. Unlike relying on samples, this analysis used real-world data encompassing the entire population of interest. In contrast to previous studies, we explored the nuanced intricacies of bikeshare dynamics during unprecedented events, such as a global health crisis. Leveraging the flexibility of the Negative Binomial model in handling count data, our study aimed to provide a more accurate and detailed understanding of the pandemic’s influence on bikeshare ridership. The study conducted two types of analyses: descriptive and regression analysis. The descriptive analysis compared bikeshare usage in two time periods: immediately before the COVID-19 outbreak and during the pandemic. This revealed a remarkable 30.6% increase in the total number of bike trips that were taken in Houston during 2020 compared to the previous year. The pandemic had significant impacts on trip duration and timing, with longer trips becoming more prevalent in 2020, and mid-duration trips being less frequent. The total trip durations also increased by 73.52% in 2020. Furthermore, the pandemic induced a shift in travel patterns, with more people choosing off-peak hours for their trips instead of morning and evening peak periods. While the number of member trips remained consistent throughout the pandemic, there was a noteworthy increase in non-member trips in 2020. Surprisingly, no correlation was observed between the number of bikeshare riders and temperature, but rainy days led to a significant decrease in bikeshare ridership.
The regression analysis yielded interesting results regarding the impact of different factors on the average daily ridership in Houston during the pandemic. It was found that a higher number of daily COVID-19-positive cases in the city was associated with an increase in the daily ridership. Additionally, weekends during the pandemic saw a noticeable rise in the average daily ridership. On the other hand, the temperature did not show any significant impact on the average daily trip counts in Houston. However, the presence of precipitation had a negative and significant effect on the average daily ridership, indicating that rainy days were associated with a reduced ridership. Overall, the study’s findings suggest that the Houston bikeshare program has effectively promoted sustainable transportation options in the city, even in the face of pandemic challenges. The analysis underscores the importance of flexibility in responding to changing ridership patterns that are caused by external factors, emphasizing the program’s adaptability to evolving circumstances.
In conclusion, this study has shed some light on the changes in shared micromobility patterns. While our primary focus remains on bike sharing, we acknowledge the interconnected nature of sustainable mobility modes. The pandemic has underscored the importance of pedestrian and cycle mobility in urban landscapes. Lessons learned from the observed shifts in individual sustainable mobility behaviors during the pandemic highlight the resilience and adaptability of shared micromobility, including bike sharing. As cities continue to navigate the evolving landscape of mobility, these insights can inform strategies to enhance the integration of sustainable modes into urban transportation frameworks.
The impact of the COVID-19 pandemic on bike sharing systems is essential to understand for both researchers and policy makers. Researchers can study how disruptive events affect urban mobility, while policy makers can use this information to prepare cities for future similar events and ensure their resilience. The findings of this study can also offer valuable guidance for city authorities and bikeshare operators to create or adapt plans that cater to people’s transportation needs in the event of any disruptions caused by unforeseeable circumstances such as the COVID-19 pandemic, other pandemics, or natural disasters in the future.


