Article

Acceptance of Automated Shuttles—Application and Extension of the UTAUT-2 Model to Wizard-of-Oz Automated Driving in Real-Life Traffic

1
Institute of Transportation Systems, German Aerospace Center, 38108 Braunschweig, Germany
2
Department of Psychology, Humboldt University of Berlin, 10117 Berlin, Germany
3
Department of Psychology and Ergonomics, Technische Universität Berlin, 10623 Berlin, Germany
*
Author to whom correspondence should be addressed.
Future Transp. 2022, 2(4), 1010-1027; https://doi.org/10.3390/futuretransp2040056
Submission received: 27 October 2022 / Revised: 16 November 2022 / Accepted: 28 November 2022 / Published: 5 December 2022

Abstract

:
Automated shuttles can make public transport more attractive and sustainable. Still, their successful implementation requires a high level of acceptance among users. This study investigates the impact of the predictors performance expectancy, social influence, facilitating conditions, hedonic motivation, and perceived risk of The Unified Theory of Acceptance (UTAUT)-2 on the behavioral intention to use automated shuttles. In earlier work, UTAUT-2 has already been successfully applied to study the acceptance of autonomous public transport. Here, we employed the UTAUT-2 to assess acceptance of a Wizard-of-Oz automated shuttle in real-life traffic, in a study with 35 participants, before and after a first ride and after a second ride on which two incidents occurred. The results show that behavioral intention to use automated shuttles is high even before the first ride and remains high after experiencing automated driving. Performance expectancy was the only significant predictor of behavioral intention for all measurement time points. The explanatory power of the model almost doubles from pre-ride to post-ride. The results indicate a crucial role of performance expectancy for the acceptance of automated shuttles at the current stage of implementation and provide guidance for a successful development and implementation of autonomous public transport.

1. Introduction

Automated shuttles have the potential to make public transportation more attractive. They are part of a future autonomous mobility concept that does not require a driver and enables low-cost transportation at any time [1,2]. Automated shuttles can be booked on demand, shared with multiple passengers, and can form the first and last part in a travel chain using public transport [2]. In addition, automated transport can substantially improve road safety. According to the German Federal Statistical Office, human error was the most common cause of accidents with personal injury in 2020, accounting for 88.5% of all accidents [3]. Accordingly, traffic can become safer through autonomous mobility concepts. Especially in large cities, the number of private cars can be reduced and traffic can get more sustainable [1]. In order to successfully implement automated shuttles a high level of user acceptance must be attained [1,4].
In psychological and sociological research, various theoretical models have been developed to explain the acceptance of a technology. Acceptance of technological systems is defined as the users’ willingness to use a technology in the areas where the technology is intended to support the users [5,6]. Accordingly, acceptance represents the intention to use a new technology. A common model based on this definition of acceptance is the Technology Acceptance Model (TAM) by Davis [7]. It postulates that perceived usefulness and perceived ease of use are the main factors in the formation of behavioral intention and thus usage behavior. It is characterized by clarity, parsimony, and replicability [8]. For an integrated perspective on technology acceptance, Venkatesh and colleagues [5] designed the Unified Theory of Acceptance (UTAUT), which was developed by reviewing and consolidating the constructs of TAM and seven other different acceptance models. Therefore, UTAUT unifies the strengths of previous models and eliminates the need to select from different acceptance models. It originates from information technology research and predicts behavioral intention (BI) towards a new technology using three predictors: The first predictor is performance expectancy (PE) which is the expected support from the technology. The second predictor is effort expectancy (EE) which is the expected ease or difficulty of using the technology. Social influence (SI) is the third predictor and displays society’s presumed attitude toward the technology. Actual usage, in turn, is predicted by behavioral intention as well as facilitating conditions (FC), such as an existing infrastructure to support the technology. Moderators are gender, age, experience, and voluntariness of use. An extension of UTAUT to UTAUT-2 additionally considers the constructs of hedonic motivation, price value, and habit to apply the model to the consumption context [9]. Hedonic motivation describes the enjoyment or pleasure derived from using a technology. Habit is the extent to which people perform behaviors automatically based on experience.
UTAUT and UTAUT-2 have been successfully applied in the context of autonomous public transportation in earlier studies. UTAUT-2 was used in an interview study by Nordhoff et al. [10] with 9118 participants to explain behavioral intention to use conditional automated cars at SAE level 3 [11]. In this study, the model explained 88% of the variance in behavioral intention. Initial studies of public autonomous transportation at high automation SAE level 4 [11] using the slow-moving automated CityMobil2 indicate that UTAUT is a good framework for studying acceptance in this scope [12,13]. In the first study 22% of the variance of behavioral intention were explained by the predictors performance expectancy, effort expectancy, and social influence [12]. In the second study UTAUT-2, which additionally included the predictors of facilitating conditions and hedonic motivation, the predictors explained 58% of the variance of behavioral intention [13]. Most recent studies, which also used UTAUT to examine the acceptance of slow autonomous shuttle services at SAE level 4, were able to explain 40% [14] and 46% [15] of the variance in behavioral intention. In these applications of the model, either performance expectancy [12,14,15] or hedonic motivation [10,13] were the strongest predictors of behavioral intention. The influence of the moderators gender, age, and experience could not be replicated in any of the studies that applied UTAUT(-2) to real automated vehicles [10,12,13,15]. To add, effort expectancy did not influence behavioral intention in most studies [10,13,14]. Therefore, it can be concluded that effort expectancy is not a relevant factor in the decision to use autonomous public transportation and can therefore be excluded in future studies (see also [13]).
In addition to the predictors covered by UTAUT, perceived risk (PR) towards an automated vehicle can influence the acceptance of the automated vehicle. Perceived risk is a person’s perceived uncertainty about the consequences of a decision [16], and can be divided into temporal, financial, functional, physical, psychological, and social risk [17]. According to Rogers et al. [18], perception of a technology or innovation can influence acceptance. This idea has been applied several times to the acceptance of automated vehicles. A meta-analytic review provides an overview of studies from Europe, Asia, and America [19]. The authors extended the Technology Acceptance Model (TAM) by Davis [7] to predict behavioral intention to use automated vehicles by adding the predictors trust and perceived risk. The results show that perceived risk within TAM has a negative influence on the behavioral intention to use fully automated vehicles. Perceived risk was also examined in the context of autonomous public transportation [20]. The authors used UTAUT in a questionnaire study to examine behavioral intention to use autonomous buses and added the predictors of personal innovativeness and perceived risk to the model. They found perceived risk to be the strongest predictor of behavioral intention, ahead of all UTAUT predictors. The postulated model explained a total of 48% of the variance in behavioral intention [20].
A further factor that potentially influences acceptance of automated vehicles is experience of using these. It has already been shown in various fields of transportation that the acceptance of a technology or innovation increases after it has been used. Regarding automated vehicles, this relationship has been considered earlier. A study of advanced driver assistance systems (ADAS) in a driving simulator showed that there was a higher behavioral intention in the group that could try the ADAS in the simulator than in the group that could only read a description of it [21]. In a real-life traffic driving study by Pascale et al. [22], acceptance of an automated car at SAE level 3 was found to increase after driving on an open road compared to the acceptance before driving.
Finally, the information provided to users about automated vehicles influence the acceptance of automated vehicles. A systematic review of public autonomous transportation acceptance shows that information regarding the ride and the autonomous vehicle is a factor that affects acceptance [23]. Fröhlich et al. [24] found that the most important type of information in autonomous public vehicles is information related to the reasons or decision-making process underlying the vehicle’s actions, and also important is information comparable to that in a conventional bus. This might include current speed, next stop, remaining travel time, and congestion on the route. At best, this information should be shown on a display in the user’s field of vision. Especially in unpredictable situations, information presented on a display can be helpful [25]. The authors found that any fears that may arise while riding in an autonomous shuttle bus can be divided into three categories: fears related to fellow passengers, fears related to a lack of transparency of the system, and fears related to technical malfunctions. Fears related to a lack of transparency of the system include, for example, the shuttle bus stopping unexpectedly or traveling an unknown route. The study shows that in these situations, a display that provides information about driving conditions can increase the feeling of safety, which is tightly related to the acceptance of automated vehicles.
Based on the aforementioned considerations, the goal of this study is to investigate the acceptance of and intention to use automated shuttles within a future public mobility concept. In this first study in real-life traffic, a travel chain with a Wizard-of-Oz automated shuttle at highly automated SAE level 4 [11] was conducted and acceptance was assessed at three measurement time points (T1, T2, T3). T1 was before the ride with the automated shuttle, T2 after the first ride, and T3 after the second ride in which two planned incidents occurred.
For investigating acceptance of automated shuttles, an extended UTAUT-2 model was used (see Figure 1). Based on Venkatesh et al. [9], it contains the predictors performance expectancy, social influence, facilitating conditions, and hedonic motivation to predict the behavioral intention to use automated shuttles. Here, the predictor effort expectancy is excluded based on the recommendation of Madigan et al. [13]. The predictors value-for-money and habit are also not examined, because the vehicle was free of charge and could only be used once in our study. Based on the results by Chen et al. [20], we added perceived risk as further predictor to the UTAUT-2. We did not examine the influence of the moderators gender, age, and experience because it could not be replicated in previous studies [10,12,13,15].
UTAUT and UTAUT-2 have only been applied to vehicles at SAE level 3 [10] or slow vehicles at SAE level 4 [13,14]. In this work, UTAUT-2 is applied for the first time to a Wizard-of-Oz automated shuttle traveling at normal speed in real-life traffic. Based on the successful applications of UTAUT(-2) in previous studies and to evaluate the postulated UTAUT-2 model, the following hypothesis is proposed:
H1: 
The predictors of UTAUT-2 predict a high proportion of variance in behavioral intention to use automated shuttles at all measurement time points (T1, T2, T3).
An additional predictor added to UTAUT-2 is perceived risk, which explained the largest proportion of variance in the behavioral intention to use autonomous shuttle buses in the study by Chen et al. [20]. While the authors investigated this in a questionnaire study, the present work integrates perceived risk into UTAUT-2 for the first time in a real-world driving study. Especially regarding the occurring incidents in the second ride, it is relevant to investigate the factor perceived risk as a possible influencing factor on behavioral intention. The following hypothesis is postulated:
H2: 
The explanatory power of UTAUT-2 increases after adding the predictor perceived risk at all measurement time points (T1, T2, T3).
Moreover, we examine the evolution of automated shuttle acceptance from pre-ride to post-ride in a real-world driving study. In research on the acceptance of autonomous public vehicles, the investigation using real-drive studies has just begun. Therefore, it is even more important to replicate existing findings and investigate them in different contexts. How acceptance of automated shuttles changes from before first use to after first use may be relevant to successfully implement autonomous public mobility concepts and can be used by researchers, developers, and policymakers in development and implementation. Based on the results of past research, the following hypothesis is proposed:
H3: 
Behavioral intention to use automated shuttles increases from pre-ride of the automated shuttle (T1) to post-ride (T2).
Building on existing findings, the influence of providing information in unpredictable situations on the acceptance of automated shuttles is investigated. To enable a successful implementation of autonomous public mobility concepts, they must be designed as user-friendly as possible. This includes especially the presentation of information that shows users the reasons for the behavior of automated shuttles [24]. Especially in unpredictable situations, such information can be helpful [25]. Hence, the influence of information on the acceptance of autonomous public vehicles is investigated here for the first time when unpredictable situations occur in a real-world driving study. The following hypothesis is postulated:
H4: 
The behavioral intention of using automated shuttles is higher in the group with information than in the group without information after the second ride with incidents (T3).
Investigating the acceptance of autonomous public mobility concepts is a prerequisite for their successful implementation. Therefore, we conducted a study with a Wizard-of-Oz automated shuttle in real traffic, investigating acceptance at three time points using UTAUT-2 and mapping both the change in acceptance pre- and post-ride and, for the first time, investigating acceptance in unpredictable situations.

2. Materials and Methods

2.1. Design

A real driving study with a Wizard-of-Oz automated vehicle was conducted. The constructs of UTAUT-2 were collected within-subjects at three measurement time points: after reading an information text about the automated shuttle (T1); after the first ride with the automated shuttle (T2); and after the second ride with two planned incidents (T3). The two planned incidents during the second trip were varied between-subjects by information about the incidents in one group of participants and no information in the other group. Participants were randomly assigned to the two conditions. The duration of the experiment was two hours.

2.2. Sample

A total of N = 40 participants took part in the study. Five participants were excluded from further analyses. Four of them indicated in a control question that they could not immerse themselves in the situation that the shuttle drove autonomously. Another participant answered all questions with the maximum value at all measurement time points. The exclusion results in a sample size of N = 35, which belonged to two groups (with information n = 17, without information n = 18) at the third measurement time point. The 35 participants (10 females, 25 males) had a mean age of 34.34 years (min = 21, max = 58, SD = 11.82). Of the participants, 80% were rather strongly or very strongly interested in automated cars and 20% of the participants were neutral towards automated cars. Participants of any gender, between 18 and 60 years old, were included in the study. All participants agreed to participate in the experiment and were compensated with EUR 5 (€) for each commenced half hour.

2.3. Measures

All participants completed the scales of UTAUT-2 [9], adapted by Madigan et al. [13] for application to autonomous public shuttles. These include the scales of performance expectancy, social influence, facilitating conditions, and hedonic motivation as independent variables and behavioral intention as dependent variable (see Table S1). As in Madigan et al. [13], the scales were queried using a five-point Likert scale. Since no German version of the UTAUT-2 existed, the items were translated from English into German and back into English by two bilingual native speakers. The two English versions were then compared in terms of their meaning. No significant differences were found. As an additional independent variable for UTAUT-2, perceived risk was measured using a scale assorted by Chen et al. [20] based on Zhang et al. [26] and Zmud et al. [27] (see Table 1). The scale was also queried using a five-point Likert scale.
Additionally, all participants answered questions about their information needs in the occurred incidents. For each incident, they rated the helpfulness of the display, their uncertainty, and their need for information on a five-point Likert scale (the results of this questionnaire are reported in a different paper that focuses on the participants’ information needs during the shuttle ride, see [28]).

2.4. Setup

The study was conducted with one of the institute’s research vehicles (a Volkswagen Passat). Since the vehicle was not capable to drive in Level 4 automation according to [11], a Wizard-of-Oz setting was used in the study. As the goal of the study was to investigate the acceptance of riding in an automated shuttle, the instruction prior to the ride informed the participants that the vehicle was automated and that the person behind the wheel was a safety driver. To conceal the fact that the safety driver was in fact driving the car, a partition was installed between the participant and the safety driver (see Figure 2). The rationale for the need of the partition for the participants was that it should physically separate the participant and the safety driver to enhance the feeling of being alone for the participant. In addition, the participants were shown a video before the journey in which they could see the car driving a part of the route fully autonomously. After the execution, the participants were informed that the car did not drive autonomously.
A display (Microsoft Surface Pro 7, 12.3’) was placed inside the car in the field of view of the participants, which always showed the start and destination of the ride, as well as the information that the car was driving automated. In addition, this display was used to show the information for the group with information in the incidents. Sociodemographic data were collected using a tablet (Samsung Galaxy Tab S7) and UTAUT-2 questionnaire data were collected using a smartphone (Google Pixel 4a) that the participants had with them throughout the trial.

2.5. Procedure

The study was embedded into a realistic urban scenario of a ride with an automated shuttle. The participants were asked to bring a real book to a public bookcase and then pick another book from the public bookcase. To do so, they should order an automated shuttle to bring them from the starting point to the bookcase and back to the starting point. The entire route of the study is shown in Figure 3. The distance of the walked route at the starting and end point was each approximately 0.5 km, and the distance of the walked route at the public bookcase was also approximately 0.5 km. The distances of each ride were approximately 7.5 km and the travel time was approximately 12 min for each ride. On the second ride two planned incidents occurred, which the participants were not informed about beforehand. The first planned incident during the second ride was the abrupt stop and one-minute standstill of the automated shuttle in a parking lot located along the route (see Figure 3). The second planned incident was driving a detour through a residential area (see Figure 3). During both events, the group with information received fictional information about the incidents (incident 1: “This is a planned stop to adjust the GPS signal”; incident 2: “A bus broke down on the planned route, so that the shuttle had to drive a detour”). For the group without information, no information was shown on the display in the shuttle. The UTAUT-2-questionnaire was assessed before the first ride (T1), after the first ride at the bookcase (T2) and after the second ride with the incidents (T3). Additionally, the information needs questionnaire was assessed at T3. At the end, all participants were informed about the study objectives.
All participants provided written informed consent to take part. Handling of personal data was EU-GDPR-compliant [29] and the study’s hygiene concept was in accordance with the applicable rules to minimize the spread of COVID-19 by the time of study conduction.
Figure 3. Map of the route. Total route of the study. The first ride to the public bookcase is marked in light green, the second ride in dark green. The dashed lines represent distances walked and the solid lines represent distances traveled in the shuttle. The starting and end point, the public bookcase, and the incidents which occurred on the second ride are marked. © OpenStreetMap contributors [30].
Futuretransp 02 00056 g003

2.6. Statistical Analysis

A reliability analysis of all used scales was calculated using Cronbach’s alpha or Spearman–Brown coefficient (only for the scales with only two items). To test the explanatory power of UTAUT-2, a multiple linear regression (MLR) was calculated for the three measurement time points each. In a second step the predictor perceived risk was added hierarchically to test its influence on the explanatory power of the model. To see whether behavioral intention to use automated shuttles increases after using them compared to before first usage, a paired t-test was calculated. For testing whether there is a difference between the two experimental groups (with and without information) in behavioral intention to use automated shuttles at T3, a Mann–Whitney U test was calculated. When assumptions of the methods were violated, robust statistical methods were used to validate the original statistical method. In case of the MLR, a robust regression was additionally calculated for T1 and T2 using the lmrob() function in R [31,32]. The results of a robust regression are preferred to those of an MLR when preconditions of the MLR are violated and the results of the MLR and robust regression differ [33]. In case of the paired t-test, a pooled nonparametric bootstrap t-test according to Dwivedi et al. [34] was calculated. The authors suggest the use of the test to validate the results of a t-test in the presence of small sample sizes as well as assumption violations. All significance tests were two-sided with a significance level of α = 0.05. For statistical analysis, the program IBM SPSS Statistics version 27 [35] and the program R version 4.1.1 [36] were used. The R packages robustbase [37] and ggstatsplot [38] were used for the central calculations in R.

3. Results

3.1. Reliability

The Cronbach’s alpha or Spearman–Brown coefficients of all scales increased with each measurement time point (see Table 2). Most values were in an acceptable to very good range according to Kline [39].
Based on the analysis of selectivity, item BI1 was excluded from the behavioral intention scale and items PR1 and PR3 from the perceived risk scale (see Table S1). BI1 had a value of selectivity below 0.5 and two items in the perceived risk scale had values below 0.3 at all three measurement time points [40]. After exclusion of these items, the Cronbach’s alpha values (Table 2, bold) increased compared to the original values (in brackets). The exclusion of the items could not only be justified based on the results of the reliability analysis but also in terms of content (see Table S1). In addition, the facilitating conditions and perceived risk scales had unacceptable Cronbach’s alpha and Spearman–Brown values, respectively, at T1. This also makes sense based on theoretical considerations, as individuals may not yet be able to assess whether they have the necessary knowledge to use automated shuttles prior to use. The same is true for the assessment of risk. Therefore, facilitating conditions and perceived risk were excluded from data analysis for T1.

3.2. Results Regarding UTAUT-2 (H1 and H2)

The results of the MLR at all three measurement time points are presented below (see Table 3). At all measurement time points, performance expectancy alone significantly predicted behavioral intention to use automated shuttles. Moreover, at all three measurement time points, the model had a high variance explanation [41]. At T1, the coefficient of determination R2 = 0.347 (R2adj = 0.284) was significant with F(3, 31) = 5.49, p = 0.004, and it hardly differs from the robust results which were calculated due to assumption violations (Rob. R2 = 0.332, Rob. R2adj = 0.268). At T2, the coefficient of determination R2 = 0.632 (R2adj = 0.583) was significant with F(4, 30) = 12.88, p < 0.001, but differed from the robust results which were calculated due to assumption violations (Rob. R2 = 0.590, Rob. R2adj = 0.535). Because the robust results should be preferred in case of different results of the MLR and the robust MLR, at T2 only the robust results are referred to [33]. At T3, the coefficient of determination R2 = 0.657 (R2adj = 0.612) was significant with F(4, 30) = 14.39, p < 0.001, and no robust regression was calculated as all assumptions were met. Accordingly, Hypothesis 1, that the predictors predict a high proportion of variance of the behavioral intention to use automated shuttles, is supported by the results for all three measurement time points. However, the variance explanation here is particularly due to the predictor performance expectancy, as this is the only significant predictor.
Hypothesis 2 could only be tested for T2 and T3 due to insufficient reliability of the perceived risk scale at T1. At both T2 and T3, perceived risk was added in the second step of the hierarchical MLR (see Table 3). The model with perceived risk did not explain more variance in behavioral intention at T2 (ΔR2 = 0.001, p = 0.789) and at T3 (ΔR2 = 0.014, p = 0.268). Thus, hypothesis 2, that the explanatory power of the model increases after adding the predictor perceived risk, is rejected for T2 and T3.

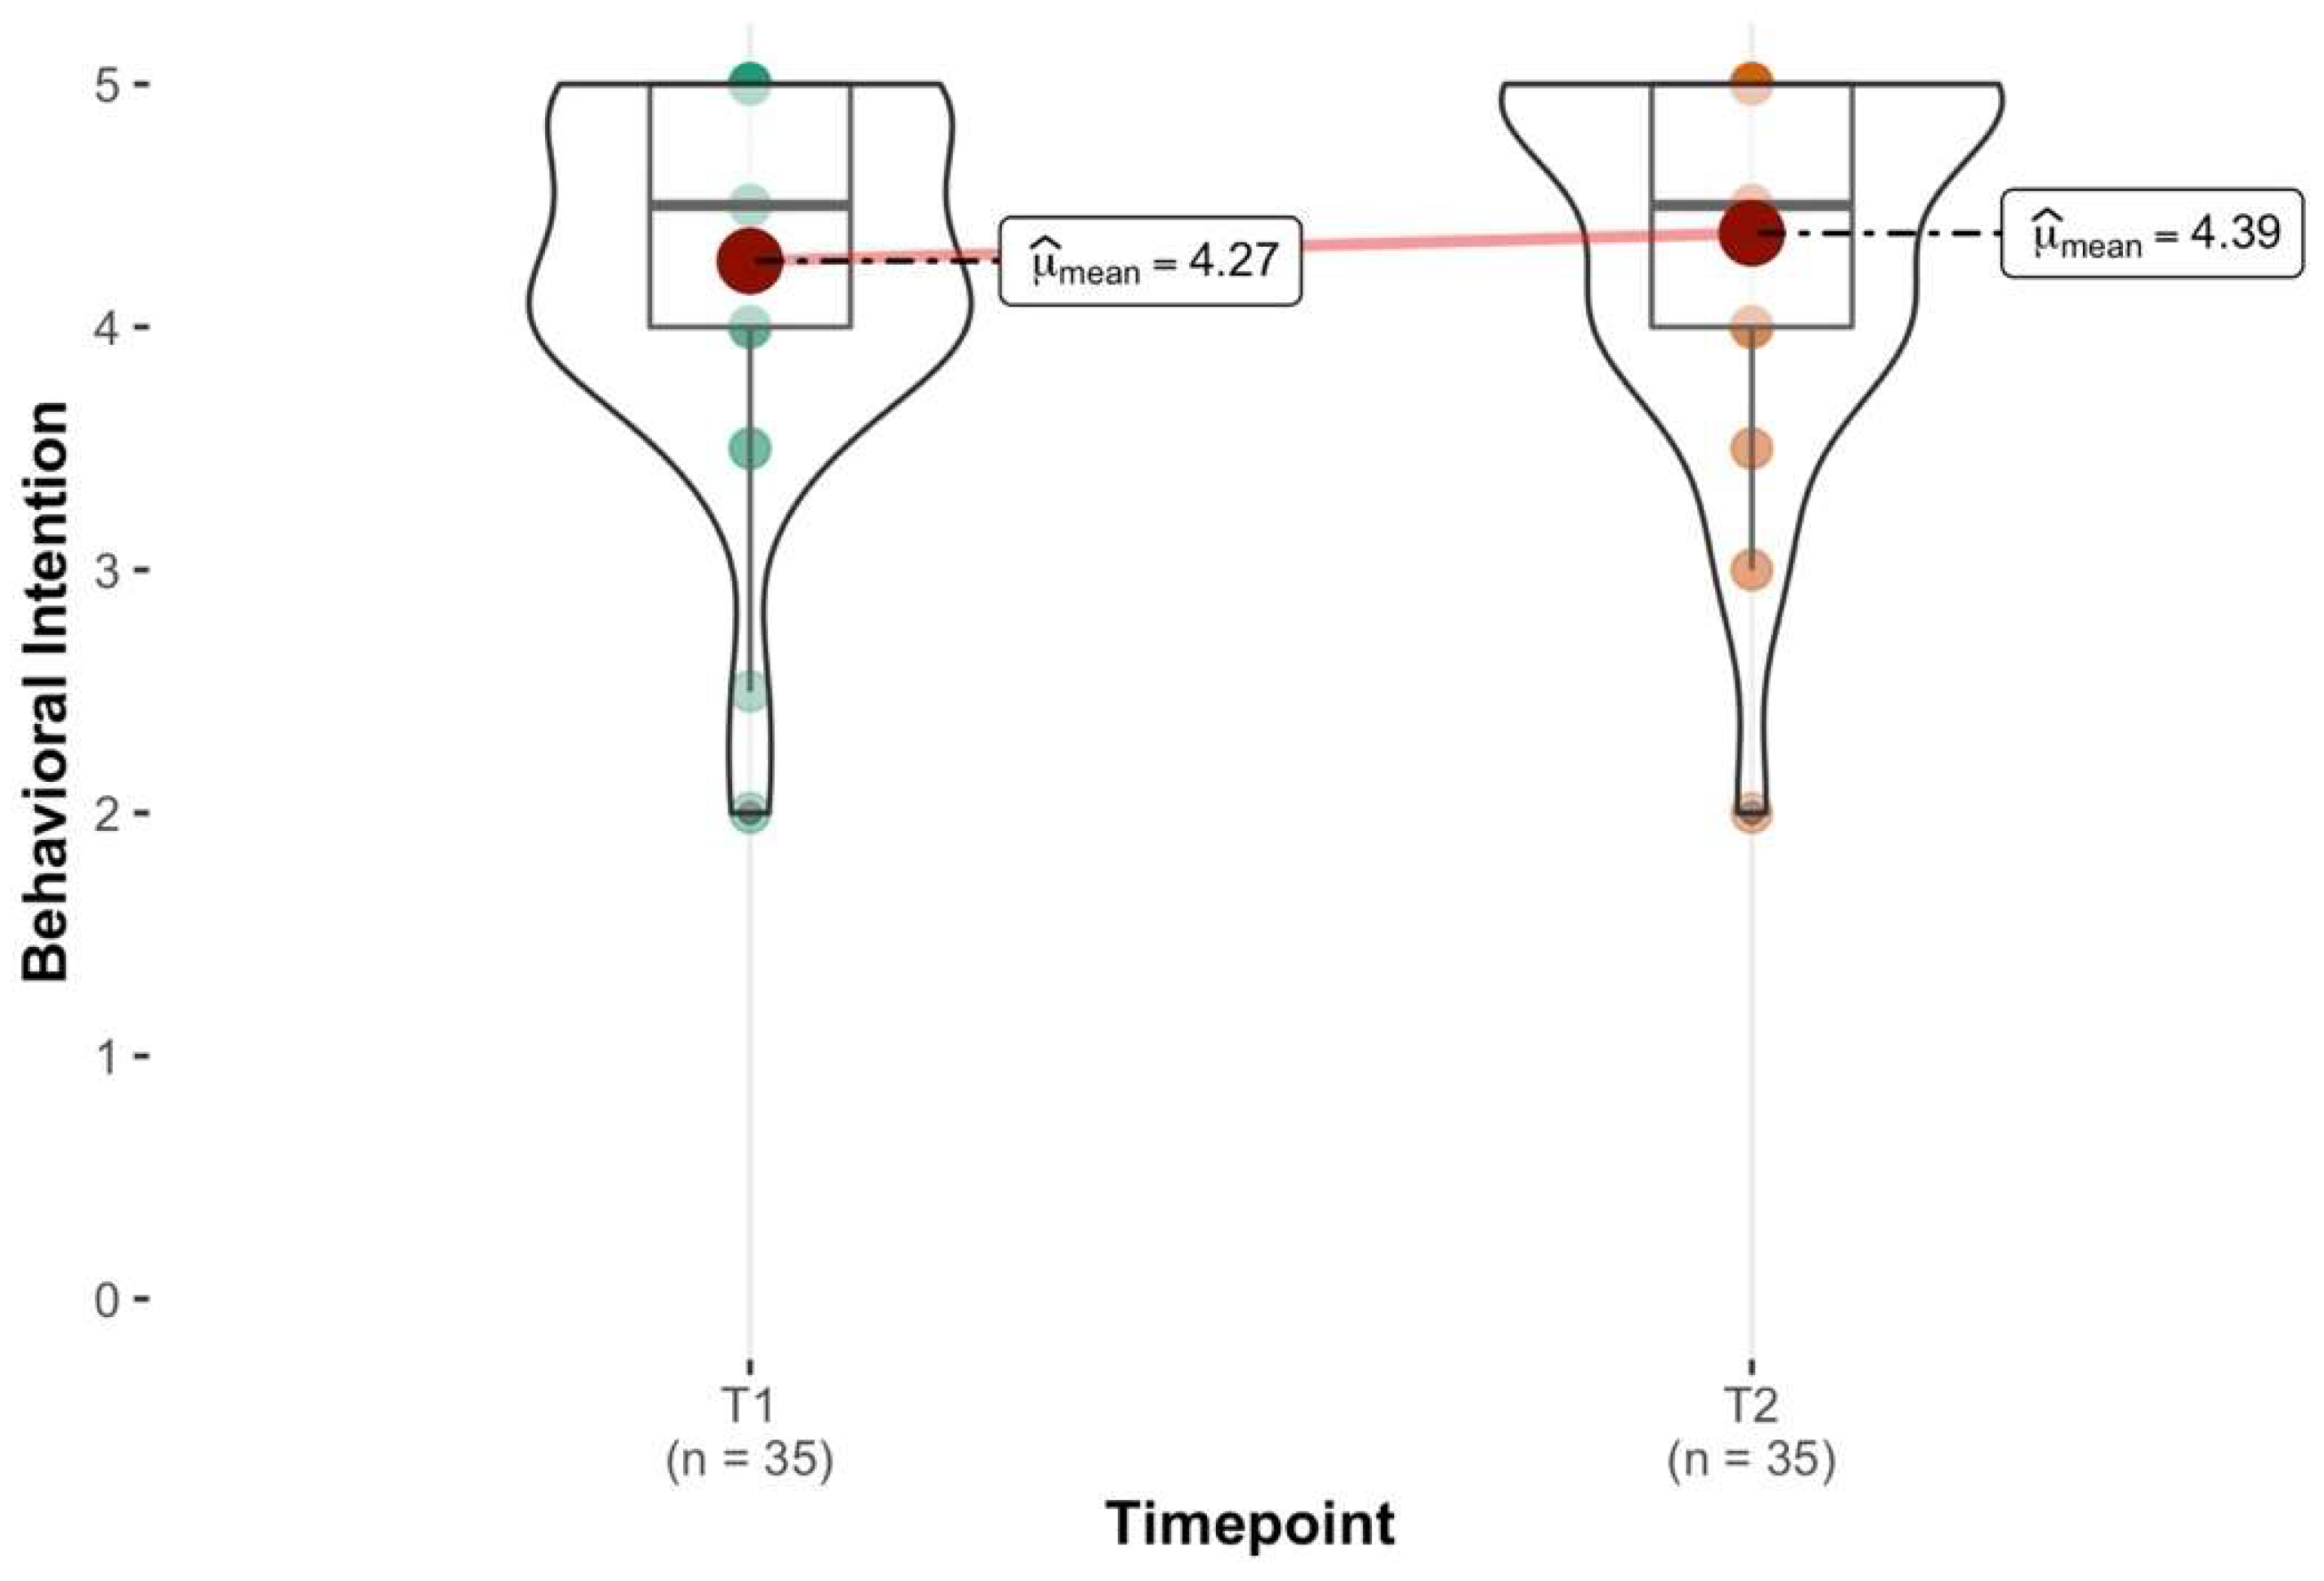
3.3. Change in Behavioral Intention from Pre-Ride to Post-Ride (H3)

The results of the paired t-test indicate that the behavioral intention to use automated shuttles increased from pre-ride to post-ride (see Figure 4). However, this increase was not significant, t(34) = −1.28, p = 0.211, d = 0.22. The bootstrap t-test supported the results of the paired t-test with a p-value of p = 0.209. Hence, hypothesis 3 is not supported by these results.

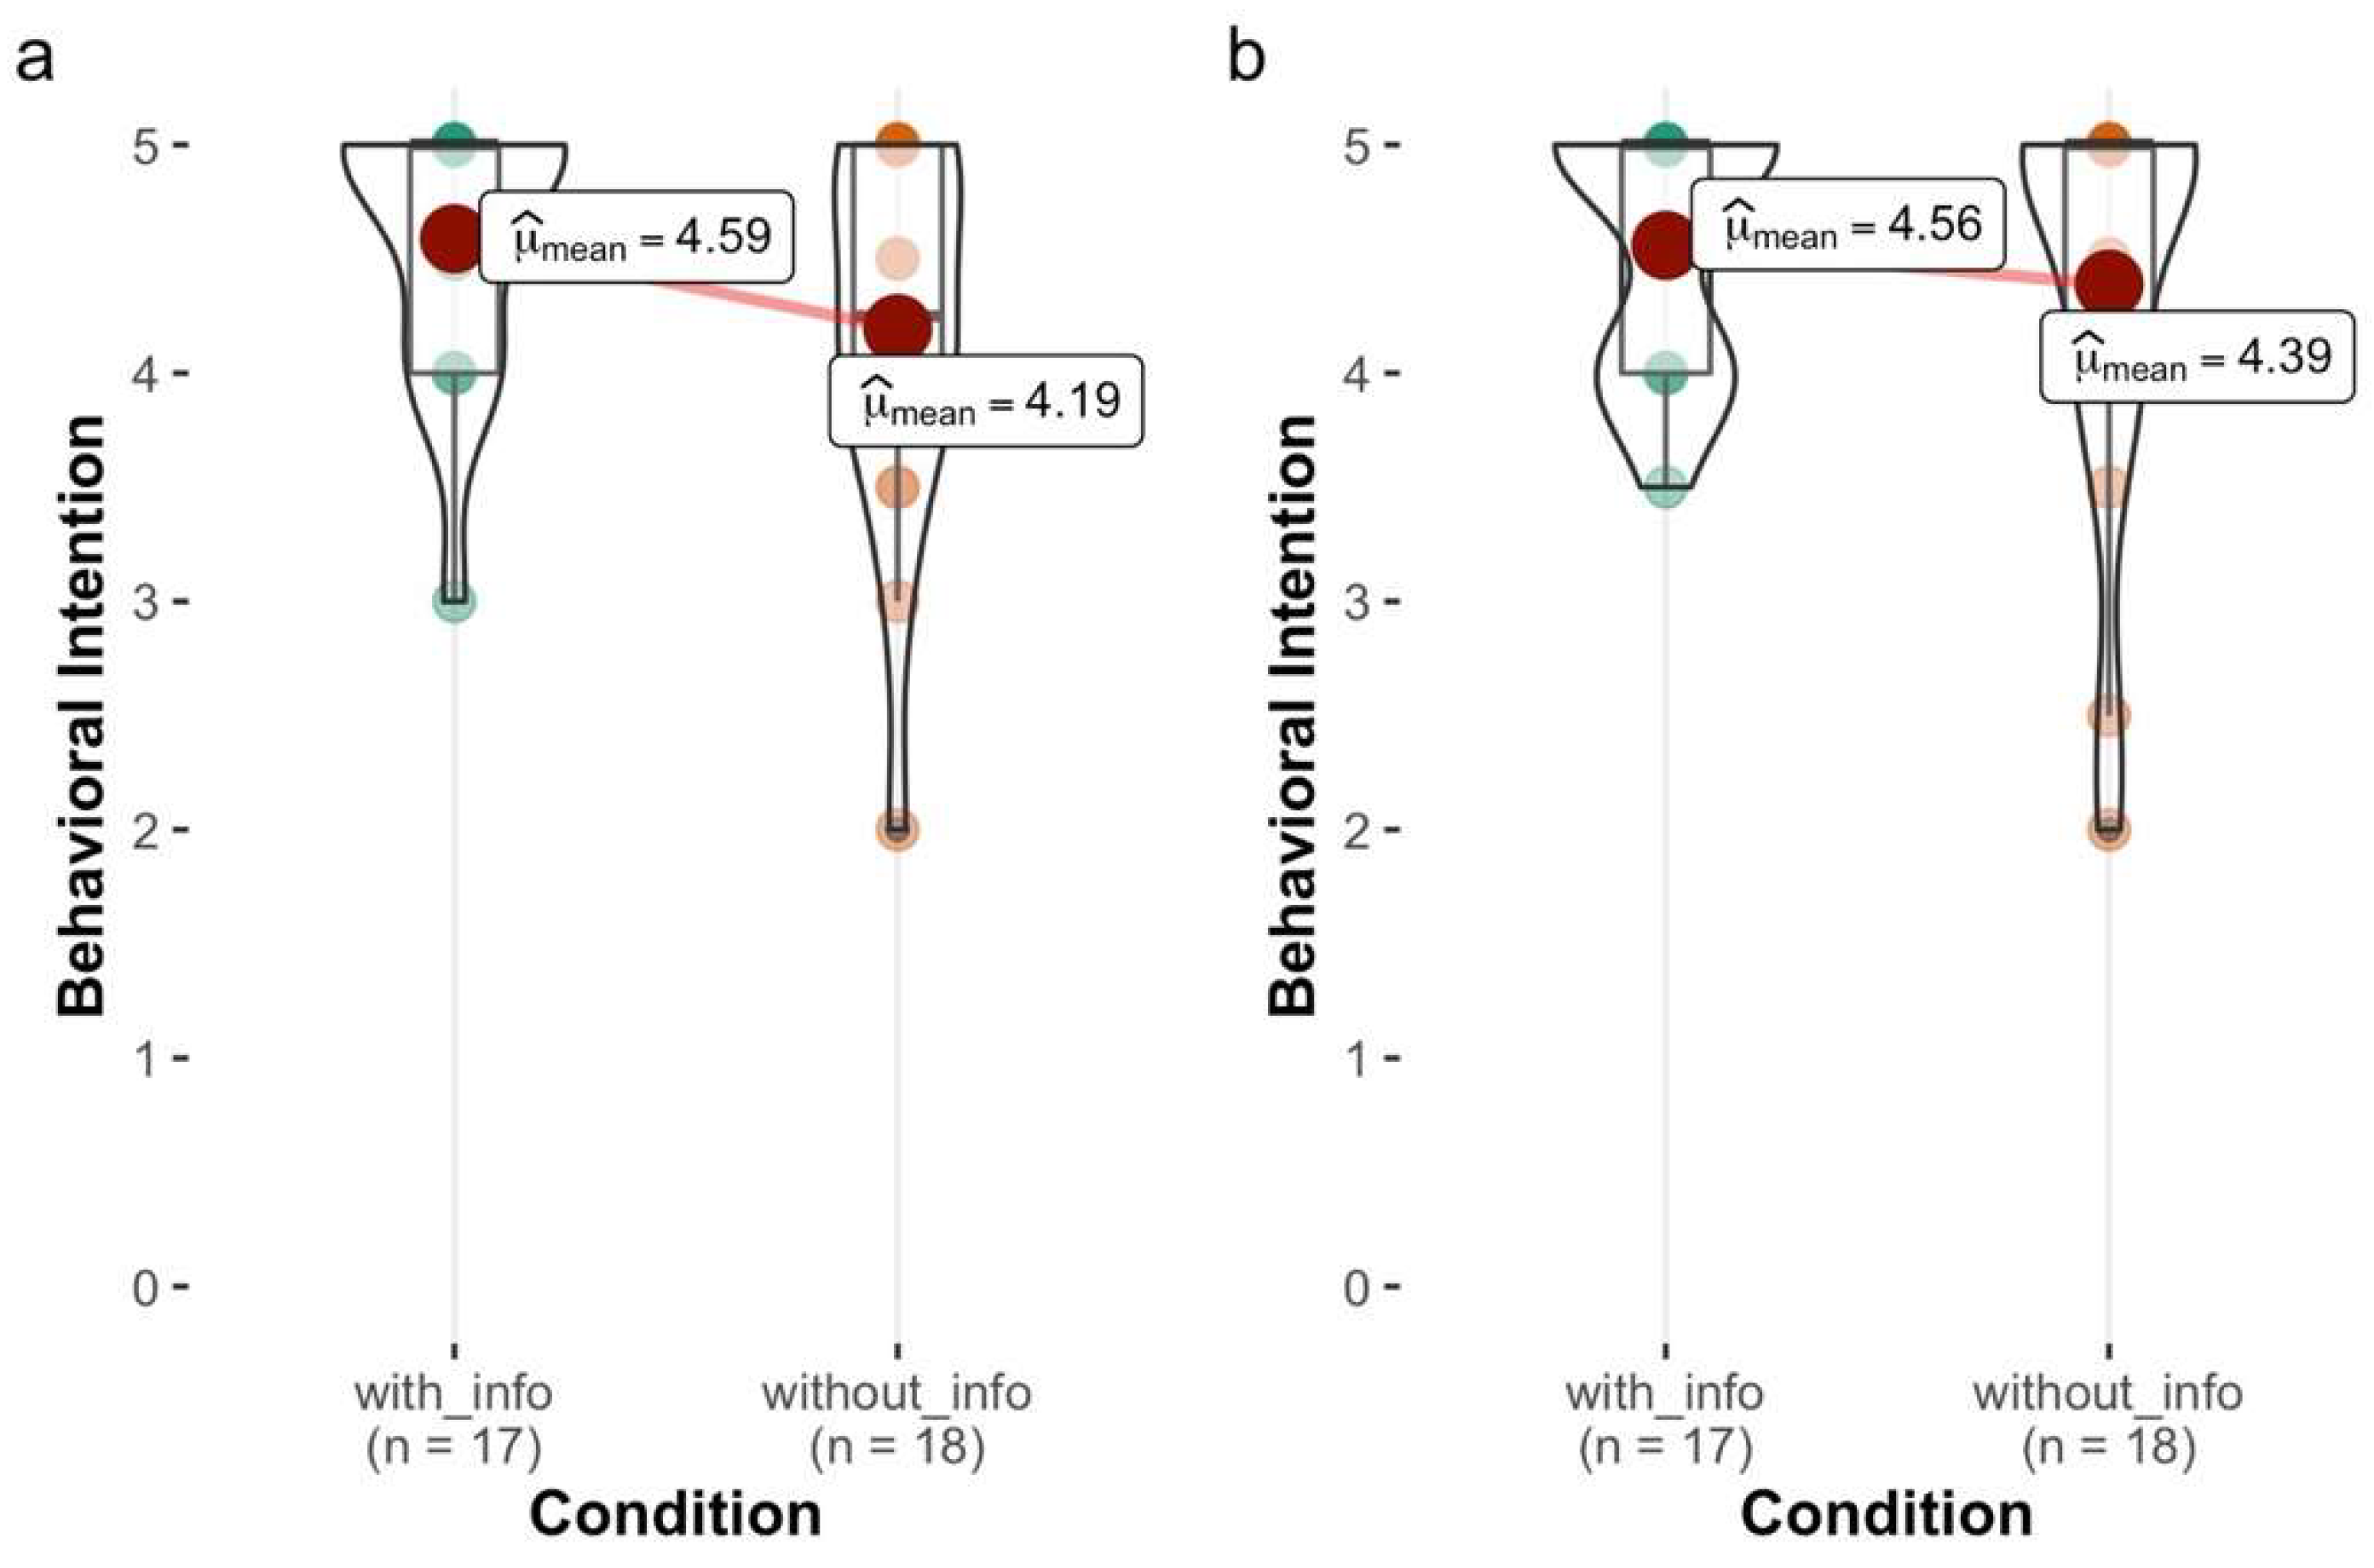
3.4. Influence of Information on Behavioral Intention (H4)

To test hypothesis 4 (higher behavioral intention at T3 after the incidents in the group with information than in the group without information) the behavioral intention data were compared between groups with a Mann–Whitney U test. At T3, the group with information descriptively had a higher mean in behavioral intention than the group without information (see Figure 5). However, an inspection of both groups at T2, at which no manipulation has yet taken place through the incidents and the information, shows that the difference was also present here (MInfo = 4.59, MnoInfo = 4.19) and was higher than at T3 (see Figure 5).
At both time points there were no significant differences between the two groups (T3: group with information has MRank = 20.41 and group without information has MRank = 15.72, U = 112.00, Z = −1.39, p = 0.169; T2: group with information had MRank = 17.59 and group without information had MRank = 18.39, U = 146.00, Z = 0.235, p = 0.823). Thus, hypothesis 4 is not supported by the results.

4. Discussion

This paper investigated the acceptance of automated shuttles in a real-world driving study with a Wizard-of-Oz automated vehicle. The UTAUT-2 constructs performance expectancy, social influence, facilitating conditions, and hedonic motivation as well as the construct perceived risk were investigated as factors influencing the behavioral intention to use automated shuttles. UTAUT-2 was applied for the first time in a context in which the automated shuttle drives at normal speed in real-world traffic, and in which unexpected incidents occur for the users.

4.1. Summary of the Results

The results provide insights regarding the acceptance of automated shuttles. Looking at behavioral intention at all three measurement time points shows that acceptance of automated shuttles is high in general and even before the first ride. This is in line with previous studies [14,15], which also report a generally high acceptance of autonomous shuttle buses. Hence, automated shuttles are already highly accepted as a component of a future public mobility concept among potential users.
The first research question of this paper referred to the goodness of fit of UTAUT-2 when applied to automated shuttles. Hypothesis H1 is supported by the results with R2 = 0.347 at T1, robust R2 = 0.590 at T2 and R2 = 0.657 at T3. The coefficient of determination exceeds the threshold for high variance explanation of 0.26 (cf. [41]) at all three measurement time points. Compared with studies in which UTAUT(-2) was applied to the acceptance of slow autonomous shuttles in a real-world driving context, the explanatory power of the model in this study of 59% variance explanation and 66% variance explanation after the rides is high. In the study by Madigan et al. [13] UTAUT-2 explained 59% of the variance in behavioral intention to use the autonomous shuttle, and in the study by Nordhoff et al. [14] UTAUT explained 40% of the variance. When interpreting these results, it is important to mention that at all three measurement time points, only performance expectancy was a significant predictor of behavioral intention. Thus, much of the explained variance was only due to performance expectancy. This is somewhat unexpected, as in most previous findings applying UTAUT(-2) to automated vehicles or autonomous shuttles in real-world driving contexts, all predictors except effort expectancy significantly explained variance in behavioral intention [10,13,15]. However, our results are similar to the ones of Nordhoff et al. [14] who found that performance expectancy was the only significant predictor of behavioral intention to use a slow autonomous shuttle. Accordingly, performance expectancy plays a central role in forming the behavioral intention of automated shuttles. It is also interesting to note that the explanatory power of UTAUT-2 increases with each measurement time point. This increase was particularly strong from before the first ride to after the first ride, at which point the variance explanation almost doubles. This suggests that UTAUT-2, and especially the predictor performance expectancy, are particularly applicable when a technology, in this case the automated shuttle, has already been used.
The second hypothesis related to whether perceived risk as an additional predictor increases the explanatory power of UTAUT-2. Hypothesis H2 could only be investigated for T2 and T3 because the perceived risk scale had too low reliability at T1. The hypothesis was not supported by the results at T2 and at T3. The result contrasts with the study by Chen et al. [20], in which perceived risk was the strongest predictor of behavioral intention compared to all UTAUT predictors. Our results, however, suggest that perceived risk has little influence on the behavioral intention to use automated shuttles.
The question about the change in acceptance from pre-ride to post-ride was tested with hypothesis 3. In our study, the descriptive increase in behavioral intention was not significant, so the results do not support this hypothesis. This contrasts with studies by Rahman et al. [21] and Pascale et al. [22]. However, other work also reports no significant increases in acceptance [15]. Accordingly, the results of this work suggest that usage experience only has a small or no effect on the adoption of automated shuttles. However, the influence of first-time use experience should be investigated in further studies with samples that are more heterogeneous in terms of interest in automated vehicles than the present sample, as the present sample showed rather high interest in automated vehicles.
Furthermore, our results did not support the assumption that information presentation in case of incidents has a significant effect on the behavioral intention to use shuttles (H4). This was indicated by the non-significant comparison between the two experimental groups (with and without information) as well as the descriptive observation of the mean values at T2 and at T3. Although there was a difference in the expected direction (i.e., higher behavioral intention in the group with information) between the groups at T3, that difference was also present at T2, at which the two groups were not expected to differ in their behavioral intention. Our results differ from various research papers that postulated a relationship between information and acceptance of autonomous public transport [23,42]. However, this relationship has not yet been investigated in a real-world driving study and in unexpected situations. It is also interesting to note here that an analysis of participants’ information needs for both incidents revealed that participants in the group with information were significantly less uncertain, had a significantly lower need for information, and rated the display significantly as more helpful for understanding the actions of the shuttle (for details, see [28]). This indicates that the information in the incidents contributed to comprehensibility and less uncertainty, even though it had no effect on behavioral intention.

4.2. Interpretation and Implication of the Results

The findings of this work complement and extend the current state of research investigating the acceptance of automated and autonomous vehicles in public transport using UTAUT-2. Core implications can be derived from the results, which are explained below:
  • At the current state of implementation, performance expectancy is the key predictor of behavioral intention to use automated shuttles;
  • The predictive effect of UTAUT-2 might be subject to temporal dynamics depending on the implementation status of automated shuttles;
  • The explanatory power of UTAUT-2 doubles from pre-ride to post-ride, implying a better application of the model in real-world driving studies than in questionnaire studies.
The results of this work imply a central role of the predictor performance expectancy in predicting the behavioral intention to use automated shuttles. The explanatory power of UTAUT-2 in this work was high according to Cohen’s [41] criteria, as well as compared to other studies [13,14]. However, as in Nordhoff et al. [14], the explanatory power in this work came primarily from the only significant predictor, performance expectancy. For researchers, developers, and policymakers, the result is an indication that at the current stage of implementation, i.e., before automated shuttles are already widely implemented, performance expectancy is a central factor influencing the behavioral intention to use automated shuttles. Accordingly, performance expectancy should play a special role in product development and implementation. This can be managed by developers ensuring that automated shuttles are perceived as particularly useful through various features. In addition, developers and policymakers should ensure to communicate the usefulness of the new technology to potential users during implementation. This can be done, for example, by providing detailed information about the functions of automated shuttles.
To add, the finding that performance expectancy is the only significant predictor of behavioral intention may imply that the predictive effect of UTAUT-2 is subject to temporal dynamics. Accordingly, the central role of performance expectancy may be due to the current state of implementation of automated shuttles. Since no or little automated shuttles are currently deployed in public transportation, they do not yet play a major role in public discourse, and therefore a factor such as social influence may not have an impact on behavioral intention at this time. Moreover, the factor facilitating conditions might be difficult to assess at the current time because the technology is only barely implemented, so that the users cannot judge if they have the necessary knowledge and resources to use automated shuttles. Accordingly, the predictive impact of UTAUT-2 could be subject to dynamics that change depending on the stage of product implementation. For example, the timepoint of the study could affect how well each factor predicts behavioral intention, depending on whether or not the technology has been implemented on a large scale. This means that researchers should consider temporal dependencies when applying UTAUT-2 and comparable models to assess what predictive power the models have. Whether the predictivity of UTAUT-2 is subject to temporal dynamics should be further investigated in future studies. This would be possible, for example, in studies that follow users from the current stage of implementation over several years at multiple measurement time points.
The first-time observation of UTAUT-2 in the context of autonomous public transport at several measurement time points provides information about the change in the model depending on the experience of the users. The explanatory power of UTAUT-2 almost doubles from pre-ride to post-ride. This suggests that UTAUT-2 is more applicable when potential users have already used the automated or autonomous public transportation vehicle than when they have only received information about it and seen pictures. This implies that the explanatory power of UTAUT-2 is better in real-world driving studies than in questionnaire studies.

4.3. Limitations

The results of this work can only be interpreted considering the limitations. There are some limiting factors related to the sample. First, the sample size is relatively small (N = 35) and thus may have reduced the power of the used tests. An attempt was made to address this issue by using statistical procedures that are robust and recommended for small samples. Second, there are limitations in the generalizability of the results due to the composition of the sample. Of the 35 participants, ten are female and 25 are male. Thus, the genders are not equally distributed. Furthermore, participants were all recruited in the same region in Northern Germany, so that they likely had a very similar cultural background. Thus, cultural background may have had an influence on the evaluation of the shuttle service. Moreover, there is a high level of interest in automated vehicles in the sample. Of the participants, 80% are rather strongly or very strongly interested in automated vehicles and 20% are neutral towards them. The generally rather high interest in automated vehicles may have led to higher acceptance in the sample and lower perceived risk than in the overall population. Finally, all participants were younger than 60 years, which may well have led to biases regarding acceptance of automated vehicles. Hence, future studies with larger sample sizes should investigate whether personal characteristics, such as gender, interest in automated vehicles, cultural background or age, but also other factors such as educational level, affect the evaluation and acceptance of automated shuttle services.
It should be mentioned that the reliability of the scales facilitating conditions and perceived risk was so low at the first measurement time point that the two factors had to be excluded from the analysis at T1. In future studies that, as in this work, only provide subjects with information about the automated or autonomous vehicles at the first measurement time point and no ride in the real vehicle, the reliability of these scales could be increased by explaining in more detail the risks as well as the conditions under which the vehicles are introduced.
One further limitation is the fact that the vehicle did not drive with Level-4-automation, but by a human driver in a Wizard-of-Oz fashion. To conceal this, a partition was installed in the shuttle that restricted the forward view and obscured the fact that the safety driver was in fact the driver. This may have resulted in the automation being less believable to the subjects than if they had seen the car actually driving in an automated fashion. However, a control question was used to inquire whether the participants could relate to the situation that the shuttle was automated. The four participants who could not or could rather not empathize with the situation after this question were excluded from the analysis. In addition, according to some participants the partition led to uncertainty or dissatisfaction because they could not observe the traffic events well. In addition, the partition may have negatively affected hedonic motivation and behavioral intention, as according to some participants it led to uncertainty or dissatisfaction, thus limiting ride comfort.
To add, the design as a real-world driving study created some limitations that could not be controlled. These include the possible influence of time of day on road traffic, according to which subjects experienced different traffic density and driving time depending on the time of day. Weather may also have had an influence on the relationships studied. These external influences in a real-world driving study lead to limitations in the internal validity of the results. On the other hand, the external validity of the results is high due to the realistic environment. Another limitation that arose from the real-world driving study is the presence of the driver, or for the participants in the Wizard-of-Oz situation, the safety driver. The safety driver may have enhanced the participants’ sense of safety [43,44]. Thus, the safety driver represents a confounding factor that may have led to underestimation of the effect of perceived risk. To minimize this influence, the safety driver was a different person than the experimenter, so that the participants did not yet know the safety driver. In addition, the partition installed in the shuttle was intended to shield the participant from the safety driver, thus reinforcing the feeling of being alone. To circumvent the confounding influence of the safety driver in future studies, the darkening of the car windows and better paneling in the interior of the vehicle could be used to make the participants believe that they are alone in the vehicle.

5. Conclusions

In this work, the acceptance of automated shuttles was investigated by applying UTAUT-2 for the first time at multiple measurement time points in a real-world driving study. The results show that the behavioral intention of using automated shuttles is generally high. The results allow conclusions to be drawn regarding the theories used as well as practical implications. Performance expectancy as the only significant predictor of behavioral intention to use automated shuttles appears to have a central role in UTAUT-2. This special role of the predictor performance expectancy may be due to a dynamic nature of UTAUT-2, according to which the influence of predictors on behavioral intention changes depending on the state of implementation. In addition, the explanatory power of UTAUT-2 nearly doubles from pre-ride to post-ride, suggesting that the model can be better applied to explain acceptance in real-world driving studies than in questionnaire-only studies. For the successful implementation of automated shuttles, the results imply that companies (during development) and policy makers (during implementation) should pay particular attention to the potential users’ perception of the shuttles as useful, as performance expectancy is currently the key predictor of acceptance. The influence of perceived risk and information during the incidents on acceptance could not be conclusively clarified in this study. In particular, the potential dynamics of UTAUT-2 depending on the implementation status, as well as the influence of performance expectation and the influence of information, should be further investigated in future studies.

Supplementary Materials

The following supporting information can be downloaded at: https://www.mdpi.com/article/10.3390/futuretransp2040056/s1, Table S1: Experimental Data.

Author Contributions

Conceptualization, A.R., K.I. and E.B.; Data curation, A.R. and E.B.; Investigation, A.R., H.P.N. and E.B.; Methodology, A.R., K.I., H.P.N., L.O. and E.B.; Software, H.P.N.; Supervision, K.I., L.O. and E.B.; Visualization, A.R. and E.B.; Writing—original draft, A.R.; Writing—review and editing, A.R., K.I., L.O. and E.B. All authors have read and agreed to the published version of the manuscript.

Funding

This research was funded by the German Federal Ministry for Digital and Transport, grant number 01MM19014A (project ViVre).

Institutional Review Board Statement

The study was conducted in accordance with the Declaration of Helsinki, and approved by the Ethics Committee of the German Aerospace Center (reference no. 5/21, Date of approval: 26 April 2021).

Informed Consent Statement

Informed consent was obtained from all subjects involved in the study.

Data Availability Statement

The data presented in this study are available in the Supplementary Materials.

Conflicts of Interest

The authors declare no conflict of interest.

References

  1. Pakusch, C.; Bossauer, P. User Acceptance of Fully Autonomous Public Transport. In Proceedings of the 14th International Joint Conference on e-Business and Telecommunications, Madrid, Spain, 24–26 July 2017; SCITEPRESS-Science and Technology Publications: Cham, Switzerland, 2017; pp. 52–60, ISBN 978-989-758-257-8. [Google Scholar]
  2. Shen, Y.; Zhang, H.; Zhao, J. Integrating shared autonomous vehicle in public transportation system: A supply-side simulation of the first-mile service in Singapore. Transp. Res. Part A Policy Pract. 2018, 113, 125–136. [Google Scholar] [CrossRef]
  3. Statistisches Bundesamt. Verkehr-Verkehrsunfälle 2021, 7. Available online: https://www.destatis.de/DE/Themen/Gesellschaft-Umwelt/Verkehrsunfaelle/Publikationen/Downloads-Verkehrsunfaelle/verkehrsunfaelle-jahr-2080700207004.pdf?__blob=publicationFile (accessed on 15 November 2022).
  4. Rombaut, E.; Feys, M.; Vanobberghen, W.; de Cauwer, C.; Vanhaverbeke, L. Experience and Acceptance of an Autonomous Shuttle in the Brussels Capital Region. In Proceedings of the 2020 Forum on Integrated and Sustainable Transportation Systems (FISTS), Delft, South Holland Province, The Netherlands, 3–5 November 2020; IEEE: Nashville, TN, USA, 2020; pp. 77–82, ISBN 978-1-7281-9503-2. [Google Scholar]
  5. Venkatesh, V.; Morris, M.G.; Davis, G.B.; Davis, F.D. User Acceptance of Information Technology: Toward a Unified View. MIS Q. 2003, 27, 425. [Google Scholar] [CrossRef] [Green Version]
  6. Dillon, A.; Morris, M.G. User Acceptance of Information Technology: Theories and Models. In Annual Review of Information Science and Technology; Williams, M., Ed.; Information Today: Medford, NJ, USA, 1996; pp. 3–32. [Google Scholar]
  7. Davis, F.D. Perceived Usefulness, Perceived Ease of Use, and User Acceptance of Information Technology. MIS Q. 1989, 13, 319. [Google Scholar] [CrossRef] [Green Version]
  8. King, W.R.; He, J. A meta-analysis of the technology acceptance model. Inf. Manag. 2006, 43, 740–755. [Google Scholar] [CrossRef]
  9. Venkatesh, V.; Thong, J.Y.; Xu, X. Consumer Acceptance and Use of Information Technology: Extending the Unified Theory of Acceptance and Use of Technology. MIS Q. 2012, 36, 157. [Google Scholar] [CrossRef] [Green Version]
  10. Nordhoff, S.; Louw, T.; Innamaa, S.; Lehtonen, E.; Beuster, A.; Torrao, G.; Bjorvatn, A.; Kessel, T.; Malin, F.; Happee, R.; et al. Using the UTAUT2 model to explain public acceptance of conditionally automated (L3) cars: A questionnaire study among 9118 car drivers from eight European countries. Transp. Res. Part F Traffic Psychol. Behav. 2020, 74, 280–297. [Google Scholar] [CrossRef]
  11. SAE International. Taxonomy and Definitions for Terms Related to Driving Automation Systems for On-Road Motor Vehicles; SAE International: Warrendale, PA, USA, 2021. [Google Scholar]
  12. Madigan, R.; Louw, T.; Dziennus, M.; Graindorge, T.; Ortega, E.; Graindorge, M.; Merat, N. Acceptance of Automated Road Transport Systems (ARTS): An Adaptation of the UTAUT Model. Transp. Res. Procedia 2016, 14, 2217–2226. [Google Scholar] [CrossRef] [Green Version]
  13. Madigan, R.; Louw, T.; Wilbrink, M.; Schieben, A.; Merat, N. What influences the decision to use automated public transport? Using UTAUT to understand public acceptance of automated road transport systems. Transp. Res. Part F Traffic Psychol. Behav. 2017, 50, 55–64. [Google Scholar] [CrossRef]
  14. Nordhoff, S.; Malmsten, V.; van Arem, B.; Liu, P.; Happee, R. A structural equation modeling approach for the acceptance of driverless automated shuttles based on constructs from the Unified Theory of Acceptance and Use of Technology and the Diffusion of Innovation Theory. Transp. Res. Part F Traffic Psychol. Behav. 2021, 78, 58–73. [Google Scholar] [CrossRef]
  15. Bernhard, C.; Oberfeld, D.; Hoffmann, C.; Weismüller, D.; Hecht, H. User acceptance of automated public transport. Transp. Res. Part F Traffic Psychol. Behav. 2020, 70, 109–123. [Google Scholar] [CrossRef]
  16. Bauer, R.A. Consumer behavior as risk taking. In Proceedings of the 43rd National Conference of the American Marketing Assocation, Chicago, IL, USA, 15–17 June 1960; pp. 389–398. [Google Scholar]
  17. Jacoby, J.; Kaplan, L.B. The components of perceived risk. In Proceedings of the Third Annual Conference of the Association for Consumer Research, Chicago, IL, USA, 3–5 November 1972; Venkatesan, M., Ed.; pp. 382–393. [Google Scholar]
  18. Rogers, E.M.; Singhal, A.; Quinlan, M.M. Diffusion of innovations. An Integrated Approach to Communication THEORY and Research; Routledge: London, UK, 2014; pp. 432–448. [Google Scholar]
  19. Zhang, T.; Zeng, W.; Zhang, Y.; Tao, D.; Li, G.; Qu, X. What drives people to use automated vehicles? A meta-analytic review. Accid. Anal. Prev. 2021, 159, 106270. [Google Scholar] [CrossRef] [PubMed]
  20. Chen, J.; Li, R.; Gan, M.; Fu, Z.; Yuan, F. Public Acceptance of Driverless Buses in China: An Empirical Analysis Based on an Extended UTAUT Model. Discret. Dyn. Nat. Soc. 2020, 2020, 4318182. [Google Scholar] [CrossRef]
  21. Rahman, M.M.; Lesch, M.F.; Horrey, W.J.; Strawderman, L. Assessing the utility of TAM, TPB, and UTAUT for advanced driver assistance systems. Accid. Anal. Prev. 2017, 108, 361–373. [Google Scholar] [CrossRef] [PubMed]
  22. Pascale, M.T.; Rodwell, D.; Coughlan, P.; Kaye, S.-A.; Demmel, S.; Dehkordi, S.G.; Bond, A.; Lewis, I.; Rakotonirainy, A.; Glaser, S. Passengers’ acceptance and perceptions of risk while riding in an automated vehicle on open, public roads. Transp. Res. Part F Traffic Psychol. Behav. 2021, 83, 274–290. [Google Scholar] [CrossRef]
  23. Pigeon, C.; Alauzet, A.; Paire-Ficout, L. Factors of acceptability, acceptance and usage for non-rail autonomous public transport vehicles: A systematic literature review. Transp. Res. Part F Traffic Psychol. Behav. 2021, 81, 251–270. [Google Scholar] [CrossRef]
  24. Fröhlich, P.; Schatz, R.; Buchta, M.; Schrammel, J.; Suette, S.; Tscheligi, M. “What’s the Robo-Driver up to?” Requirements for Screen-based Awareness and Intent Communication in Autonomous Buses. i-com 2019, 18, 151–165. [Google Scholar] [CrossRef] [Green Version]
  25. Grippenkoven, J.; Fassina, Z.; König, A.; Dreßler, A. Perceived safety: A necessary precondition for successful autonomous mobility services. In Proceedings of the Human Factors and Ergonomics Society Europe Chapter 2018 Annual Conference, Berlin, Germany, 8–10 October 2018; de Waard, D., Brookhuis, K., Coelho, D., Fairclough, S., Manzey, D., Naumann, A., Onnasch, L., Röttger, S., Toffetti, A., Wiczorek, R., Eds.; pp. 119–133, ISBN 2233-4959. [Google Scholar]
  26. Zhang, T.; Tan, H.; Li, S.; Zhu, H.; Tao, D. Public’s acceptance of automated vehicles: The role of initial trust and subjective norm. Proc. Hum. Factors Ergon. Soc. Annu. Meet. 2019, 63, 919–923. [Google Scholar] [CrossRef]
  27. Zmud, J.; Sener, I.N.; Wagner, J. Consumer Acceptance and Travel Behavior: Impacts of Automated Vehicles; No. PRC 15-49 F; Texas A&M Transportation Institute: Bryan, TX, USA, 2016. [Google Scholar]
  28. Brandebusemeyer, C.; Ihme, K.; Bosch, E. Travelers’ Information Need in Automated Vehicles—A Psychophysiological Analysis. In Proceedings of the International Conference On Human-Centered Cognitive Systems (HCCS 2022), Shanghai, China, 17–18 December 2022. accepted. [Google Scholar]
  29. General Data Protection Regulation. 2016. Available online: https://gdpr-info.eu/ (accessed on 15 November 2022).
  30. OpenStreetMap Deutschland. Available online: https://www.openstreetmap.org/ (accessed on 15 November 2022).
  31. Koller, M.; Stahel, W.A. Sharpening Wald-type inference in robust regression for small samples. Comput. Stat. Data Anal. 2011, 55, 2504–2515. [Google Scholar] [CrossRef]
  32. Yohai, V.J. High Breakdown-Point and High Efficiency Robust Estimates for Regression. Ann. Statist. 1987, 15, 642–656. [Google Scholar] [CrossRef]
  33. Field, A.P.; Wilcox, R.R. Robust statistical methods: A primer for clinical psychology and experimental psychopathology researchers. Behav. Res. Ther. 2017, 98, 19–38. [Google Scholar] [CrossRef]
  34. Dwivedi, A.K.; Mallawaarachchi, I.; Alvarado, L.A. Analysis of small sample size studies using nonparametric bootstrap test with pooled resampling method. Stat. Med. 2017, 36, 2187–2205. [Google Scholar] [CrossRef] [PubMed]
  35. IBM Corp. IBM SPSS Statistics for Macintosh; IBM Corp.: Armonk, NY, USA, 2020. [Google Scholar]
  36. R Core Team. R: A Language and Environment for Statistical Computing; R Foundation for Statistical Computing: Vienna, Austria, 2020; Available online: https://www.r-project.org/ (accessed on 15 November 2022).
  37. Maechler, M.; Rousseeuw, P.; Croux, C.; Todorov, V.; Ruckstuhl, A.; Salibian-Barrera, M.; Verbeke, T.; Koller, M.; Conceicao, E.; Anna di Palma, M. Robustbase. Robustbase: Basic Robust Statistics. CRAN. 2020. Available online: https://r-forge.r-project.org/projects/robustbase/ (accessed on 15 November 2022).
  38. Patil, I. Visualizations with statistical details: The ‘ggstatsplot’ approach. JOSS 2021, 6, 3167. [Google Scholar] [CrossRef]
  39. Kline, P. Handbook of Psychological Testing; Routledge: London, UK, 2013. [Google Scholar]
  40. Weise, G. Psychologische Leistungstests: Ein Handbuch für Studium und Praxis. 1. Intelligenz, Konzentration, Spezielle Fähigkeiten; Verlag für Psychologie: Hogrefe, Germany, 1975. [Google Scholar]
  41. Cohen, J. Statistical Power Analysis for the Behavioral Sciences; Lawrence Erlbaum Associates: Hillsdale, NJ, USA, 1988. [Google Scholar]
  42. Földes, D.; Csiszar, C.; Zarkashev, A. User expectations towards mobility services based on autonomous vehicle. In Proceedings of the 8th International Scientific Conference CMDTUR 2018, Žilina, Slovakia, 4–5 October 2018; pp. 7–14. [Google Scholar]
  43. Dong, X.; DiScenna, M.; Guerra, E. Transit user perceptions of driverless buses. Transportation 2019, 46, 35–50. [Google Scholar] [CrossRef]
  44. Salonen, A.; Haavisto, N. Towards Autonomous Transportation. Passengers’ Experiences, Perceptions and Feelings in a Driverless Shuttle Bus in Finland. Sustainability 2019, 11, 588. [Google Scholar] [CrossRef]
Figure 1. Adapted UTAUT-2.
Futuretransp 02 00056 g001
Figure 2. Interior of the vehicle with the partition that was installed to conceal the fact that the safety driver was in fact driving manually (own photo).
Futuretransp 02 00056 g002
Figure 4. Change in behavioral intention from pre-ride to post-ride. Violin plot illustrating change in behavioral intention from T1.
Futuretransp 02 00056 g004
Figure 5. Differences in behavioral intention by condition. Violin plot illustrating descriptive differences in behavioral intention at T2 (a) and at T3 (b) according to condition.
Futuretransp 02 00056 g005
Table 1. Items of the questionnaire for the scales of the UTAUT-2.
ConstructItemsSource
Performance Expectancy (PE)PE1: Using automated shuttles to travel helps me to achieve things that are important to me.
PE2: I find automated shuttles a useful mode of transport.
[13]
Social Influence (SI)SI1: People who influence my behavior think that I should use automated shuttles.
SI2: People who are important to me think that I should use automated shuttles.
SI3: People whose opinions I value would like me to use automated shuttles.
[13]
Facilitating Conditions (FC)FC1: I have the knowledge necessary to use automated shuttles as in this study.
FC2: I have the resources necessary to use automated shuttles as in this study.
[13]
Hedonic Motivation (HM)HM1: Using automated shuttles is fun.
HM2: Using automated shuttles is entertaining.
HM3: Using automated shuttles is enjoyable.
[13]
Behavioral Intention (BI)BI1: Assuming that I had access to automated shuttles, I predict that I would use them in the future.
BI2: If automated shuttles become available permanently, I plan to use them.
BI3: I intend to have the automated shuttle take me to my car/bike/stop after the experiment.
[13]
Perceived Risk (PR)PR0: I think the speed of automated shuttles is not fast enough, which will affect my travel time.
PR1: I am concerned that automated shuttles will cost more than traditional buses.
PR2: I am concerned that the functional design of automated shuttles is still not perfect today.
PR3: I am concerned about being persecuted by others in the automated shuttles.
PR4: I am concerned that the safety performance of automated shuttles is not guaranteed.
PR5: I am concerned that automated shuttles will conflict and interfere with human-driven vehicles.
[20]
Note. In the original, the word “ARTS” was replaced by “automated shuttles” to adapt to the present study. For clarity, the words “as in this study” were added to both FC items. Item BI3 was changed in translation to align with the present study. Item PR0 was not collected in the first place.
Table 2. Reliability of the UTAUT-2-scales and of the perceived risk scale.
ScaleT1T2T3
Performance Expectancy (PE)0.620.810.82
Social Influence (SI)0.840.890.90
Facilitating Conditions (FC)0.020.740.86
Hedonic Motivation (HM)0.770.820.84
Behavioral Intention (BI)0.87 (0.69)0.91 (0.71)0.95 (0.68)
Perceived Risk (PR)0.41 (0.13)0.76 (0.41)0.84 (0.68)
Note. Spearman–Brown coefficient for PE, FC. Cronbach’s Alpha for SI, HM, BI, PR. Bold after deleting the items.
Table 3. Results of the hierarchical MLRs at T1, T2 and T3.
TimeStep ββ
95% CI
SEβstdFit
T11(Constant)1.40[−0.29, 3.09]0.83
Performance Expectancy0.46 *[0.05, 0.86]0.200.39 *
Social Influence0.14[−0.13, 0.42]0.130.19
Hedonic Motivation0.16[−0.14, 0.46]0.150.17
R2 = 0.347 **     Rob. R2 = 0.332 **
R2adj = 0.284 **     Rob. R2adj = 0.268 **
T21(Constant)0.49[−0.85, 1.83]0.66
Performance Expectancy0.79 ***[0.47, 1.10]0.160.72 ***
Social Influence−0.04[−0.22, 0.14]0.09−0.06
Facilitating Conditions0.00[−0.22, 0.21]0.11−0.00
Hedonic Motivation0.14[−0.13, 0.42]0.130.15
R2 = 0.632 ***      Rob. R2 = 0.590 ***
R2adj = 0.583 ***     Rob. R2adj = 0.535 ***
2(Constant)0.63[−1.10, 2.36]0.85
Performance Expectancy0.77 ***[0.43, 1.11]0.170.71 ***
Social Influence−0.04[−0.22, 0.14]0.09−0.06
Facilitating Conditions0.00[−0.23, 0.22]0.11−0.00
Hedonic Motivation0.14[−0.14, 0.42]0.140.14
Perceived Risk−0.03[−0.22, 0.17]0.10−0.03
ΔR2 = 0.001
R2 = 0.633 ***
R2adj = 0.570 ***
T31(Constant)0.68[−0.78, 2.14]0.71
Performance Expectancy0.77 ***[0.47, 1.08]0.150.74 ***
Social Influence−0.07[−0.25, 0.10]0.09−0.10
Facilitating Conditions−0.06[−0.36, 0.25]0.15−0.04
Hedonic Motivation0.20[−0.07, 0.47]0.130.20
R2 = 0.657 ***
R2adj = 0.612 ***
2(Constant)0.63[−1.10, 2.36]0.79
Performance Expectancy0.77 ***[0.43, 1.11]0.150.71 ***
Social Influence−0.04[−0.22, 0.14]0.09−0.06
Facilitating Condititons−0.00[−0.23, 0.22]0.15−0.00
Hedonic Motivation0.14[−0.14, 0.42]0.140.14
Perceived Risk−0.03[−0.22, 0.17]0.08−0.03
R2 = 0.672 ***
R2adj = 0.615 ***
ΔR2 = 0.014
Note. * p < 0.05., ** p < 0.01., *** p <.001. Rob. indicates results of the robust regression, SE means standard error.
Publisher’s Note: MDPI stays neutral with regard to jurisdictional claims in published maps and institutional affiliations.

