Article

Human Factors in Road Design: A Review of Italian Design Standards

Dipartimento di Ingegneria Civile e Ambientale Università degli Studi di Firenze, Via di Santa Marta 3, 50139 Firenze, Italy
*
Author to whom correspondence should be addressed.
Future Transp. 2022, 2(4), 902-922; https://doi.org/10.3390/futuretransp2040050
Submission received: 5 June 2022 / Revised: 6 October 2022 / Accepted: 27 October 2022 / Published: 2 November 2022

Abstract

:
Human Factors are stable psychological, psychophysical, and physiological limits that influence the performance and safety of technical systems managed by humans. Roads are made for human use, but nowadays not completely on a human scale. Many studies demonstrate that Human Factors are a key factor in accident occurrence and thus it is mandatory to consider them in the definition of design standards. This research provides a methodological approach to reviewing design standards based on Human Factors. The methodology identifies which Human Factors aspects are relevant for each specific design feature. The reviewer is then able to judge if those aspects are considered using checklists. Moreover, the paper presents a review of the Italian design standards using the proposed methodology. This identifies to what extent Human Factors are considered in the Italian design standards, analyzing if they match the requirements of the three rules of Human Factors proposed by PIARC (Permanent International Association of Road Congresses). The results identify where Italian design standards consider Human Factors and where they do not. This is where further improvements should be made so that engineering solutions could match psychological requirements, for safer and ergonomic road infrastructures. The proposed approach provides a structured and systematic procedure for the analysis which has been found to be suitable also for road safety audits procedures.

1. Introduction

Over the past two decades, a new approach has been included in the main road safety analysis process. This approach, called the proactive approach, considers the so-called in-built safety of the road and does not rely only on accidents. The shift to a proactive approach is a necessity for a safe system that wants to intervene before road accidents occur. A proactive approach must consider not only the possible outcome of an accident (i.e., the severity) but also the possibility that an accident occurs. It has been proved that most accidents are a consequence of drivers’ behavior [1,2] and that the behavior is strictly related to the road, both to its geometrical elements and its environment [3]. Drivers are the core of the road system. Drivers are humans and they must not be considered machines. They cannot strictly obey specific geometrical rules, neither they can analyze all aspects of a complex situation in a few seconds in a perfect, mechanical way. For this reason, the concept of Human Factors (HF) should be applied to road safety. As highlighted by Čičković [4] many studies identify HF as a key factor for correct road perception and thus for accident occurrence. Some of these studies consider, for example, bend curvature perception [5,6], driver’s reaction time and perception of the potentially critical locations [7,8,9], human workload, attention, driver’s fatigue and decision making [10,11], road familiarity and influence of experience [12,13], and the influence of road roadside elements on speed and behavior [14,15]. The analysis of near-miss accidents and other surrogate measures such as the time to collision (TTC) are by themselves proactive analyses that can be used to analyze safety at a specific site. Moreover, the analysis of those surrogate measures, even more than the analysis of accidents, have demonstrated the importance of HF and how different aspect influence the driver’s perception of the road and its behavior as a consequence [16]. Understanding the factors that influence the road-driver relationship will help avoid many of the drivers’ unintentional mistakes. An ideal road that will not lead drivers to make mistakes can be defined as a self-explaining road [17]. The basic notion of a self-explaining road, which originated in the Netherlands, is a “traffic environment which elicits safe behavior simply by its design” [18]. By this concept, the driver should clearly understand the road they are driving, its elements, and its features, changing their driving behavior according to the road elements.
That said, it must be also underlined that the factors concurring in accidents are many and of a different nature. Moreover, the driver behavior is influenced by many factors, which can be also external to the road system, as explained in the work of Paliotto [18]. Driver behavior is the result of complex psychological mechanisms, and roadway HF play a significant role in those mechanisms.
Due to the complexity of the driving task and the different road scenarios, the self-explaining roads concept could appear utopistic (and probably it is), nevertheless is something to which designers should tend to try designing roads on a human scale. For this reason, the identification and avoidance of accident triggering factors must take place mainly during the design process. This will reduce the possible drivers’ operating errors and may consequently reduce the number of occurring accidents and thus reduce the number of injuries and deaths along our roads (Vision Zero approach) [19]. Road safety cannot be judged only once the road is open to traffic, instead, it must be included from the beginning of the design process. Nowadays, HF aspects are only partially included in our design standards, mainly because of a lack of specific guidelines, procedures, and exact equations to account for them. However, design solutions that include HF aspects must be considered in the design phase and instruments which can help the designer through their design choices are essential.
This paper aims to move a first step in that direction, proposing a reviewed methodology to investigate to which extent design standards comprehend HF. The PIARC methodology [20] has been improved and structured to be suitable for a systematic application. The paper presents an example of the application of the proposed methodology to review the current Italian design standards [21,22,23]. The PIARC HF guidelines, which are the results of several years of research and analysis by road safety experts, have been taken as reference. Some concepts from the American NCHRP (National Cooperative Highway Research Program) Report 600: HF Guidelines for Road Systems [24] have been included to evaluate and compare different design criteria. Indeed, the PIARC HF Guidelines for a safer man-road interface [25] provide a more conceptual approach, based on principles, while the NCHRP Guidelines also provide some practical criteria and procedures.

2. Background

2.1. HF and Road Safety

HF are “Those psychological and physiological threshold limit values which are verified as contributing to operational mistakes in the machine and vehicle handling. In the case of road safety, the HF concept considers road characteristics that influence a driver’s right or wrong driving actions” [25]. HF are also defined as “A scientific discipline that tries to enhance the relationship between devices and systems and the people who are meant to use them through the application of extensive, well-documented, and fully appropriate behavioral data that describe and analyze the capabilities and limitations of human beings” [24]. Both definitions highlight the centrality of human beings and their capabilities while driving.
Unfortunately, the study of sciences (including engineering) dealing with human’s psychological and psychophysical aspects is not easy, and the research in this field is some steps under the natural and physical science research [16]: we know much about the world, but few about ourselves. These difficulties in defining some exact rules on human psychology, perception, and behavior, translate into an even more difficult task that is to apply the identified rule to road design. As a consequence, as also highlighted in the NCHRP Guidelines [24], very often it is not possible to quantify and describe the influence of a contributing factor by an equation; however, after many years of research, it is possible to identify some principles to consider, and it is possible to know that some elements have a positive or negative impact on driver capabilities to understand the road and correctly act. One example is the operating speed and thus the factors that influence the speed choice from the driver. Many studies have been conducted on speed, considering different factors, and sometimes finding different numerical results considering the same factors. However, even if numerically different, some results provide the same information. For example, it has been proven that the number of lanes influences speed (the more the lanes the higher the speed) [24] (pp. 17-6–17-7).
For this reason, even in the form of rules and principles (waiting for further development of the research), these concepts must be included in road design, doing what is possible to meet those HF requirements.
The structure proposed by PIARC to analyze road safety conditions can be summarized into three groups of principles, the so-called three rules of HF.
  • The First rule: The 6 seconds rule is about road elements perception, visibility, and recognition.
  • The Second rule: The field of view rule is about the composition of the field of view.
  • The Third rule: The logic rule is about driver expectations provided by the road and mental workload.
A brief synthesis of those rules is included in the following because they are the key to the proposed procedure. However, further details can be found in PIARC publications [20,25]. Following the nomenclature provided by PIARC, the road elements that required a change in the driving behavior, such as intersections, crossings, curves, bus stops, lay byes, driveways, etc., will be referred to in this paper, as “potentially critical locations” (PCLs).
It must also be noted that PIARC proposed a methodology to analyze road safety HF aspects on existing roads [26], which has been tested in recent research by Domenichini et al. [27] and included in more comprehensive study for the development of a network safety analysis procedure by Paliotto et al. [28] with good results, demonstrating the importance of considering HF principles for a safer road design.

2.2. The 6 Seconds Rule

The first rule is called the 6 seconds Rule and concerns the perception and visibility of the PCLs. A driver must have enough time to see, perceive, understand, and react, to adapt their driving behavior to deal with the PCL. To account for this time, PIARC proposed to ideally divide the space preceding a PCL, which requires a change in the driving program/behavior, into four parts (as shown in Figure 1): an advance warning section of about 3–4 s (to be considered only when complex conditions are present); an anticipation section of about 2–3 s, required to correctly perceive and identify the PCL under ambiguous or unclear conditions (also because of road and road surrounding configuration); a response section of about 2–3 s, required to detect the PCL and set up correctly the maneuver to deal with the PCL; and a maneuver section, where the physical maneuver occurs (e.g., braking).

2.3. The Field of View Rule

The driving task is based mainly on visual perception, which is not always compliant with reality. Human limitations force the driver to acquire only some information from the environment they are facing. It is the brain that must then process and elaborate such information to make a general and clear (in our opinion) framework of the situation. For this reason, the first information that is provided by the visual system must be clear, and the most necessary information should catch the attention of the driver. Therefore, a safe road design must consider the composition of the field of view of the road. Composition of the field of view, means how the elements of the road are located along the road and the global image they create. This image of the road is then perceived by the driver. Field of view composition includes the density of the field of view that is a function of the number of objects that contrast with the background [25]. It has been widely proven that many drivers are greatly affected by the field of view composition. For example, the composition of the field of view influences automatic behaviors such as speeding or lane-keeping [8,29] and it may influence the correct road perception [30,31]. An example of a bad composition of the field of view is provided in Figure 2, where the ideal lines created by the median safety barrier (red line) and the noise barrier (green line) do not follow the path of the carriageway. The noise barrier and the median barrier provide two longitudinal element that are conspicuous and taken as a reference by the driver to judge their position on the lane and the road development. However, the real development of the road is different, and this can trigger operating errors for example by generating a wrong lane positioning.

2.4. The Logic Rule

A road must have a logic sequence. Unconsciously drivers adapt their driving to the road that they are experiencing, but this is done in dozens of seconds or also some minutes [16]. The experience that the driver has about the road they have traveled builds their expectation about the future development of the road. If those expectations are violated, the drivers generally required time to adapt to new behavior. An interesting concept is that driver’s expectations are regulated by “schemata” and a “behavioral script” as suggested by Dumbaugh et al. [32] that stated: “Taken collectively, the cognitive process used to establish traffic behavior is relatively straightforward: individuals cognitively gleam an overall sense of a roadway by relating it to similar types of roadways they have encountered previously, which produces expectations on the potential hazards they can expect to encounter (schemata), as well as the patterns of operating behavior (scripts) that they expect will minimize their exposure to these hazards. This process thus allows individuals to rapidly scan their environments and adjust their operating behavior.” These criteria are consistent with the concept of self-explaining roads [18]. An example of a road that is not self-explaining and which is not consistent with drivers’ expectations is shown in Figure 3. The example concerns a segment approaching a roundabout. Figure 3a shows the road as it appears about 150 before the roundabout. On the horizon, it is possible to see something similar to the island of a roundabout. Figure 3b is taken about 40 m before the roundabout. The roundabout seems quite clear now (schema associated with the classic roundabout layout) and drivers unconsciously have already planned their following behavior (behavioral script). However, Figure 3c, which is taken about 20 m before the roundabout, shows the real configuration and position of the roundabout itself, which is not the same as “suggested” by the road in the previous section. Figure 3d shows a satellite image of the intersection. Crash reports and a drivers’ survey have demonstrated that many drivers do not understand where to go and sometimes they took the roundabout in the wrong direction. Other drivers made hard braking or sudden maneuver in order to modify the planned direction. These are all risky maneuvers that can cause crashes and are all connected to a wrong perception of the road related to wrong expectations inducted by the road itself.
Moreover, the “not trucks allowed” symbol (D), may induce the implication that cars are not prohibited; the “go around” divider with the right arrow on the left sign (E), suggests the driver the possibility to go straight, and the yellow and black stripes sign that indicates to pass on the right, seems to also suggest that is possible to go straight. All those stimuli and information are ambiguous and may appear illogical considering that drivers must make decisions in a few seconds. Finally, the driver’s mental workload must also be considered. Drivers must be kept “active” by continuous stimuli, but too many stimuli may cause an information loss, such as in this case, because our brain cannot process too much information at the same time [11] (pp. 58–64).

2.5. Summary of the Concepts at the Base of the Study

The background provides the basic criteria considered to define the proposed methodology to review design standards based on HF. It provides some insights to let the reader be aware of these concepts. These concepts can be summarized as follow.
-
Importance of HF as factors that influence driver behavior and road safety consequently.
-
PIARC proposal to organize the different HF aspects under three main categories, define as HF rules, which are:
-
The 6 Seconds Rule, which contains the principles to deal with sight distances.
-
The Field of View Rule, which contains the principles linked to the rules of perception of the environment (considering the influence of the road and its surroundings).
-
The Logic Rule, which contains the principles of organization of the road layout based on experience and expectations.
The insights provided in the background are not sufficient to wholly comprehend the topic for readers who are not familiar with the subject; however, they provide some essentials concepts to understand the paper.

3. Methodology

The proposed methodology consists in a qualitative review procedure that investigates to which extent design standards comprehend HF. It is based on a series of checklists compiled from four different reviewers following the principles of the Delphi method. The research is based on secondary data from literature (i.e., the checklists are based on those from PIARC [20,26]).

3.1. Evaluation Procedure

To evaluate if HF are considered in the design standards four steps are proposed.
  • The identification of the analysis areas (i.e., the HF rules).
  • The identification of the investigation topics.
  • The identification of the relevant design requirements (RDRs).
  • The evaluation of the RDRs by considering the criteria contained in each subsection.
The procedure can be applied also starting from point 4 to point 1. This means starting from the road elements and the specific design standards that the road administration wants to analyze (which can be associated to a specific RDR). When the relevant element and its analysis criteria through HF have been identified, then the evaluation of the element can be made. The analysis of the Italian design standards presented in this paper follows the first option: it starts from the HF principles identified by PIARC to choose the road elements/features to analyze and, after identifying the relevant elements/features, it judges to which extent they comply with the HF principles.
As an example, at first the reviewer may decide to analyze how the design standards comply with the first rule of HF. They choose the first analysis area. Then, they decide to check the “perception and visibility” investigations topic. Therefore, they need to evaluate the following three RDRs: (1) line of sight (sight distance), identification and perception of road elements, (2) roadside elements design, and (3) use of traffic control devices. The evaluation is conducted by voting for each subsection and looking at the RDRs in the design standards.
It has been decided to use the PIARC voting terminology, to make it possible to compare the results from the Italian design standards analysis with the one obtained for other countries by PIARC [20]. The voting terminology is here summarized:
  • “Yes, Directly” (YD): was used where HF principles were explicitly included in the design.
  • “Yes, Indirectly” (YI): was used where HF principles were included in the design, but not explicitly explained.
  • “Partly” (P): was used where there was partial inclusion of HF principles, and the rationale was not explicitly discussed.
  • “No” (No): was used where no HF principles were considered.
Once all the subsections have been evaluated, a percentage based on the voting has been made for each investigation topic and each rule, to underline where possible deficiencies are present. The review is conducted considering the HF principles described in [25], with reference also to [24].
Evaluations must be conducted by HF experts or, at least, HF trained reviewers. The higher the number of reviewers, the more reduced the possibility of bias due to subjective judgments. In the review process presented in this paper, four experienced reviewers in the field of road safety, road design, and HF, have provided their judgments, which have been then compared and discussed together following the Delphi method to take the final decision.

3.2. Identification of the Investigation Topics and Subsections

Each rule has been divided into different groups, called investigation topics, based on the main aspects that will be analyzed. Furthermore, to provide detailed information about HF principles, the investigation topics are divided into subsections, which consider specific detailed aspects. Each considered investigation topics and their related subsections are provided in Table 1, Table 2 and Table 3. The contents of the table derive from the checklists presented first in [20] and successively improved in [26].

3.3. Identification of the Relevant Design Requirements and the Corresponding Road Features

RDRs are groups of specific design aspects. They provide guidance to understand the elements/features that must be considered to evaluate if an HF requirement (subsection) is satisfied or not. Each investigation topic and its relative subsections consider one or more of those groups, as described in Table 4. In addition, the same RDR can be relevant for different investigation topics. Brief descriptions of each RDR are provided in the following, together with a summary of the road’s main features and elements belonging to each RDR group.
  • Line of sight, identification, and perception of roads elements: elements/features dealing with visibility and perception aspects, such as stopping sight distance, decision sight distance, intersection visibility, curve visibility, number of visible elements which provides information, source of information for the PCLs.
  • Road surrounding and road environment design: elements/features which concur to compose the image of the road and the lateral space structures, such as the perceived environment (urban or rural), position of overpasses, presence of trees, buildings, and objects in the lateral sides of the road. This differs from the Roadside elements design because it considers the general overview of the road image (i.e., Gestalt) and not the specific characteristics of roadside elements.
  • Use and consistency of geometrical elements: the geometrical elements that compose the road and their consistency must be judged, such as the radius of subsequent curves, the straights’ length and the subsequent curve radius, and the composition of the vertical and horizontal alignment.
  • Roadside elements design: roadside elements can reduce the visibility of PCLs, are often used as a reference for lane-keeping and provide information about the development of the road. Roadside elements are for example vegetation, road safety barrier and acoustic barrier, lines of trees, but also isolated eye-catching objects.
  • Design of the areas where the road function changes: all the points where the road function and/or cross-section change must be considered such as an entrance in an urban area and change in the road category.
  • Use of traffic control devices: traffic control devices, such as signs, markings, traffic lights, colored surfaces of the road, and other devices which help the driver to understand how to behave, are extremely important to correctly perceive, see and understand PCLs. Traffic control devices also influence driver workload and the density of the field of view.

4. Results from the Application to the Italian Design Standards

4.1. First Rule: Transition Zones

As presented in the methodology, the analysis of transition zones must consider all the sight distances required from the standards. Italian design standards consider visibility a prior factor in road design and safety. They define five different kinds of sight distance: stopping sight distance (SSD), passing sight distance (PSD), lane-change sight distance (LCSD) and identification sight distance (IDSD) from D.M. 2001 [21], and the intersection sight distance (ISD) from D.M. 2006 [23]. Italian standards lack any specific definition of a decision sight distance (DSD).
SSD must be verified along all the roads. It is composed of a maneuver section and a response section. The maneuver section is calculated considering many factors, of which the most influential are initial speed, final speed, longitudinal slope, and friction coefficient. The response section time varies from 2.6 s to 1.4 s, following the Equation (1).
τ = 2.8 0.01 × ( v × 3.6 )
where τ = perception and reaction time [s], v = design speed [m/s]
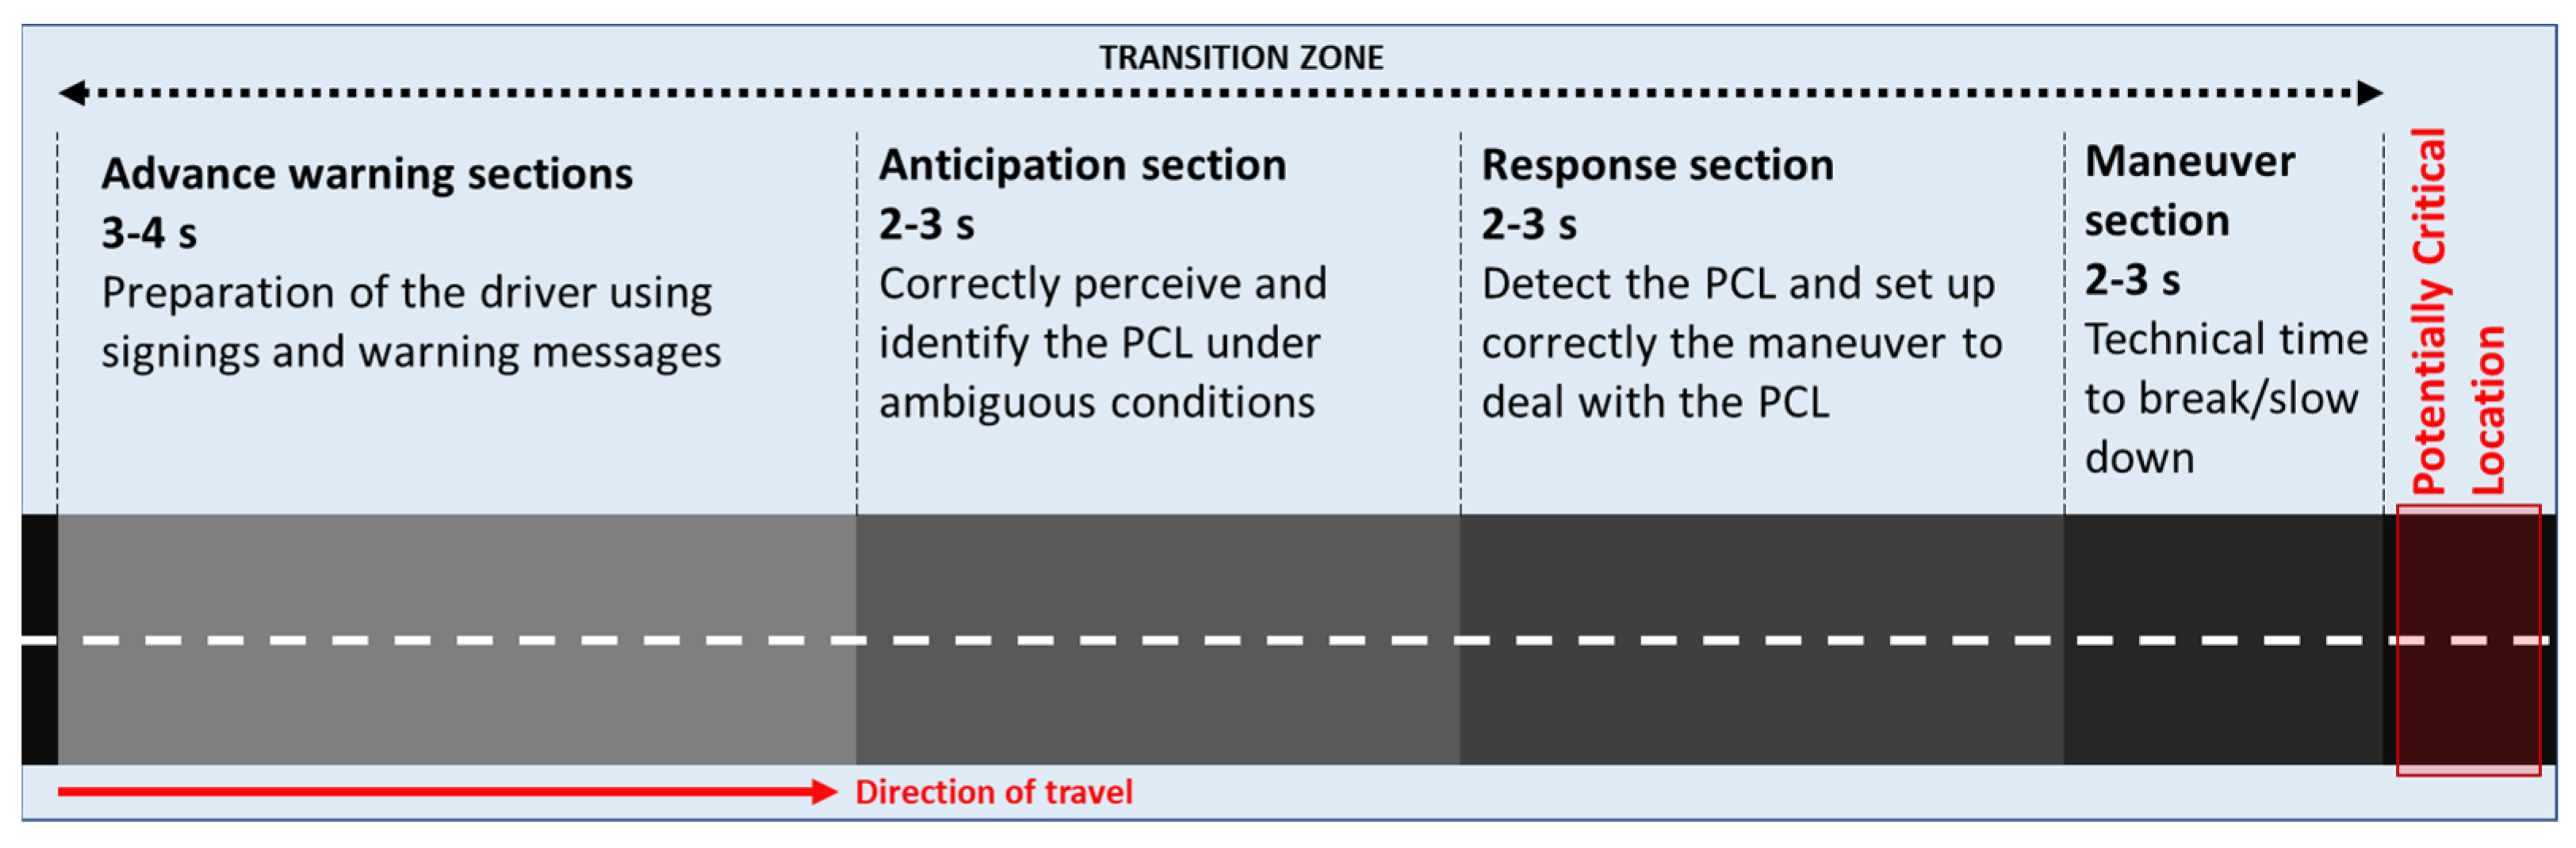
With a variable response section, the standards assume that with higher speed the driver is more focused on the road. Thus, the higher the speed, the lesser the time τ required to react. In the case of a more complex context, the perception and reaction time can be increased by 1 second for rural roads and up to 3 seconds for urban roads. Therefore, the total range of τ should be between 2.4 s and 5.6 s. This fits the PIARC response section requirement and partially fits the anticipation section requirement. The NCHRP Guidelines proposes to consider the τ (PRT: Perception-Reaction Time) as 1.6 s under good condition and 5 or more seconds under poor conditions for rural roads. Therefore, it can be drafted that Italian design standards should probably allow for an increased perception and reaction time also in rural areas if poor visibility conditions are present. This means that the introduction of a decision sight distance could be suggested.
PSD is calculated considering that the driver has already reached the speed necessary to overtake the preceding vehicle. The scheme of the maneuver is the same presented by NCHRP Guidelines [24] (page 5–10). The total distance required by the Italian design standards is presented in Equation (2).
PSD = 20 × v
where PSD = passing sight distance [m], v = design speed [m/s]
The value of 20 seconds is in line with the values proposed by NCHRP Guidelines. PIARC does not provide any specific length reference for PSD.
LCSD is a specific maneuver that must be considered when a lane change is required to move to another road (or ramp). LCSD must be considered in carriageways with at least two lanes (e.g., intersections, deviations, etc.). The total distance required is presented in Equation (3).
LCSD = 9.5 × v
where LCSD = lane-change sight distance [m]
The overall time of 9.5 seconds is composed of 5 seconds required to perceive, recognize, and understand the necessary maneuver and 4.5 seconds for the maneuver itself. Thus, it can be considered that both response and anticipation sections are present. This maneuver can be compared to the types C, D, and E Avoidance Maneuvers of NCHRP Guidelines, where the time value is yet higher. In addition, in this case, Italian design standards should probably consider a higher value of perception time, mainly where difficulties in visibility are present.
IDSD is a specific sight distance required for curve visibility. It is defined as the distance to see and perceive a change on the road. IDSD is 12 seconds long. It has been considered that drivers are not able to perceive any changes in the road beyond this distance. Therefore, for Italian design standards, the IDSD must be higher than the “transition distance” (TD). TD is the distance required to change the speed and to adapt it to correctly drive within a curve. It simply derives from the equations of motions. TD can be calculated using Equation (4).
TD = v 1 2 v 2 2 2 a
where TD = transition distance [m]; v1 = design speed of the first element [m/s]; v2 = design speed of the second element (curve speed) [m/s]; a = deceleration, 0.8 m/s2.
TD can be considered a maneuver section, but it does not have the deceleration value generally used in the braking section. The deceleration value is 0.8 m/s2, which represents a gradual change in speed that is mainly the inertial deceleration. This model represents the driver seeing the curve from a long distance and starting to adjust their behavior. Consequently, the sight distance before a bend should be always higher than, or at least equal to the TD. Comparing the TD to the PIARC maneuver section is not easy. Considering some intermediate values, PIARC suggests a maneuver section of 35 m (time of about 2 seconds) to pass from a speed of 80 km/h to a speed of 60 km/h [25]. At a speed of 80 km/h, drivers will travel about 110 m in 5 seconds, thus the maneuver, response, and anticipation sections together are about 145 m. The calculated TD for the same speed variation is 135 m. Thus, because IDSD must be higher than TD, all three sections could be considered satisfied.
ISD is a distance specific for an intersection that is based on visibility triangles, where the greater cathetus must be equal to the distance D, calculated as illustrated in Equation (5). The other cathetus must be considered as 20 m for yield-controlled intersections and as 3 m for stop-controlled intersections, starting measuring from the margin of the main road.
D = v × t
where D = required distance [m]; t = 6 s for stop-controlled intersection and 12 s yield-controlled intersection.
The Italian legislation requires that those distances must be increased by 1 second for each slope grade over 2%. It should also be emphasized that ISD considers the point of view of the vehicle entering from the secondary road, nothing is said about the visibility from the main road.
Concerning the “advance warning section”, the Italian legislation offers a wide regulation about the implementation of road signs [22], with partial explanation attributable to HF principles.
Table 5 shows the results of the evaluations made for all the subsections of the investigation topic “transition zones”.
Italian design standards consider sight-related aspects. Nevertheless, more stress must be put on the perception time, not only as an emergency action but also considering non-emergency conditions, and the concept of decision sight distance should be introduced.

4.2. First Rule: Perception and Visibility

Perception and visibility must consider the sight distances, the design of roadside elements that can affect the visibility of a PCL, and the use of traffic control devices, including signs and markings (see Section 3.3).
Concerning the curve perception, the necessity of an SSD along the overall road assures minimum visibility of the inner margin also in sharp curves. Furthermore, when a curve is hard to be correctly perceived or does not comply with driver expectations, the standards allow for improving the visibility of the outer margins with a series of single chevrons signs. Moreover, horizontal, and vertical alignment coordination is required to avoid curves’ optical illusion. No specific recommendations are provided about the environment configuration, specifically of the outer curve.
The Italian design standards provide detailed instructions about the construction of visibility triangles, also specifying which kind of objects can stay within the triangle. The visibility triangle must always be present. Intersections should be placed in tangents and the distance between them must avoid any overlapping of information (e.g., indication signs). To locate an intersection, it must be also considered the environmental characteristics, for example, the presence of tunnels.
The unmistakable right of way is entrusted by the road type and the vertical signs and markings, which must be used and must be visible. The standards require that at the intersections, all maneuvers must be clear, and each lane of the intersection must have a clear function. Road signs and marking are largely used to improve the visibility, perception, and comprehension PCLs. However, additional emphasis should be used to underline the importance of intersection geometry to correctly attribute the correct right of way.
Table 6 shows the results of the evaluations made for all the subsections of the investigation topic “perception and visibility”.
To improve the visibility and perception of PCLs, Italian design standards rely much on the use of signs and markings. Such traffic control devices can be extremely useful under specific circumstances [33], but they cannot represent the main information source. They should be complementary to the information provided by the road layout. Both the importance of such devices and the drivers’ poor attention to road signs and markings have been demonstrated [34,35].

4.3. Second Rule: Density of the Field of View

To evaluate if the standards include requirements about the density of the field of view, for each subsection, the following RDRs should be considered (see Section 3.3): road surrounding and road environment design, use and consistency of geometrical elements, roadside elements design, and use of traffic control devices.
Italian design standards do not provide any instruction about the organization of the surrounding of the road and no comments are made about the possible monotony of the elements around the road. However, they consider the monotony derived from the geometrical alignment and prevent it by introducing a maximum length of the tangents, based on the design speed. The requirement is described in (4).
L r = 22 × V pmax
where Lr = maximum tangent length [m]; Vpmax = maximum design speed for that road type [km/h]
Table 7 shows the results of the evaluations made for all the subsections of the investigation topic “density of the field of view”.
Italian design standards do not include any specific reference to the roadside configuration and its influence on driving behavior. As demonstrated, elements along roadsides have a high influence on speed and lane-keeping, both because of improved risk perception [36] and because of the enhanced perception of speed [37]. Thus, design standards should provide recommendations about the roadsides’ arrangement.

4.4. Second Rule: Lateral Space Configuration

To analyze the correct configuration of the lateral space, the following RDRs should be considered (see Section 3.3): road surrounding and road environment design, roadside elements design, and use of traffic control devices.
As already stated, Italian design standards do not account for the road environment over the roadsides. The design of roadside elements, such as safety barriers, does not consider their influence on the driver’s perception. Specifically, the orientation of the perceptual lines of the road environment is not considered. Elements along the roadside are instead useful for lane-keeping and driving stabilization and can also influence the visual perspective of the approaching road stretch [25]. Moreover, Italian design standards don’t provide any recommendation about the design of the structures passing over the road (except their minimum height above the road). The carriageway width reductions (lane width reduction or removed lane) are managed by road signs and markings and must be gradually implemented (longitudinal carriageway markings must be slanting by 2% on motorways and rural highways, and by 5% on urban and local roads). Optical framing of curves is only partially addressed by the standards, which underline the need for chevrons and curve delineators if the curve is hard to be perceived or not expected. If the chevrons are not visible against the background, a high-contrasting frame can be used. When road speed and visibility conditions require additional cues to increase the visibility of the road course, Italian design standards allow for the use of roadside delineators along the whole road. The distance between each delineator in a curve varies based on the radius of the curve: low radii require a denser delineation: this will help the optical framing of the curve and the curve perception. Standards also suggest using a series of chevrons when the curve is not easily perceived. The importance of an adequate curve framing is also addressed by NHCRP Guidelines. They stated that the composition of the field of view strongly influences the curvature perception and the speed choice. They identify two different sections of the road concerning the curve traveling: an open-loop anticipatory component (far view) for predicting curvature and steering angle, and a closed-loop compensatory component (near view) for correcting deviations from the desired path [38]. They also underline the importance of geometric alignment and delineation features for a correct perception of the curve.
Table 8 shows the results of the evaluations made for all the subsections of the investigation topic “lateral space structure”.
In addition, the analysis of the lateral space structure confirms that Italian design standards lack any instruction on roadsides configuration. The presence and absence of roadside elements such as safety barriers can influence the choice of speed and lane-keeping [14].

4.5. Second Rule: Depth of the Field of View

Road environment design and the consistency of geometrical elements are the main RDRs that should be analyzed to evaluate the depth of the field of view. However, also the design of the areas where the road function changes should be considered (see Section 3.3).
No requirements or advice concerning the first subsection are present in the standards, underlining once more that the space beyond the roadsides is not considered. Instead, requirements are present regarding optical illusion. Optical illusions let the driver think that the road configuration is different from reality. These mainly address the horizontal and vertical alignment. The spiral transitions scale parameter (A) must range between R/3 and R, where R is the radius of the curve. The first condition allows the spiral transition has a deflection angle of at least 3°, which is the limit to correctly perceiving the presence of the spiral transition. The second condition allows having a correct perception of the curve. To avoid curvature misperception, it is necessary to avoid consecutive spiral transitions unless they link two curves in different directions. In addition, curves must be designed so that their development is equal to the distance traveled in at least 2.5 seconds. This minimum length allows one to clearly perceive the curve and reduces the possibility of “curve cutting” [39]. Moreover, tangents must have a minimum length to be correctly perceived. The minimum length is based on the maximum speed reached in the tangent, as shown in Table 9.
Finally, requirements for horizontal and vertical alignment coordination are present. These requirements consider mainly the position between curves and vertical transition. The horizontal and vertical alignment coordination is addressed also by the NCHRP Guidelines [24] (page 6-4).
No considerations in the Italian standards about optical illusion derived from the environment outside the roadsides are provided. Some requirements are also provided about road course detection. These requirements are mainly geometrical. First, as described in Section 4.1, an IDSD is required approaching each curve and this allows the visibility of the road track along that stretch. Furthermore, as observed in Section 4.3, a maximum length of tangent segments based on design speed is required, and this increases the possibility to see a curve at the end of a tangent, limiting the speeding. Roadsides can be underlined using roadside delineators when road speed and visibility conditions require additional cues to increase the visibility of the road course. As for the previous aspects, no requirements concerning the space behind the roadsides are provided.
Table 10 shows the results of the evaluations made for all the subsections of the investigation topic “depth of the field of view”.
Italian design standards do not account for specific elements that can keep the attention of the driver or even distract him, except for the regulation on the use of advertising signs.

4.6. Third Rule: Change in Road Function

To investigate if the standards comply with those HF aspects, the design of the areas where the road function changes must be considered. Moreover, also the composition of the road surrounding and road environment design, and the use of traffic control devices, should be considered (see Section 3.3).
Italian design standards do not consider the necessity of optical change in the road environment and configuration to underline the change in the road function. The entrances and exits of towns and villages are identified by a specific vertical sign, but no other cues, eye-catching objects, or road configuration modifications are addressed. The town entrance sign must be placed where the urban area begins by administrative boundaries. However, they do not always coincide with the limits of the town. Thus, they can be placed where the urban environment is not yet clearly perceivable. In this case, the change of the road function is not clear, and the driver may not correctly modify their driving behavior. It is stated that the signs must be visible, but no specific distances are given.
Table 11 shows the results of the evaluations made for all the subsections of the investigation topic “change in road function”.
Italian design standards lack guidance about transition zones between rural and urban areas, and no instructions about perceptual treatments are provided. The effectiveness of transition zones with adequate visual cues or cross-section modification has been widely proven in NCHRP Report 737 [40].

4.7. Third Rule: Clear Road Development

To evaluate if the road course is not ambiguous, the following RDRs should be considered (see Section 3.3): use and consistency of geometrical elements, roadside elements design, and design of the areas where the road function changes.
Table 12 shows the results of the evaluations made for all the subsections of the investigation topic “clear road development”.
Italian design standards do not provide any specific recommendations about the perception of road development. In Italy, many new roads are present that deviate from old existing roads, modifying their geometry, but nothing is said about how to manage the road environment and all the possible wrong cues that could mislead the drivers.

4.8. Third Rule: Effects of Driving Pre-Programs

Driving pre-programs refer to expectations. Drivers must expect the development of the road consistent with the real development. The relevant design requirements to analyze are (see Section 3.3): road surrounding and road environment design, use and consistency of geometrical elements, and design of the areas where the road function changes.
Expectations are partially considered in Italian design standards. First, it is stated that the road category must be clearly defined and easy to be recognized so that the driver can perceive the road function (self-explaining road concept). Different speeds are required in the different road categories. Then a consistency between the geometrical road elements is required (see below). However, all these aspects focus mainly on the geometrical design and cross-section composition, and all the perceptive cues that can be derived from the environment are left to the use of signs and markings. Transition zones concerning road alignment are also considered in the speed model (see Section 4.1, “IDSD” and “TD”).

Geometrical Consistency

Geometrical consistency is widely considered in Italian design standards, which are based on speed consistency between consecutive geometrical elements. Tangents have a maximum length (see Section 4.3) and a minimum length (see Section 4.5) based on the design speed. This allows for maintaining consistency during the whole road. In addition, the curves must be consistent. First, two consecutive curves must have a similar radius. The thresholds of the difference between the two radii are represented in the Koppel diagram [41]. Furthermore, Italian design standards require that the curve radius must also be compared to the length of the preceding tangent: for a tangent longer than 300 m, the curve radius must be higher than 400 m, instead of for a tangent shorter than 300 m, the radius of the subsequent curve must be equal or greater than the tangent length.
Finally, the standards are based on a speed model, where the maximum speed within a curve is set based on the safe speed required for physical balance, and the maximum speed in a tangent is equal to the maximum road design speed. To improve the consistency of the road track, the following limitations are present:
  • road with maximum design speed ≥ 100 km/h: passing from a higher speed element to a lower speed element, a maximum speed difference of 10 km/h is required, and a maximum speed difference of 20 km/h is required within two consecutive curves.
  • road with a maximum design speed < 100 km/h: passing from a higher speed element to a lower speed element, a maximum speed difference of 5 km/h is required, and a maximum speed difference of 20 km/h is required within two consecutive curves.
Table 13 shows the results of the evaluations made for all the subsections of the investigation topic “effects of driving pre-programs”.
Italian design standards totally satisfy the requirements of road alignment consistency, but they lack more detailed considerations on the relationship between driver’s expectation and different type of PCLs (as an example a pedestrian crossing is not expected on a rural two-lane two-way highway. Thus, something must be said on how to deal with it).

4.9. Third Rule: Overload of Information Processing

To evaluate the overload of information processing, the use of traffic control devices must be first analyzed. Secondary RDRs are also the line of sight, the identification and perception of road elements, and road surrounding and road environment design (see Section 3.3).
Avoidance of close multiple PCLs is only partially considered by Italian design standards, which provide instructions only for intersections and driveways. Intersections should be placed at a distance that avoids any conflict between the perception of the two intersections, also considering the vertical signs. The suggested distance in a rural environment is at least 500 m. Furthermore, single private accesses are admitted only on local rural roads or local and collector urban roads, while in rural and urban arterial, accesses are admitted only if coordinated in major driveways. A minimum distance is also set between each driveway (access) and between driveways and intersections. In all the above cases, the SSD and the ISD must be guaranteed. Other PCLs (such as bust stops, pedestrian crossings, and changes in the road function) are not considered.
Considering information about PCLs, Italian design standards rely mostly on vertical signs, requiring that information on PCLs is provided before the PCL. It is also required to limit the number of information provided to the driver at the same time, to reduce the workload required to elaborate on all the information.
Table 14 shows the results of the evaluations made for all the subsections of the investigation topic “overload of information processing”.

4.10. Third Rule: Deficiencies in Traffic Control Devices

The RDR to be analyzed is the use of traffic control devices (see Section 3.3).
Traffic control devices must be installed where they are visible (also considering the environment background), and the symbols must be readable and clear. Symbols and letter dimensions vary according to the road type and so, according to the speed characteristics: higher speed means that signs must be visible from a higher distance, thus letters and symbols must be bigger. The use of color contrast between the sign background and the symbols and letters is also considered. Sometimes signs include specific simplified symbols which sometimes may mislead the drivers (mainly considering the road direction), but this is not considered by the standards. Such symbols can erroneously confirm a wrong course on the road.
Table 15 shows the results of the evaluations made for all the subsections of the investigation topic “deficiencies in traffic control devices”.

5. Discussion of the Results

5.1. Comprehensive Results of the Italian Design Standards Analysis

The overall results are presented in Table 16 as percentages derived from the voting terminology. The YD and YI evaluations have been considered together under the “Y” voting terminology. As highlighted by the results, Italian design standards for new roads sufficiently consider the principles that address the first and the third rules. Nevertheless, they mainly focus on the road geometrical alignment (both horizontal and vertical alignment). Aspects related to non-geometrical features are instead not well analyzed or sometimes not even considered. This is greatly highlighted by the results of the field of view rule, where 50% of the HF demands are not satisfied and the remaining 50% is only partially satisfied. Finally, the analysis highlights a lack in addressing the change in road function. Standards take for granted an almost automatic recognition of a different road environment, warning the driver only with a sign, but this is not sufficient.
Considering all the rules together, according to Table 16, the HF requirements are 28 % fulfilled, 41% partially fulfilled, and 31% not fulfilled. The latter means that about one-third of the requirements are not considered at all in the standards, thus some additional efforts must be taken to include HF in Italian road design standards, mainly concerning the aspects related to the roadsides’ design. The overall results are like the ones of the other countries presented in the PIARC document [20], which lack instructions and/or recommendations concerning roadsides design.

5.2. Use of the Methodology

This methodology has been developed to allow the evaluation of how design standards account for HF. The methodology is derived from the one firstly proposed by PIARC [20], but it proposes a systematic approach to facilitate the reviewer job, highlighting the specific aspects to be evaluated for each different road feature. Thus, the proposed methodology can be used both by people designated to improve the design standards (i.e., define some new design standards or updated existing ones), both by a designer who wants to improve the safety level of their design, looking for aspects to be considered which are not part of the design standards. Consequently, such a methodology can also be used during road safety audits to understand how to potentiate the design, or even as a reference for target road safety inspections. Its “checklist-structure” allows it to be included in other procedures. Thus, it can be complementary to other audit/inspection procedures. It refers only to HF and thus to the concurring factors of accident causation (for instance it does not account for the possible severity of a crash). Thus, it is suggested to use it as a complementary methodology and not a standalone one. Moreover, as stated in Section 3.3 it must be remembered that evaluations must be conducted by HF experts or, at least, HF-trained reviewers.

5.3. Strengths and Weaknesses of the Proposed Methodology

The research presented in this paper proposed a qualitative analysis of design standards that allows identifying where standards are consistent with HF principles and where they are not. One of the strengths of the proposed methodology is that it can be easily conducted by a trained HF reviewer and, as stated in Section 5.2, it can also be conducted during road safety audits or road safety inspections. It does not provide specific design solutions, but it helps the designer to identify where some additional design efforts are necessary. However, this can also be seen as a weakness. The suggested analysis is qualitative and does not provide specific values to which compare the standards (e.g., define an exact optimal lane width). This may lead to subjective judgments and thus different results. For this reason, trained HF specialists must conduct the review and when possible, there should be more than one. Moreover, future research should try to move a step forward in this field analyzing the possible outcome (in terms of driver behaviour parameters) considering the main HF aspects proposed by PIARC, providing more detailed recommendations and values where possible. Detailed analyses are suggested mainly concerning the aspects related to the composition of the field of view. Indeed, the aspects related to the field of view demonstrated to be the harder to be judged, mainly because they are the less studied by researcher and few detailed information are available.
Another suggestion is to develop specific guidelines to better and uniformly conduct the evaluation. An important contribution and content of such guidelines can be also given by the dissemination of use cases (case studies) with both good and bad results, which can underline even more how much different factors and the combination of different factors related to HF may influence the safety of a road.
Finally, it has been found that accounting for HF in road design means considering specific aspects of the road that sometimes occur at specific locations. For this reason, future updates of the design standards may be developed so that the design standards should provide main references for design and set some essential standards but also allow the designer to choose the better solution to implement and solve specific problems. The design standards should probably be more similar to guidelines than to strict regulations.

6. Conclusions

A methodological approach has been proposed to evaluate if national design standards comply with the HF requirements using a systematic approach. The methodology is composed of four main steps: the identification of the analysis areas (i.e., the HF rules), the identification of the main investigation topics, the identification of the relevant design requirements, and the evaluation of the RDRs by considering the criteria contained in each subsection. To test the suitability of the methodology to review national design standards, Italian design standards have been reviewed. Overall, the standards review highlighted that the Italian design standards focus mainly on road geometrical features and that many aspects concerning the influence of the road environment on driving are not considered. Particularly, the density of the field of view [15], the lateral space structure [36], and the use of roadside elements to improve the perception of a PCL [40] are not considered as influencing aspects of the design. Such aspects, along with expectations [16] and road design consistency, if considered, will result in more effective self-explaining roads [17]. It is suggested that future standards, updates, and improvements should also include a specific recommendation about road environment configuration. Including HF principles in road design is possible, as demonstrated by the current Canadian design standards, which stress on HF aspects such as road consistency, perception, and influence of the environment [42], and this goes in the direction of the Safe System approach. Moreover, it means enhancing, even more, the safety level of our roads.
The proposed methodology appears to be quite easy to implement and allows for the identification of a lack of HF requirements in the design standards through a structured and systematic approach. Even if qualitative, the use of this approach allows highlighting where road administration and legislators should conduct additional efforts to enhance safety, identifying weaknesses and the strengths of design standards through HF aspects. It has also been concluded that additional information and guidelines with specific examples about the influence of HF can help reduce the subjectivity of the judgments. Understanding how to improve design standards, accounting for HF, will greatly improve the safety level of our roads.

Author Contributions

Conceptualization, A.P.; methodology, A.P.; validation, A.P., M.M., and V.B.; formal analysis, M.M. and V.B.; investigation, A.P.; writing—original draft preparation, A.P.; writing—review and editing, M.M. and V.B.; visualization, A.P. and V.B.; supervision, M.M.; project administration, M.M. All authors have read and agreed to the published version of the manuscript.

Funding

This research received no external funding.

Institutional Review Board Statement

Not applicable.

Informed Consent Statement

Not applicable.

Data Availability Statement

Not applicable.

Acknowledgments

A special thanks goes to Lorenzo Domenichini, retired from the University of Florence, whose experience in this field has been greatly appreciated.

Conflicts of Interest

The authors declare no conflict of interest.

References

  1. Treat, J.R.; Tumbas, N.S.; McDonald, S.T.; Shinar, D.; Hume, R.D.; Mayer, R.E.; Stansifer, R.L.; Castellan, N.J. Tri-Level Study of the Causes of Traffic Crashes: Final Report. Executive Summary; Report No. DOT-HS-034-3-535-79-TAC(S); Institute for Research in Public Safety: Bloomington, IN, USA, 1979. [Google Scholar]
  2. Birth, S.; Demgensky, B.; Sieber, G. Relationship between Human Factors and the Likelihood of Single-Vehicle Crashes on Dutch Motorways; Report for Rijkswaterstaat Dienst Verkeer en Scheepvaart: Utrecht, The Netherlands, 2015. [Google Scholar]
  3. Theeuwes, J. Sampling information from the road environment. In Human Factors for Highway Engineers; Elsevier: Amsterdam, The Netherlands, 2002; pp. 131–146. [Google Scholar]
  4. Čičković, M. Influence of human behaviour on geometric road design. Transp. Res. Procedia 2016, 14, 4364–4373. [Google Scholar] [CrossRef] [Green Version]
  5. Perco, P. Desirable Length of Spiral Curves for Two-Lane Rural Roads. Transp. Res. Rec. J. Transp. Res. Board 2006, 1961, 1–8. [Google Scholar] [CrossRef]
  6. Calvi, A. A Study on Driving Performance Along Horizontal Curves of Rural Roads. J. Transp. Saf. Secur. 2015, 7, 243–267. [Google Scholar] [CrossRef]
  7. McGee, H.; Moore, W.; Knapp, B.; Sanders, J. Decision Sight Distance for Highway Design and Traffic Control Requirements. Transp. Res. Rec. 1979, 736, 11–13. [Google Scholar]
  8. Domenichini, L.; Branzi, V.; Meocci, M. Virtual testing of speed reduction schemes on urban collector roads. Accid. Anal. Prev. 2018, 110, 38–51. [Google Scholar] [CrossRef] [PubMed]
  9. Branzi, V.; Meocci, M.; Domenichini, L.; la Torre, F. Drivers’ performance in response to engineering treatments at pedestrian crossings. Adv. Transp. Stud. 2018, 1, 55–70. [Google Scholar] [CrossRef]
  10. Recarte, M.A.; Nunes, L.M. Mental Workload While Driving: Effects on Visual Search, Discrimination, and Decision Making. J. Exp. Psychol. Appl. 2003, 9, 119–137. [Google Scholar] [CrossRef] [PubMed]
  11. Yanko, M.R.; Spalek, T.N. Route familiarity breeds inattention: A driving simulator study. Accid. Anal. Prev. 2013, 57, 80–86. [Google Scholar] [CrossRef] [PubMed]
  12. Intini, P.; Berloco, N.; Colonna, P.; Ranieri, V.; Ryeng, E. Exploring the relationships between drivers’ familiarity and two-lane rural road accidents. A multi-level study. Accid. Anal. Prev. 2018, 111, 280–296. [Google Scholar] [CrossRef] [PubMed]
  13. Ben-Bassat, T.; Shinarb, D. Effect of shoulder width, guardrail and roadway geometry on driver perception and Behaviour. Accid. Anal. Prev. 2011, 43, 2142–2152. [Google Scholar] [CrossRef] [PubMed]
  14. Domenichini, L.; La Torre, F.; Branzi, V.; Nocentini, A. Speed behaviour in work zone crossovers. A driving simulator study. Accid. Anal. Prev. 2017, 98, 10–24. [Google Scholar] [CrossRef] [PubMed]
  15. Green, M. Roadway Human Factors: From Science to Application; Lawyers and Judges Publishing Company: Tucson, AZ, USA, 2018; ISBN 13: 978-1-930056-60-2. [Google Scholar]
  16. Theeuwes, J. Self-explaining roads: What does visual cognition tell us about designing safer roads? Cogn. Res. Princ. Implic. 2021, 6, 15. [Google Scholar] [CrossRef] [PubMed]
  17. Theeuwes, J.; Godthelp, H. Self-explaining roads. Saf. Sci. 1995, 19, 217–225. [Google Scholar] [CrossRef]
  18. Paliotto, A. Development of a Human Factors Evaluation Procedure for Network-Wide Road Safety Assessments. Ph.D. Thesis, Università degli Studi di Firenze, Technische Universität Darmstadt, Firenze, Italy, 2022. Available online: http://hdl.handle.net/2158/1275592 (accessed on 1 September 2022).
  19. Tingvall, C.; Haworth, N. Vision zero—An ethical approach to safety and mobility. In Proceedings of the 6th ITE International Conference Road Safety & Traffic Enforcement: Beyond 2000, Melbourne, Australia, 6–7 September 1999. [Google Scholar]
  20. PIARC. Human Factors in Road Design. Review of Design Standards in Nine Countries; PIARC: Paris, France, 2012. [Google Scholar]
  21. Ministero delle Infrastrutture e dei Trasporti. Norme Funzionali e Geometriche per la Costruzione delle Strade; Ministero delle Infrastrutture e dei Trasporti: Rome, Italy, 2001.
  22. Ministero delle Infrastrutture e dei Trasporti. Nuovo Codice Della Strada; Decreto Legislativo N. 285 del 30/04/1992 e successivi aggiornamenti; Ministero delle Infrastrutture e dei Trasporti: Rome, Italy, 1992.
  23. Ministero delle Infrastrutture e dei Trasporti. Norme Funzionali e Geometriche per la Costruzione Delle Intersezioni Stradali; Ministero delle Infrastrutture e dei Trasporti: Rome, Italy, 2006.
  24. NCHRP. Human Factors Guidelines, 2nd ed.; Report 600; National Cooperative Highway Research Program (NCHRP), Transport Research Board: Washington, DC, USA, 2012; ISBN 978-0-309-25816-6. [Google Scholar]
  25. PIARC. Human Factors Guidelines for a Safer Man-Road Interface; 2016R20EN; PIARC: Paris, France, 2016. [Google Scholar]
  26. PIARC. Road Safety Evaluation Based on Human Factors Method; 2018R27EN; World Road Association (PIARC): Paris, France, 2019. [Google Scholar]
  27. Domenichini, L.; Paliotto, A.; Meocci, M.; Branzi, V. Application and Evaluation of a Non-Accident-Based Approach to Road Safety Analysis Based on Infrastructure-Related Human Factors. Sustainability 2022, 14, 662. [Google Scholar] [CrossRef]
  28. Paliotto, A.; Meocci, M.; Branzi, V. Application of an Innovative Network Wide Road Safety Assessment Procedure Based on Human Factors; Advances in Road Infrastructure and Mobility, 493–510. IRF 2021; Sustainable Civil Infrastructures; Springer: Cham, Switzerland, 2022. [Google Scholar] [CrossRef]
  29. Birth, S.; Staadt, H.; Sporbeck, O. Guideline for Optical Orientation by Planting, (HVO); Ministry of Infrastructure and Regional Development: Brandeburg, Germany, 2002.
  30. Computational Illusion Team. Alliance for Breakthrough between Mathematics and Sciences; Optical Illusions on Roads and Measures for Their Reduction; Japan Science and Technology Agency CREST Project; Computational Illusion Team: Tokyo, Japan, 2013. [Google Scholar]
  31. Dumbaugh, E.; Merlin, L.; Signor, K.; la Jeunesse, S.; Carter, D. Implementing Safe Systems in the United States: Guiding Principles and Lessons from International Practice; Collaborative Science Center for Road Safety, CSCRS-R7; Florida Atlantic University: Boaca Raton, FL, USA, 2009. [Google Scholar]
  32. Lorenz, H. Trassierung und Gestaltung von Strassen und Autobahnen; Bauverlag Gmb: Wiesbaden/Berlin, Germany, 1971. [Google Scholar]
  33. Martens, M. Assessing Road Sign Perception: A Methodological Review. Transp. Hum. Factors 2000, 2, 347–357. [Google Scholar] [CrossRef]
  34. Costa, M.; Simone, A.; Vignali, V.; Lantieri, C.; Bucchi, A.; Dondi, G. Looking behavior for vertical road signs. Transp. Res. Part F Traffic Psychol. Behav. 2014, 23, 147–155. [Google Scholar] [CrossRef]
  35. Shoman, M.; Simone, A.; Vignali, V. Looking behavior to vertical road signs on rural roads. MOJ Civ. Eng. 2018, 4, 75–79. [Google Scholar]
  36. Calvi, A. Does Roadside Vegetation Affect Driving Performance? Driving Simulator Study on the Effects of Trees on Drivers’ Speed and Lateral Position. Transp. Res. Rec. J. Transp. Res. Board 2015, 2518, 1–8. [Google Scholar] [CrossRef]
  37. Elliott, M.A.; McColl, V.A.; Kennedy, J.V. Road Design Measures to Reduce Drivers’ Speed via ‘Psychological’ Processes: A Literature Review; TRL REPORT 564; TRL: Wokingham, UK, 2003. [Google Scholar]
  38. Donges, E. Two-level model of driver steering behavior. Hum. Factors 1978, 20, 691–707. [Google Scholar] [CrossRef]
  39. Durth, W.; Bald, J.S.; Wolff, N. Wirksamkeit von Trassierungstechnischen Ausgleichsmaßnahmen bei Unter-Oder Überschreitung von Trassierungsgrenzwerten; Schulßbericht des FA2.076G18E des BMV; TH Damrstadt: Darmstadt, Germany, 1986. [Google Scholar]
  40. NCHRP. Design Guidance for High-Speed to Low-Speed Transition Zones for Rural Highways; Report 737; Transportation Research Board, Nationalcooperative Highway Research Program: Washington, DC, USA, 2012. [Google Scholar]
  41. Forschungsgesellschaft für Straßen- und Verkehrswesen. Richtlinien für die Anlage von Straßen: (RAS), Arbeitsgruppe Straßenentwurf; Teil (RAS-L): Linienführung; Forschungsgesellschaft für Strassen- und Verkehrswesen: Köln, Germany, 1995. [Google Scholar]
  42. TAC. Geometric Design Guide for Canadian Roads; Transport Association of Canada: Ottawa, ON, Canada, 2017. [Google Scholar]
Figure 1. Definition of the transition zone as described by PIARC [25].
Futuretransp 02 00050 g001
Figure 2. Example of a diverging line created by the roadside elements (median safety barrier and noise barrier), image from Google Maps.
Futuretransp 02 00050 g002
Figure 3. Unclear roundabout, modified from Google Street View.
Futuretransp 02 00050 g003
Table 1. Investigation topics and their related subsections for the First rule of HF [20,26].
FIRST RULE
1.1 Transition zones
Maneuver section exists?
Driver’s response section exists (2–3 s)?
Anticipation section exists (2–3 s)?
Advance warning section exists (about 4 s)?
1.2 Perception and visibility
The critical point is visible and easily identifiable
Curves are clearly visible
Intersection—visibility triangle from the minor road is not obstructed
Intersection—minor road has an unmistakable right of way
Table 2. Investigation topics and their related subsections for the Second rule of HF [20,26].
SECOND RULE
2.1 Density of the field of view
Monotonous approaching sections or surroundings are avoided
Lengthy visible approaching sections before critical points are avoided (subconscious speeding)
2.2 Lateral space structure
Structures over the road support optimal lane-tracking
Eye-catching objects are not disturbing lane-tracking
Carriageway width reductions are well delineated
Roadside objects appear to be vertical
Optical framing of the curve
2.3 Depth of the field of view
Dominant eye-catching objects support lane-tracking and detection of PCLs
Optical illusion avoided
The course of the road is clearly visible
Table 3. Investigation topics and their related subsections for the Third rule of HF [20,26].
THIRD RULE
3.1 Change in road function
Visual cues reinforce the changed road function
Eye-catching objects are used to reinforce the change
The transition zone is adequate
3.2 Clear road development
Change of road direction is visible and clearly perceived
Eye-catching objects are used to focus attention on the changed alignment of the road and there are no misleading visual cues along the old road alignment
3.3 Effects of driving pre-programs
Requirement for a new driving program recognized and changes are introduced to “re-program” driving habits and routine
Road alignment and PCL’s position conform with driver expectations
Transition zones and PCLs: understandable, progressively implemented and correctly located
3.4 Overload of information processing
Multiple critical points are avoided
Driver progressively informed of multiple critical points
3.5 Deficiencies in traffic control devices
Traffic control devices are visible against the background and signs and letters unambiguous and readable
Traffic control devices appropriate for road characteristics
Road alignment consistent with traffic control devices
Traffic control devices in accordance with driver expectations
Table 4. Investigation topics and their related Relevant Design Requirements.
Investigation TopicRelevant Design Requirement
1.1 Transition zones
  • Line of sight, identification, and perception of roads elements
1.2 Perception and visibility
  • Line of sight, identification, and perception of roads elements
  • Roadside elements design
  • Use of traffic control devices
2.1 Density of the field of view
  • Road surrounding and road environment design
  • Use and consistency of geometrical elements
  • Roadside elements design
  • Use of traffic control devices
2.2 Lateral space structure
  • Road surrounding and road environment design
  • Roadside elements design
  • Use of traffic control devices
2.3 Depth of the field of view
  • Line of sight, identification, and perception of roads elements
  • Road surrounding and road environment design
  • Roadside elements design
3.1 Change in road function
  • Roadside elements design
  • Use of traffic control devices
3.2 Clear road development
  • Use and consistency of geometrical elements
  • Roadside elements design
  • Use of traffic control devices
3.3 Effects of driving pre-programs
  • Road surrounding and road environment design
  • Use and consistency of geometrical elements
  • Roadside elements design
3.4 Overload of information processing
  • Line of sight, identification, and perception of roads elements
  • Road surrounding and road environment design
  • Use of traffic control devices
3.5 Deficiencies in traffic control devices
  • Use of traffic control devices
Table 5. Evaluations of the “transition zones” investigation topic.
Transition ZonesVote
Maneuver section exists?YD
Driver’s response section exists (2–3 s)?YD
Anticipation section exists (2–3 s)?P
Advance warning section exists (about 4 s)?P
Table 6. Evaluations of the “perception and visibility” investigation topic.
Perception and VisibilityVote
The critical point is visible and clearly identifiableP
Curves are visibleYD
Intersection—visibility triangle from the minor road is not obstructedYI
Intersection—minor road has an unmistakable right of wayP
Table 7. Evaluations of the “density of the field of view” investigation topic.
Density of the Field of ViewVote
Monotonous approaching sections or surroundings are avoidedNO
Lengthy visible approaching sections before critical points are avoided (subconscious speeding)P
Table 8. Evaluations of the “lateral space structure” investigation topic.
Lateral Space StructureVote
Structures over the road support optimal lane-trackingNO
Eye-catching objects are not disturbing lane-trackingNO
Carriageway width reductions are well delineatedP
Roadside objects appear to be verticalNO
Optical framing of the curveP
Table 9. Minimum length of tangents based on tangent maximum speed.
Speed [km/h]405060708090100110120130140
Minimum Length [m]3040506590115150190250300360
Table 10. Evaluations of the “depth of the field of view” investigation topic.
Depth of the Field of ViewVote
Dominant eye-catching objects support lane-tracking and detection of PCLsNO
Optical illusion avoidedP
The course of the road clearly visibleP
Table 11. Evaluations of the “Change in road function” investigation topic.
Change in Road FunctionVote
Visual cues reinforce the changed road functionNO
Eye-catching objects are used to reinforce the changeNO
The transition zone is adequateP
Table 12. Evaluations of the “clear road development” investigation topic.
Clear Road DevelopmentVote
Change of road direction is visible and clearly perceivedNO
Eye-catching objects are used to focus attention on the changed alignment of the road and there are no misleading visual cues along the old road alignmentNO
Table 13. Evaluations of the “effects of driving pre-programs” investigation topic.
Effects of Driving Pre-ProgramsVote
Requirement for a new driving program recognized and changes are introduced to “re-program” driving habits and routineP
Road alignment conforms with driver expectationsYD
Transition zones and PCLs: visible, understandable, and progressively implementedP
Table 14. Evaluations of the “overload of information processing” investigation topic.
Overload of Information ProcessingVote
Multiple critical points are avoidedP
Driver progressively informed of multiple critical pointsYI
Table 15. Evaluations of the “deficiencies in traffic control devices” investigation topic.
Deficiencies in Traffic Control DevicesVote
Traffic control devices are visible against the background and signs and letters are unambiguous and readableYD
Traffic control devices appropriate for road characteristicsYI
Road alignment consistent with traffic control devicesNO
Traffic control devices in accordance with driver expectationsYI
Table 16. HF demand fulfillment of the Italian design standards.
HF DemandYPNO
6 seconds Rule50%50%0%
1.1 Transition zones50%50%0%
1.2 Perception and visibility50%50%0%
Field of view Rule0%50%50%
2.1 Density of the field of view0%50%50%
2.2 Lateral space structure0%20%60%
2.3 The depth of the field of view supports optimal lane-tracking and reliable orientation 0%67%33%
Logic Rule36%29%36%
3.1 Change in road function0%33%67%
3.2 Change of road direction despite a dominant eye-catching orientation line0%0%100%
3.3 Effects of driving pre-programs33%67%0%
3.4 Overload of information processing50%50%0%
3.5 Deficiencies in traffic control devices75%0%25%
TOTAL28%41%31%
Publisher’s Note: MDPI stays neutral with regard to jurisdictional claims in published maps and institutional affiliations.

