
Assessing the Impacts of Crowdshipping Using Public Transport: A Case Study in a Middle-Sized Greek City


Abstract
:1. Introduction
2. Literature Review
3. Methodology
3.1. Description of the Experiment
3.2. Methodological Approach
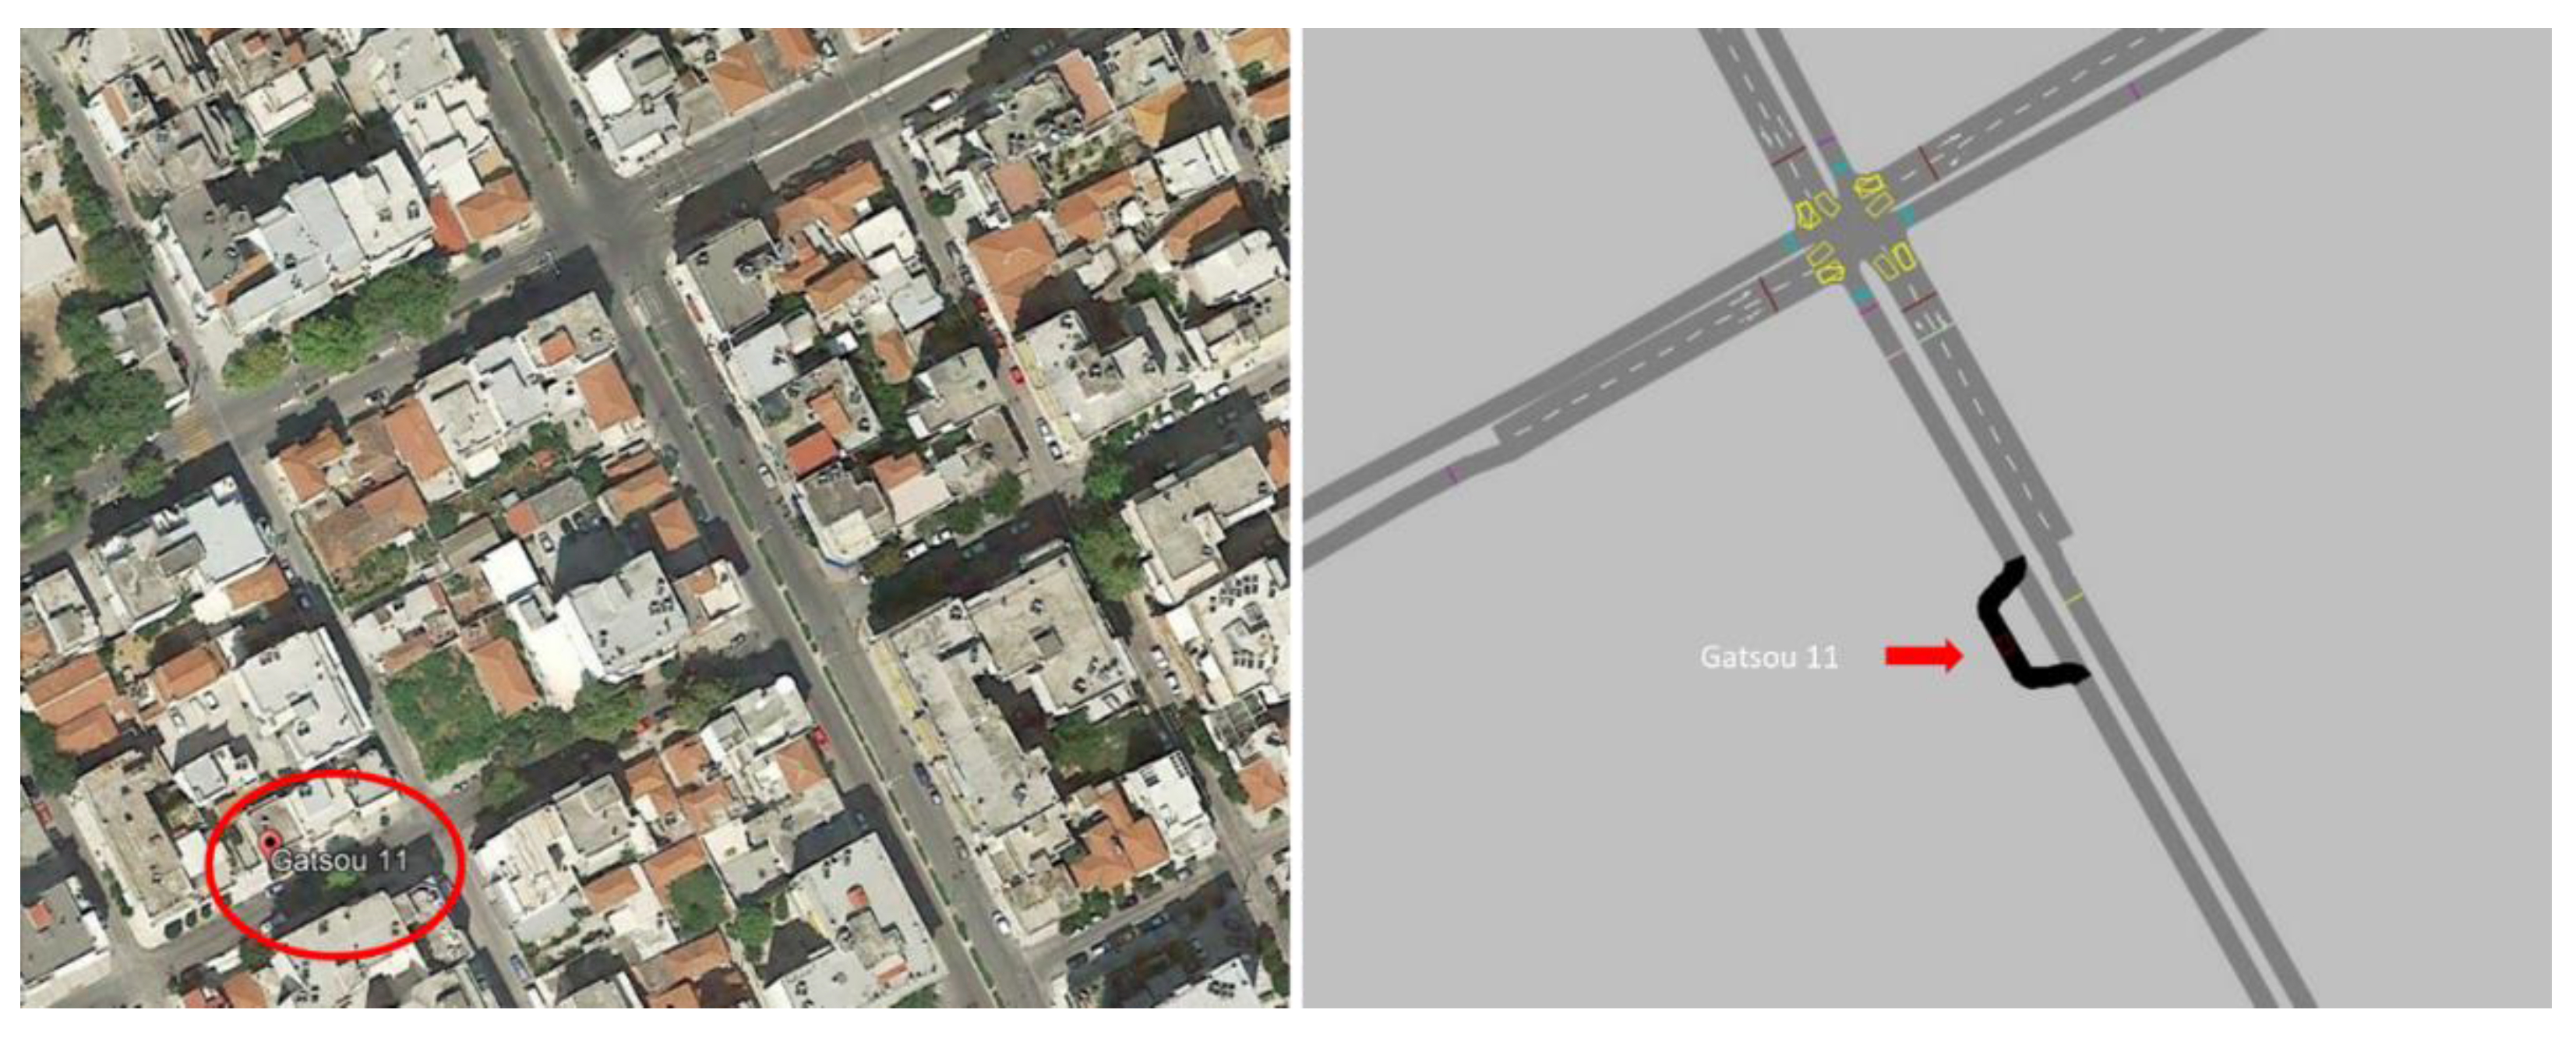
3.2.1. Location of Smart Lockers’ Installation
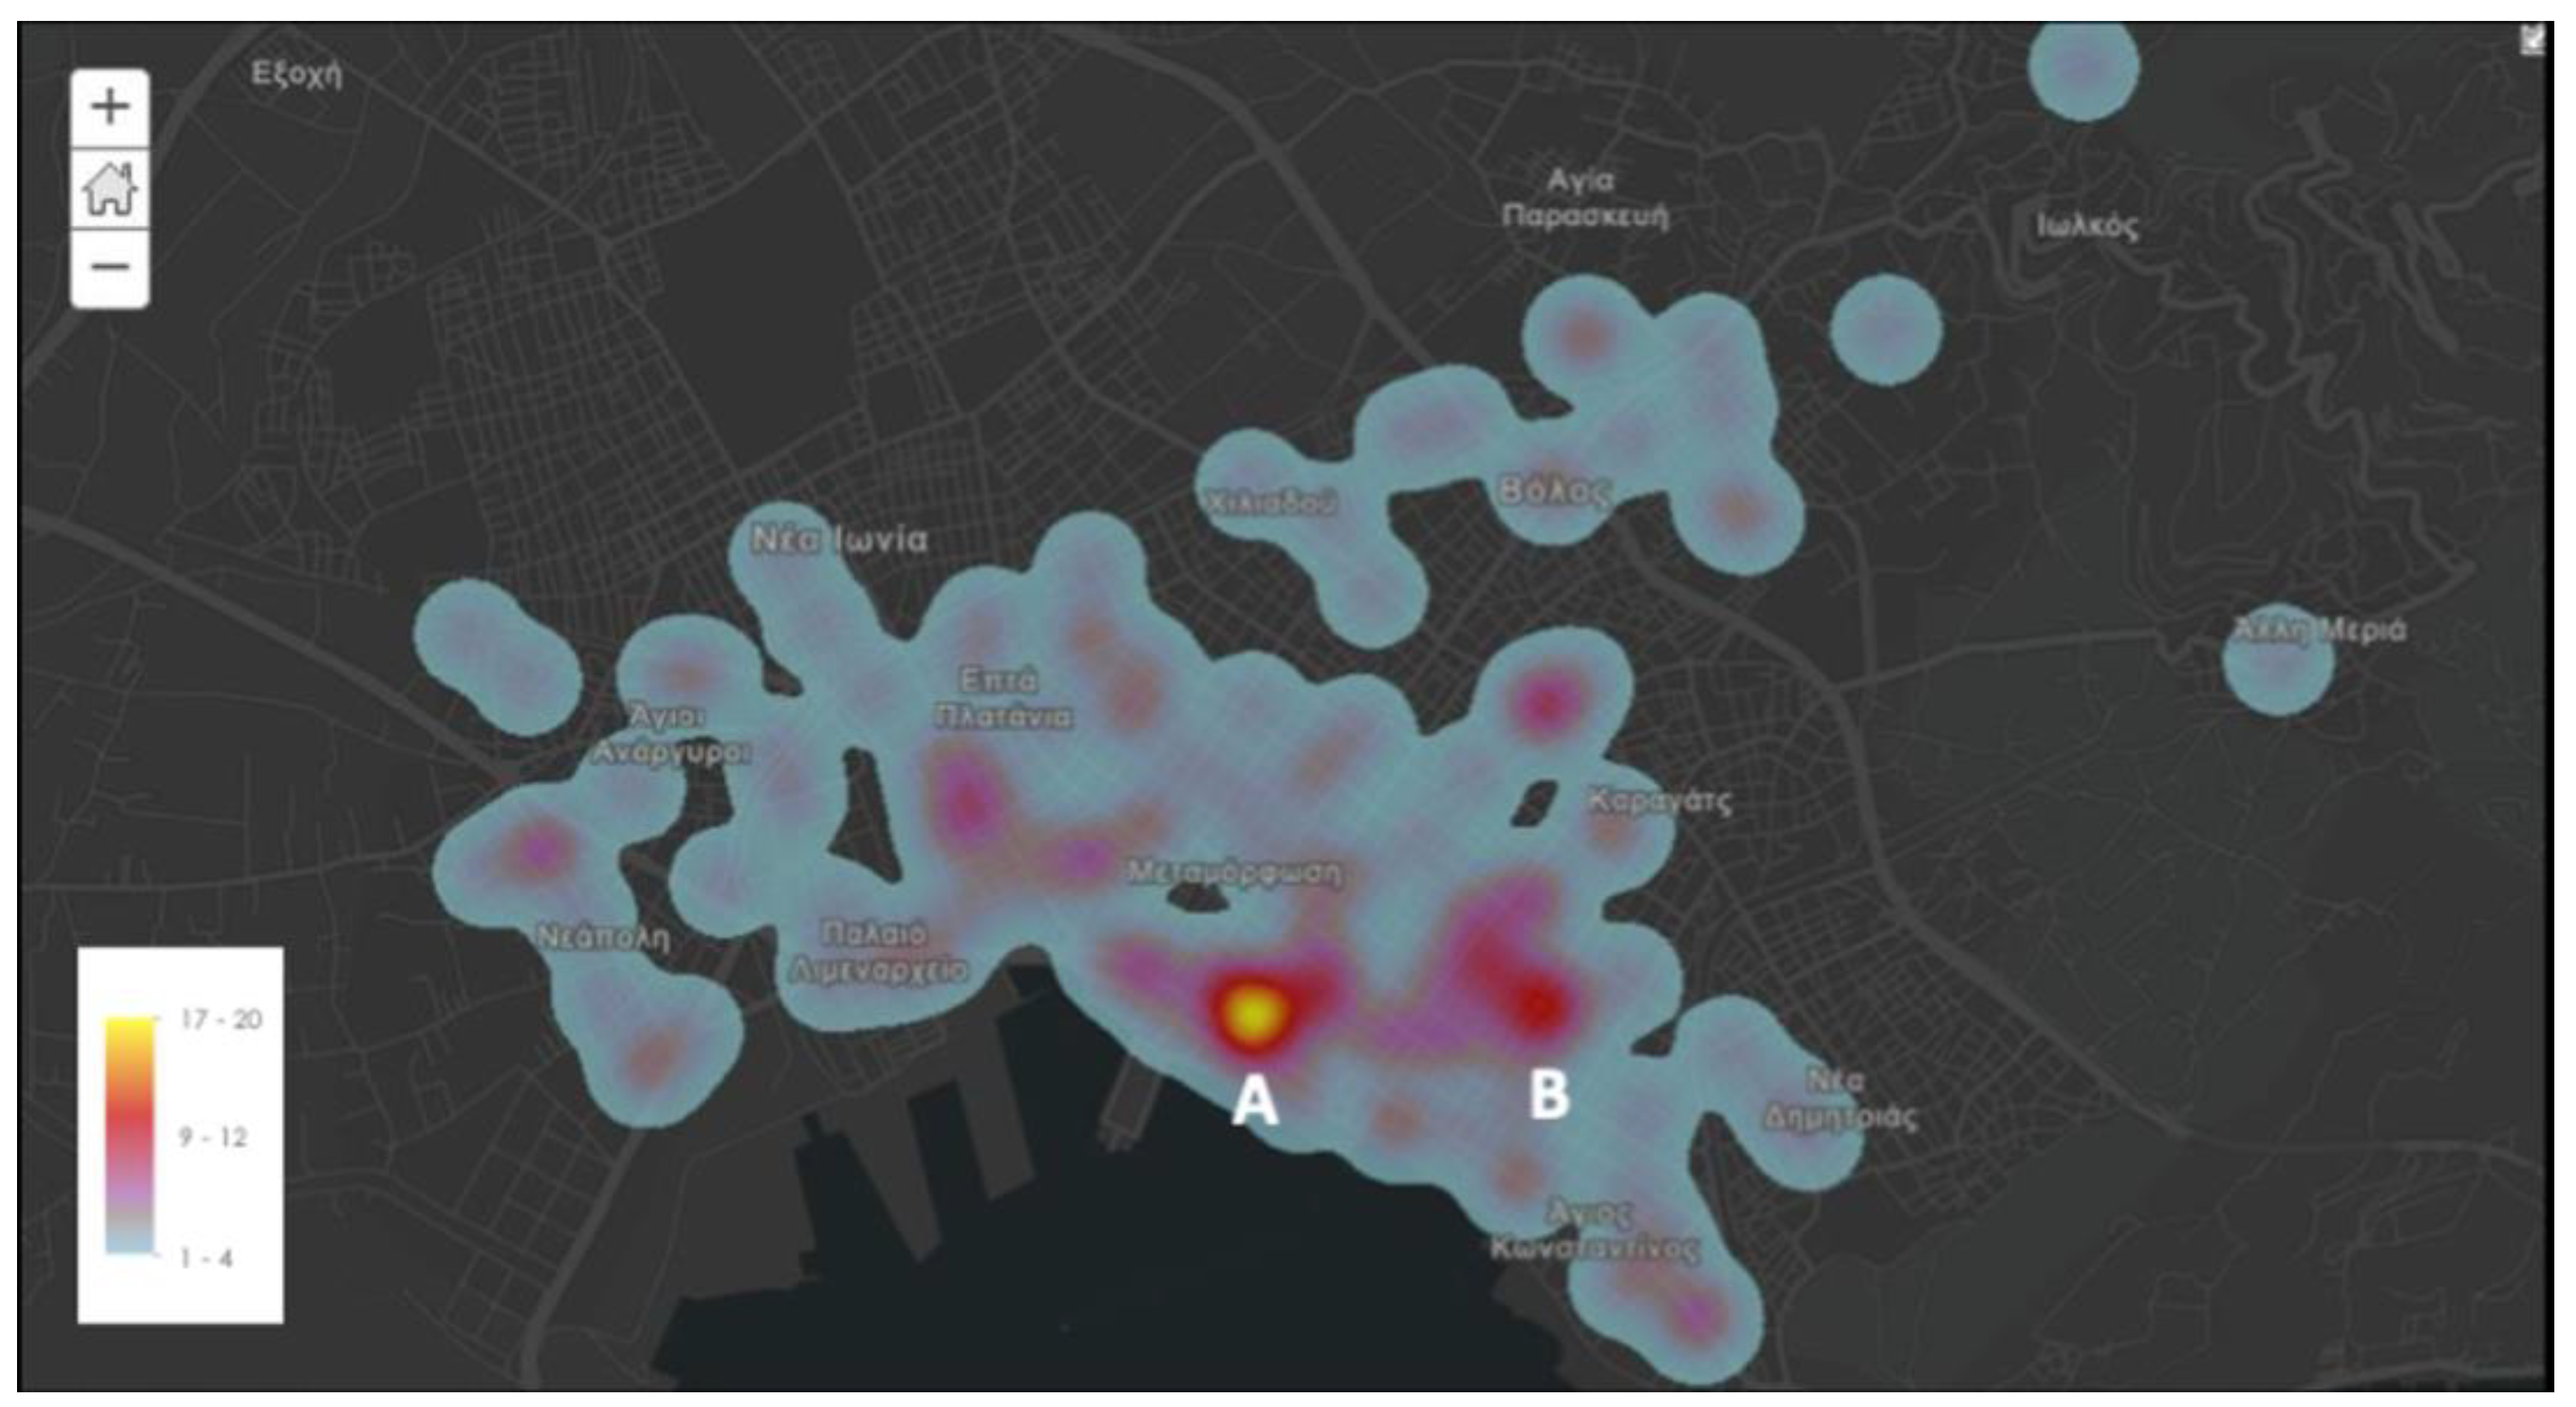
3.2.2. Service Areas around Smart Locker Installations
3.2.3. Demand
- i freight vehicle (1–4 for mopeds and 5, 6 for minivans).
- TD total number of deliveries that are to be performed per vehicle within the service area.
- d deliveries that are to be performed per vehicle and weigh more than 2 kg (given that parcels’ volume data were unavailable, this assumes also that parcels can easily fit into the lockers’ boxes).
3.2.4. Scenario Configuration
- Base scenario: Point-to-door deliveries (no smart locker installations).
- Cluster 1: Two smart locker installations (Location A and Depot E).
- Cluster 2: Two smart locker installations (Location B and Depot E).
- Cluster 3: Three smart locker installations (Location A, B and Depot E).
3.2.5. Evaluation
- the operator in monitoring and controlling the company’s performance (O1–O13), and
- the public authorities in assessing the impacts of crowdshipping, projected to the whole network performance (N1–N9).
3.2.6. Simulation Analysis Approach
- the Zip code, address, and weight information per delivery.
- the exact address of the depot.
- the number of available drivers: six.
- the number of available vehicles: four mopeds and two minivans.
- the mopeds’ and minivans’ maximum payload capacity: 55 kg and 180 kg, respectively.
- the driver’s work time: 09:00–17:30.
- the driver’s break duration and time window: 30 min, 12:30–14:30.
- the depot visit duration in-between roundtrips: 30 min (for unloading/loading and preparatory administration tasks for the new trip).
3.2.7. PTV Vissim Configuration
- n denotes the number of runs.
- ⌈ ⌉ ceiling function.
- σ sample’s standard deviation (based on five initial runs).
- a significance level.
- za/2 threshold value (for 95% confidence interval, za/2 = 1.96).
- E error range at the set confidence level (taken as 10% in this study which is considered acceptable for general practice [46]).
4. Results
4.1. Cross Scenario Analysis Results—Indicators
4.2. Cross Scenario Analysis Results—LSI
5. Concluding Discussion
5.1. Limitations
5.2. Further Research
Author Contributions
Funding
Institutional Review Board Statement
Informed Consent Statement
Data Availability Statement
Acknowledgments
Conflicts of Interest
Appendix A
Appendix A.1. Description of the Available Datasets
Appendix A.2. Coding the Traffic Model in PTV Vissim
Appendix A.3. Model Calibration and Validation
Appendix B

| No. of Orders | Veh-km | Service Time | Round Trips | Total Weight | Load Factor | CO [g] | CO2 [g] | NOx [g] | PM [g] | VOC [g] | |
|---|---|---|---|---|---|---|---|---|---|---|---|
| Scenario 0—Base | |||||||||||
| M1 | 57 | 23.53 | 6:18 | 1 | 50/55 | 65% | 98.4 | 1523.9 | 3.8 | 1.0 | 74.6 |
| M2 | 38 | 16.29 | 4:19 | 1 | 38/55 | 45% | 68.2 | 1055.0 | 2.7 | 0.1 | 51.7 |
| M3 | 58 | 29.57 | 6:34 | 1 | 54/55 | 55% | 123.7 | 1915.1 | 4.8 | 1.3 | 93.8 |
| M4 | 66 | 26.83 | 7:02 | 1 | 53/55 | 57% | 112.2 | 1737.6 | 4.4 | 1.2 | 85.1 |
| V1 | 55 | 40.17 | 6:22 | 1 | 177/180 | 53% | 340.1 | 17,695.5 | 39.7 | 2.0 | 16.9 |
| V2 | 73 | 55.19 | 8:09 | 1 | 179/180 | 84% | 467.3 | 24,312.1 | 54.5 | 2.7 | 23.2 |
| All | 347 | 191.58 | 14:44 | 1 | 60% | 1210.0 | 48,239.3 | 110.0 | 8.2 | 345.3 | |
| Vehicle utilization factor | 26.9% | ||||||||||
| No of crowdsourced deliveries | 0 | ||||||||||
| Scenario 2—1_15_50 | |||||||||||
| M1 | 72 | 37.77 | 7:53 | 1 | 55/55 | 66% | 158.0 | 2446.2 | 6.2 | 1.6 | 119.8 |
| M2 | 71 | 39.62 | 8:29 | 2 | 77/55 | 37% | 165.8 | 2566.0 | 6.5 | 1.7 | 125.7 |
| M3 | 72 | 22.23 | 7:33 | 1 | 55/55 | 50% | 93.0 | 1439.7 | 3.6 | 1.0 | 70.5 |
| V1 | 53 | 29.03 | 6:00 | 1 | 153/180 | 57% | 245.8 | 12,788.2 | 28.7 | 1.4 | 12.2 |
| V2 | 75 | 64.58 | 8:30 | 1 | 136/180 | 64% | 546.8 | 28,448.5 | 63.8 | 3.2 | 27.1 |
| All | 343 | 193.23 | 14:25 | 1.2 | 55% | 1209.4 | 47,688.6 | 108.8 | 8.9 | 355.3 | |
| Vehicle utilization factor | 26.7% | ||||||||||
| No of crowdsourced deliveries | 4 | ||||||||||
| Scenario 3—1_15_70 | |||||||||||
| M1 | 74 | 27.84 | 8:27 | 2 | 77/55 | 38% | 116.5 | 1803.0 | 4.6 | 1.2 | 88.3 |
| M3 | 68 | 31.69 | 7:27 | 1 | 55/55 | 59% | 132.6 | 2052.4 | 5.2 | 1.4 | 100.5 |
| M4 | 72 | 39.49 | 7:52 | 1 | 55/55 | 58% | 165.2 | 2557.6 | 6.5 | 1.7 | 125.3 |
| V1 | 75 | 66.01 | 8:28 | 1 | 109/180 | 41% | 558.9 | 29,078.5 | 65.2 | 3.2 | 27.7 |
| V2 | 53 | 27.83 | 6:00 | 1 | 180/180 | 43% | 235.6 | 12,259.6 | 27.5 | 1.4 | 11.7 |
| All | 342 | 192.86 | 14:14 | 1.2 | 48% | 1208.8 | 47,751.0 | 108.9 | 8.9 | 353.5 | |
| Vehicle utilization factor | 26.6% | ||||||||||
| No of crowdsourced deliveries | 5 | ||||||||||
| Scenario 4—1_30_20 | |||||||||||
| M1 | 58 | 35.96 | 6:33 | 1 | 55/55 | 63% | 150.4 | 2328.9 | 5.9 | 1.6 | 114.1 |
| M2 | 66 | 24.99 | 7:04 | 1 | 52/55 | 57% | 104.5 | 1618.5 | 4.1 | 1.1 | 79.3 |
| M3 | 34 | 7.74 | 3:47 | 1 | 30/55 | 32% | 32.4 | 501.3 | 1.3 | 0.3 | 24.5 |
| M4 | 56 | 29.37 | 6:21 | 1 | 54/55 | 58% | 122.9 | 1902.1 | 4.8 | 1.3 | 93.2 |
| V1 | 71 | 57.16 | 8:00 | 1 | 176/180 | 75% | 484.0 | 25,179.9 | 56.5 | 2.8 | 24.0 |
| V2 | 56 | 36.79 | 6:23 | 1 | 178/180 | 60% | 311.5 | 16,206.6 | 36.4 | 1.8 | 15.5 |
| All | 341 | 192.01 | 14:08 | 1 | 58% | 1205.7 | 47,737.3 | 108.9 | 8.8 | 350.5 | |
| Vehicle utilization factor | 26.5% | ||||||||||
| No of crowdsourced deliveries | 6 | ||||||||||
| Scenario 5—1_30_50 | |||||||||||
| M2 | 71 | 35.09 | 8:26 | 2 | 75/55 | 37% | 146.8 | 2272.6 | 5.7 | 1.5 | 111.3 |
| M3 | 73 | 24.19 | 7:36 | 1 | 55/55 | 60% | 101.2 | 1566.7 | 4.0 | 1.0 | 76.7 |
| M4 | 65 | 37.54 | 7:15 | 1 | 55/55 | 53% | 157.1 | 2431.3 | 6.1 | 1.6 | 119.1 |
| V1 | 59 | 42.19 | 6:48 | 1 | 179/180 | 51% | 357.2 | 18,585.4 | 41.7 | 2.1 | 17.7 |
| V2 | 67 | 51.46 | 7:30 | 1 | 173/180 | 74% | 435.7 | 22,669.0 | 50.9 | 2.5 | 21.6 |
| All | 335 | 190.47 | 13:35 | 1.2 | 55% | 1198.0 | 47,524.8 | 108.4 | 8.8 | 346.4 | |
| Vehicle utilization factor | 26.1% | ||||||||||
| No of crowdsourced deliveries | 12 | ||||||||||
| Scenario 6—1_30_70 | |||||||||||
| M1 | 48 | 19.59 | 5:19 | 1 | 48/55 | 54% | 82.0 | 1268.7 | 3.2 | 0.8 | 62.1 |
| M2 | 52 | 26.59 | 5:58 | 1 | 52/55 | 48% | 111.2 | 1722.1 | 4.3 | 1.2 | 84.3 |
| M3 | 30 | 18.57 | 3:40 | 1 | 27/55 | 32% | 77.7 | 1202.7 | 3.0 | 0.8 | 58.9 |
| M4 | 75 | 27.3 | 7:51 | 1 | 53/55 | 45% | 114.2 | 1768.1 | 4.5 | 1.2 | 86.6 |
| V1 | 51 | 29.03 | 5:52 | 1 | 178/180 | 62% | 245.8 | 12,788.2 | 28.7 | 1.4 | 12.2 |
| V2 | 75 | 66.2 | 8:30 | 1 | 174/180 | 59% | 560.5 | 29,162.2 | 65.4 | 3.2 | 27.8 |
| All | 331 | 187.28 | 13:10 | 1 | 50% | 1191.4 | 47,911.9 | 109.2 | 8.6 | 332.0 | |
| Vehicle utilization factor | 25.8% | ||||||||||
| No of crowdsourced deliveries | 16 | ||||||||||
| Scenario 7—2_15_20 | |||||||||||
| M1 | 45 | 21.52 | 5:00 | 1 | 35/55 | 41% | 90 | 1394 | 4 | 1 | 68 |
| M2 | 54 | 27.05 | 6:00 | 1 | 54/55 | 50% | 113 | 1752 | 4 | 1 | 86 |
| M3 | 69 | 30.5 | 7:42 | 1 | 55/55 | 55% | 128 | 1975 | 5 | 1 | 97 |
| M4 | 50 | 19.08 | 5:27 | 1 | 50/55 | 62% | 80 | 1236 | 3 | 1 | 61 |
| V1 | 53 | 31.25 | 6:07 | 1 | 180/180 | 43% | 265 | 13,766 | 31 | 2 | 13 |
| V2 | 75 | 65.66 | 8:25 | 1 | 176/180 | 70% | 555 | 28,876 | 65 | 3 | 28 |
| All | 346 | 195.06 | 14:41 | 1 | 54% | 1230.3 | 48,998.6 | 111.7 | 9.0 | 352.0 | |
| Vehicle utilization factor | 26.9% | ||||||||||
| No of crowdsourced deliveries | 1 | ||||||||||
| Scenario 8—2_15_50 | |||||||||||
| M1 | 59 | 23.79 | 6:27 | 1 | 55/55 | 56% | 99.5 | 1540.8 | 3.9 | 1.0 | 75.5 |
| M2 | 54 | 26.25 | 6:06 | 1 | 54/55 | 46% | 109.8 | 1700.1 | 4.3 | 1.1 | 83.3 |
| M3 | 42 | 31.77 | 4:59 | 1 | 33/55 | 29% | 132.9 | 2057.6 | 5.2 | 1.4 | 100.8 |
| M4 | 61 | 13.7 | 6:23 | 1 | 49/55 | 22% | 57.3 | 887.3 | 2.2 | 0.6 | 43.5 |
| V1 | 65 | 38.29 | 7:09 | 1 | 179/180 | 62% | 324.2 | 16,867.4 | 37.8 | 1.9 | 16.1 |
| V2 | 61 | 63.23 | 7:15 | 1 | 173/180 | 49% | 535.4 | 27,853.8 | 62.5 | 3.1 | 26.6 |
| All | 342 | 197.03 | 14:19 | 1 | 44% | 1259.2 | 50,906.9 | 116.0 | 9.1 | 345.6 | |
| Vehicle utilization factor | 26.6% | ||||||||||
| No of crowdsourced deliveries | 5 | ||||||||||
| Scenario 9—2_15_70 | |||||||||||
| M1 | 61 | 34.96 | 6:58 | 1 | 55/55 | 44% | 146.3 | 2264.2 | 5.7 | 1.5 | 110.9 |
| M2 | 81 | 29.57 | 8:29 | 1 | 55/55 | 53% | 123.7 | 1915.1 | 4.8 | 1.3 | 93.8 |
| M3 | 73 | 34.47 | 8:29 | 2 | 80/55 | 33% | 144.2 | 2232.4 | 5.6 | 1.5 | 109.3 |
| V1 | 75 | 64.32 | 8:29 | 1 | 173/180 | 80% | 544.6 | 28,334.0 | 63.6 | 3.1 | 27.0 |
| V2 | 51 | 29.16 | 5:51 | 1 | 179/180 | 53% | 246.9 | 12,845.4 | 28.8 | 1.4 | 12.3 |
| All | 341 | 192.48 | 14:16 | 1.2 | 53% | 1205.7 | 47,591.1 | 108.6 | 8.9 | 353.3 | |
| Vehicle utilization factor | 26.6% | ||||||||||
| No of crowdsourced deliveries | 6 | ||||||||||
| Scenario 10—2_30_20 | |||||||||||
| M1 | 64 | 34.67 | 7:19 | 1 | 55/55 | 56% | 145.0 | 2245.4 | 5.7 | 1.5 | 110.0 |
| M2 | 77 | 22.31 | 8:30 | 2 | 81/55 | 39% | 93.3 | 1444.9 | 3.6 | 1.0 | 70.8 |
| M3 | 74 | 39.47 | 8:03 | 1 | 54/55 | 58% | 165.1 | 2556.3 | 6.5 | 1.7 | 125.2 |
| V1 | 72 | 40.92 | 7:52 | 1 | 172/180 | 48% | 346.5 | 18,025.9 | 40.4 | 2.0 | 17.2 |
| V2 | 54 | 60.58 | 6:32 | 1 | 180/180 | 69% | 512.9 | 26,686.5 | 59.9 | 3.0 | 25.5 |
| All | 341 | 197.95 | 14:16 | 1.2 | 54% | 1262.9 | 50,958.9 | 116.1 | 9.1 | 348.6 | |
| Vehicle utilization factor | 26.6% | ||||||||||
| No of crowdsourced deliveries | 6 | ||||||||||
| Scenario 11—2_30_50 | |||||||||||
| M1 | 74 | 48.27 | 8:27 | 1 | 55/55 | 46% | 201.9 | 3126.2 | 7.9 | 2.1 | 153.1 |
| M3 | 76 | 23.37 | 8:29 | 2 | 81/55 | 40% | 97.8 | 1513.6 | 3.8 | 1.0 | 74.1 |
| M4 | 61 | 26.83 | 6:37 | 1 | 53/55 | 62% | 112.2 | 1737.6 | 4.4 | 1.2 | 85.1 |
| V1 | 61 | 33.44 | 6:41 | 1 | 180/180 | 58% | 283.1 | 14,730.9 | 33.0 | 1.6 | 14.1 |
| V2 | 65 | 68.81 | 7:43 | 1 | 172/180 | 61% | 582.6 | 30,311.9 | 68.0 | 3.4 | 28.9 |
| All | 337 | 200.72 | 13:57 | 1.2 | 53% | 1277.7 | 51,420.1 | 117.2 | 9.3 | 355.3 | |
| Vehicle utilization factor | 26.4% | ||||||||||
| No of crowdsourced deliveries | 10 | ||||||||||
| Scenario 12—2_30_70 | |||||||||||
| M1 | 67 | 36.52 | 7:36 | 1 | 55/55 | 51% | 152.8 | 2365.2 | 6.0 | 1.6 | 115.8 |
| M3 | 74 | 35.73 | 8:30 | 2 | 78/55 | 33% | 149.5 | 2314.0 | 5.8 | 1.5 | 113.3 |
| M4 | 67 | 28.23 | 7:17 | 1 | 55/55 | 67% | 118.1 | 1828.3 | 4.6 | 1.2 | 89.5 |
| V1 | 55 | 42.56 | 6:31 | 1 | 179/180 | 56% | 360.4 | 1874.8 | 42.1 | 2.1 | 17.9 |
| V2 | 71 | 52.8 | 7:49 | 1 | 173/180 | 78% | 447.1 | 23,259.2 | 52.2 | 2.6 | 22.2 |
| All | 334 | 195.84 | 13:43 | 1.2 | 57% | 1227.8 | 31,641.6 | 110.7 | 9.0 | 358.8 | |
| Vehicle utilization factor | 26.2% | ||||||||||
| No of crowdsourced deliveries | 13 | ||||||||||
| Scenario 13—3_15_20 | |||||||||||
| M1 | 50 | 31.35 | 5:47 | 1 | 47/55 | 42% | 131.2 | 2030.4 | 5.1 | 1.4 | 99.4 |
| M2 | 48 | 18.3 | 5:18 | 1 | 43/55 | 40% | 76.6 | 1185.2 | 3.0 | 0.8 | 58.0 |
| M3 | 45 | 20.61 | 5:07 | 1 | 48/55 | 44% | 86.2 | 1334.8 | 3.4 | 0.9 | 65.4 |
| M4 | 73 | 28.34 | 7:46 | 1 | 55/55 | 57% | 118.6 | 1835.4 | 4.6 | 1.2 | 89.9 |
| V1 | 76 | 61.56 | 8:29 | 1 | 176/180 | 69% | 521.2 | 27,118.2 | 60.8 | 3.0 | 25.9 |
| V2 | 51 | 33.69 | 5:56 | 1 | 178/180 | 57% | 285.3 | 14,841.0 | 33.3 | 1.6 | 14.2 |
| All | 343 | 193.85 | 14:23 | 1 | 52% | 1219.0 | 48,344.9 | 110.3 | 8.9 | 352.8 | |
| Vehicle utilization factor | 26.7% | ||||||||||
| No of crowdsourced deliveries | 4 | ||||||||||
| Scenario 14—3_15_50 | |||||||||||
| M1 | 36 | 7.67 | 3:58 | 1 | 25/55 | 26% | 32.1 | 496.7 | 1.3 | 0.3 | 24.3 |
| M2 | 70 | 43 | 7:54 | 1 | 55/55 | 48% | 179.9 | 2784.9 | 7.0 | 1.9 | 136.4 |
| M3 | 47 | 20.76 | 5:15 | 1 | 52/55 | 53% | 86.9 | 1344.5 | 3.4 | 0.9 | 65.8 |
| M4 | 59 | 25.84 | 6:28 | 1 | 55/55 | 74% | 108.1 | 1673.5 | 4.2 | 1.1 | 82.0 |
| V1 | 77 | 54.87 | 8:27 | 1 | 176/180 | 70% | 464.6 | 24,171.1 | 54.2 | 2.7 | 23.1 |
| V2 | 49 | 39.6 | 5:52 | 1 | 176/180 | 46% | 335.3 | 17,444.4 | 39.1 | 1.9 | 16.6 |
| All | 338 | 191.74 | 13:54 | 1 | 53% | 1206.8 | 47,915.2 | 109.3 | 8.8 | 348.2 | |
| Vehicle utilization factor | 26.3% | ||||||||||
| No of crowdsourced deliveries | 9 | ||||||||||
| Scenario 15—3_15_70 | |||||||||||
| M1 | 72 | 29.94 | 7:43 | 1 | 55/55 | 67% | 125.3 | 1939.1 | 4.9 | 1.3 | 95.0 |
| M3 | 73 | 38.46 | 8:28 | 2 | 76/55 | 29% | 160.9 | 2490.8 | 6.3 | 1.7 | 122.0 |
| M4 | 65 | 31.71 | 7:17 | 1 | 55/55 | 57% | 132.7 | 2053.7 | 5.2 | 1.4 | 100.6 |
| V1 | 75 | 66.03 | 8:27 | 1 | 173/180 | 74% | 559.1 | 29,087.3 | 65.3 | 3.2 | 27.7 |
| V2 | 51 | 28.3 | 5:53 | 1 | 179/180 | 50% | 239.6 | 12,466.6 | 28.0 | 1.4 | 11.9 |
| All | 336 | 194.44 | 13:48 | 1.2 | 55% | 1217.5 | 48,037.5 | 109.6 | 9.0 | 357.2 | |
| Vehicle utilization factor | 26.3% | ||||||||||
| No of crowdsourced deliveries | 11 | ||||||||||
| Scenario 16—3_30_20 | |||||||||||
| M1 | 74 | 28.76 | 8:24 | 1 | 76/55 | 31% | 120.3 | 1862.6 | 4.7 | 1.2 | 91.2 |
| M3 | 69 | 30.68 | 7:23 | 1 | 55/55 | 66% | 128.4 | 1987.0 | 5.0 | 1.3 | 97.3 |
| M4 | 67 | 40.95 | 7:42 | 1 | 55/55 | 63% | 171.3 | 2652.1 | 6.7 | 1.8 | 129.9 |
| V1 | 52 | 31.16 | 5:58 | 1 | 173/180 | 41% | 263.8 | 13,726.5 | 30.8 | 1.5 | 13.1 |
| V2 | 73 | 62.05 | 8:16 | 1 | 177/180 | 75% | 525.4 | 27,334.0 | 61.3 | 3.0 | 26.1 |
| All | 335 | 193.6 | 13:43 | 1 | 55% | 1209.2 | 47,562.2 | 108.5 | 8.9 | 357.6 | |
| Vehicle utilization factor | 26.2% | ||||||||||
| No of crowdsourced deliveries | 12 | ||||||||||
| Scenario 17—3_30_50 | |||||||||||
| M1 | 74 | 38.02 | 8:29 | 2 | 70/55 | 34% | 159.1 | 2462.4 | 6.2 | 1.6 | 120.6 |
| M3 | 69 | 28.9 | 7:29 | 1 | 55/55 | 72% | 120.9 | 1871.7 | 4.7 | 1.3 | 91.7 |
| M4 | 58 | 29.87 | 6:34 | 1 | 54/44 | 50% | 125.0 | 1934.5 | 4.9 | 1.3 | 94.7 |
| V1 | 48 | 34.7 | 5:41 | 1 | 178/180 | 62% | 293.8 | 15,285.9 | 34.3 | 1.7 | 14.6 |
| V2 | 76 | 58.7 | 8:27 | 1 | 170/180 | 49% | 497.0 | 25,858.3 | 58.0 | 2.9 | 24.7 |
| All | 325 | 190.19 | 12:40 | 1.2 | 53% | 1195.8 | 47,412.8 | 108.1 | 8.8 | 346.2 | |
| Vehicle utilization factor | 25.5% | ||||||||||
| No of crowdsourced deliveries | 22 | ||||||||||
| Scenario 18—3_30_70 | |||||||||||
| M1 | 67 | 36.04 | 7:55 | 2 | 64/55 | 37% | 150.8 | 2334.1 | 5.9 | 1.6 | 114.3 |
| M3 | 74 | 30.5 | 7:52 | 1 | 54/55 | 56% | 127.6 | 1975.3 | 5.0 | 1.3 | 96.7 |
| M4 | 53 | 29.48 | 6:07 | 1 | 55/55 | 49% | 123.3 | 1909.3 | 4.8 | 1.3 | 93.5 |
| V1 | 49 | 40.68 | 5:52 | 1 | 171/180 | 53% | 344.4 | 17,920.2 | 40.2 | 2.0 | 17.1 |
| V2 | 75 | 54.42 | 8:17 | 1 | 177/180 | 72% | 460.8 | 23,972.9 | 53.8 | 2.7 | 22.9 |
| All | 318 | 191.12 | 12:03 | 1.2 | 53% | 1206.9 | 48,111.8 | 109.7 | 8.8 | 344.5 | |
| Vehicle utilization factor | 25.1% | ||||||||||
| No of crowdsourced deliveries | 29 | ||||||||||
References
- Lozzi, G.; Gatta, V.; Marcucci, E. European urban freight transport policies and research funding: Are priorities and Horizon 2020 calls aligned? Region 2018, 5, 53–71. [Google Scholar] [CrossRef] [Green Version]
- Savelsbergh, M.; van Woensel, T. 50th anniversary invited article—City logistics: Challenges and opportunities. Transp. Sci. 2016, 50, 579–590. [Google Scholar] [CrossRef]
- Oliveira, A.H.S.; Savelsbergh, M.W.P.; Veelenturf, L.P.; van Woensel, T. Chapter 15—Crowd-Based City Logistics. In Sustainable Transportation and Smart Logistics; Faulin, J., Grasman, S.E., Juan, A.A., Hirsch, P., Eds.; Elsevier: Amsterdam, The Netherlands, 2019. [Google Scholar] [CrossRef] [Green Version]
- Logicites. Panorama du Crowdsshipping. 2017. Available online: https://fr.slideshare.net/JeromeLibeskind/map-logicits-du-crowdshipping/1 (accessed on 23 June 2020).
- Le, T.V.; Ukkusuri, S.V. Crowd-shipping services for last mile delivery: Analysis from American survey data. Transp. Res. Interdiscip. Perspect. 2019, 1, 100008. [Google Scholar] [CrossRef]
- Dupljanin, D.; Mirkovic, M.; Dumnic, S.; Culibrk, D.; Milisavljevic, S.; Sarac, D. Urban Crowdsourced Last Mile Delivery: Mode of Transport Effects on Fleet Performance. Int. J. Simul. Model. 2019, 18, 441–452. [Google Scholar] [CrossRef]
- Simoni, M.D.; Marcucci, E.; Gatta, V.; Claudel, C. Potential last-mile impacts of crowdshipping services: A simulation-based evaluation. Transportation 2019, 47, 1933–1954. [Google Scholar] [CrossRef]
- Karakikes, I.; Nathanail, E.; Adamos, G.; Karatsoli, M. Social media users as carriers into the last mile delivery. In Proceedings of the hEART 2018: 7th Symposium of the European Association for Research in Transportation, Athens, Greece, 5–7 September 2018. [Google Scholar]
- Koopman, C.; Matthew, M.; Adam, T. The Sharing Economy and Consumer Protection Regulation: The Case for Policy Change. J. Bus. Entrep. Law 2015, 8, 529–545. [Google Scholar] [CrossRef] [Green Version]
- Qi, W.; Li, L.; Liu, S.; Shen, Z.J.M. Shared mobility for Last-Mile delivery: Design, operational prescriptions and environmental impact. Manuf. Serv. Oper. Manag. 2018, 20, 737–751. [Google Scholar] [CrossRef]
- Nathanail, E.; Mitropoulos, L.; Karakikes, I.; Adamos, G. Sustainability framework for assessing urban freight transportation measures. Logist. Sustain. Transp. 2018, 9, 16–36. [Google Scholar] [CrossRef] [Green Version]
- Gatta, V.; Marcucci, E.; Nigro, M.; Serafini, S. Sustainable urban freight transport adopting public transport-based crowdshipping for B2C deliveries. Eur. Transp. Res. Rev. 2019, 11, 13. [Google Scholar] [CrossRef] [Green Version]
- Seghezzi, A.; Mangiaracina, R.; Tumino, A.; Perego, A. ‘Pony express’ crowdsourcing logistics for last-mile delivery in B2C e-commerce: An economic analysis. Int. J. Logist. Res. Appl. 2020, 24, 456–472. [Google Scholar] [CrossRef]
- Buldeo Rai, H.; Verlinde, S.; Macharis, C. Shipping outside the box. Environmental impact and stakeholder analysis of a crowd logistics platform in Belgium. J. Clean. Prod. 2018, 202, 806–816. [Google Scholar] [CrossRef]
- Arslan, A.M.; Agatz, N.; Kroon, L.; Zuidwijk, R. Crowdsourced Delivery—A Dynamic Pickup and Delivery Problem with Ad Hoc Drivers. Transp. Sci. 2018, 53, 1–318. [Google Scholar] [CrossRef] [Green Version]
- Devari, A.; Nikolaev, A.G.; He, Q. Crowdsourcing the last mile delivery of online orders by exploiting the social networks of retail store customers. Transp. Res. Part E Logist. Transp. Rev. 2017, 105, 105–122. [Google Scholar] [CrossRef]
- Serafini, S.; Nigro, M.; Gatta, V.; Marcucci, E. Sustainable crowdshipping using public transport: A case study evaluation in Rome. Transp. Res. Procedia 2018, 30, 101–110. [Google Scholar] [CrossRef]
- Punel, A.; Ermagun, A.; Stathopoulos, A. Push and Pull Factors in Adopting a Crowdsourced Delivery System. Transp. Res. Rec. 2019, 2673, 529–540. [Google Scholar] [CrossRef]
- Marcucci, E.; le Pira, M.; Carrocci, C.S.; Gatta, V.; Pieralice, E. Connected shared mobility for passengers and freight: Investigating the potential of crowdshipping in urban areas. In Proceedings of the 5th IEEE International Conference on Models and Technologies for Intelligent Transportation Systems (MT-ITS), Naples, Italy, 26–28 June 2017. [Google Scholar] [CrossRef]
- Ermagun, A.; Stathopoulos, A. To bid or not to bid: An empirical study of the supply determinants of crowd-shipping. Transp. Res. Part A Policy Pract. 2018, 116, 468–483. [Google Scholar] [CrossRef]
- Paloheimo, H.; Lettenmeier, M.; Waris, H. Transport reduction by crowdsourced deliveries—A library case in Finland. J. Clean. Prod. 2015, 132, 240–251. [Google Scholar] [CrossRef]
- Comi, A.; Savchenko, L. Last-mile delivering: Analysis of environment-friendly transport. Sustain. Cities Soc. 2021, 74, 103213. [Google Scholar] [CrossRef]
- Rougès, J.-F.; Montreuil, B. Crowdsourcing delivery: New interconnected business models to reinvent delivery. In Proceedings of the First International Physical Internet Conference, Québec City, QC, Canada, 28–30 May 2014. [Google Scholar]
- Mak, H.-Y. Peer-to-Peer Crowdshipping as an Omnichannel Retail Strategy. SSRN 2018. [Google Scholar] [CrossRef]
- Dayarian, I.; Savelsbergh, M. Crowdshipping and same-day delivery: Employing in-store customers to deliver online orders. Prod. Oper. Manag. 2020, 29, 2153–2174. [Google Scholar] [CrossRef]
- Cleophas, C.; Cottrill, C.; Ehmke, J.F.; Tierney, K. Collaborative urban transportation: Recent advances in theory and practice. Eur. J. Oper. Res. 2019, 273, 801–816. [Google Scholar] [CrossRef]
- Behrend, M.; Meisel, F.; Fagerholt, K.; Andersson, H. An exact solution method for the capacitated item-sharing and crowdshipping problem. Eur. J. Oper. Res. 2019, 279, 589–604. [Google Scholar] [CrossRef]
- Suh, K.; Smith, T.; Linhoff, M. Leveraging Socially Networked Mobile ICT Platforms for the Last-Mile Delivery Problem. Environ. Sci. Technol. 2012, 46, 9481–9490. [Google Scholar] [CrossRef]
- Frehe, V.; Mehmann, J.; Teuteberg, F. Understanding and assessing crowd logistics business models—Using everyday people for last mile delivery. J. Bus. Ind. Mark. 2017, 32, 75–97. [Google Scholar] [CrossRef]
- Mckinnon, A. Crowdshipping—A communal Approach to Reducing Urban Traffic Levels? Kuehne Logistics University, Logistics White Paper. 2016. Available online: https://www.alanmckinnon.co.uk/uploaded/PDFs/Papers/Crowdshipping%20white%20paper%20(McKinnon%20%20WP%201-2016%20).pdf (accessed on 3 July 2020).
- Varshney, L.R. Privacy and reliability in crowdsourcing service delivery. In Proceedings of the Service Research and Innovation Institute Global Conference, San Jose, CA, USA, 24–27 July 2012. [Google Scholar]
- Kourounioti, I.; Tsouros, I.; Georgakis, P.; Salas, A.; de Bok, M.; Tsirimpa, A.; Pagoni, I.; Thoen, S.; Eggers, L.; Polydoropoulou, A.; et al. Matching supply and demand in crowdshipping: A theoretical framework. In Proceedings of the Transportation Research Board 100th Annual Meeting, Washington, DC, USA, 5–29 January 2021. [Google Scholar]
- Tsai, Y.-T.; Tiwasing, P. Customers’ intention to adopt smart lockers in last-mile delivery service: A multi-theory perspective. J. Retail. Consum. Serv. 2021, 61, 102514. [Google Scholar] [CrossRef]
- Thompson, R.; Cheng, C.; An, K. Optimising the Capacity of Parcel Lockers. In Proceedings of the 5th International Physical Internet Conference (IPIC2018), Groningen, The Netherlands, 18–22 June 2018. [Google Scholar]
- De Langhe, K.; Meersman, H.; Sys, C.; Van De Voorde, E.; Vanelslander, T. How to make urban freight transport by tram successful? J. Shipp. Trade 2019, 4, 13. [Google Scholar] [CrossRef]
- OptimoRoute Inc. Organizing the Mobile Workforce. 2018. Available online: https://optimoroute.com (accessed on 18 April 2020).
- De Oliveira, L.K.; Nascimento, C.O.L.; de Sousa, P.R.; de Resende, P.T.V.; da Silva, F.G.F. Transport Service Provider Perception of Barriers and Urban Freight Policies in Brazil. Sustainability 2019, 11, 6890. [Google Scholar] [CrossRef] [Green Version]
- Poelman, H.; Dijkstra, L. European Commission Directorate-General for Regional and Urban Policy (DG REGIO), Measuring Access to Public Transport in European Cities, Regional Working Paper. 2015. Available online: https://ec.europa.eu/regional_policy/sources/docgener/work/2015_01_publ_transp.pdf (accessed on 1 May 2020).
- ISO4APP. ISO4APP–ISOCHRONES–ISODISTANCES. 2021. Available online: http://iso4app.net/ (accessed on 31 October 2021).
- Evalog. Integrated Assessment Framework for UFT Solutions. 2016. Available online: http://evalog.civ.uth.gr (accessed on 10 July 2020).
- Saaty, T.L. The Analytic Hierarchy Process; McGraw-Hill International: New York, NY, USA, 2018. [Google Scholar]
- Nathanail, E.; Karakikes, I. How accurately do experts perceive the effectiveness of urban freight transportation solutions in medium-sized cities? Int. J. Logist. Syst. Manag. 2021, 39, 519–550. [Google Scholar] [CrossRef]
- Wang, X.; Kopfer, H. Collaborative transportation planning of less-than-truckload freight. OR Spectr. 2014, 36, 357–380. [Google Scholar] [CrossRef]
- Lee, J.-S.; Park, C.H.; Ebrahimi, T. Theory and Applications of Hybrid Simulated Annealing. In Handbook of Optimization; Zelinka, I., Snasel, V., Abraham, A., Eds.; Springer: London, UK; Berlin/Heidelberg, Germany, 2013; pp. 395–422. [Google Scholar]
- Kiousis, V.; Nathanail, E.; Karakikes, I. Assessing Traffic and Environmental Impacts of Smart Lockers Logistics Measure in a Medium-Sized Municipality of Athens. In Data Analytics: Paving the Way to Sustainable Urban Mobility; Nathanail, E., Karakikes, I., Eds.; Springer: Cham, Switzerland, 2019; pp. 614–621. [Google Scholar]
- Tian, Z.Z.; Urbanik, T.; Engelbrecht, R.; Balke, K. Variations in Capacity and Delay Estimates from Microscopic Traffic Simulation Models. Transp. Res. Rec. 2002, 1802, 23–31. [Google Scholar] [CrossRef] [Green Version]
- Emisia. COPERT Street Level. 2018. Available online: https://www.emisia.com/utilities/copert-street-level/ (accessed on 29 June 2020).
- Teo, J.S.; Taniguchi, E.; Qureshi, A. Evaluation of Load Factor Control and Urban Freight Road Pricing Joint Schemes with Multi-agent Systems Learning Models. Procedia-Soc. Behav. Sci. 2014, 125, 62–74. [Google Scholar] [CrossRef] [Green Version]
- European Commission. The European Green Deal. 2019. Available online: https://eur-lex.europa.eu/resource.html?uri=cellar:b828d165-1c22-11ea-8c1f-01aa75ed71a1.0002.02/DOC_1&format=PDF (accessed on 3 November 2021).
- Gatta, V.; Marcucci, E.; Nigro, M.; Patella, S.M.; Serafini, S. Public Transport-Based Crowdshipping for Sustainable City Logistics: Assessing Economic and Environmental Impacts. Sustainability 2019, 11, 145. [Google Scholar] [CrossRef] [Green Version]
- Giuffrida, N.; Le Pira, M.; Fazio, M.; Inturri, G.; Ignaccolo, M. On the spatial feasibility of crowdshipping services in university communities. Transp. Res. Procedia 2021, 52, 19–26. [Google Scholar] [CrossRef]
- Dai, Q.; Jia, H.; Liu, Y. Private vehicle-based crowdshipping for intercity express transportation: Feasibility assessment. Int. J. Distrib. Sens. Netw. 2020, 16, 1550147720908203. [Google Scholar] [CrossRef] [Green Version]


| Location | Name of Cand. PT Stops | PT Line No. # Serving the PT Stop and Its Frequencies (on Weekdays) | Approx. Distance of the Stop from the Center of the Visual Cue | Accessibility | |
|---|---|---|---|---|---|
| In the area of Location (A) | #1 Ermou | 2 | 07:00–08:00 (every 8 min) 08:00–14:00 (every 15 min) 14:00–15:00 (every 8 min) 15:00–21:00 (every 15 min) 21:00–23:00 (every 30 min) | 100 m | Very good (on pedestrian walkway) |
| 3 | 06:00–07:00 (every 30 min) 07:00–08:00 (every 20 min) 08:00–15:00 (every 15 min) 15:00–21:00 (every 20 min) 21:00–23:00 (every 30 min) | ||||
| 4 | 06:00–07:00 (every 30 min) 07:00–14:00 (every 15 min) 14:00–16:00 (every 20 min) 16:00–21:00 (every 15 min) 21:00–23:00 (every 30 min) | ||||
| 9 | Appr. every 1 h | ||||
| 15 | 06:00–09:00 (every 30 min) 09:00–16:00 (every 20 min) 16:00–17:00 (every 30 min) 17:00–22:00 (every 20 min) | ||||
| #2 Pavlou Mela | 2 | 07:00–08:00 (every 8 min) 08:00–14:00 (every 15 min) 14:00–15:00 (every 8 min) 15:00–21:00 (every 15 min) 21:00–23:00 (every 30 min) | 250 m | Good | |
| 3 | 06:00–07:00 (every 30 min) 07:00–08:00 (every 20 min) 08:00–15:00 (every 15 min) 15:00–21:00 (every 20 min) 21:00–23:00 (every 30 min) | ||||
| 5 | 06:00–08:00 (every 20 min) 08:00–12:00 (every 30 min) 12:00–14:00 (every 20 min) 14:00–22:00 (every 30 min) | ||||
| 9 | Appr. every 1 h | ||||
| 15 | 06:00–09:00 (every 30 min) 09:00–16:00 (every 20 min) 16:00–17:00 (every 30 min) 17:00–22:00 (every 20 min) | ||||
| #3 Topali | 1 | 06:00–08:00 (every 15 min) 08:00–14:00 (every 12 min) 14:00–17:00 (every 20 min) 17:00–22:00 (every 15 min) 22:00–23:00 (every 30 min) | 100 m | Good | |
| 5 | 06:00–08:00 (every 20 min) 08:00–12:00 (every 30 min) 12:00–14:00 (every 20 min) 14:00–22:00 (every 30 min) | ||||
| In the area of Location (B) | #1 Mavrokordatou | 3 | 06:00–07:00 (every 30 min) 07:00–08:00 (every 20 min) 08:00–15:00 (every 15 min) 15:00–21:00 (every 20 min) 21:00–23:00 (every 30 min) | 100 m | Good |
| Deliveries per Freight Vehicle | Total Deliveries (TD) | Demand | ||||||
|---|---|---|---|---|---|---|---|---|
| Location—A | Location—B | Depot—E | ||||||
| 1.5 min Service Area | 3 min Service Area | 1.5 min Service Area | 3 min Service Area | 1.5 min Service Area | 3 min Service Area | |||
| 1 | M1: Moped 1 | 54 | 0 | 0 | 0 | 0 | 0/1 | 0/3 |
| 2 | M2: Moped 2 | 68 | 7/8 | 20/21 | 4/4 | 11/11 | 0/1 | 0/1 |
| 3 | M2: Moped 3 | 51 | 0 | 0 | 1/1 | 1/1 | 0 | 0 |
| 4 | M4: Moped 4 | 47 | 0 | 0 | 0 | 0 | 0 | 0 |
| 5 | V1: Minivan 1 | 82 | 0 | 0 | 2/2 | 2/2 | 0 | 0 |
| 6 | V1: Minivan 2 | 48 | 0/1 | 3/7 | 1/1 | 2/3 | 0 | 0 |
| Sum | 350 | 7/9 | 23/28 | 8/8 | 16/17 | 0/2 | 0/4 | |
| 1. Scenario Name | 2. Location of Smart Lockers | 3. Service Area [min] | 4. CD According to Table 2 | 5. No of Deliveries Reduced per Freight Vehicle | 6. CD/TD | |
|---|---|---|---|---|---|---|
| 0 | Base | - | - | 0 | 0 | 0/350 = 0 |
| 1 | 1_15_20 | Cluster 1 | 1.5 | M2: 7, V2: 0 | M2 × 20% = 1 | 1/350 = 0.3% |
| 2 | 1_15_50 | M2 × 50% = 4 | 4/350 = 1.1% | |||
| 3 | 1_15_70 | M2 × 70% = 5 | 5/350 = 1.4% | |||
| 4 | 1_30_20 | 3 | M2: 20, V2: 3 | M2 × 20% = 4, V2 × 20% = 1 | 5/350 = 1.4% | |
| 5 | 1_30_50 | M2 × 50% = 10, V2 × 50% = 2 | 12/350 = 3.4% | |||
| 6 | 1_30_70 | M2 × 70% = 14, V2 × 70% = 2 | 16/350 = 4.6% | |||
| 7 | 2_15_20 | Cluster 2 | 1.5 | M2: 4, M3: 1 V1: 2, V2: 1 | M2 × 20% = 1, M3 × 20% = 0 V1 × 20% = 0, V2 × 20% = 0 | 1/350 = 0.3% |
| 8 | 2_15_50 | M2 × 50% = 2, M3 × 50% = 1 V1 × 50% = 1, V2 × 50% = 1 | 5/350 = 1.4% | |||
| 9 | 2_15_70 | M2 × 70% = 3, M3 × 70% = 1 V1 × 70% = 1, V2 × 70% = 1 | 6/350 = 1.7% | |||
| 10 | 2_30_20 | 3 | M2: 11, M3: 1 V1: 2, V2: 2 | M2 × 20% = 2, M3 × 20% = 0 V1 × 20% = 0, V2 × 20% = 0 | 2/350 = 0.6% | |
| 11 | 2_30_50 | M2 × 50% = 6, M3 × 50% = 1 V1 × 50% = 1, V2 × 50% = 1 | 9/350 = 2.6% | |||
| 12 | 2_30_70 | M2 × 70% = 8, M3 × 70% = 1 V1 × 70% = 1, V2 × 70% = 1 | 11/350 = 3.1% | |||
| 13 | 3_15_20 | Cluster 3 | 1.5 | M2: 11, M3: 1 V1: 2, V2: 1 | M2 = 1 + 1 = 2, M3 = 0 + 0 = 0 V1 = 0 + 0 = 0, V2 = 0 + 0 = 0 M2 = 4 + 2 = 6, M3 = 0 + 1 = 1 V1 = 0 + 1 = 1, V2 = 0 + 1 = 1 M2 = 5 + 3 = 8, M3 = 0 + 1 = 1 V1 = 0 + 1 = 1, V2 = 0 + 1 = 1 | 2/350 = 0.6% |
| 14 | 3_15_50 | 9/350 = 2.6% | ||||
| 15 | 3_15_70 | 11/350 = 3.1% | ||||
| 16 | 3_30_20 | 3 | M2: 31, M3: 1 V1: 2, V2: 5 | M2 = 4 + 2 = 6, M3 = 0 + 0 = 0 V1 = 0 + 0 = 0, V2 = 1 + 0 = 1 | 7/350 = 2% | |
| 17 | 3_30_50 | M2 = 10 + 6=16, M3 = 0 + 1 = 1 V1 = 0 + 1 = 1, V2 = 2 + 1 = 3 | 21/350 = 6% | |||
| 18 | 3_30_70 | M2 = 14 + 8=22, M3 = 0 + 1 = 1 V1 = 0 + 1 = 1, V2 = 2+1 = 3 | 27/350 = 7.7% | |||
| Impact Areas | Criteria | Indicators |
|---|---|---|
| Economy and energy | 5 | 36 |
| Environment | 3 | 10 |
| Transport and mobility | 5 | 29 |
| Society | 3 | 20 |
| Solution maturity | 3 | 24 |
| Social acceptance | 2 | 12 |
| User uptake | 5 | 9 |
| Total | 26 | 140 |
| Impact Area | Criterion | Indicator | Explanation | Unit | +/− 1 | |
|---|---|---|---|---|---|---|
| Operator Performance | ||||||
| O1 | Environment | Air quality | CO | Total contribution of freight vehicle fleet to the concentration of the pollutant | g | − |
| O2 | NOx | g | − | |||
| O3 | VOC | g | − | |||
| O4 | PM | g | − | |||
| O5 | Fleet emissions | CO2 | Total emissions of freight vehicle fleet based on fuel, technology, and vehicle type | kg | − | |
| O6 | Transport and Mobility | Fleet | Freight vehicles’ traffic throughput | Total veh km covered by freight vehicles | veh-km | − |
| O7 | Number of roundtrips | Number of roundtrips per freight vehicle | no. | − | ||
| O8 | Number of delivery mopeds | Number of delivery mopeds | no. | − | ||
| O9 | Number of commercial light vehicles | Number of freight vehicles with a gross vehicle weight of no more than 3.5 tonnes | no. | − | ||
| O10 | Vehicle utilization factor | Hours that the vehicles are in service, e.g., for deliveries, pick-ups, transporting, weighting, loading/unloading over 24 h | % | + | ||
| O11 | Load factor | Average load factor of the fleet | % | + | ||
| O12 | Average freight vehicles’ speed | Freight vehicles’ total covered distance divided by the delivery duration (driver’s break duration and depot visit duration in-between roundtrips are not included) | km/h | + | ||
| Network Performance | ||||||
| N1 | Environment | Air quality | Average CO per vehicle | Total contribution of all vehicles to the concentration of the pollutant/Total no. of vehicles | g | − |
| N2 | Average NOx per vehicle | g | − | |||
| N3 | Average VOC per vehicle | g | − | |||
| N4 | Average PM per vehicle | mg | − | |||
| N5 | Transport network emissions | Average CO2 per vehicle | Total emissions of all vehicles based on fuel, technology, and vehicles type/Total no. of vehicles | g | − | |
| N6 | Transport and Mobility | Transport system | Average distance per vehicle | Total distance of vehicles traveling within the network/Total no. of vehicles | km | − |
| N7 | Average travel time per vehicle | Total travel time of vehicles traveling within the network/Total no. of vehicles | s | − | ||
| N8 | Average delay per vehicle | Total delay/Total no. of vehicles | s | − | ||
| N9 | Average speed per vehicle | Total distance/Total travel time | km/h | + | ||
| Scenarios | |||||||||||||||||||
|---|---|---|---|---|---|---|---|---|---|---|---|---|---|---|---|---|---|---|---|
| (+/−) Indicator 1 | Base | Cluster 1 | Cluster 2 | Cluster 3 | |||||||||||||||
| 1_15_20 | 1_15_50 | 1_15_70 | 1_30_20 | 1_30_50 | 1_30_70 | 2_15_20 | 2_15_50 | 2_15_70 | 2_30_20 | 2_30_50 | 2_30_70 | 3_15_20 | 3_15_50 | 3_15_70 | 3_30_20 | 3_30_50 | 3_30_70 | ||
| 0 | 1 | 2 | 3 | 4 | 5 | 6 | 7 | 8 | 9 | 10 | 11 | 12 | 13 | 14 | 15 | 16 | 17 | 18 | |
| Operator Performance | |||||||||||||||||||
| O1 (−) | 1210 | 1.2% | 0.0% | −0.1% | −0.4% | −1.0% | −1.5% | 1.7% | 4.1% | −0.4% | 4.4% | 5.6% | 1.5% | 0.7% | −0.3% | 0.6% | −0.1% | −1.2% | −0.3% |
| O2 (−) | 110 | 0.4% | −1.1% | −0.9% | −1.0% | −1.4% | −0.7% | 1.6% | 5.4% | −1.3% | 5.6% | 6.5% | 0.6% | 0.3% | −0.6% | −0.3% | −1.3% | −1.7% | −0.3% |
| O3 (−) | 345 | 3.7% | 2.9% | 2.4% | 1.5% | 0.3% | −3.8% | 1.9% | 0.1% | 2.3% | 1.0% | 2.9% | 3.9% | 2.2% | 0.9% | 3.4% | 3.6% | 0.3% | −0.2% |
| O4 (−) | 8.2 | 9.7% | 8.5% | 8.3% | 7.9% | 7.0% | 5.5% | 9.6% | 11.0% | 8.1% | 11.5% | 13.0% | 10.0% | 8.9% | 7.8% | 9.2% | 8.7% | 6.9% | 7.5% |
| O5 (−) | 48,239 | 0.3% | −1.1% | −1.0% | −1.0% | −1.5% | −0.7% | 1.6% | 5.5% | −1.3% | 5.6% | 6.6% | −34.4% | 0.2% | −0.7% | −0.4% | −1.4% | −1.7% | −0.3% |
| O6 (−) | 192 | 1.8% | 0.7% | 0.5% | 0.1% | −0.7% | −2.4% | 1.7% | 2.7% | 0.3% | 3.2% | 4.6% | 2.1% | 1.0% | −0.1% | 1.3% | 0.9% | −0.9% | −0.4% |
| O7 (−) | 1 | 20.0% | 20.0% | 20.0% | 0.0% | 20.0% | 0.0% | 0.0% | 0.0% | 20.0% | 20.0% | 20.0% | 20.0% | 0.0% | 0.0% | 20.0% | 0.0% | 20.0% | 20.0% |
| O8 (−) | 4 | −25.0% | −25.0% | −25.0% | 0.0% | −25.0% | 0.0% | 0.0% | 0.0% | −25.0% | −25.0% | −25.0% | −25.0% | 0.0% | 0.0% | −25.0% | −25.0% | −25.0% | −25.0% |
| O9 (−) | 2 | 0.0% | 0.0% | 0.0% | 0.0% | 0.0% | 0.0% | 0.0% | 0.0% | 0.0% | 0.0% | 0.0% | 0.0% | 0.0% | 0.0% | 0.0% | 0.0% | 0.0% | 0.0% |
| O10 (+) | 27% | 0.0% | −0.7% | −1.1% | −1.5% | −3.0% | −4.1% | 0.0% | −1.1% | −1.1% | −1.1% | −1.9% | −2.6% | −0.7% | −2.2% | −2.2% | −2.6% | −5.2% | −6.7% |
| O11 (+) | 60% | −11.7% | −8.3% | −20.0% | −3.3% | −8.3% | −16.7% | −10.0% | −26.7% | −11.7% | −10.0% | −11.7% | −5.0% | −13.3% | −11.7% | −8.3% | −8.3% | −11.7% | −11.7% |
| O12 (+) | 5.2 | 5.8% | 3.8% | 3.8% | 0.0% | 5.8% | 3.8% | 1.9% | 5.8% | 3.8% | 9.6% | 9.6% | 9.6% | 1.9% | 0.0% | 5.8% | 5.8% | 7.7% | 11.5% |
| Network Performance | |||||||||||||||||||
| N1 (−) | 19,430 | −0.1% | 0.1% | 0.0% | 0.1% | −0.1% | 0.0% | −0.1% | −0.1% | −0.2% | −0.1% | 0.0% | −0.1% | 0.0% | 0.0% | −0.1% | −0.1% | 0.0% | −0.1% |
| N2 (−) | 3612 | −0.1% | 0.1% | 0.0% | 0.1% | −0.1% | 0.0% | −0.1% | −0.1% | −0.2% | −0.1% | 0.0% | −0.1% | 0.0% | 0.0% | −0.1% | −0.1% | 0.0% | −0.1% |
| N3 (−) | 3151 | −0.1% | 0.1% | 0.0% | 0.1% | −0.1% | 0.0% | −0.1% | −0.1% | −0.2% | −0.1% | 0.0% | −0.1% | 0.0% | 0.0% | −0.1% | −0.1% | 0.0% | −0.1% |
| N4 (−) | 126 | −0.1% | 0.1% | 0.0% | 0.1% | −0.1% | 0.0% | −0.1% | −0.1% | −0.2% | −0.1% | 0.0% | −0.1% | 0.0% | 0.0% | −0.1% | −0.1% | 0.0% | −0.1% |
| N5 (−) | 1,729,090 | −0.1% | 0.1% | 0.0% | 0.1% | −0.1% | 0.0% | −0.1% | −0.1% | −0.2% | −0.1% | 0.0% | −0.1% | 0.0% | 0.0% | −0.1% | −0.1% | 0.0% | −0.1% |
| N6 (−) | 130,022 | 0.0% | 0.0% | 0.0% | 0.0% | 0.0% | 0.0% | 0.0% | −0.1% | −0.1% | 0.0% | 0.0% | 0.0% | 0.0% | 0.0% | 0.0% | 0.0% | 0.0% | 0.0% |
| N7 (−) | 15,923,380 | 0.0% | 0.7% | 0.2% | 0.6% | 0.1% | 0.0% | 0.1% | 0.1% | −0.1% | −0.1% | 0.0% | 0.0% | 0.1% | 0.4% | 0.2% | 0.0% | 0.2% | −0.3% |
| N8 (−) | 75 | 0.0% | 1.9% | 0.6% | 1.9% | 0.5% | −0.1% | 0.5% | 0.7% | −0.1% | −0.1% | 0.1% | 0.2% | 0.3% | 1.1% | 0.8% | 0.2% | 0.7% | −0.6% |
| N9 (+) | 29 | 0.0% | −0.6% | −0.2% | −0.6% | −0.2% | 0.0% | −0.3% | −0.2% | 0.0% | 0.0% | 0.0% | −0.1% | −0.1% | −0.4% | −0.3% | −0.1% | −0.2% | 0.2% |
| CD/TD | O1 | O2 | O3 | O4 | O5 | O6 | O7 | O8 | O9 | O10 | O11 | O12 | ||
|---|---|---|---|---|---|---|---|---|---|---|---|---|---|---|
| CD/TD | Pearson Correlation | 1 | −0.392 | −0.285 | −0.484 * | −0.485 * | −0.167 | −0.505 * | 0.248 | −0.230 | b | −0.981 ** | 0.030 | 0.488 * |
| Sig. (2-tailed) | 0.107 | 0.252 | 0.042 | 0.041 | 0.507 | 0.033 | 0.321 | 0.359 | 0.000 | 0.907 | 0.040 | |||
| O1 | Pearson Correlation | −0.392 | 1 | 0.970 ** | 0.270 | 0.962 ** | 0.215 | 0.939 ** | 0.083 | −0.033 | b | 0.403 | −0.219 | 0.395 |
| Sig. (2-tailed) | 0.107 | 0.000 | 0.278 | 0.000 | 0.391 | 0.000 | 0.742 | 0.897 | 0.097 | 0.382 | 0.104 | |||
| O2 | Pearson Correlation | −0.285 | 0.970 ** | 1 | 0.027 | 0.866 ** | 0.295 | 0.827 ** | 0.008 | 0.079 | b | 0.288 | −0.329 | 0.399 |
| Sig. (2-tailed) | 0.252 | 0.000 | 0.914 | 0.000 | 0.234 | 0.000 | 0.976 | 0.756 | 0.247 | 0.182 | 0.101 | |||
| O3 | Pearson Correlation | −0.484 * | 0.270 | 0.027 | 1 | 0.524 * | −0.283 | 0.584 * | 0.312 | −0.447 | b | 0.515 * | 0.402 | 0.045 |
| Sig. (2-tailed) | 0.042 | 0.278 | 0.914 | 0.026 | 0.256 | 0.011 | 0.208 | 0.063 | 0.029 | 0.098 | 0.858 | |||
| O4 | Pearson Correlation | −0.485 * | 0.962 ** | 0.866 ** | 0.524 * | 1 | 0.110 | 0.997 ** | 0.162 | −0.156 | b | 0.503 * | −0.080 | 0.363 |
| Sig. (2-tailed) | 0.041 | 0.000 | 0.000 | 0.026 | 0.664 | 0.000 | 0.519 | 0.536 | 0.033 | 0.754 | 0.139 | |||
| O5 | Pearson Correlation | −0.167 | 0.215 | 0.295 | −0.283 | 0.110 | 1 | 0.081 | −0.184 | 0.190 | b | 0.152 | −0.395 | −0.184 |
| Sig. (2-tailed) | 0.507 | 0.391 | 0.234 | 0.256 | 0.664 | 0.749 | 0.466 | 0.451 | 0.546 | 0.105 | 0.465 | |||
| O6 | Pearson Correlation | −0.505 * | 0.939 ** | 0.827 ** | 0.584 * | 0.997 ** | 0.081 | 1 | 0.179 | −0.184 | b | 0.525 * | −0.041 | 0.347 |
| Sig. (2-tailed) | 0.033 | 0.000 | 0.000 | 0.011 | 0.000 | 0.749 | 0.478 | 0.465 | 0.025 | 0.872 | 0.158 | |||
| O7 | Pearson Correlation | 0.248 | 0.083 | 0.008 | 0.312 | 0.162 | −0.184 | 0.179 | 1 | −0.886 ** | b | −0.165 | 0.197 | 0.639 ** |
| Sig. (2-tailed) | 0.321 | 0.742 | 0.976 | 0.208 | 0.519 | 0.466 | 0.478 | 0.000 | 0.513 | 0.433 | 0.004 | |||
| O8 | Pearson Correlation | −0.230 | −0.033 | 0.079 | −0.447 | −0.156 | 0.190 | −0.184 | −0.886 ** | 1 | b | 0.205 | −0.277 | −0.676 ** |
| Sig. (2-tailed) | 0.359 | 0.897 | 0.756 | 0.063 | 0.536 | 0.451 | 0.465 | 0.000 | 0.415 | 0.265 | 0.002 | |||
| O9 | Pearson Correlation | b | b | b | b | b | b | b | b | b | b | b | b | b |
| Sig. (2-tailed) | ||||||||||||||
| O10 | Pearson Correlation | −0.981 ** | 0.403 | 0.288 | 0.515 * | 0.503 * | 0.152 | 0.525 * | −0.165 | 0.205 | b | 1 | −0.055 | −0.484 * |
| Sig. (2-tailed) | 0.000 | 0.097 | 0.247 | 0.029 | 0.033 | 0.546 | 0.025 | 0.513 | 0.415 | 0.827 | 0.042 | |||
| O11 | Pearson Correlation | 0.030 | −0.219 | −0.329 | 0.402 | −0.080 | −0.395 | −0.041 | 0.197 | −0.277 | b | −0.055 | 1 | 0.013 |
| Sig. (2-tailed) | 0.907 | 0.382 | 0.182 | 0.098 | 0.754 | 0.105 | 0.872 | 0.433 | 0.265 | 0.827 | 0.959 | |||
| O12 | Pearson Correlation | 0.488 * | 0.395 | 0.399 | 0.045 | 0.363 | −0.184 | 0.347 | 0.639 ** | −0.676 ** | b | −0.484 * | 0.013 | 1 |
| Sig. (2-tailed) | 0.040 | 0.104 | 0.101 | 0.858 | 0.139 | 0.465 | 0.158 | 0.004 | 0.002 | 0.042 | 0.959 |
Publisher’s Note: MDPI stays neutral with regard to jurisdictional claims in published maps and institutional affiliations. |
© 2022 by the authors. Licensee MDPI, Basel, Switzerland. This article is an open access article distributed under the terms and conditions of the Creative Commons Attribution (CC BY) license (https://creativecommons.org/licenses/by/4.0/).
Share and Cite
Karakikes, I.; Nathanail, E. Assessing the Impacts of Crowdshipping Using Public Transport: A Case Study in a Middle-Sized Greek City. Future Transp. 2022, 2, 55-83. https://doi.org/10.3390/futuretransp2010004
Karakikes I, Nathanail E. Assessing the Impacts of Crowdshipping Using Public Transport: A Case Study in a Middle-Sized Greek City. Future Transportation. 2022; 2(1):55-83. https://doi.org/10.3390/futuretransp2010004
Chicago/Turabian StyleKarakikes, Ioannis, and Eftihia Nathanail. 2022. "Assessing the Impacts of Crowdshipping Using Public Transport: A Case Study in a Middle-Sized Greek City" Future Transportation 2, no. 1: 55-83. https://doi.org/10.3390/futuretransp2010004
APA StyleKarakikes, I., & Nathanail, E. (2022). Assessing the Impacts of Crowdshipping Using Public Transport: A Case Study in a Middle-Sized Greek City. Future Transportation, 2(1), 55-83. https://doi.org/10.3390/futuretransp2010004