Review

Mobility Trends in Transport Sector Modeling

1
Institute for Techno-Economic Systems Analysis (IEK-3), Forschungszentrum Jülich GmbH, 52425 Jülich, Germany
2
Chair for Fuel Cells, RWTH Aachen University, c/o Institute for Techno-Economic Systems Analysis (IEK-3), Forschungszentrum Jülich GmbH, 52428 Jülich, Germany
*
Author to whom correspondence should be addressed.
Future Transp. 2022, 2(1), 184-215; https://doi.org/10.3390/futuretransp2010010
Submission received: 8 November 2021 / Revised: 18 January 2022 / Accepted: 29 January 2022 / Published: 11 February 2022

Abstract

:
Transport sector models help provide strategic information for the future development of the transportation sector. Such long-term scenarios are typically challenged by uncertainties. Moreover, certain trends, such as the transition to zero-emission transportation systems and modal shifts, as well as connected, shared and autonomous vehicles, are already apparent today. Therefore, this paper investigates the impact of these trends on greenhouse gas emissions, as well as their implementation in transport sector modeling thus far. The investigations are structured into the four main parts of transport sector greenhouse gas emission calculation: activity, modal share, energy intensity and fuel carbon intensity. Our analysis of the related effects reveals their importance to the transportation sector of the future. Current models and scenarios widely consider trends such as the modal shift and electrification. However, other trends such as the sharing economy and automated driving are not commonly regarded in the context of transport sector modeling. The coupling of the different types of models and collaboration among researchers from the different fields is recommended for filling this gap.

1. Introduction

In planning the future energy system, possible pathways must be designed, analyzed, and evaluated. Related work is mostly based on energy system model calculations. With the transport sector ranking among the major carbon emission sources, climate change mitigation efforts are expected to have a major impact on transportation systems over the next few decades. Thus, politicians, industrial enterprises, scientists, and others are interested in the sector’s future development. Typical questions include: Which drivetrain and fuel should be used for which mode of transportation? What energy demands can be expected in the coming decades? How will the sector’s greenhouse gas emissions develop? All these questions are illuminated with the help of transport sector models, and possible pathways are shown. Therefore, researchers have developed various models with different focuses. In this paper, transport sector models are examined for their ability to answer the above questions. Thus, our analysis reveals some possible strengths and weaknesses in transport sector models with regard to these trends. Possible research gaps are made visible, and should be closed in the future in order to improve model-based assessments in the context of current research tasks.
Comparative reviews of some of these models have already been conducted. Edelenbosch et al. [1] investigate the modeling of the transport sector in eleven global integrated assessment models (IAMs) that comprise not only transportation but also other sectors of the energy system. Thereby, they focus on input and result comparisons. Their analysis shows fuel shift to be the most important driver of greenhouse gas (GHG) emissions reduction. Girod et al. [2] and Yeh et al. [3] also reviewed global transport sector models according to input and output. They partly discovered differences, e.g., in assumptions regarding future travel demand. In contrast to this, Linton et al. [4] explored six different methodologies for analyzing transport sector CO2 emissions. These range from microsimulation on the small scale up to large-scale IAMs. Creutzig [5] also examines different types of models and highlights the divergent backgrounds of the modelers. The first type of models are IAMs, which are primarily developed by economists. The second concern the transport sector and are usually developed by engineers. The third and final type of model considered here are place-based one, which are developed by geographers and public health researchers.
The focus of this paper is mobility trends in transport sector models, as these influence the selection of suitable pathways for achieving near-zero GHG transport emissions. The aim of this review is to qualitatively analyze how mobility trends influence GHG emissions and how models methodically take such trends into account. In contrast to the reviews conducted by Edelenbosch et al. [1], Girod et al. [2] and Yeh et al. [3], an analysis of input or output values of the models or scenarios is not undertaken in this work.
McKinsey [6] describe future mobility trends using the abbreviation ACES. Deloitte [7], Toyota [8], and Daimler [9] use the abbreviation CASE. The meaning behind these two is the same, with only the order of the letters differing. In the case of the latter, future vehicles are expected to be connected, autonomous, shared, and electrified. As vehicle connection comes alongside vehicle automation, these two are combined in this paper under the rubric of automated driving. In order to underline the importance for future transport sector-related analysis, Figure 1 displays the projections by Litman et al. regarding the uptake of autonomous vehicles [10].
They project that in 2050, every second vehicle will be autonomous. According to their projections, the continuous uptake of the technology from 2030 onwards will result in ~30% fleet and 40% travel shares in 2050 [10]. Other studies offer similar projections for the uptake of connected and autonomous vehicles [11,12]. Thus, the trend should definitely not be neglected in long-term transport sector modeling.
Electrification as the last part of CASE disregards the possibility of shifting used fuel without electrifying drivetrains, which is a possibility when decarbonizing, especially heavier vehicles, apart from cars. As the abovementioned abbreviations merely focus on passenger cars, with the modal shift being another major trend in passenger and freight transport, although it is not included. Still, this trend is also taken into account in this study. The trends examined herein are therefore as follows: modal shift, fuel shift, shared mobility and automated driving.
The analysis is structured according to the activity, modal share, energy intensity and fuel carbon intensity (ASIF) method by Schipper and Marie-Lilliu [13]. Using this basic method which was developed to calculate GHG emissions in the transport sector a structured analysis should be guaranteed. Section 2 provides a short introduction to ASIF as well as the model selection process. Subsequently, the boundary conditions of the investigated models are analyzed in Section 3. This includes information on spatio-temporal settings and sectoral coverage. Thereby, differences between the models in many respects become obvious. Section 4 qualitatively analyzes the impacts of mobility trends on the ASIF method. In doing so, the relevance of these trends for the calculation of future GHG emissions becomes apparent. Finally, an investigation of mobility trends in transport sector models is conducted in Section 5.

2. Method

This paper focusses on mobility trends, including their impacts on greenhouse gas emissions, as well as their modeling in transport sector models. As the trends investigated develop over a long period of time, the models should be capable of depicting such periods. Furthermore, the models should include the impacts of the trends on at least a national level.
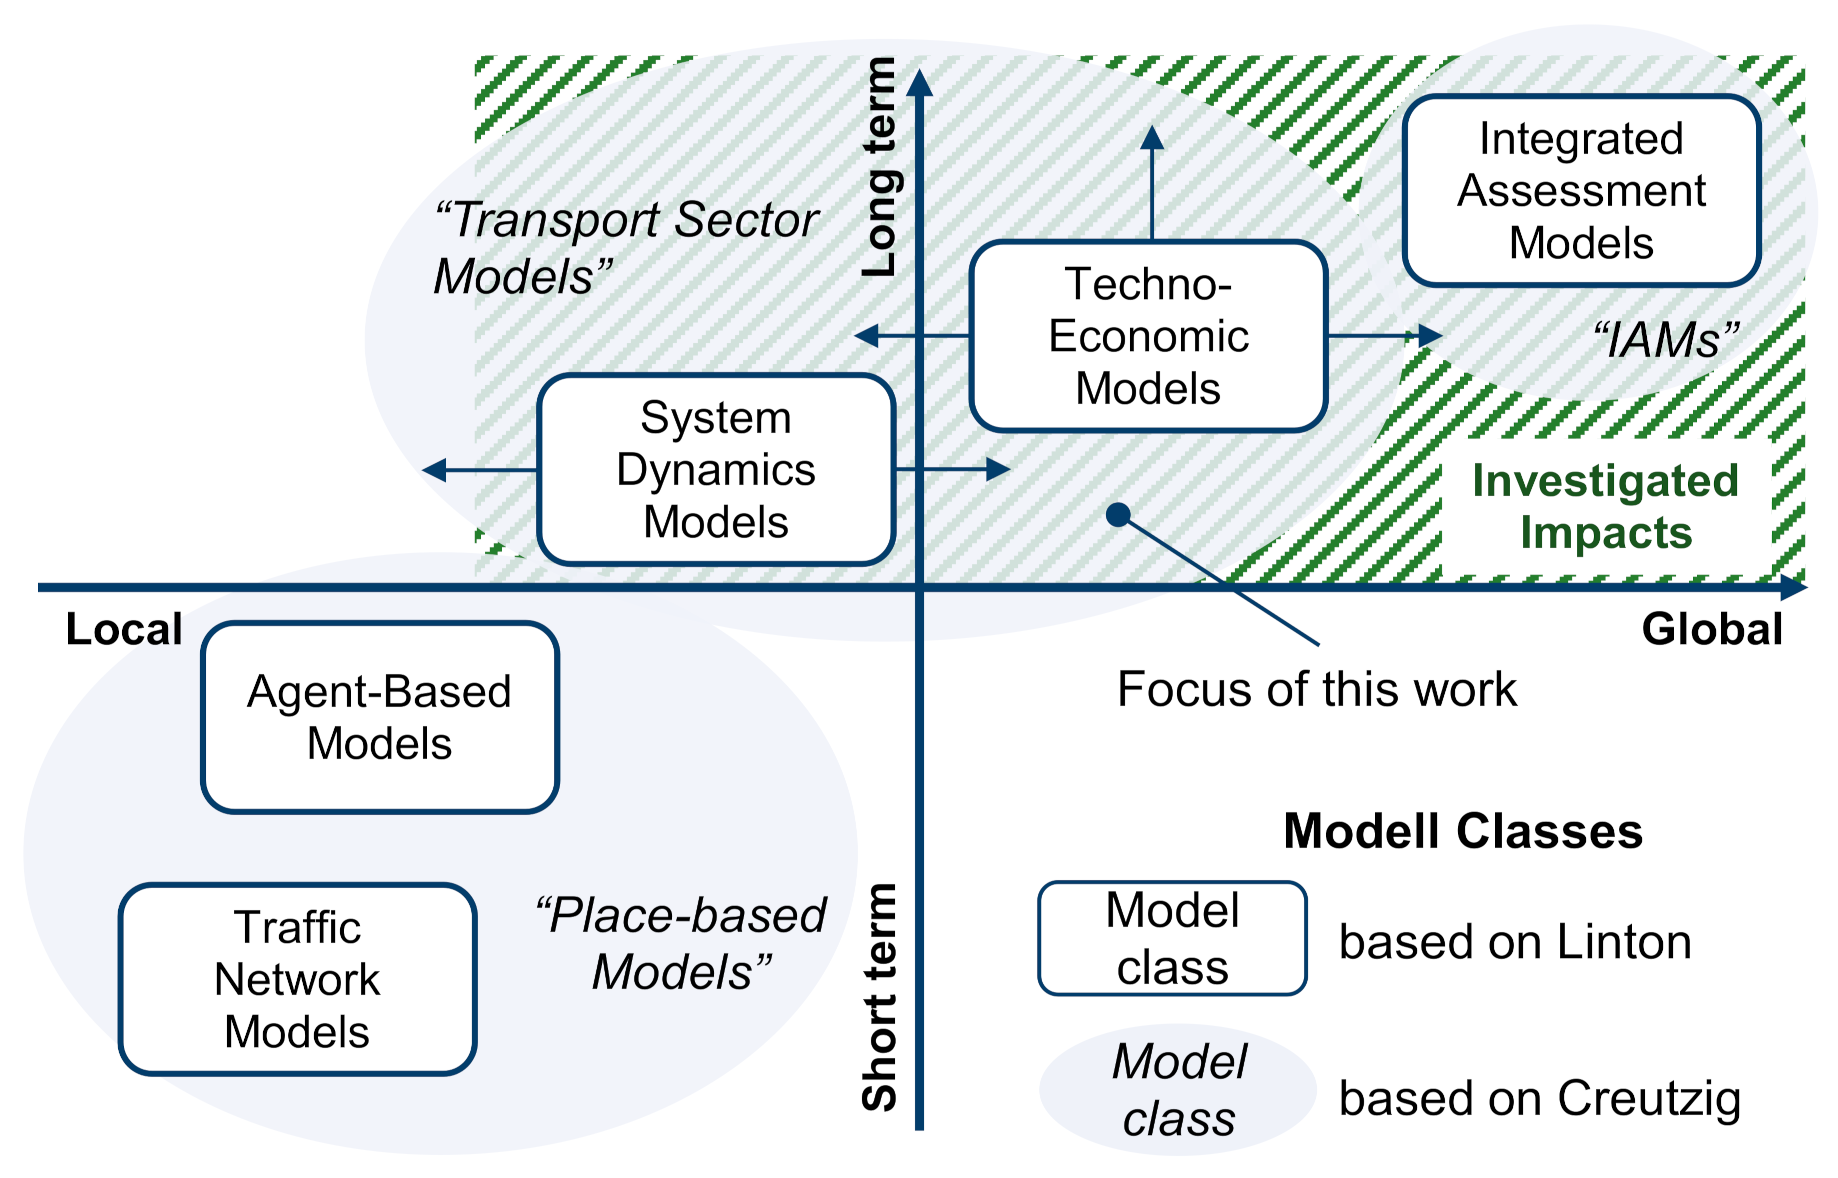
Figure 2 shows the modeling techniques required for calculating the greenhouse gas emissions emitted by the transport sector according to Linton et al. [4] and Creutzig [5]. These techniques are used at different spatial and temporal scales. The spatio-temporal settings of the models within one type are not exactly fixed, but can vary between each other. Still, the relationship between model types can be depicted as in the figure. On the one hand, traffic network models are used for small-scale simulations on a local and short-term basis [14,15]. On the other, integrated assessment models are deployed for long term projections on national or even global scales [16,17]. Agent-based models like MATSIM focus on the behavior and motivations of a series of agents [18]. Compared to system dynamics and techno-economic models, the focus of these is on a more regional level. The model classes defined by Creutzig [5] can in part be understood as groupings of the model classes, as per Linton. Traffic network and agent-based models correspond to Creutzig’s place-based ones, which operate at the local level. Between the place-based models and IAMs, Creutzig defines transport sector models, which include Linton’s System Dynamics and techno-economic models.
Using the previously defined spatio-temporal criteria for the model selection in this paper leads to the green highlighted zone. As the focus of this analysis is on transport-only models, integrated assessment models are neglected in the model selection. Therefore, transport sector models including system dynamics and techno-economic models for calculating the greenhouse gas emissions of the transport sector are considered herein.
The underlying models were identified with the help of an extensive literature survey in well-known databases (i.e., ScienceDirect, SCOPUS, Google Scholar, Wiley, Taylor & Francis, SpringerLink), as well as the websites of various institutes in the field of energy system analysis (e.g., those of the IEA, ICCT, and US national laboratories). In addition, forward and backward snowballing was used to include as many relevant models as possible. The literature was collected in the period from October 2019 to the end of 2020. In order to only include current models, the last publication on the model must have been after 2010. In addition, only analyses that take into account at least one of the defined trends were included. Appendix A contains information on the 41 investigated models and their properties.
The models differ with respect to their spatio-temporal settings and sectoral coverage and these model characteristics are the first point of analysis in this study. In addition to the spatio-temporal settings, the sectoral coverage of the models is also examined. This comprises an analysis of the most relevant modes with respect to transport volume and sectoral GHG emissions. These include especially street modes for passenger and freight transportation like light-commercial vehicles (LCV) and heavy-duty vehicles (HDV). Additionally, frequently discussed alternatives are considered and today’s most common drivetrains and fuels investigated. The drivetrains range from the currently predominant internal combustion engine vehicle (ICEV), to different hybridization stages, to battery- (BEV) and fuel cell-electric vehicles (FCEV). The hybridization stages differ mainly in terms of battery size increasing from hybrid electric vehicles (HEV) over plug-in hybrid electric vehicles (PHEV) up to range-extender electric vehicles (REEV). Possible fuels form a similarly broad list containing, e.g., conventional, bio-, and synthetic fuels.
In order to maintain technological openness, models should take into account the modes, drivetrains and fuels listed in Table 1, which could be used depending on the respective requirements.
The focus of further conducted analyses is on mobility trends. On the one hand, this includes the impacts on future greenhouse gas emissions by the transportation sector. On the other, the consideration of mobility trends in the selected models is examined. Thereby, the ASIF methodology is used to structure the different impacts and methodological aspects of these trends.
The ASIF method was introduced by Schipper and Marie-Lilliu in 1999 to delineate the effects of the transport sector on greenhouse gas emissions [13]. The methodology breaks down the calculation of transport sector greenhouse gas emissions into four main components. These parts become apparent in the mathematical equation below:
G = i , j A   ·   S i   ·   I i   · F i j
The resulting greenhouse gas emissions G are dependent on the activity A , the modal share S i, the energy intensity I i, and the fuel carbon intensity F i,j. The activity A describes the total transport demand in passenger- or ton-kilometers (pkm or tkm). The modal share S represents how much of the overall transport demand is covered by each mode (in %). The energy intensity includes information on the mode-dependent fuel consumption per delivered passenger- or ton-kilometer (MJ/pkm or MJ/tkm). Finally, the fuel carbon intensity considers the emitted amount of greenhouse gas emissions of the used fuel (gCO2-eq./MJ). Moreover, Schipper and Marie-Lilliu determine the modal energy intensity based on three components [13]:
I i =   f     E i   ,   C i   ,   U i  
First, the technical efficiency E is considered, which is affected by the type of drivetrain and fuel that is used. Furthermore, vehicle characteristics are combined in factor C . These comprise characteristics such as the vehicle mass or drag coefficients, which largely influence the vehicle’s mechanical energy demand. U denotes the capacity utilization, considering the mode-specific statistical average of the load or passenger capacity utilization.

3. Boundary Conditions of Transport Sector Models

In this section, the spatio-temporal scope of the investigated transport sector models is analyzed. Further analysis regarding the boundary conditions can be found in Appendix B. This comprises the temporal, as well as spatial resolution. Additionally, the sectoral coverage of the models is examined. Therefore, the considered modes, drivetrains, and fuels are regarded.
As the models have been developed for answering different individual research questions, the model approaches characterized by the boundary conditions differ. This can, for example, include the temporal and spatial aspects. The spatio-temporal settings can be divided into the overall scope and spatio-temporal resolution.
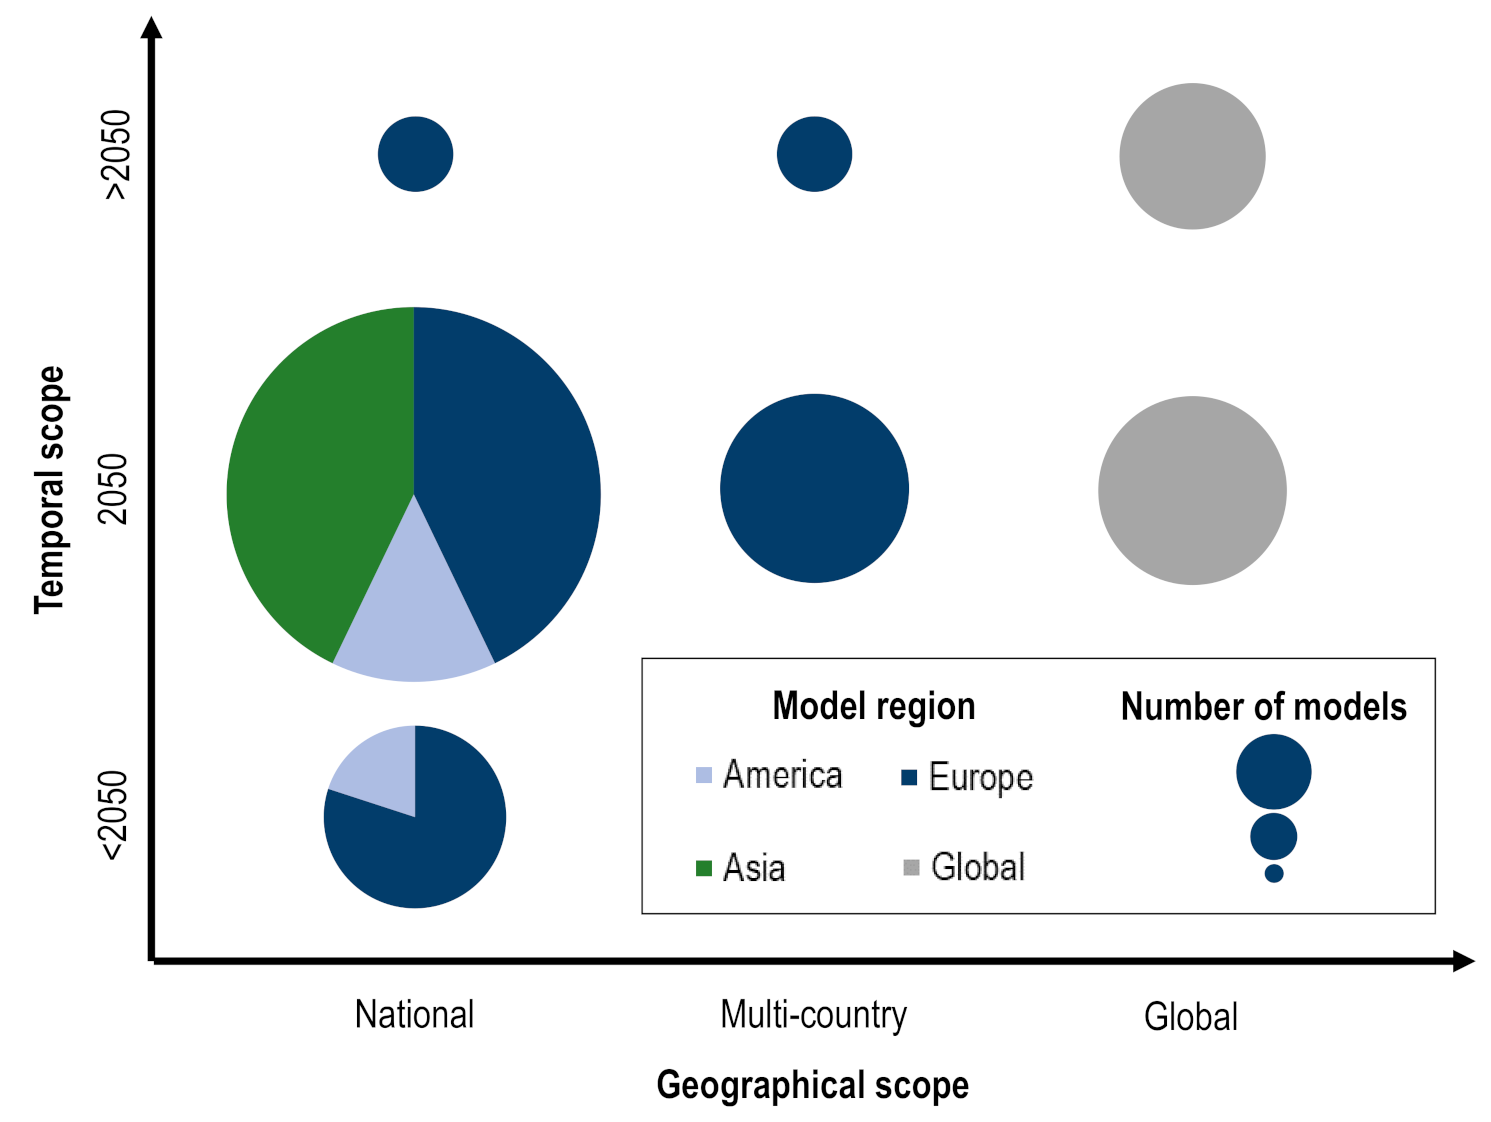
The time horizon of the analyzed models is dominated by the year 2050, as can be seen in Figure 3. This is due to the fact that most of the models investigate possible decarbonization pathways, which refer to climate targets in accordance with the Kyoto Protocol [19]. Nevertheless, a small number of the models have a shorter time horizon. Others are already starting to look at possible developments in the second half of the century. This is especially the case for global models.
Aside from the described temporal scope, the geographic scope can also differ. Two thirds of the models analyze the transport sector within national borders (Figure 3). In contrast, eight of the models consider global development. Additionally, some multi-country models analyze the European transport sector. Compared to other multi-country models, the transport, energy, economics, environment (TE3) model, a system dynamics model developed by Gómez Vilchez, does not cover the transport sector globally or at the EU level. Instead, it comprises Germany, France, India, Japan, China, and the USA, which are six of the most relevant passenger car markets in the world [20]. The consideration of larger parts of the world helps in calculating the costs of emerging technologies [20]. This is due to the fact that their costs are largely affected by the learning rate and cumulative production, which depend on global, rather than national markets.
Overall, it can be summarized that transport sector models analyze on average the transport sector on a national scale through 2050. Thereby, the analysis in Appendix B shows the temporal resolution is on a yearly basis and the spatial resolution on a national one. Section 4 shows that higher resolutions are necessary for various effects that result from the different investigated trends.
Furthermore, the analysis has revealed the sectoral coverage of the investigated transport sector models. For the most part, the models cover all of the most important means of transport with respect to energy demand and greenhouse gas emissions. Furthermore, they include the most promising drivetrain architectures. This is also the case for energy carriers, whereby synthetic fuels, which could be a helpful pathway of decarbonization for larger means of transport, are underrepresented. The inclusion of all relevant modes is a precondition to correctly modeling the effects of modal shifts. The same applies to the drivetrain technologies and the fuels used with respect to the trend in the fuel shift.

4. The Impact of Mobility Trends on the GHG Emission Calculation

Before analyzing the modeling of mobility trends in the models in Section 5, this section provides a detailed overview of the trends’ impact on greenhouse gas emissions. The effects are structured according to the ASIF methodology, which was introduced in Section 2.

4.1. Modal Shift

The first analyzed trend in the transport sector is the modal shift. It is one way of reducing the overall greenhouse gas emissions by shifting the transport demand from energy-intensive to less intensive modes. Therefore, it influences the modal split ( S ) in the ASIF equation (see Equation (1)).
The benefits of shifting the transport demand from one mode to another with regard to greenhouse gas emissions can result from several effects. For mass transportation modes like public buses and railways, the specific energy demand per transport volume ( I in MJ/pkm) is lower compared to individual passenger cars [21]. This is due to the higher occupancy rates which, on average, more than compensate for the higher vehicle-specific energy consumption profiles of larger vehicles. The described effect could even become strengthened by the modal shift if it leads to higher utilization rates of already available capacities. Moreover, in the case of railways, the high share of electrified transport enhances the positive effect on greenhouse gas emissions through higher powertrain efficiency. This electrification is also the reason for a possible lower fuel carbon intensity ( F ) in the case of high shares of renewables in electricity compared to fossil fuels.
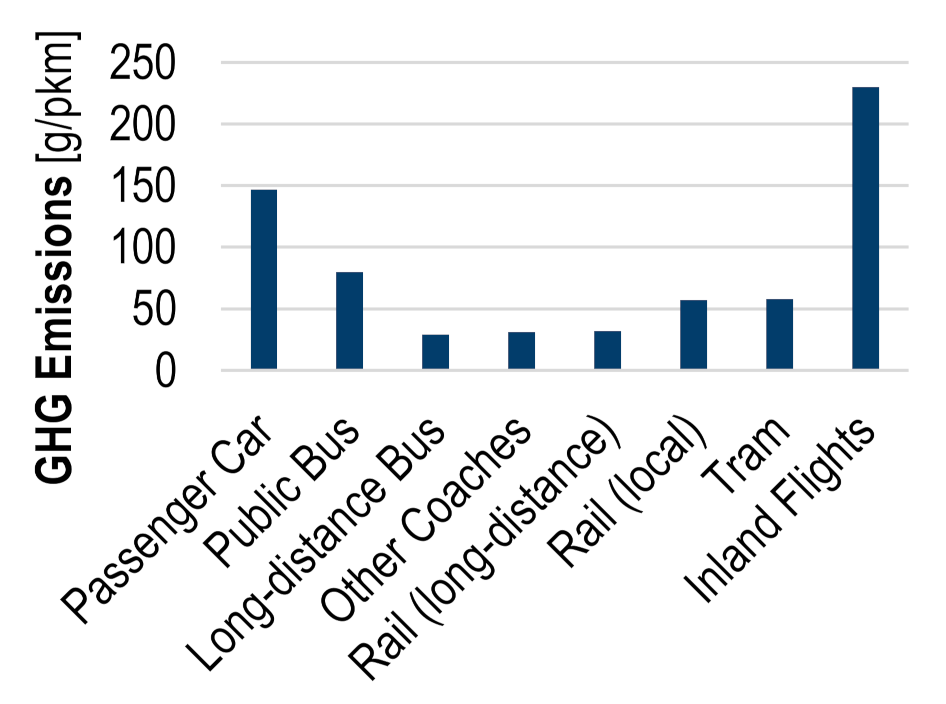
Figure 4 shows the average greenhouse gas emissions of several passenger transport modes for Germany in 2018.
It illustrates the large difference between passenger cars, as well as inland flights and other public means of transport. This difference applies not only in Germany, but worldwide [23]. Additionally, a switch to slow modes such as walking and cycling to reduce GHG emissions is conceivable.
The reduction already possible today as a result of the modal shift illustrates the major influence of this trend on transportation GHG emissions in the future. It directly leads to a GHG emission reduction without the need for technological change. Instead, the reduction is fully driven by user behavior.

4.2. Fuel Shift

Another major trend in the transport sector is fuel shift. This does not only mean changes in the fuel, but in most cases also implies a switch to a different drivetrain. The drivetrain change is often referred to as electrification, but this neglects the possibility of only using renewable- instead of fossil-based liquid fuels in ICEVs. This is included in our analysis, as it is a promising means of decarbonizing heavier vehicles.
The fuel shift has various effects on greenhouse gas emissions in the transport sector and their calculation using the ASIF method. Both the energy intensity I and fuel carbon intensity F are significantly altered by the trend.
The switch from conventional ICEVs to electrified vehicles leads to an increase in drivetrain efficiency. The higher the grade of electrification, the larger the improvement [24]. Switching to FCEVs decreases specific energy consumption as well, but not as much as in the case of BEVs.
Especially in the case of plug-in hybrid vehicles, the usage pattern plays an important role. On the one hand, the user might drive nearly all of their trips in fully electric mode due to short distances and frequent charging requirements. On the other side, it is also possible that only a small share of the overall mileage is driven electrically due to long distances and infrequent vehicle charging.
Moreover, different driving regions influence the impact of the fuel shift. The efficiency improvements of electrified drivetrains compared to conventional ones are in part a result of recuperation. With a high proportion of constant driving, e.g., in rural areas or on freeways, recuperation plays a subordinate role. In contrast, driving profiles that are characterized by frequent acceleration and braking, which are typical for urban driving, lead to a high potential for recuperation.
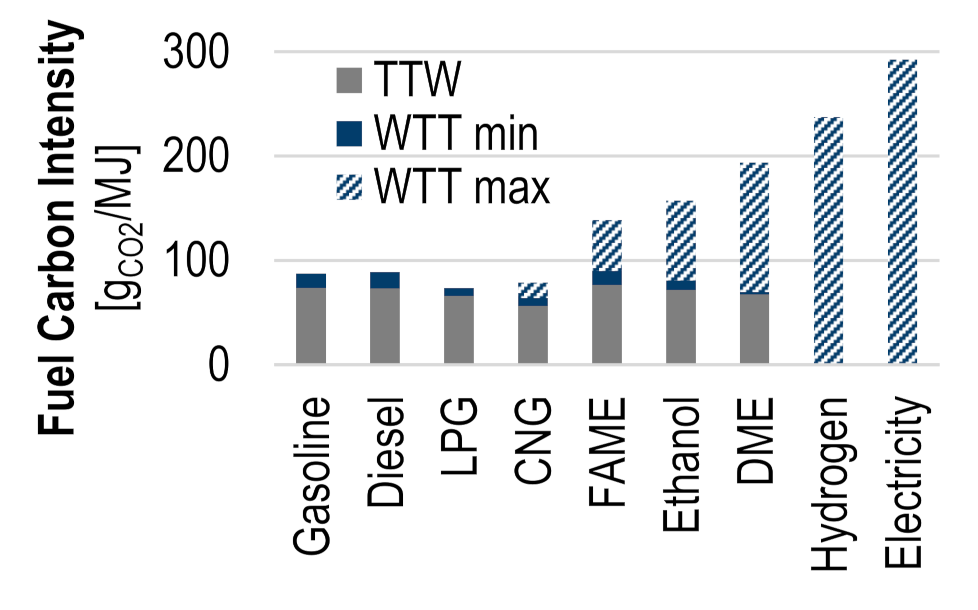
Next to the changes in energy intensity, the fuel carbon intensity is also influenced by the fuel shift, as noted above. Figure 5 displays the well-to-wheel (WTW) fuel carbon intensity divided into well-to-tank (WTT) and tank-to-wheel (TTW) values according to the information provided in [25]. It illustrates the reduction potential of the fuel carbon intensity through fuel shifts. Additionally, it becomes apparent that the fuel carbon intensity of alternative fuels such as electricity and hydrogen are more dependent on the WTT rather than the TTW component. Due to various possible WTT pathways for the different energy carriers, this part of the fuel carbon intensity must be understood as a spectrum depending on the energy mix instead of a fixed value. Especially for biofuels, the WTT fuel carbon intensity underlies a wide range depending on the production pathway used.
Some studies show that the modal choice is also influenced by environmental issues [26]. In case the modal choice does have such an environmental component, the fuel shift could lead to a modal shift, and therefore also influence the modal share ( S ).
Overall, this subsection has shown the major impact of the fuel shift trend on GHG emissions in the transportation sector.

4.3. Shared Mobility

The emerging trend for shared mobility could also lead to major changes in the transport sector. In order to investigate the different impacts on the four stages of the ASIF method, in Appendix C, a short distinction between different shared mobility concepts like car-sharing, ridesharing and on-demand ride services was made based on the work of Machado et al. [27]. The impacts of shared mobility on transport sector modeling are manifold and, in the following, are structured according to the ASIF methodology.
Overall transport activity ( A ) can be affected by on-demand ride services. Especially for people who are too young to drive cars or elderly people who can no longer drive, such a mobility on demand is an attractive option [28]. Not only for trips they would otherwise have taken with other means of transport but also for new trips they may otherwise not have made at all.
In case trips could have been made with other means of transport, shared mobility would have an impact on modal shares ( S ). It is conceivable that trips by public transport, private cars, and other means of transport could be replaced by this new mode of transport. Therefore, shared mobility can influence the modal shift described in Section 4.1.
Furthermore, the energy intensity ( I ) is affected in different ways by shared mobility. As the energy intensity of vehicles depends, inter alia, on the powertrain used, the choice of technology when purchasing a vehicle is crucial to its overall energy intensity. The factors driving purchasing decisions for vehicles differ for private and commercial buyers. Whereas commercial buyers are more concerned with cost, private ones may be more driven by other considerations. As shared vehicles are largely commercially owned, the purchase decision and thus the energy intensity is influenced. Another point to note in this context is the affected vehicle utilization. Shared vehicles amass a higher yearly mileage [29], which leads to greater competitiveness among vehicles with low operation costs, which is another aspect that may alter technology decisions. In addition, driving ranges must be adjusted in order to cover the higher daily mileages with the lowest possible charging times.
A further impact on the energy intensity resulting from shared mobility is the “rightsizing” effect. Without owning one vehicle for all purposes, users have the possibility to adapt the vehicle in terms of size and other characteristics to the needs of each trip [30]. For instance, a small vehicle with low battery capacity for short city trips or a large van with an adapted drivetrain configuration for longer family trips. This enables the utilization of vehicles to be optimized.
Another form of utilization optimization is achieved by ridesharing, which leads to higher occupancy rates, and which are a major influencing factor on vehicle energy intensity and thus the GHG emissions caused by a given transportation mode according to Schäfer and Yeh [31]. Additionally, higher occupancy rates lead to less congestion, assuming that no further passenger car activity is generated by shared mobility [32]. As congestion has a considerable influence on the energy consumption of vehicles, the overall energy intensity is further affected.
In the case of plug-in electric vehicles, shared mobility can have an impact on the electricity carbon intensity ( F ) used for battery charging. This effect results from the change in use and the resulting different loading times that influence the carbon intensity of grid electricity [33].
In summary, shared mobility influences all components of the ASIF methodology. The greatest impact can be expected in the context of energy intensity. However, the effect on the modal share should not be underestimated.

4.4. Automated Driving

The final mobility trend considered is automated driving. The latter describes influences on the ASIF factors that are dependent on the level of vehicle automation. Therefore, in Appendix D, a short introduction to the different stages of automated driving is provided.
In the following, the impacts of automated driving on the different parts of the ASIF factors are described, primarily based on the work of Wadud et al. [34]. As noted above, the effects depend on the degree of automation. Although some mechanisms already result from level 1 vehicles, others require a high degree of automation.
The first effect on the ASIF factors arises from possible travel cost reductions due to vehicle automation [35]. As the overall transport activity ( A ) partially depends on costs, such a reduction would lead to increasing demand. Additionally, the change in costs would affect the modal choice and therefore leads to different modal shares ( S ).
Older and younger people who cannot drive cars on their own are restricted in their mobility [34]. A high level of automation whereby vehicle operators would not need to perform tasks related to driving could also be used by members of these age groups. Thus, vehicle automation opens up new possibilities that could lead to increasing personal mobility and a modal shift from other transport modes to passenger cars. Both effects mentioned so far could be amplified if vehicle automation develops with the different forms of shared mobility, as users would not have to own a vehicle, which is costly in the case of low utilization rates.
The increasing comfort with higher levels of automation increases the attractiveness of passenger cars. In particular, for longer trips it is an advantage to be able to engage in other activities during the journey. This counterbalances such advantages of other modes, such as rail, which affect passengers’ modal choices.
In addition to the effects on activity and modal share, various influences on energy intensity ( I ) are made possible by vehicle automation. Some of these are at the level of networks, others of vehicles. The exchange of information between vehicles themselves, as well as infrastructural elements, can reduce congestion, which is a major driver of fuel economy [34]. Less congestion would diminish the advantage of electrified vehicles regarding fuel economy due to less recuperation being required.
Another mechanism that has an impact on fuel economy is so-called platooning. By driving closer to vehicles in front, the air drag can be considerably reduced. This mechanism achieves a greater effect, especially at higher speeds, due to the intensifying aerodynamic effects that accompany increasing velocity. In particular, semi-trailers primarily drive on freeways at nearly constant speeds, and are suitable for platooning, which is the reason for testing the activities of vehicle manufacturers [36,37].
Furthermore, vehicle automation can lead to better fuel economy due to ecologically-conscious driving. Different studies have shown the possible reductions in fuel consumption if human drivers are trained in eco-driving methods [38]. It is therefore to be expected that automated vehicles will also be able to improve fuel economy through eco-driving. This effect would be strengthened by increasing connectivity between vehicles themselves, as well as infrastructural elements [38].
One aspect of eco-driving is less acceleration. The acceleration capability of passenger cars has increased over the last few decades [39]. Alongside higher maximum speeds, this is the main reason for more powerful drivetrains being developed in recent years. As passengers may find it uncomfortable to experience high acceleration in self-driving cars, this could in turn result in lower average engine power. This in turn reduces vehicle mass and therefore improves fuel economy. Wadud et al. cite improved crash avoidance due to vehicle automation as another possible reason for reductions in weight and fuel consumption [34].
However, these are not the only effects that decrease fuel consumption. The hardware components of autonomous systems can lead to higher vehicle masses. Additionally, the systems increase the electric demand required on top of other auxiliaries [40].
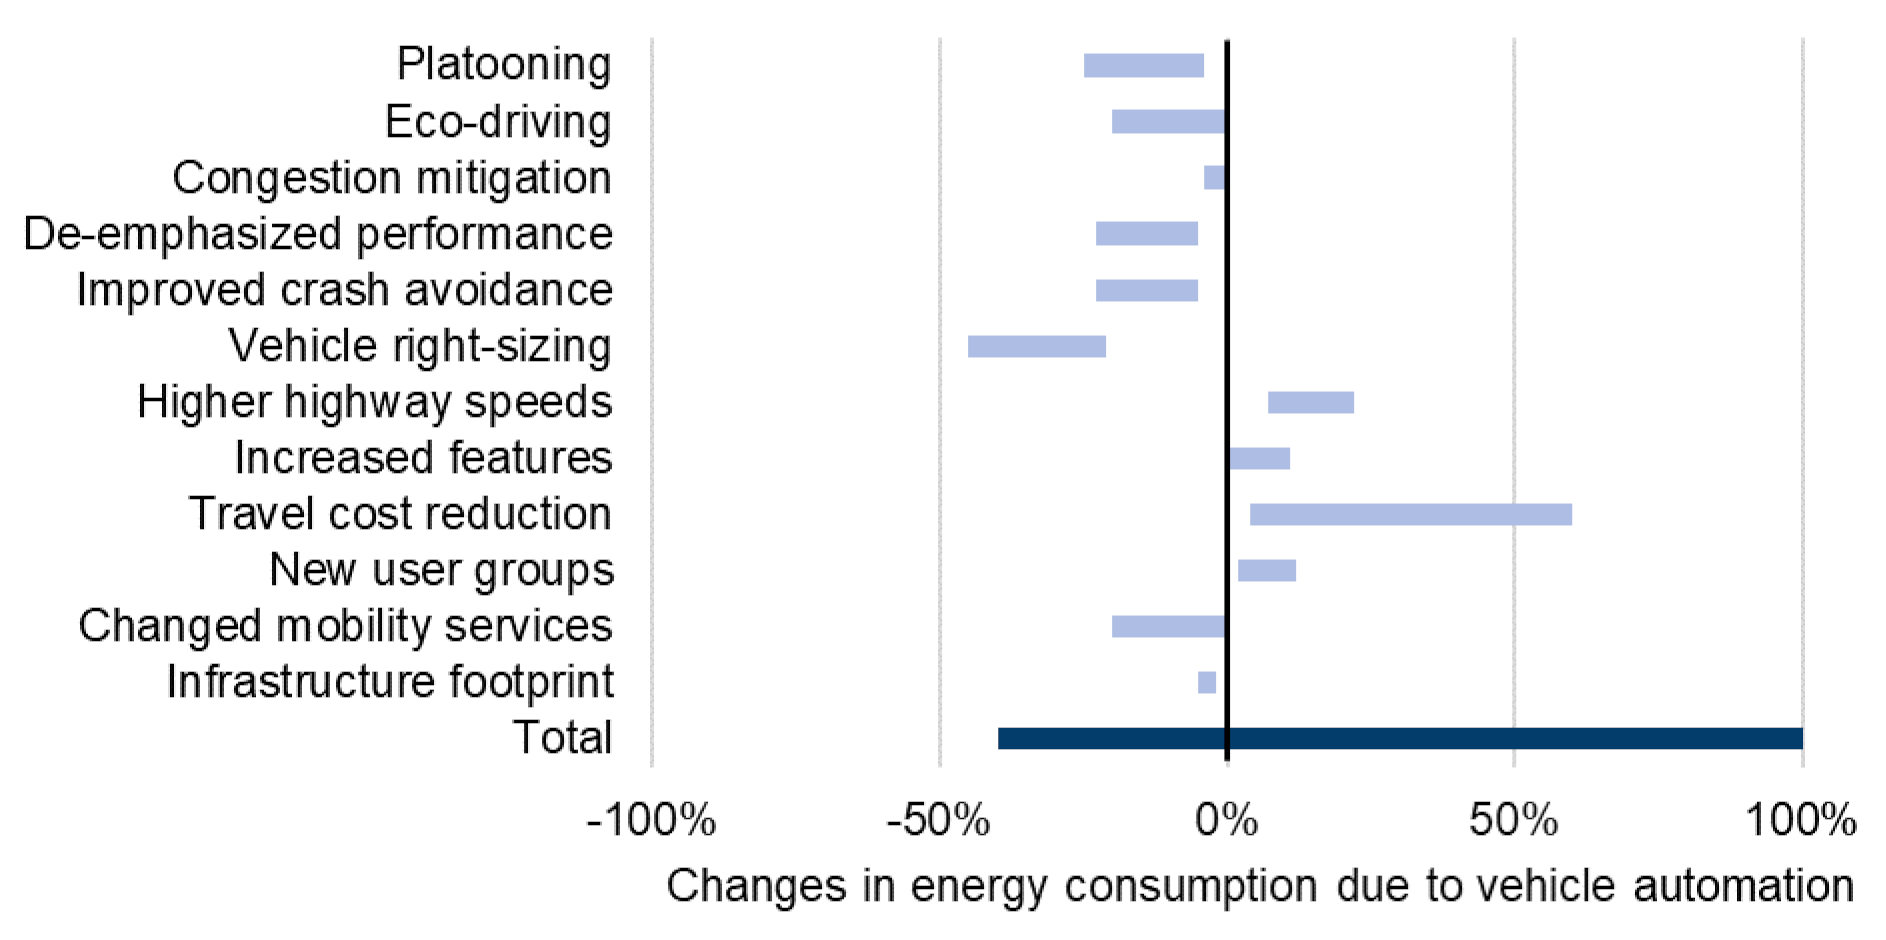
Figure 6 shows the possible changes in energy consumption due to vehicle automation effects according to Wadud et al. [34]. Mechanisms that lead to reductions in fuel consumption predominate. However, it becomes apparent that the changes resulting from individual effects can vary widely. The overall impact thus depends strongly on the nature of the individual effects, as the scenarios by Wadud et al. show. The total scenario results range from a 40% reduction up to 100% increase in the total road transport energy demand [34].
According to Wadud et al., the fuel carbon intensity ( F ) is influenced by three effects that potentially alter the technology decisions of vehicle buyers [34]. Firstly, autonomous vehicles could drive to stations in an unattended mode. Thus, the user’s acceptance of alternative fuels such as electricity and hydrogen is increased, because the low density of charging infrastructure or fueling stations is not as inconvenient as it is without self-driving cars. Secondly, small driving ranges represent a barrier for users. As autonomous vehicles could charge more often without additional time for the driver, this could reduce the hurdle for vehicles with small driving ranges. Thirdly, self-driving cars can push the trend of shared mobility. The higher mileages of such shared vehicles make vehicles with low operational costs more economical, although they could require a higher one-time investment for alternative vehicles in early market phases. All three stated effects could speed up the market penetration of alternative fuels.
The previous section described the manifold impacts of the considered mobility trends on the different factors of the ASIF method and thus the overall GHG emissions of the transport sector. Although the modal shift primarily influences the modal share ( S ), the fuel shift effects are more related to energy intensity ( I ) as well as fuel carbon intensity ( F ). It is also shown that the trends should not be considered in isolation, but in aggregated form, as they can influence one another. Shared mobility and autonomous driving in combination in particular can affect the modal and fuel shifts in principle.

5. Mobility Trends in Transport Sector Models

The following section presents an analysis of mobility trends in the transport sector models. Thereby, the extent to which the previously described effects are investigated in the transport sector models is analyzed below.

5.1. Modal Shift

The modal shift is modeled in the transport sector models in different ways. These are described in the following section. An important precondition to investigate the effects of modal shifts on the energy demand and GHG emissions of the transport sector is the inclusion of all major means of transport. As was analyzed in Appendix B.2, most of the examined models fulfill this requirement.
A simple way of including a modal shift is to exogenously assuming it. In such a case, the shift from one transportation mode to another is defined by the user as an exogenous percentage parameter [41].
Another methodology for modeling the modal shift is via elasticities. Brand et al. calculate the travel demand T according to Equation (3) [42]:
T n T n 1 = G D P n G D P n 1 E G D P   ·   N H H n N H H n 1 E N H H   ·   R C n R C n 1 E R C
The travel demand in year n is dependent on the gross domestic product (GDP), the number of households (NHH) and a factor for the relative vehicle ownership and operating costs for the demand segments (RC). The relationship between the travel demand change and change in each of these parameters is calculated with the help of elasticities (Ex). The elasticity (ERC) includes the shift from one mode to another. In case the costs of providing one pkm or tkm changes relative to one another, the modal shift takes place. Therefore, the modal shift is dependent on monetary factors using the methodology applied by Brand et al. [42].
The most common means of modeling the modal choice and thus also the modal shift is via discrete choice models. The principles of such discrete choice models can be found in a study by Ben-Akiva [43]. In order to calculate the share of mode i, the following multi-nomial logit (MNL) type equation is used [44]:
S h a r e i = exp λ   · C o s t i i exp λ   · C o s t i
where λ is a factor that represents the sensitivity of the mode’s share to the different costs [44]. The basic form of the MNL-type equation is the same for all models. The share can be calculated on an aggregated geographical level [45] or for each of the considered regions [44]. Furthermore, Mittal et al. consider trip distance categories in their modal choice [46].
The main difference between the models using discrete choice results from deviating factors C x that are included in the total considered cost. Furthermore, these cost types can be weighted by deviating α x :
C o s t = x α x   · C x
Travel time is the most important influencing factor aside from travel cost [47]. Thus, it is included in most of the models.
Mittal et al. calculate the cost of a mode based on the weighted prices of the different drivetrain technologies used and the monetary cost of time. These travel time costs are dependent on the GDP, population, annual working hours, as well as the door-to-door travel speed, of the investigated modes [46].
Similarly, Wang et al. include the travel time cost, which they determine by employing the ratio of hourly income and vehicle speed. Furthermore, they make use of the possibility of weighting the factors when calculating the overall cost. Thus, travel time costs, for example, may have less influence than the fuel cost. Additionally, Wang et al. split up the fuel cost from other vehicle-related costs, such as the purchase price, maintenance cost, and taxes. Therefore, the influence of the fuel cost on the modal choice can be highlighted [45]. This could lead to different modal choices if the drivetrain and, consequently, the fuel cost of a mode change.
Apart from costs related to vehicles and travel time spent by passengers, infrastructure costs are another cost factor the influences the societal cost of transport. Girod et al. consider these costs in terms of the non-energy cost of the different modes if the costs are not subsidized by the government. Otherwise, these costs do not influence travel behavior and should therefore not be considered [44].
Another difference in the TRAVEL model of Girod et al. compared to other models is the endogenous calculation of the weight of time costs. The analysis by Schäfer et al. showed the temporal constancy of the daily travel time in various countries with different levels of development [48]. Therefore, Girod et al. include this travel time budget as an additional boundary condition. If the travel time budget is exceeded, the weight of travel time costs is increased until the condition is met [44].
The analysis shows how the modal shift effects on the modal share ( S ) are modeled in the literature. The inclusion of modal shift in transport sector models has been a major topic in research during the last decades. The most widely used discrete choice models allow consideration of various parameters affecting the modal shift.

5.2. Fuel Shift

The fuel shift effects identified in Appendix B.2 are manifold. The modeling of these is analyzed and described in the following subsection.
The basis for modeling the fuel shift is the inclusion of the most important drivetrains and fuels available in the investigated time horizon. As noted in Appendix B.2, this precondition is fulfilled by most of the models. Only some drivetrain alternatives like REEVs are underrepresented, although they may attain not insignificant shares in the future transport sector. The same applies to synthetic fuels, which are predicted to play a major role in the decarbonization of shipping and aviation [49].
In most of the analyzed models, the fuel consumption of the considered modes and drivetrains is an exogenous assumption. Others carry out drive cycle calculations to determine the fuel consumption [50,51]. In contrast to other models, Belmonte et al. assume fuel consumption to be constant over time, except in the case of BEVs [51]. Therefore, they also neglect technological improvements for vehicles (aerodynamics or mass reduction) and drivetrains.
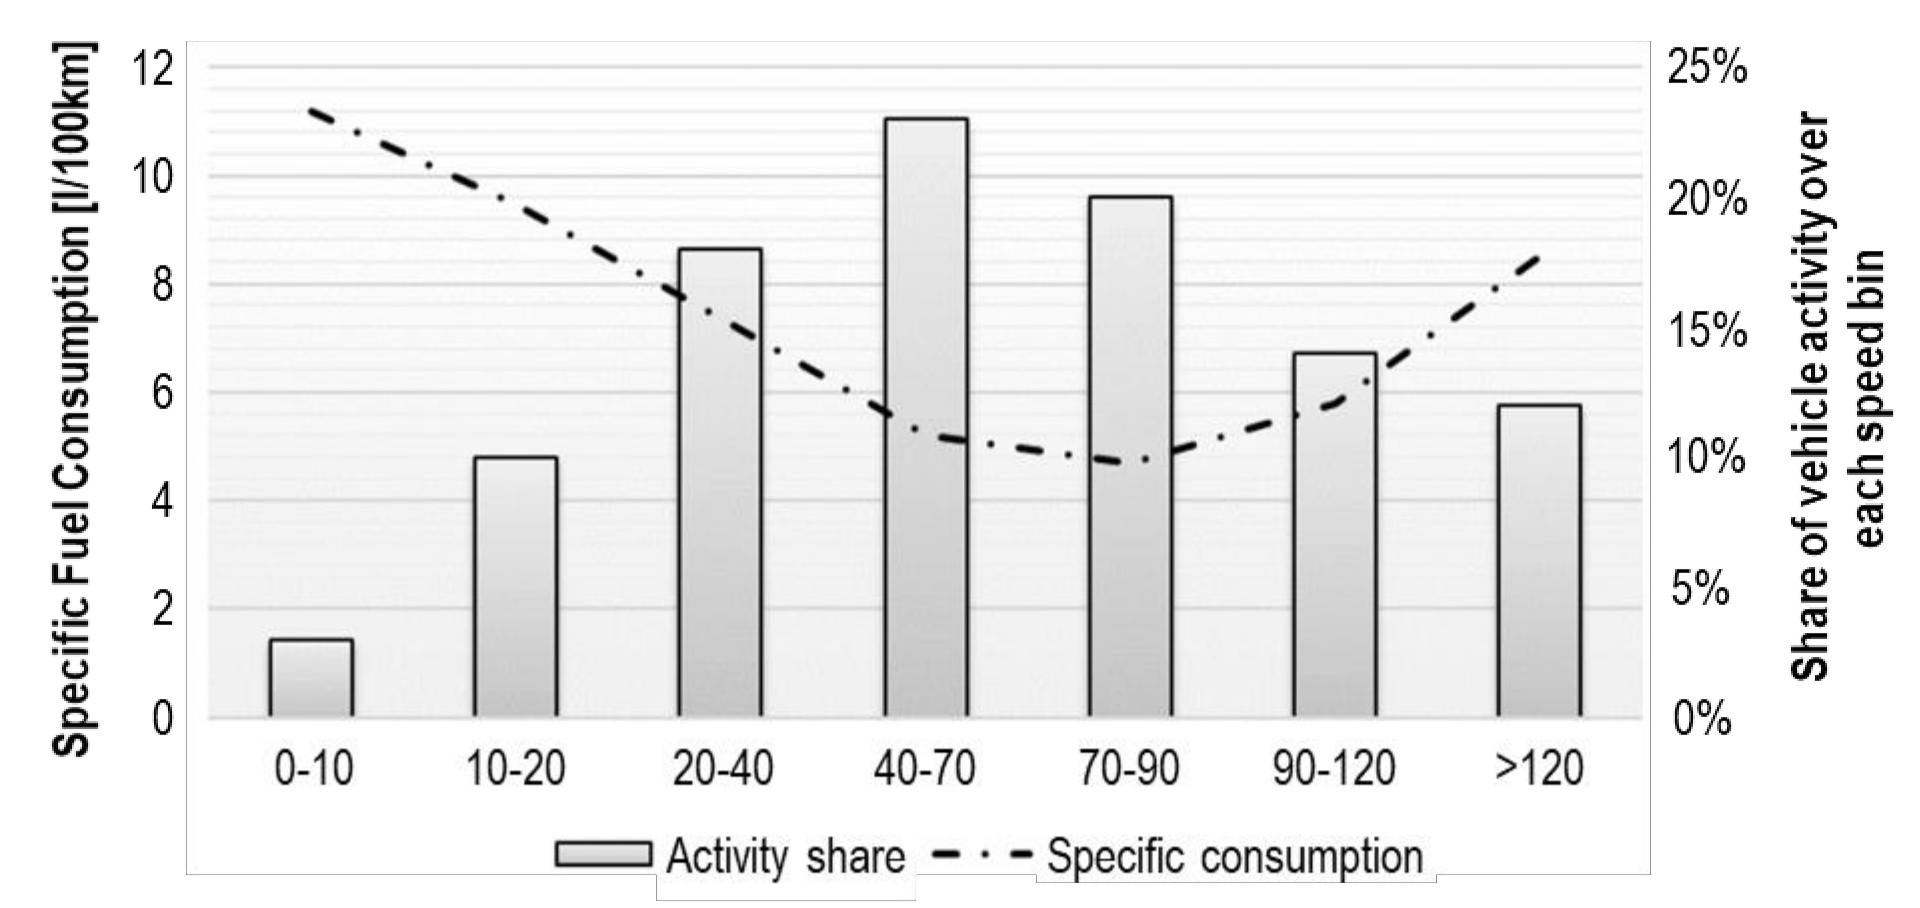
In order to consider regional effects on fuel consumption, six of the models differ between typical types of regions, e.g., urban and rural areas. Within the Renewability modeling framework, this is achieved by means of exogenous assumptions [52]. Siskos et al. take into account different speed bands, as depicted in Figure 7 [53]. The overall fuel consumption is determined by activity shares for these defined speed bands, and the corresponding specific fuel consumption values. The activity shares are exogenously assumed depending on the investigated geographical area. By changing these shares, the effect of increasing or decreasing congestion on fuel consumption can also be taken into account.
Belmonte et al. weight different ARTEMIS drive cycles depending on trip length. Although short trip fuel economy is dominated by the city cycle, longer trips include a greater share of the highway cycle [51]. Furthermore, they consider different shares of electric driving for PHEVs depending on trip length. The longer the trip, the lower the electric driving share due to low battery capacities and so low electric ranges of PHEVs [50].
As most of the models do not differentiate between geographical areas, they neglect the differences in fuel consumption behavior of drivetrain architectures (see Section 4.2) and the deviating fields of application that result.
Alongside the above-outlined modeling of energy intensity I , the modeling of fuel carbon intensity F is another important point to analyze regarding fuel shift trends. Almost all models employ exogenously-determined carbon emission factors for the investigated fuels. In most cases, these emission factors are split into WTT and TTW segments. Conventional fuel emissions are dominated by the TTW segment and WTT production alternatives do not have major impacts on the overall carbon emissions (see Figure 5). Therefore, fixed time-independent carbon emission factors correspond to conventional fuels’ carbon emission behavior.
For alternative fuels, the WTT emissions can vary, largely depending on the fuel production technology used [25]. Therefore, the shares of the different production technologies must be determined. This can either be performed exogenously or endogenously. For example, Belmonte et al. assume the share of electrolysis for global hydrogen production to be increasing from 10% in 2020 up to 20–70% in 2050 depending on the chosen scenario [51]. In contrast, Yabe et al. model the electric power supply and thus calculate the technology shares, as well as the corresponding WTT CO2 emissions, endogenously [54].
In the case of mixing the production pathways, emissions can also be time-dependent, which is especially important for electric charging, as described in Section 4.2. Therefore, Pichlmaier et al. use hourly WTT emission factors for electricity, which are calculated by an energy supply model. Their results indicate higher mean emission factors for charged electrical energy compared to the overall average in each investigated year. The greatest difference of +10 gCO2/kWh occurs in 2035 [55]. Thus, electricity supply and demand should be temporally-resolved in order to correctly calculate the fuel carbon intensity.
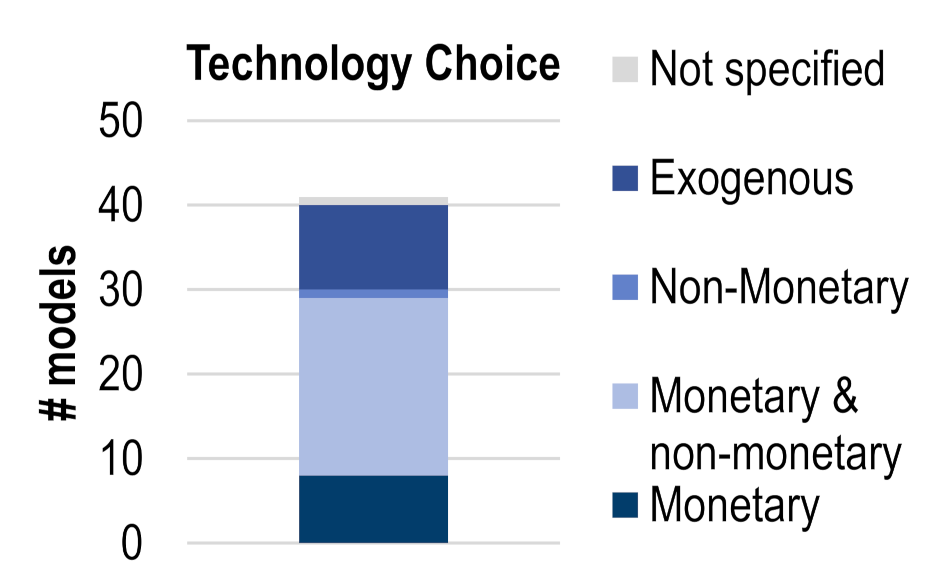
The overall effect of the fuel shift on transport sector emissions depends on the technology’s adoption by decision makers. The question concerns the reason why buyers choose a particular technology. Therefore, modeling of the technology choice is analyzed in the following. Figure 8 provides an overview which criteria were used in the investigated models.
Firstly, the exogenous and endogenous modeling of technology shares for the transportation modes should be differentiated. In ten of the investigated models, the shares were exogenously assumed. Thus, these models do not endogenously include user behavior or decision processes.
Another eight models conducted a monetary comparison of the drivetrain technologies. In these cases, the decision was mostly taken with the help of a total cost of ownership (TCO) analysis. Thereby, different vehicle cost types were taken into account, and can be categorized into one-time investment costs (purchase), fixed (e.g., taxes), or variable (e.g., fuel costs) operating costs. These costs are usually specifically calculated per kilometer and thus include the vehicles’ mileages. As the TCO can be calculated from the system viewpoint on the one hand, and from that of the user on the other, the cost types considered may differ [56]. As an example, Pichlmaier et al. employ the system view and thus neglect the tax advantages of different drivetrain technologies [55]. Although Yabe et al. only utilize monetary criteria for the technology choice as well, their concept differs compared to the others mentioned above [54]. As their model also comprises the power supply, these costs are also included in the overall optimization function. Thus, the effects of the transport sector on the power sector are taken into account when choosing the drivetrain technology.
Many analyses have shown that in reality, vehicle purchasing decisions are not only made based on economic (monetary) criteria but are also influenced by other factors [50]. As depicted in Figure 8, most of the investigated models include non-monetary criteria next to the previously described monetary ones in order to model the technology choices in a more realistic manner. In such cases, discrete choice models comparable to those described in Section 5.1 for modal shift modeling are used. The different drivetrain technology properties are weighted with the utility function in order to model the influence of these factors on purchasing decisions. Often-considered non-monetary factors include range anxiety and the availability of refueling/recharging infrastructure, which plays an important role for alternative drivetrain technologies such as FCEVs and BEVs [57]. Harrison et al. developed a more advanced discrete choice modeling approach [58]. The determined utility function, including all other criteria, was multiplied by a factor called willingness in order to consider what was introduced by Struben and Sterman in 2008 [59]. With the help of this factor, Harrison et al. took into account marketing and word of mouth, which increase the awareness of potential buyers of new technologies. If this factor is too low, the technology is not considered in the buyers’ consideration set [58].
Belmonte et al. were the only researchers to model the technology choice endogenously based solely on non-monetary criteria. The objective function was minimized in their optimization model and includes the LCA greenhouse gas emissions of the transport sector. Thus, their investigations focus on the minimum achievable GHG emission potential [51].
In nearly one third of the investigated models, different buyer types are categorized due to different usage patterns and priorities of decision-makers. These categories can be defined based on various socio-economic parameters. Brooker et al. [60] and Siskos et al. [53] use income as a classification criterion. Meanwhile, Manley et al. classify according to buyers’ housing types [61]. Trost instead differentiates between private and commercial buyers [50]. Furthermore, he includes a willingness to pay more to account for different adopter groups in accordance with Rogers [62]. Thus, the cheapest drivetrain is not always chosen, but rather the alternative with the lowest GHG emissions within a cost range.
If not only one year, but many years are exogenously modeled, the defined boundaries can be set in order to include market ramp-up models such as the S-curve model for the fuel or drivetrain shift [62]. Therefore, in the TRAN model, maximum penetration levels are set as an upper boundary, depending on the years in the market [63].
The manifold effects of fuel shift are considered very differently in the investigated models. For example, the modeling of vehicle energy consumption ranges from exogenous assumptions to detailed user groups and speed-dependent modeling. Within the analyzed models, the choice of technology is affected by both monetary and non-monetary criteria.

5.3. Shared Mobility and Automated Driving

Due to the large interactions and likely combination of shared mobility and autonomous driving in the future, these two trends are often discussed together in the transport sector modeling literature. Thus, an analysis regarding the modeling of these trends is also combined in this section.
First of all, it should be noted that these two trends are still mostly not taken into account in transport sector models. Adolf et al. assume a lower motorization rate for younger people in their model as a result of car-sharing [64]. Hacker et al. make similar exogenous assumptions regarding transport demand due to car-sharing and autonomous driving [65]. In their “Limitless” scenario, the average trip length is increased by 10%, and work trips by even 20%, due to autonomous driving. In some cases the effects are chosen in contrast to each other. Although the occupancy rate in the “Limitless” scenario is assumed to decrease from 1.47 to 1.4 due to the increasing number of empty trips by autonomous vehicles, car-sharing leads to an increase in the occupancy rate in the “Regional” scenario to 1.6 [65]. This demonstrates the great uncertainty regarding the actual impact of the two trends.
Zimmer et al. discuss the influence of autonomous driving, but do not include it in their models. In contrast to this, they model car-sharing as a separate alternative mode [66]. Due to a lack of data, the parameters for the modal choice are based on a combination of car and public transport values. Furthermore, car-sharing mode is assumed to be available dependent on the modeled year and region type. The full availability of this new mode is reached in cities with more than 100,000 inhabitants in 2030 and in those with more than 50,000 inhabitants in 2050. Compared to the previously mentioned assumptions by Adolf et al., the motorization rate decreases in the “Renewability” scenarios due to car-sharing. The difference is that this does not change in relation to the age group, but as a function of the type of region.
Xie et al. expanded the MA3T model in order to investigate the effects of shared and autonomous vehicles on diverse transportation-related research questions, such as future drivetrain shares [67]. Therefore, they used a similar methodology, as previously described by Zimmer et al. To consider automated vehicles and shared mobility a nested multinomial logit model comprises four passenger car modes, as is shown in Figure 9.
Whereas Zimmer et al. only introduce one alternative mode for car-sharing, the four alternatives by Xie et al. represent the possible combinations of automated or human-driven and personal or shared vehicles. Thus, they not only consider car-sharing but also vehicle automation, as well as the combination of both. Aside from consideration of the mode choice process, Xie et al. also take into account the impacts of vehicle automation on fuel consumption and therefore the energy intensity ( I ) with the help of the following equation [67]:
C o n s u m p t i o n C A V = C o n s u m p t i o n H V   · 1 R e d u c t i o n C A V + A d d L o a d C A V
The fuel consumption of connected, autonomous vehicles (CAV) is derived from the human-driven vehicle (HV) fuel consumption, an assumed relative reduction, and an additional electric load by the autonomous system’s components.
The results of Xie et al. demonstrate some effects of vehicle automation and shared mobility. First of all, the number of sold vehicles increases disruptively in 2030 due to the substantial benefits. Furthermore, the share of BEVs is higher due to vehicle automation. However, it is dependent on the additional electric power load. Higher sensor loads lead to higher PHEVs and lower BEV shares [67].
Overall, Adolf et al. [64], Hacker et al. [65], and Zimmer et al. [66] only take the effects of car-sharing on transport demand into account. Xie et al. include the impacts of vehicle automation and shared mobility in a more detailed manner [67]. The results of the MA3T-MC model highlight the importance of doing so. None of the investigated models consider vehicle automation for freight transport, although platooning in particular is capable of reducing vehicle fuel consumption by more than 10% [36].

5.4. Comparison of Mobility Trends

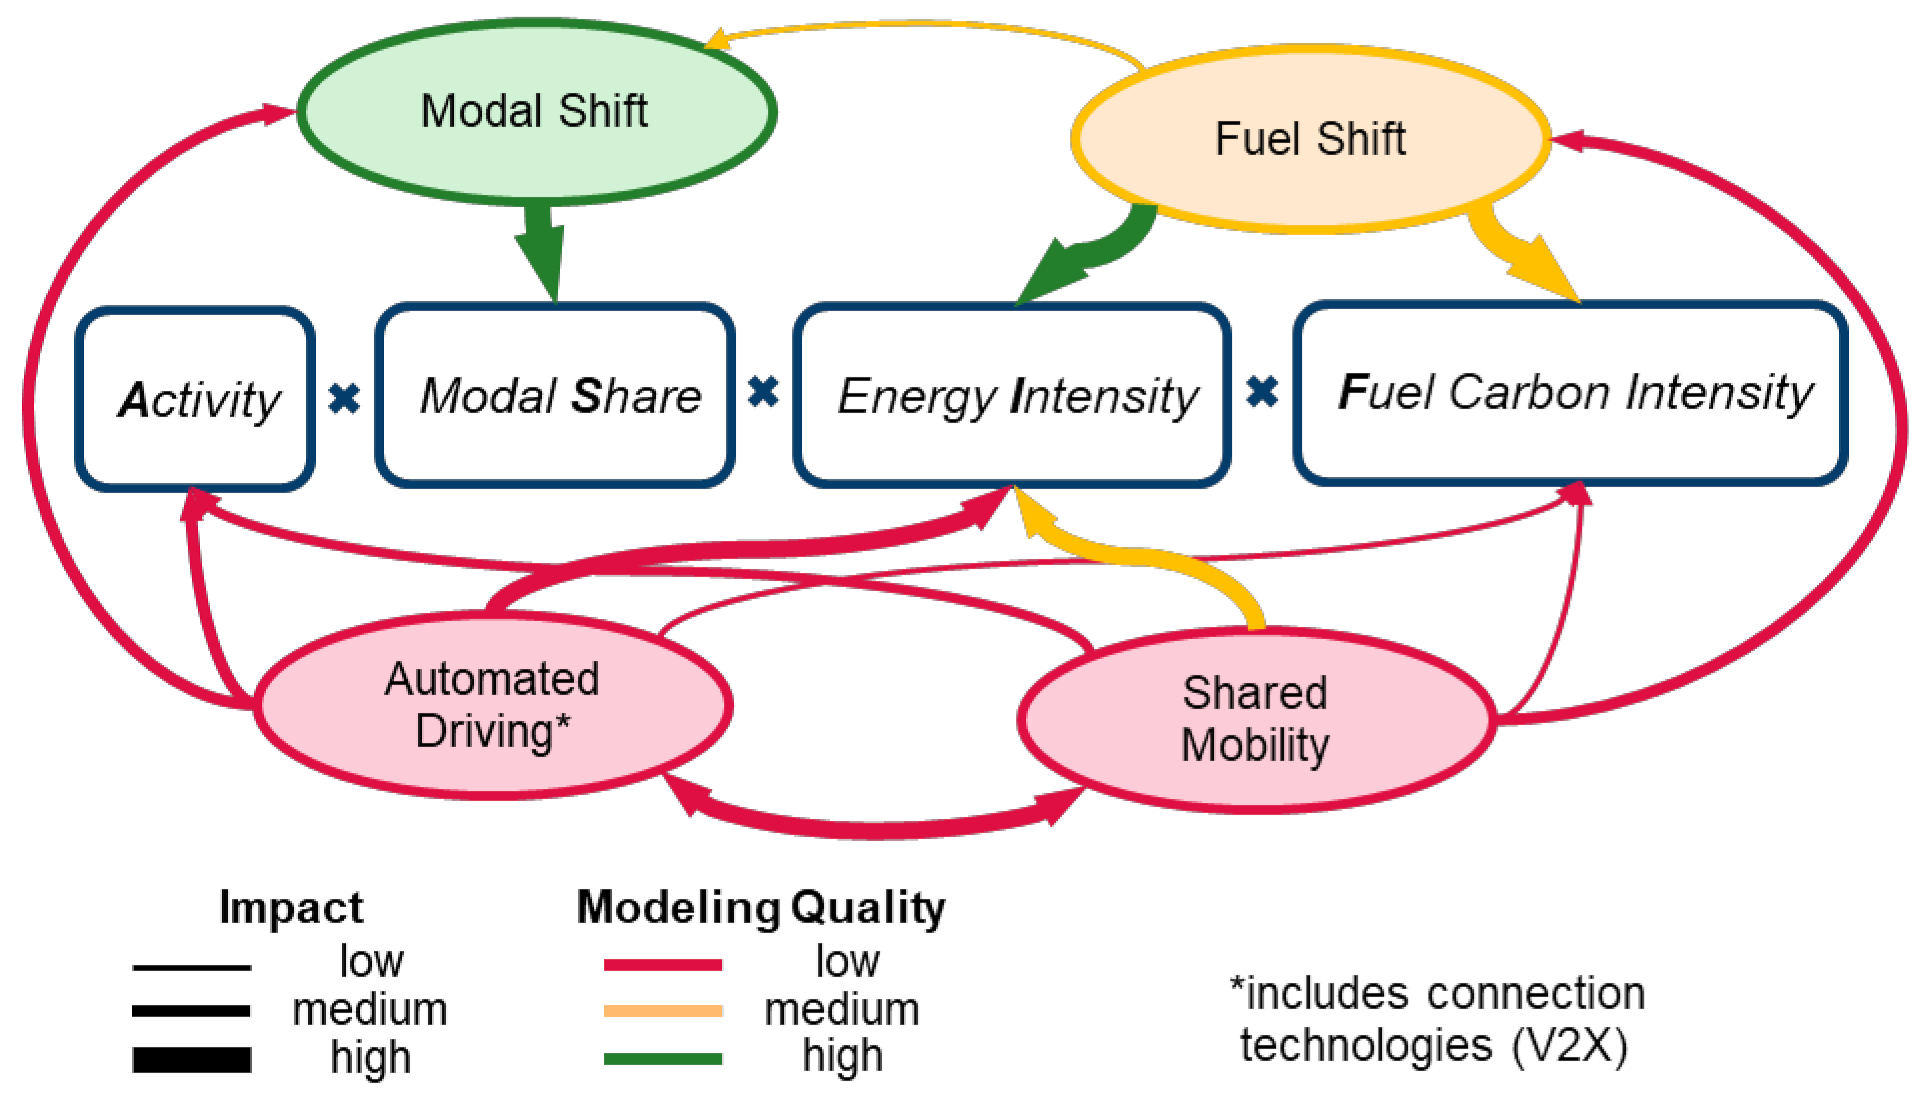
The previous subsections dealt with the mobility trends separately. Thus, the interactions, as well as the consideration of these in the investigated models, are now compared. Figure 10 depicts the influence of the analyzed mobility trends on the different parts of ASIF, as well as each other, as described in Section 4. Furthermore, the diagram includes information on the quality of current models with respect to the depicted interactions.
The differences between the mobility trends become directly evident. The influences of modal and fuel shifts are mostly exerted on parts of ASIF. Effects such as the change in modal share due to the modal shift are easy to follow and modeled with good quality in most of the investigated models. The same applies to the different energy intensities due to the fuel shift. Still, most of the models utilize static fuel carbon intensity values for energy carriers that do not include possible differences, e.g., between the average charged electricity and average total electricity generation. Therefore, further improvement should be made to the details in order to correctly model the overall effects.
In contrast to the modal and fuel shifts, the influences of vehicle automation and shared mobility are manifold. The trends do not only implicate changes in the ASIF factors but also the effects on other trends. Therefore, these two trends have an impact on nearly all parts of transport sector GHG emission calculations. However, most of the interactions have a smaller influence compared to the major impacts of the modal and fuel shifts. Additionally, the effects are often associated with great uncertainties, as can be seen in the wide range in the results presented by Wadud et al. for the impact of automated driving on GHG emissions [34]. Nevertheless, the effects should not be disregarded.
As most of the analyzed models do not consider the effects of vehicle automation and shared mobility at all, the modeling quality of these trends is very low. Only a few consider shared mobility and the higher occupancy rates in their models. However, the MA3T-MC results are sufficient evidence of the significance of closing the modeling gap, which can be seen in this research field.
In order to incorporate the effects of automated driving and shared mobility into the models, sufficient modeling depth is required with respect to all parts of the ASIF.
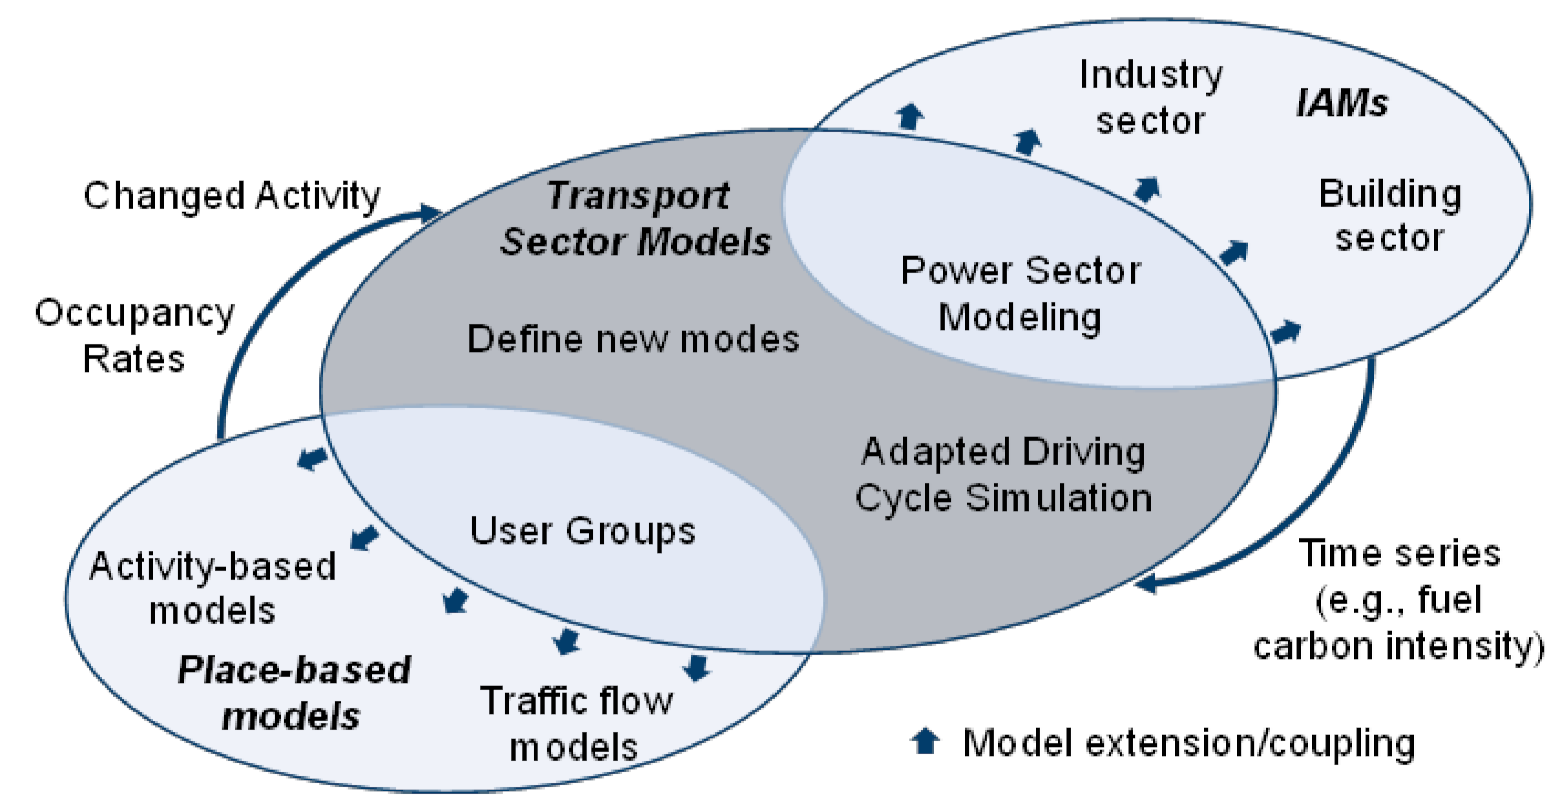
As a basic extension, it is advisable to define new modes, as undertaken by Fei Xie & Lin [67] that represent the different possible combinations of automated and shared mobility arrangements.
In order to determine the changed activity, as well as the modal share, the elasticity approach is insufficient. Here, people’s behavior must also be taken into account, which is why an approximation of the transport sector models to agent-based models seems to be useful. In addition to the model-internal extension, model coupling is a suitable approach.
The introduction of new modes, as mentioned above, simplifies inclusion of the effects of automated driving and shared mobility on energy and fuel carbon intensity. If one does not wish to rely solely on exogenous assumptions, in-depth modeling is required. Adapted driving cycle simulations are an appropriate means of determining changes in fuel consumption due to automation. In connection with shared mobility, the proportion of empty runs or the occupancy of vehicles must be included. Again, further local analyses using place-based models (agent-based and traffic network models) can help.
As the effects on fuel carbon intensity arise from their time dependence, either time series instead of constant values must be used, or modeling of the power plant fleet, as undertaken by Yabe et al. [54], must be included in the model. Especially in the case of intelligent charging and V2G, it is recommended to represent the power sector in a more detailed manner. There is also the possibility of coupling models to IAMs, which include all sectors and can provide information on the power plant fleet or time-dependent fuel carbon intensities.
Figure 11 summarizes the recommended transport sector model adaptations. First, these include model internal ones, such as the defining of new modes. Secondly, model extension and the usage of modeling techniques from both other model classes (place-based and IAMs), such as the modeling of different user groups or the power sector, are indicated by the overlapping segments. Finally, information flow via model-coupling is the last recommended model adaptation.
Overall, it is clear that an approximation of the different types of models and academic disciplines is necessary to correctly determine the impacts of automated and shared driving on a large scale.

6. Conclusions

In this paper, transport sector models were analyzed with a focus on four major trends in the transport sector—modal shift, fuel shift, shared mobility and automated driving. The scope of the investigated models ranges from the national, to the multinational, to the global scales. Furthermore, some of the models’ projections end before 2050, whereas others are already starting to look at the second half of the century. The analysis shows national models projecting through 2050 to be the average.
Although some of the models include passenger cars as the only mode or solely consider street vehicles, the majority consider the most relevant modes with respect to transport volume and GHG emissions. Therefore, these fulfill the precondition of being able to analyze modal shift effects. The same applies to the coverage of drivetrains and possible fuels. Nevertheless, a preference for analyzing BEVs and electricity as future drivetrains and fuels, respectively, can be identified. In particular, alternatives such as REEVs or synthetic fuels are given much less consideration in the investigated models.
The analysis of the possible impacts of mobility trends based on the ASIF method highlights the manifold effects of these trends. The modal shift primarily leads to a change in the modal shares ( S ). Furthermore, the modal shift can influence the occupancy rates of the different modes.
In contrast to the modal shift, the fuel shift, which mostly also includes a drivetrain shift, mainly touches the energy intensity ( I ) and fuel carbon intensity ( F ) parts of the ASIF equation. The degree of the effect depends strongly on user behavior. Thus, the driving region (urban vs. rural) has an impact on the potential for reducing fuel consumption through electrification. Furthermore, for hybrid vehicles, the electric driving share relates to the driving distance. In addition, the charging times influence the carbon intensity of the charged electricity.
Shared mobility affects the activity ( A ), the modal shares ( S ), and energy intensity ( I ). Younger and older people tend to be more mobile if mobility-on-demand concepts are made available. Therefore, the overall activity increases due to shared mobility. Due to the different properties of such a mode, especially with respect to travel cost and time, the modal shares of other modes change. Additionally, the energy intensity of passenger cars decreases because ridesharing leads to higher occupancy rates. In particular, in the case of autonomous taxis, the last point is debatable, since there will be empty trips that at least diminish the effect of higher occupancy rates to some degree.
Alongside empty trips, vehicle automation has various impacts on the energy intensity ( I ) of vehicles. Moreover, the activity ( A ) increases because of autonomous vehicles, as these offer the possibility of using driving time for other activities and present new mobility possibilities to younger and older people who are not able to drive on their own. This change in passenger car characteristics also affects the modal shares ( S ). Furthermore, autonomous and shared vehicles have different usage profiles compared to human-driven ones, and therefore influence the choice of drivetrain when new vehicles are bought. This is an example of the interdependency between the analyzed trends.
Overall, the analysis indicates the influence of shared mobility and automated driving to be much more diverse compared to the modal and fuel shift, and increased interdependencies with the other trends are also apparent.
In Section 5, an overview of the consideration and modeling of mobility trends in transport sector models was presented. The modal shift was taken into account in about half of the analyzed models. In most cases where it was not considered, the reason was the lack of different modes. The modeling of the modal shift was performed either exogenously or endogenously. For endogenous modal shifts, either elasticities or discrete choice were used, with the latter predominantly utilized. The primary mode characteristics considered in these models are the travel cost and time.
All of the investigated models consider the fuel shift. Nevertheless, the level of detail varies widely across the models. Although some of the models exogenously define the future shares of drivetrains, others exogenously determine, e.g., fuel consumption and technology choice for different user groups. The literature shows the importance of differentiating between usage profiles for correctly calculating the quantitative effects of the fuel shift on energy demand or GHG emissions. Therefore, a high level of detail with respect to user preferences and vehicle-specific usage patterns is recommended for endogenously modeling the fuel shift.
The usage profile and thus the technology choice is strongly influenced by the trends in shared mobility and automated driving. As projections indicate increasing shares of autonomous vehicles that could also be in shared usage after 2030, these trends should not be neglected in long-term modeling. However, the analysis showed an underrepresentation of these two trends in the investigated models. Furthermore, the modeling was dominated by exogenous assumptions, especially regarding transportation activities and occupancy rates. Due to high uncertainty, these assumptions were also sometimes contrasting. Only Xie et al. [67] include the effects of vehicle automation on fuel consumption. Furthermore, they introduce three new modes in order to represent the combinations of car-sharing and autonomous vehicles.
The literature review showed the large gap between the modeling of mobility trends. Whereas the modal and fuel shifts were mostly considered, car-sharing and vehicle automation is underrepresented although it is considered to reach an non-negligible share in the investigated time horizons. This gap should be filled in future in order to evaluate the interdependent effects of mobility trends and to project quantitative numbers for future transport energy demand or other transportation-related topics. For this, necessary model improvements are, on the one hand, internal to the model, such as defining new modes or adapted driving cycle calculations and, on the other, by extension or coupling to other model types. Agent-based models, for example, help to assess the impact of autonomous and shared driving on vehicle activity and utilization. Moreover, the coupling to IAMs can serve to better map interactions with the power sector, which are becoming increasingly important due to the analyzed trends. Thus, the coupling of the different types of models and the collaboration of the different academic fields is recommended as a possible means of filling this gap.

Author Contributions

S.K.: Methodology, Formal analysis, Investigation, Writing—original draft. T.G.: Conceptualization, Writing—review & editing, Supervision, Project administration, Funding acquisition. D.S.: Conceptualization, Supervision, Project administration, Funding acquisition. All authors have read and agreed to the published version of the manuscript.

Funding

This research received no external funding.

Institutional Review Board Statement

Not applicable.

Informed Consent Statement

Not applicable.

Conflicts of Interest

The authors declare no conflict of interest.

Appendix A. Model Information

Table A1. Spatio-temporal properties and sectoral scope of investigated models.
Model/AuthorRefSpatial ScopeTemporal ScopeSpatial ResolutionTemporal ResolutionSectoral Scope
RegionNationalMulti-countryGlobal<2050−2050>2050<State LevelState LevelCountry Level>Country Level<HoursHourlyYearlyPassenger and FreightPassenger OnlyFreight Only
Renewbility III[66]Germanyx x x x x
ASTRA-DE[68]Germanyx x x x
VECTOR21[69]Germanyx x x x x
VM-SIM[70]Germanyx x x x x
Shell[64]Germanyx x x x x
TraM[71]Germanyx x x x x
TEMPS[65]Germanyx x x x x
Trost[50]Germanyx x x x x
Belmonte et al.[51]Germanyx x x x x
SERAPIS[72]Austriax x x x x
UKTCM[73]UKx x x xx
STEAM[74]Scotlandx x x xx
DTReM-LV[75]Latviax x x xx
UniSyD[76]Icelandx x x xx
Shepherd et al.[77]UKx x x x x
TMOTEC[45]Chinax x x xx
MA3T[67]USx x x x x
ParaChoice[61]USx x x x
ADOPT[60]USx x x x x
CPREG[78]Chinax x x xx
Hao et al.[79]Chinax x x x x
LEAP[80]Chinax x x xx
Palencia et al.[81]Japanx x x x x
Gambhir et al.[82]Chinax x x xx
Ou et al.[83]Chinax x x xx
Yabe et al.[54]Japanx x x x x
TRAN[63]USx x x xx
PTTMAM[58]EU x x x x
ASTRA-EC[68]EU x x x x
TE3[20]Germany, France, India, Japan, China, US x x x x
HIGH-TOOL[84]EU x x x x
PRIMES-TREMOVE[85]EU x x x x
TRIMODE[86]EU x x (x) x
TRAVEL[44]global x x x x x
AIM/Transport[46]global x x x x
MOVEET[87]global x x (x) x
MoMo[88]global x x (x) x
RoadMap[41]global x x (x) x
ITEDD[89]global x x (x) x
Khalili et al.[90]global x x x xx
ForFITS[91]global x x (x) x
Table A2. Considered modes, drivetrains and energy carriers in investigated models.
Model/AuthorRefModesDrivetrainsEnergy Carriers
BicycleMotorcycleCarLCVHDVBusRailWaterAirICEVHEVPHEVREEVBEVFCEVGasolineDieselKeroseneCNGElectricityHydrogenBiofuelsSynthetic Fuels
Renewbility III[66]xxxxxxxxxxxx xxxxxxxxxx
ASTRA-DE[68]x xxxxxxxxxxxxxxxxxxxx
VECTOR21[69] x xxxxxxxx xxx
VM-SIM[70] x xxxxxxxx xxx
Shell[64] x xxx xxxx xxxxx
TraM[71] xxxxxxxxxxx xxxxxxxx
TEMPS[65] xxxxxxxxxx xxxxxxxxxx
Trost[50] xx xxxxxxxx xxxx
Belmonte et al.[51] x xxx xxxx xxxxx
SERAPIS[72] xx xxx x xx x
UKTCM[73]xxxxxxxxxxxx xxxxxxxxx
STEAM[74]xxxxxxxxxxxx xxxxxxxxx
DTReM-LV[75]x xxxxx xxx xxxx xxxx
UniSyD[76] xxx xxx xxxx xxxx
Shepherd et al.[77] x x x x x x
TMOTEC[45] xxxxxxxxxxx xxxxxxxxxx
MA3T[67] xx xxx xxxx xxxx
ParaChoice[61] xxx xxx xxxx xxxx
ADOPT[60] xx xxx xxxx xxxx
CPREG[78] xxxxx x xxxx xxxxx
Hao et al.[79] x x x xxxx xxxx
LEAP[80] xxxxxxxxxx x xxxxx
Palencia et al.[81] x xx xxx xx
Gambhir et al.[82] xxxxx xxx xxxx xxxx
Ou et al.[83] xxxxx x x x xx xx xx
Yabe et al.[54] x xxx x x x
TRAN[63] xxxxxxxxxx xxxxxxxxx
PTTMAM[58] xx xxx xxxx xxxx
ASTRA-EC[68]x xxxxxxxxxxxxxxxxxxxx
TE3[20] x xxx xxxx xxxx
HIGH-TOOL[84]xxxxxxxxxxxx xxxxxxxxxx
PRIMES-TREMOVE[85] xxxxxx xxxx xxxxxxxxx
TRIMODE[86]xxxxxxxxxxxx xxxxxxxxxx
TRAVEL[44]xxx xxxxxxx xxxxxxxxx
AIM/Transport[46] xx xxxx
MOVEET[87] xxxxxxx
MoMo[88] xxxxxxxxxxx xxxxxxxxxx
RoadMap[41] xxxxxxxxxxx x(x)xxxxxxx
ITEDD[89] xxxxxxxx
Khalili et al.[90] xxxxxxxxx x xxxxxxxxxx
ForFITS[91]xxxxxxxxxxxx xxxxxxxxxx
Table A3. Considered mobility trends in investigated models.
Model/AuthorRefMobility Trends
Modal ShiftFuel ShiftAutomated DrivingSharing Mobility
Renewbility III[66]xxxx
ASTRA-DE[68]xx x
VECTOR21[69] x
VM-SIM[70] x
Shell[64] x x
TraM[71] x
TEMPS[65]xxxx
Trost[50] x
Belmonte et al.[51] x
SERAPIS[72] x
UKTCM[73]xx
STEAM[74]xx
DTReM-LV[75]xx
UniSyD[76] x
Shepherd et al.[77] x
TMOTEC[45]xx
MA3T[67] xxx
ParaChoice[61] x
ADOPT[60] x
CPREG[78] x
Hao et al.[79] x
LEAP[80] x
Palencia et al.[81] x
Gambhir et al.[82] x
Ou et al.[83] x
Yabe et al.[54] x
TRAN[63] x
PTTMAM[58] x
ASTRA-EC[68]xx x
TE3[20] x
HIGH-TOOL[84]xx
PRIMES-TREMOVE[85]xx
TRIMODE[86]xx
TRAVEL[44]xx
AIM/Transport[46]xx
MOVEET[87]xx
MoMo[88]xx
RoadMap[41]xx
ITEDD[89]xx
Khalili et al.[90]xx
ForFITS[91]xx

Appendix B. Boundary Conditions of Transport Sector Models

In addition to Section 3 in this section, further boundary conditions of the investigated transport sector models are analyzed. This comprises the temporal, as well as spatial resolution. Additionally, the sectoral coverage of the models is examined. Therefore, the considered modes, drivetrains, and fuels are regarded.

Appendix B.1. Spatio-Temporal Settings

The temporal resolution provides insight into the consideration of time-dependent effects. These become relevant for the transport sector, especially in terms of electricity demand. Although fuel stations for other energy carriers compensate for intra-day fluctuations due to standard installed on-site storages, charging stations for electric vehicles do not include comparable storage, as they are predominantly directly connected to the electricity grid. Therefore, the electric power must either be simultaneously generated to meet demand or must be retained by integrated electricity storage systems.
More than half of the analyzed models have a yearly resolution, as can be seen in Figure A1. Thus, these cannot take into account the intra-day peaks in electricity demand caused by electric charging. Only six of the 41 investigated models are specified to include a higher temporal resolution.
Trost employs three typical days to investigate the effect of electric charging. These three typical days comprise a working day, representing Monday through Friday, Saturdays and Sundays. Each of these is divided into day and night periods, for which different proportions of electrically-coupled vehicles are assumed for various charging capacities [50].
Pichlmaier et al. also take into account the dependency of a high temporal resolution on the energy carrier. Although the demand for electrical energy is resolved hourly, it is resolved daily for methane and hydrogen and annually for liquid fuels [55].
Figure A1. Temporal (a) and spatial (b) resolution of the investigated transport sector models.
Futuretransp 02 00010 g0a1
The analysis of the possible effects on energy infrastructures requires spatial resolution. These infrastructures play an important role in the transition to BEVs and FCEVs, which are two promising decarbonization solutions. This effect can be considered by models with higher spatial resolutions. Furthermore, a high spatial resolution can help include the differences in transport demand, as well as vehicle-specific fuel consumption in different types of regions.
Furthermore, Figure A1 shows that most of the investigated models analyze the transport sector on a country level. Six of the global models even combine countries into larger regions. As they do not focus on infrastructural questions, a high spatial resolution is not necessarily required.
For China and the USA, models exist that simulate future energy demand via the transport sector on a state level [63,78]. Peng et al. do not include the influence of regional energy demand on the transmission infrastructure for energy carriers [78]. The transportation sector demand module of the National Energy Modeling System (NEMS), developed by the U.S. Energy Information Administration, calculates the future energy demand of the transport sector in the USA on a state level as well [63]. The model itself cannot be used to analyze the influence on the infrastructure. However, with the help of model coupling to another NEMS module, the effects can be investigated.
Other models calculate the transport demand on a regional level, but investigate the energy demand on a national level instead [66,68].
Overall, it can be summarized that transport sector models analyze on average the transport sector on a national scale through 2050. Thereby, the temporal resolution is on a yearly basis and the spatial resolution on a national one. Section 4 shows that higher resolutions are necessary for various effects that result from the different investigated trends.

Appendix B.2. Sectoral Coverage

Passenger and freight transport demand can be met by different modes. These in turn can be equipped with various drivetrain architectures. Finally, different energy carriers provide the required power. To obtain an overview of the sectoral coverage, an analysis of the inclusion of diverse technological possibilities in transport sector models is conducted in the following subsection. The considered modes range from different street vehicles to rail, water, and air. Considered drivetrains are conventional ICEVs, different levels of hybridization, as well as BEVs and FCEVs. Finally, the energy carriers comprised of conventional fuels (gasoline, diesel, and kerosene) and alternatives such as electricity, hydrogen, biofuels, and synthetic fuels are appraised.
Figure A2 displays how many models contain the different means of transport. It can be seen that cars are included in all of the selected models. The reason for this is the high share of transport sector energy demand arising from passenger cars. Some of the models focus on passenger cars and do not take any other transport mode into account at all.
Bicycles are the least considered mode. A reason for this could be their low influence on the overall energy demand and greenhouse gas emissions in the transport sector. Although the burgeoning market for electric bikes for people and freight leads to rising electricity demand for this means of transport, it still makes up only a small share of the overall transport energy demand due to low specific energy demand [92]. Motorcycles are generally considered in global transport sector models because they play an important role in the transport sectors of less developed countries.
Gambhir et al. [82], Peng et al. [78], and Ou et al. [83] only model road transport modes, as these are the main drivers for rising energy demand in the Chinese transport sector. This leads to a lower overall consideration of rail, water, and air transport in the analyzed models, as can be seen in Figure A2.
Figure A2. Considered modes in transport sector models.
Futuretransp 02 00010 g0a2
Only six of the models include all modes of transport considered in our analysis. Eight further models consider all modes, except for bicycles. Adding the four models that only disregard two-wheelers yields 18 models that take into account the most important modal drivers of energy demand and greenhouse gas emissions in the transport sector. Section 4.1 emphasizes the importance of including several modes in the context of mobility trends.
As noted above, the modes can be equipped with different drivetrain architectures. Due to a lack of information, it is not possible to analyze the considered drivetrains by mode. Therefore, Figure A3 depicts the number of models that include the investigated drivetrains for passenger cars. For three of the models, no information on the modeled drivetrains is available.
All models for which such information is available consider ICEVs and BEVs. Peng et al. [78] and Palencia et al. [81] do not include PHEVs though. The less electrified HEVs are also not taken into account in five of the models. FCEVs are included in the same number of models as HEVs. By far the least attention is paid to REEVs. Overall, a slight preference for including BEVs as an alternative drivetrain technology in the analysis can therefore be identified in some of the models.
The right diagram in Figure A3 shows the number of considered drivetrains (out of the drivetrain architectures included in the upper diagram) in the investigated models. It is apparent that most of the models include all listed drivetrain architectures, except for REEVs. In three of the models, only three different drivetrain architectures are taken into account for the analysis. Shepherd et al. [77] and Ou et al. [83] consider ICEVs, PHEVs, and BEVs. In contrast to this, Peng et al. do not consider hybrid drivetrains at all [78].
It should also be noted that the drivetrain variety in the models can be expected to be the highest for cars, and especially hybrid variants, which are often not considered as other means of transportation.
Figure A3. The relevance of different drivetrain architectures for passenger cars in transport sector models.
Futuretransp 02 00010 g0a3
The final characteristic of the models, which is examined with respect to the sectoral level of detail, are the fuels. As with the drivetrains, not all fuels are used for all of the modes.
Gasoline and electricity are considered in all of the models, as they all include ICEV and BEV drivetrain technologies, as described above. Moreover, the number of models that take hydrogen into account as a possible energy carrier for the transport sector is related to the number of models that consider FCEV drivetrain technology. CNG is another alternative energy carrier that is included in most of the investigated transport sector models. Biofuels, and especially synthetic fuels, are not explicitly noted in many publications. However, it could be that the models implicitly switch from conventional gasoline and diesel to synthetic variants without mention.
The evaluations of the number of fuels considered per model indicate that six or more of the selected fuels were included in the models. Only five models consider fewer fuels. Yabe et al. [54] and Shepherd et al. [77] disregard all fuels, except for gasoline and electricity. Palencia et al. [81] investigate gasoline, electricity and hydrogen in their analysis. Pfaffenbichler et al. [72] disregard hydrogen, but instead include diesel as a second conventional fuel alongside gasoline.
Figure A4. Fuels in transport sector models.
Futuretransp 02 00010 g0a4
The analysis in this subsection has revealed the sectoral coverage of the investigated transport sector models. For the most part, the models cover all of the most important means of transport with respect to energy demand and greenhouse gas emissions. Furthermore, they include the most promising drivetrain architectures. This is also the case for energy carriers, whereby synthetic fuels, which could be a helpful pathway of decarbonization for larger means of transport, are underrepresented. The inclusion of all relevant modes is a precondition to correctly modeling the effects of modal shifts. The same applies to the drivetrain technologies and the fuels used with respect to the trend in the fuel shift.

Appendix C. Shared Mobility Concepts

In the following a short distinction between different shared mobility concepts is made based on the work of Machado et al. [27].
They classify five major concepts of shared mobility [27], namely:
  • Car-sharing
  • Personal vehicle sharing
  • Ridesharing
  • On-demand ride services
  • Bike-sharing
Car-sharing is classified as a transportation mode in which a single vehicle is used by several people [93]. It can be organized in a station-based or free-floating manner. In a station-based system, vehicles must be returned to defined stations. In contrast, in a free floating system, they can be returned to any location within a specified zone.
Personal vehicle-sharing is similar to car-sharing, the main difference being the type of vehicle owner. In the case of personal vehicle-sharing, the vehicle is owned by one or more persons, whereas in the case of car-sharing vehicles are owned commercially.
Another concept of shared mobility is ridesharing, wherein similar trips according to paths and departure times from multiple travelers are combined using the same vehicle. Such carpools can be regular or spontaneous. A classic example is the carpooling of colleagues between home and work. New technological possibilities have made it easier to also pool trips among people who are strangers to each other.
On-demand ride services are characterized by their door-to-door nature. Vehicle owners are paid to deliver rides to other people who book and pay for their trips via smartphones. This service is personalized and highly flexible [94].
Next to the outlined concepts that refer to cars as shared vehicles, bike-sharing is a further shared mobility option that is comparable to car-sharing.

Appendix D. Levels of Vehicle Automation

According to the SAE [95], the degree of vehicle automation is classified into six levels (0–5), ranging from no automation (level 0) to full automation (level 5). The classification is based on the distribution of tasks between the driver and the vehicle. As the entire dynamic driving task is performed by the system from level 3 upwards, a key distinction between the levels is made at this point. Aside from the task distribution, it is important to consider in which driving modes the system is capable of executing its functions. Only full automation (level 5) is able to do so for all driving modes. When people refer to self-driving or autonomous vehicles, they usually mean those at level 5.
Oftentimes, the connectivity of vehicles is in conjunction with the automation of the driving task. On the one hand, vehicles themselves can be networked and exchange information regarding parameters such as velocity or information on prevailing traffic conditions (vehicle-to-vehicle, V2V). On the other hand, vehicles can be connected to infrastructural elements such as traffic lights (vehicle-to-infrastructure, V2I). Further connection to other elements such as pedestrians and networks is also conceivable (vehicle-to-x, V2X) [96].

References

  1. Edelenbosch, O.Y.; McCollum, D.L.; van Vuuren, D.P.; Bertram, C.; Carrara, S.; Daly, H.; Fujimori, S.; Kitous, A.; Kyle, P.; Ó Broin, E.; et al. Decomposing passenger transport futures: Comparing results of global integrated assessment models. Transp. Res. Part D Transp. Environ. 2017, 55, 281–293. [Google Scholar] [CrossRef] [Green Version]
  2. Girod, B.; van Vuuren, D.P.; Grahn, M.; Kitous, A.; Kim, S.H.; Kyle, P. Climate impact of transportation A model comparison. Clim. Chang. 2013, 118, 595–608. [Google Scholar] [CrossRef] [Green Version]
  3. Yeh, S.; Mishra, G.S.; Fulton, L.; Kyle, P.; McCollum, D.L.; Miller, J.; Cazzola, P.; Teter, J. Detailed assessment of global transport-energy models’ structures and projections. Transp. Res. Part D Transp. Environ. 2017, 55, 294–309. [Google Scholar] [CrossRef] [Green Version]
  4. Linton, C.; Grant-Muller, S.; Gale, W.F. Approaches and Techniques for Modelling CO2Emissions from Road Transport. Transp. Rev. 2015, 35, 533–553. [Google Scholar] [CrossRef]
  5. Creutzig, F. Evolving Narratives of Low-Carbon Futures in Transportation. Transp. Rev. 2016, 36, 341–360. [Google Scholar] [CrossRef]
  6. Möller, T.; Padhi, A.; Pinner, D.; Tschiesner, A. The Future of Mobility is at Our Doorstep; McKinsey & Company: Cologne, Germany, 2019. [Google Scholar]
  7. Deloitte CASE Automotive Trends and Insights. Available online: https://www2.deloitte.com/us/en/pages/manufacturing/topics/case-automotive-industry.html (accessed on 30 July 2020).
  8. Toyota CASE. Available online: https://global.toyota/en/mobility/case/ (accessed on 30 July 2020).
  9. Daimler CASE–Intuitive Mobility. Available online: https://www.daimler.com/innovation/case-2.html (accessed on 30 July 2020).
  10. Litman, T. Autonomous Vehicle Implementation Predictions; Victoria Transport Policy Institute: Victoria, BC, Canada, 2020. [Google Scholar]
  11. LMC Automotive. The Outlook for Autonomous Vehicle Sales and Their Impact to 2050; LMC Automotive: Oxford, UK, 2018. [Google Scholar]
  12. Transport Systems Catapult. Market Forecast for Connected and Autonomous Vehicles; Transport Systems Catapult: Milton Keynes, UK, 2017. [Google Scholar]
  13. Schipper, L.; Marie-Lilliu, C. Transportation and CO2 Emissilons: Flexing the Link-A Path for the World Bank. In Environment Department Papers; International Energy Agency: Paris, France, 1999. [Google Scholar]
  14. PTV Austria GmbH. How does the City of Copenhagen Become the World’s Most Bike-Friendly City? PTV Austria GmbH: Vienna, Austria, 2019. [Google Scholar]
  15. Liu, R. The DRACULA Dynamic Network Microsimulation Model. In International Symposium on Transport Simulation; Springer: Boston, MA, USA, 2002. [Google Scholar]
  16. Joint Global Research Institute. Overview of the Global Change Assessment Model (GCAM); Pathways to Sustainable Energy Stakeholder Consultation Workshop: Bishkek, Kyrgystan, 2018. [Google Scholar]
  17. Stehfest, E.; van Vuuren, D.; Kram, T.; Bouwman, L.; Alkemade, R.; Bakkenes, M. Integrated Assessment of Global Environmental Change with IMAGE 3.0; PBL Netherlands Environmental Assessment Agency: The Hague, The Netherlands, 2014. [Google Scholar]
  18. Horni, A.; Nagel, K.; Axhausen, K.W. The Multi-Agent Transport Simulation MATSim; Ubiquity Press: London, UK, 2016. [Google Scholar]
  19. United Nations. Kyoto Protocol to the United Nations Framework Convention on Climate Change; United Nations: Kyoto, Japan, 1998. [Google Scholar]
  20. Jochem, P.; Möst, D. Model Description of TE3; KIT: Karslruhe, Germany; TU: Dresden, Germany, 2019. [Google Scholar]
  21. IEA Energy Intensity of Passenger Transport Modes. 2018. Available online: https://www.iea.org/data-and-statistics/charts/energy-intensity-of-passenger-transport-modes-2018 (accessed on 30 July 2020).
  22. Umwelt Bundesamt. Vergleich Der Durchschnittlichen Emissionen Einzelner Verkehrsmittel Im Personenverkehr in Deutschland-Bezugsjahr 2018; Umwelt Bundesamt: Dessau-Roßlau, Germany, 2020. [Google Scholar]
  23. IEA. Rail; IEA: Paris, France, 2020. [Google Scholar]
  24. Bilgin, B.; Magne, P.; Malysz, P.; Yang, Y.; Pantelic, V.; Preindl, M.; Korobkine, A.; Jiang, W.; Lawford, M.; Emadi, A. Making the Case for Electrified Transportation. IEEE Trans. Transp. Electrif. 2015, 1, 4–17. [Google Scholar] [CrossRef]
  25. Edwards, R.; Hass, H.; Larivé, J.-F.; Lonza, L.; Maas, H.; Rickeard, D. WELL-TO-WHEELS Report Version 4.a; JRC, EUCAR, CONCAWE: Luxembourg, 2014. [Google Scholar]
  26. Gaker, D.; Walker, J. Revealing the Value of “Green” and the Small Group with a Big Heart in Transportation Mode Choice. Sustainability 2013, 5, 2913–2927. [Google Scholar] [CrossRef] [Green Version]
  27. Machado, C.; de Salles Hue, N.; Berssaneti, F.; Quintanilha, J. An Overview of Shared Mobility. Sustainability 2018, 10, 4342. [Google Scholar] [CrossRef] [Green Version]
  28. Krueger, R.; Rashidi, T.H.; Rose, J.M. Preferences for shared autonomous vehicles. Transp. Res. Part C Emerg. Technol. 2016, 69, 343–355. [Google Scholar] [CrossRef]
  29. Kuhnert, F.; Stürmer, C.; Koster, A. Five Trends Transforming the Automotive Industry; PwC: Frankfurt am Main, Germany, 2018. [Google Scholar]
  30. Namazu, M.; MacKenzie, D.; Zerriffi, H.; Dowlatabadi, H. Is carsharing for everyone? Understanding the diffusion of carsharing services. Transp. Policy 2018, 63, 189–199. [Google Scholar] [CrossRef]
  31. Schäfer, A.W.; Yeh, S. A holistic analysis of passenger travel energy and greenhouse gas intensities. Nat. Sustain. 2020, 3, 459–462. [Google Scholar] [CrossRef]
  32. Martinez, L.M.; Correia, G.H.A.; Viegas, J.M. An agent-based simulation model to assess the impacts of introducing a shared-taxi system: An application to Lisbon (Portugal). J. Adv. Transp. 2015, 49, 475–495. [Google Scholar] [CrossRef]
  33. Jochem, P.; Babrowski, S.; Fichtner, W. Assessing CO2 emissions of electric vehicles in Germany in 2030. Transp. Res. Part A Policy Pract. 2015, 78, 68–83. [Google Scholar] [CrossRef] [Green Version]
  34. Wadud, Z.; MacKenzie, D.; Leiby, P. Help or hindrance? The travel, energy and carbon impacts of highly automated vehicles. Transp. Res. Part A Policy Pract. 2016, 86, 1–18. [Google Scholar] [CrossRef] [Green Version]
  35. Bösch, P.M.; Becker, F.; Becker, H.; Axhausen, K.W. Cost-based analysis of autonomous mobility services. Transp. Policy 2018, 64, 76–91. [Google Scholar] [CrossRef]
  36. Lammert, M.P.; Duran, A.; Diez, J.; Burton, K.; Nicholson, A. Effect of Platooning on Fuel Consumption of Class 8 Vehicles Over a Range of Speeds, Following Distances, and Mass. SAE Int. J. Commer. Veh. 2014, 7, 626–639. [Google Scholar] [CrossRef] [Green Version]
  37. Enzian, F.; Brzoska, I. Why Platooning is the Future of Delivery Traffic. Available online: https://www.mantruckandbus.com/en/innovation/why-platooning-is-the-future-of-delivery-traffic.html (accessed on 30 July 2020).
  38. Degraeuwe, B.; Beusen, B. Using on-board data logging devices to study the longer-term impact of an eco-driving course. Transp. Res. Part D Transp. Environ. 2013, 19, 48–49. [Google Scholar] [CrossRef]
  39. European Automobile Manufacturers Association New Passenger Car Registrations by Engine Capacity and Power. Available online: https://www.acea.be/statistics/article/new-passenger-car-characteristics-cubic-capacity-average-power (accessed on 30 June 2020).
  40. Baxter, J.A.; Merced Cirino, D.A.; Costinett, D.J.; Tolbert, L.M.; Ozpineci, B. Review of Electrical Architectures and Power Requirements for Automated Vehicles. In Proceedings of the IEEE Transportation Electrification Conference and Expo (ITEC), Long Beach, CA, USA, 13–15 June 2018. [Google Scholar]
  41. ICCT. ICCT Roadmap Model, Version 1-0; ICCT: Washington, DC, USA, 2012. [Google Scholar]
  42. Brand, C.; Tran, M.; Anable, J. The UK transport carbon model: An integrated life cycle approach to explore low carbon futures. Energy Policy 2012, 41, 107–124. [Google Scholar] [CrossRef] [Green Version]
  43. Ben-Akiva, M.; Lerman, S.R. Discrete Choice Analysis: Theory and Application to Travel Demand; The MIT Press: Cambridge, MA, USA, 1985. [Google Scholar]
  44. Girod, B.; van Vuuren, D.P.; Deetman, S. Global travel within the 2 °C climate target. Energy Policy 2012, 45, 152–166. [Google Scholar] [CrossRef] [Green Version]
  45. Wang, H.; Ou, X.; Zhang, X. Mode, technology, energy consumption, and resulting CO2 emissions in China’s transport sector up to 2050. Energy Policy 2017, 109, 719–733. [Google Scholar] [CrossRef]
  46. Mittal, S.; Dai, H.; Fujimori, S.; Hanaoka, T.; Zhang, R. Key factors influencing the global passenger transport dynamics using the AIM/transport model. Transp. Res. Part D Transp. Environ. 2017, 55, 373–388. [Google Scholar] [CrossRef]
  47. Hollevoet, J.; Witte, A.D.; Macharis, C. Improving insight in modal choice determinants: An approach towards more sustainable transport. In Urban Transport; WIT Press: Southampton, UK, 2011; Volume 116. [Google Scholar]
  48. Schäfer, A. Regularities in Travel Demand: An International Perspective. J. Transp. Stat. 2000, 3, 1–31. [Google Scholar]
  49. Siegemund, S.; Trommler, M.; Kolb, O.; Zinnecker, V. The Potential of Electricity-Based Fuels for Low-Emission Transport in the EU; Dena: Berlin, Germany, 2017. [Google Scholar]
  50. Trost, T. Erneuerbare Mobilität Im Motorisierten Individualverkehr; Forschungsgesellschaft für Straßen-und Verkehrswesen (FGSV): Leipzig, Germany; Stuttgart, Germany, 2017. [Google Scholar]
  51. Blat Belmonte, B.; Esser, A.; Weyand, S.; Franke, G.; Schebek, L.; Rinderknecht, S. Identification of the Optimal Passenger Car Vehicle Fleet Transition for Mitigating the Cumulative Life-Cycle Greenhouse Gas Emissions until 2050. Vehicles 2020, 2, 75–99. [Google Scholar] [CrossRef] [Green Version]
  52. Zimmer, W.; Blank, R.; Bergmann, T.; Mottschall, M.; Waldenfels, R. RENEWBILITY III-Die einzelnen RENEWBILITY-Modelle Im Detail; Ökoinstitut, DLR, IFEU, Infras: Berlin, Germany, 2015. [Google Scholar]
  53. Siskos, P.; Capros, P.; Zazias, G.; Fiorello, D.; Noekel, K. Energy and fleet modelling within the TRIMODE integrated transport model framework for Europe. Transp. Res. Procedia 2019, 37, 369–376. [Google Scholar] [CrossRef]
  54. Yabe, K.; Shinoda, Y.; Seki, T.; Tanaka, H.; Akisawa, A. Market penetration speed and effects on CO2 reduction of electric vehicles and plug-in hybrid electric vehicles in Japan. Energy Policy 2012, 45, 529–540. [Google Scholar] [CrossRef]
  55. Pichlmaier, S.; Fattler, S.; Bayer, C. Modelling the Transport Sector in the Context of a Dynamic Energy System. In Proceedings of the 41st IAEE International Conference, Groningen, The Netherlands, 10–13 June 2018. [Google Scholar]
  56. Lebeau, K.; Lebeau, P.; Macharis, C.; Van Mierlo, J. How expensive are electric vehicles? A total cost of ownership analysis. World Electr. Veh. J. 2013, 6, 996–1007. [Google Scholar] [CrossRef] [Green Version]
  57. Knupfer, S.M.; Hensley, R.; Hertzke, P.; Schaufuss, P. Electrifying Insights: How Automakers can Drive Electrified Vehicle Sales and Profitability; McKinsey & Company: Stamford, USA, 2017. [Google Scholar]
  58. Harrison, G.; Thiel, C.; Jones, L. Powertrain Technology Transition Market Agent Model (PTTMAM): An introduction; Joint Research Centre: Luxembourg, 2016. [Google Scholar]
  59. Struben, J.; Sterman, J.D. Transition Challenges for Alternative Fuel Vehicle and Transportation Systems. Environ. Plan. B Plan. Des. 2008, 35, 1070–1097. [Google Scholar] [CrossRef]
  60. Brooker, A.; Gonder, J.; Lopp, S.; Ward, J. ADOPT: A Historically Validated Light Duty Vehicle Consumer Choice Model. In Proceedings of the SAE 2015 World Congress and Exhibition, Detroit, MI, USA, 21–23 April 2015. [Google Scholar]
  61. Manley, D.; Levinson, R.; Barter, G.; West, T. ParaChoice-Parametric Vehicle Choice Modeling; Sandia National Lab: Albuquerque, NM, USA.
  62. Rogers, E. Diffusion of Innovations; Free Press: New York, NY, USA, 2003. [Google Scholar]
  63. U.S. Energy Information Administration. Transportation Sector Demand Module of the National Energy Modeling System: Model Documentation; U.S. Energy Information Administration: Washington, DC, USA, 2019.
  64. Adolf, J.; Balzer, C.; Joedicke, A.; Schabla, U.; Wilbrand, K.; Rommerskirchen, S.; Anders, N.; der Maur, A.a.; Ehrentraut, O.; Krämer, L.; et al. Shell PKW-Szenarien bis 2040; Shell, Prognos: Hamburg, Germany, 2014. [Google Scholar]
  65. Hacker, F.; Blanck, R.; Hülsmann, F.; Kasten, P.; Loreck, C.; Ludig, S.; Mottschall, M.; Zimmer, W. eMobil 2050-Szenarien Zum möglichen Beitrag Des elektrischen Verkehrs Zum Langfristigen Klimaschutz; Öko-Institut e.V.: Berlin, Germany, 2014. [Google Scholar]
  66. Zimmer, W.; Blank, R.; Bergmann, T.; Mottschall, M.; Waldenfels, R. Endbericht RENEWBILITY III-Optionen Einer Dekarbonisierung Des Verkehrssektors; Ökoinstitut, DLR, IFEU, Infras: Berlin, Germany, 2016. [Google Scholar]
  67. Xie, F.; Lin, Z. In Market Acceptance of Advanced Automotive Technologies–Mobility Choice (MA3T-MC): Consumer Acceptance of CAV, Shared Mobility and Electric Vehicle. In Proceedings of the Automated Vehicle Symposium 2019, Orlando, FL, USA, 16 July 2019. [Google Scholar]
  68. Fiorello, D.; Fermi, F.; Bielanska, D. The ASTRA model for strategic assessment of transport policies. Syst. Dyn. Rev. 2010, 26, 283–290. [Google Scholar] [CrossRef]
  69. Mock, P. Entwicklung eines Szenariomodells Zur Simulation Der Zukünftigen Marktanteile Und CO2-Emissionen Von Kraftfahrzeugen (VECTOR21); Universität Stuttgart: Stuttgart, Germany, 2010. [Google Scholar]
  70. Redelbach, M. Entwicklung Eines Dynamischen Nutzenbasierten Szenariomodells Zur Simulation Der Zukünftigen Marktentwicklung Für Alternative PKW-Antriebskonzepte; Deutsches Zentrum für Luft-und Raumfahrt: Stuttgart, Germany; Cologne, Germany, 2016. [Google Scholar]
  71. FfE. TraM-Sektormodell Des Verkehrs; FfE: Munich, Germany, 2017. [Google Scholar]
  72. Pfaffenbichler, P.; Renner, S.; Krutak, R. Modelling the Development of Vehicle Fleets with Alternative Propulsion Technologies; AEA: Vienna, Austria, 2011. [Google Scholar]
  73. Brand, C. UK Transport Carbon Model: Reference Guide; UK Energy Research Centre: Oxford, UK, 2010. [Google Scholar]
  74. Brand, C.; Cluzel, C.; Anable, J. Modeling the uptake of plug-in vehicles in a heterogeneous car market using a consumer segmentation approach. Transp. Res. Part A Policy Pract. 2017, 97, 121–136. [Google Scholar] [CrossRef]
  75. Barisa, A.; Rosa, M. A system dynamics model for CO2 emission mitigation policy design in road transport sector Aiga Barisa*, Marika Rosa. Energy Procedia 2018, 147, 419–427. [Google Scholar] [CrossRef]
  76. Shafiei, E.; Davidsdottir, B.; Leaver, J.; Stefansson, H.; Asgeirsson, E.I. Comparative analysis of hydrogen, biofuels and electricity transitional pathways to sustainable transport in a renewable-based energy system. Energy 2015, 83, 614–627. [Google Scholar] [CrossRef]
  77. Shepherd, S.; Bonsall, P.; Harrison, G. Factors affecting future demand for electric vehicles: A model based study. Transp. Policy 2012, 20, 62–74. [Google Scholar] [CrossRef]
  78. Peng, T.; Ou, X.; Yuan, Z.; Yan, X.; Zhang, X. Development and application of China provincial road transport energy demand and GHG emissions analysis model. Appl. Energy 2018, 222, 313–328. [Google Scholar] [CrossRef]
  79. Hao, H.; Liu, Z.; Zhao, F.; Li, W.; Hang, W. Scenario analysis of energy consumption and greenhouse gas emissions from China’s passenger vehicles. Energy 2015, 91, 151–159. [Google Scholar] [CrossRef]
  80. Liu, L.; Wang, K.; Wang, S.; Zhang, R.; Tang, X. Assessing energy consumption, CO2 and pollutant emissions and health benefits from China’s transport sector through 2050. Energy Policy 2018, 116, 382–396. [Google Scholar] [CrossRef]
  81. Palencia, J.C.G.; Otsuka, Y.; Araki, M.; Shiga, S. Impact of new vehicle market composition on the light-duty vehicle fleet CO2 emissions and cost. Energy Procedia 2017, 105, 3862–3867. [Google Scholar] [CrossRef]
  82. Gambhir, A.; Tse, L.K.C.; Tong, D.; Martinez-Botas, R. Reducing China’s road transport sector CO2 emissions to 2050: Technologies, costs and decomposition analysis. Appl. Energy 2015, 157, 905–917. [Google Scholar] [CrossRef] [Green Version]
  83. Ou, X.; Zhang, X.; Chang, S. Scenario analysis on alternative fuel/vehicle for China’s future road transport: Life-cycle energy demand and GHG emissions. Energy Policy 2010, 38, 3943–3956. [Google Scholar] [CrossRef]
  84. Szimba, E.; Ihrig, J.; Kraft, M.; Mitusch, K.; Chen, M.; Chahim, M.; van Meijeren, J.; Kiel, J.; Mandel, B.; Ulied, A.; et al. HIGH-TOOL–a strategic assessment tool for evaluating EU transport policies. J. Shipp. Trade 2018, 3, 11. [Google Scholar] [CrossRef]
  85. Karkatsoulis, P.; Siskos, P.; Paroussos, L.; Capros, P. Simulating deep CO2 emission reduction in transport in a general equilibrium framework: The GEM-E3T model. Transp. Res. Part D 2017, 55, 343–358. [Google Scholar] [CrossRef]
  86. Fiorello, D.; Nökel, K.; Martino, A. The TRIMODE integrated model for Europe. Transp. Res. Procedia 2018, 31, 88–98. [Google Scholar] [CrossRef]
  87. Purwanto, J.; de Ceuster, G.; Vanherle, K. Mobility, Vehicle fleet, Energy use and Emissions forecast Tool (MOVEET). Transp. Res. Procedia 2017, 25, 3421–3434. [Google Scholar] [CrossRef]
  88. Fulton, L.; Cazzola, P.; Cuenot, F. IEA Mobility Model (MoMo) and its use in the ETP 2008. Energy Policy 2009, 37, 3758–3768. [Google Scholar] [CrossRef]
  89. U.S. Energy Information Administration (EIA). Component Design Report: International Transportation Energy Demand Determinants Model; U.S. Energy Information Administration (EIA): Washington, DC, USA, 2017.
  90. Khalili, S.; Rantanen, E.; Bogdanov, D.; Breyer, C. Global Transportation Demand Development with Impacts on the Energy Demand and Greenhouse Gas Emissions in a Climate-Constrained World. Energies 2019, 12, 3870. [Google Scholar] [CrossRef] [Green Version]
  91. Cuenot, F. ForFITS at UNECE; iTEM4: Laxenburg, Austria, 2017. [Google Scholar]
  92. Weiss, M.; Dekker, P.; Moro, A.; Scholz, H.; Patel, M.K. On the electrification of road transportation-A review of the environmental, economic, and social performance of electric two-wheelers. Transp. Res. D Transp. Environ. 2015, 41, 348–366. [Google Scholar] [CrossRef] [PubMed]
  93. Greenblatt, J.B.; Shaheen, S. Automated Vehicles, On-Demand Mobility, and Environmental Impacts. Curr. Sustain./Renew. Energy Rep. 2015, 2, 74–81. [Google Scholar] [CrossRef] [Green Version]
  94. Atasoy, B.; Ikeda, T.; Ben-Akiva, M.E. Optimizing a Flexible Mobility on Demand System. Transp. Res. Rec. J. Transp. Res. Board 2019, 2563, 76–85. [Google Scholar] [CrossRef]
  95. SAE International. Levels of Driving Automation; J3016; SAE International: Warrendale, USA, 2014. [Google Scholar]
  96. Pearre, N.S.; Ribberink, H. Review of research on V2X technologies, strategies, and operations. Renew. Sustain. Energy Rev. 2019, 105, 61–70. [Google Scholar] [CrossRef]
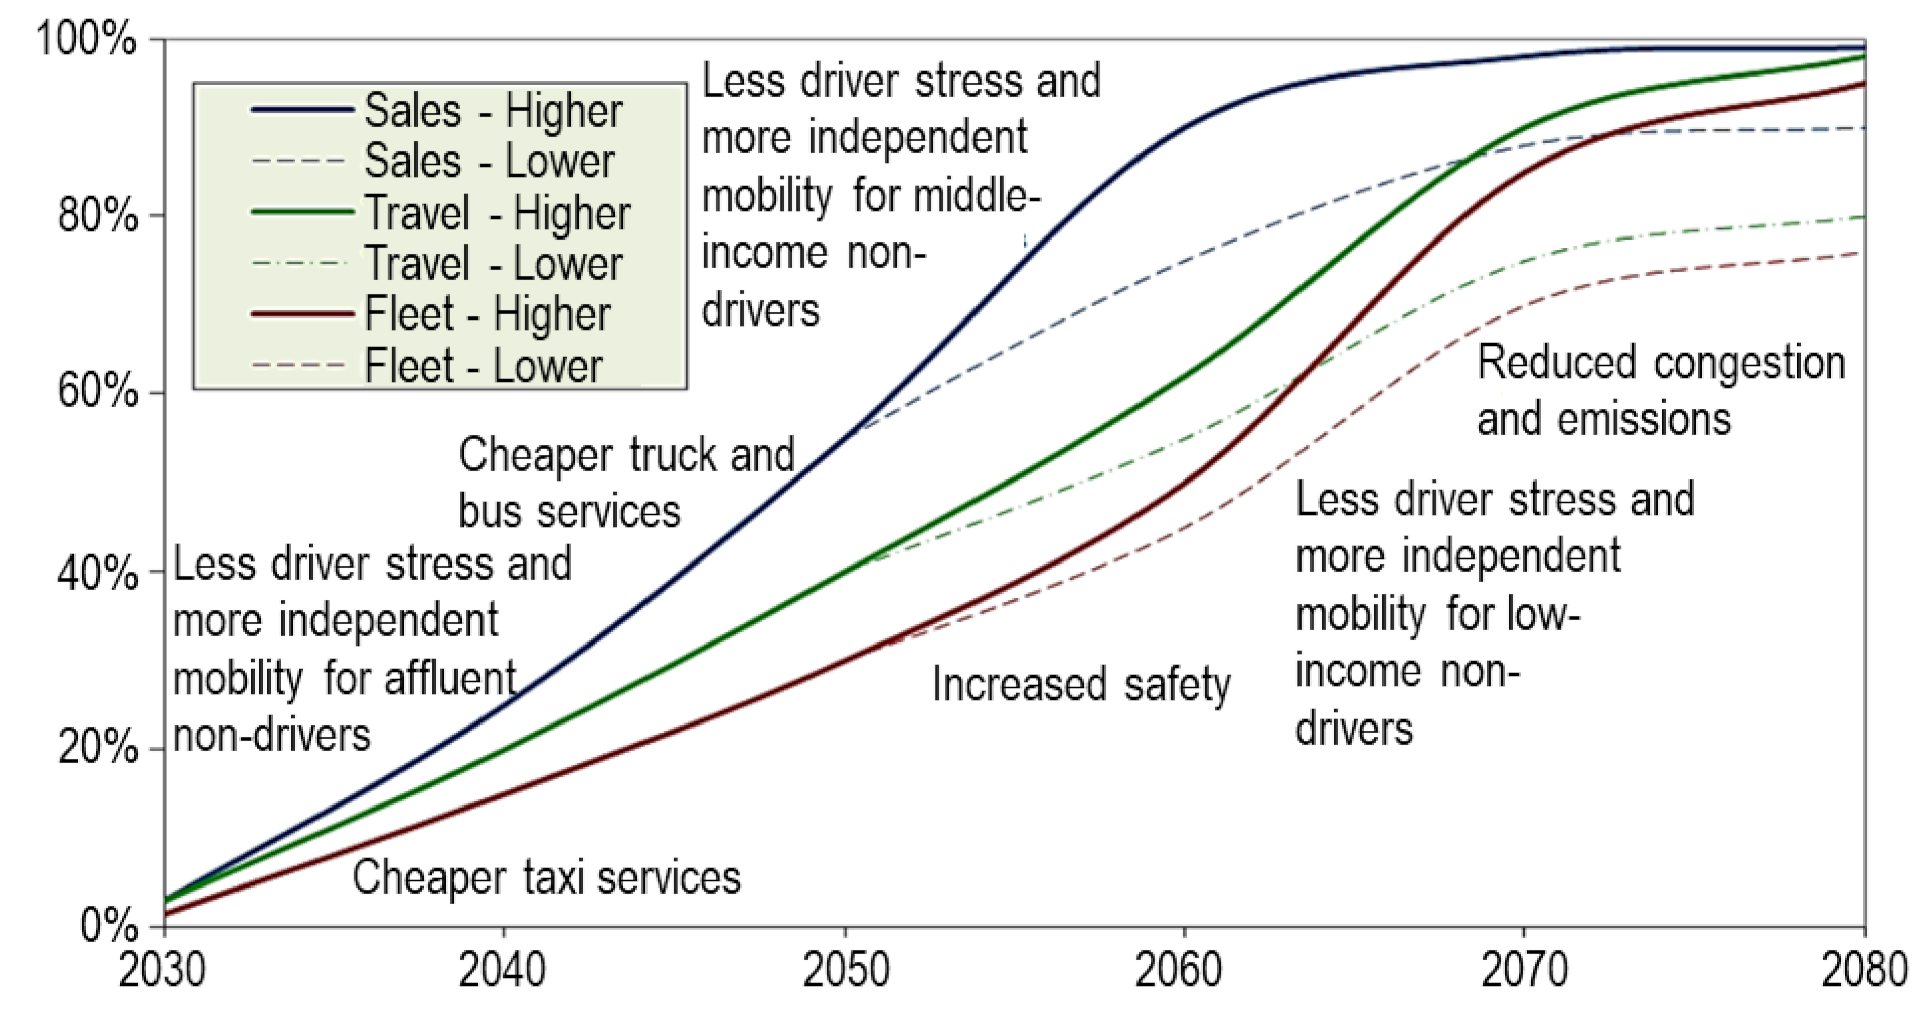
Figure 1. Projected Autonomous Vehicle Sales, Fleet and Travel from 2030 to 2080. Adapted with permission from [10].
Futuretransp 02 00010 g001
Figure 2. Model classification of different techniques to calculate GHG emissions from transport based on Linton [4] and Creutzig [5].
Futuretransp 02 00010 g002
Figure 3. Temporal and geographical scope of the investigated transport sector models underlining the focus on national analyses up through the year 2050.
Futuretransp 02 00010 g003
Figure 4. Comparison of average GHG emissions for passenger transport modes in Germany 2018 (based on [22]).
Futuretransp 02 00010 g004
Figure 5. Fuel carbon intensity for selected energy carriers in transportation based on [25].
Futuretransp 02 00010 g005
Figure 6. Changes in energy consumption due to vehicle automation [34].
Futuretransp 02 00010 g006
Figure 7. Speed-dependent fuel consumption and share of vehicle activity in [53] to show the dependency of overall fuel consumption on user specific transport demand.
Futuretransp 02 00010 g007
Figure 8. Criteria for vehicle technology choice.
Futuretransp 02 00010 g008
Figure 9. New modes to include vehicle automation and shared mobility in MA3T-MC [67].
Futuretransp 02 00010 g009
Figure 10. Impact of mobility trends on each other and parts of ASIF, as well as their modeling quality in transport sector models. * is defined in the figure as further explanation.
Futuretransp 02 00010 g010
Figure 11. Overview of recommended transport sector model adaptations.
Futuretransp 02 00010 g011
Table 1. Considered modes, drivetrains, and fuels for analysis.
ModesDrivetrainsFuels
BicycleICEVGasoline
MotorcycleHEVDiesel
CarPHEVKerosene
LCVREEVCNG/LNG
HDVBEVElectricity
BusFCEVHydrogen
Rail Biofuels
Water Synthetic fuels
Air
Publisher’s Note: MDPI stays neutral with regard to jurisdictional claims in published maps and institutional affiliations.