Article

Spatiotemporal Variation in Bicycle Road Crashes and Traffic Volume in Berlin: Implications for Future Research, Planning, and Network Design

by
Rafael Milani Medeiros
1,*,
Iva Bojic
2 and
Quentin Jammot-Paillet
1
1
Center for Technology and Society; Mobility and Space, Technische Universität Berlin, 10553 Berlin, Germany
2
SMART Future Urban Mobility, Singapore-MIT Alliance for Research and Technology, Singapore 138602, Singapore
*
Author to whom correspondence should be addressed.
Future Transp. 2021, 1(3), 686-706; https://doi.org/10.3390/futuretransp1030037
Submission received: 27 July 2021 / Revised: 5 October 2021 / Accepted: 26 October 2021 / Published: 9 November 2021

Abstract

:
Urban bicycling has been largely marginalized for decades in the global north and south. Despite a renaissance over the last two decades in academic research, political discourse, sustainability activism, and planning, cities often struggle with data quality and quantity. Digitalization has led to more and better data sources, but they still must be validated and compared with findings from conventional travel surveys. With the COVID-19 pandemic, bicycling and associated road facilities expanded, as did road crashes involving bicycles. This study utilized tens of thousands of datapoints sourced by public institutions and digital devices belonging to private companies that have spread across Berlin over the last ten years and are currently ubiquitous. What does an integrated analysis of data from these novel sources reveal for urban bicycling research, planning, and network design? We explored and visualized the relationships and spatiotemporal variations in (i) bicycling volumes and (ii) crashes, unveiling the (iii) distribution of and correlation between datasets and the city’s bikeway network at an unprecedented threshold. The findings can be useful for special interest groups and to guide future urban bicycling research, planning, and network design.

1. Introduction

Due to the prolonged and repeated lockdowns resulting from the COVID-19 pandemic, the number of bicycles on roads rose significantly during 2020–2021 in cities of the global north and south [1]. Within the context of the pandemic, urban bicycling appeared to be a transport mode with a comparatively lower risk of infection and mental health benefits for riders [2]. The economic and unemployment crisis that followed the virus as it spread across the world made the relatively cheap mobility gained using bicycles even more attractive [3]. The pandemic impacted bicycling in Europe, the Americas, and Australia in 2020, significantly changing bicyclists’ travel behavior compared to 2019 in terms of location, trip purpose, and type of cycling facilities implemented by local authorities in response to growing numbers of users [4]. While growth in bicycling in most cities around the world during this period was positive, it was accompanied by a negative aspect: more crashes involving bicyclists and injuries, despite rapid infrastructure responses such as pop-up bike lanes [5]. Providing convenient, safe, and seamless bikeway networks is key to expanding bicycling in contemporary cities; road infrastructure typology and planning philosophies vary widely between european countries [6], while decreased bicycling road safety (more crashes) leads to significantly less bicycling in Dutch cities [7]. For this reason, an integrated analysis of bicycling behavior, related road crashes and traffic volumes, as well as the spatial and temporal distribution of and variation in these factors has become essential in the fields of urban road safety and urban mobility sustainability.
While growth in bicycling is key for present and future sustainable cities [8], the cost of road crashes in Germany equals 1.4% of the country’s GDP [9], showing one dimension of the negative impacts on the economic and social parts of an urban sustainability equation. Over the last two decades, the bicycle has become a symbol of sustainable transport for most social groups and cultures in many cities across the globe [10]. While bicycle advocates and city planning authorities often discuss financial resources, definitions of the problem and strategies to make bicycling safer and more convenient [11], in previous decades, local and national policies regarding this transport mode were largely marked by laissez-faire [10]. Bicycling and city bikeway networks are part of a larger technological system: the city mobility system, in which long-standing meanings attributed to transport technologies are mirrored in other human and non-human components of these large sociotechnical arrangements such as public and private organizations, related industries, venture capital investors, regulatory legislation, scientific books, university teaching, and research programs [12]. Previous attributions of meaning also constitute technologies, and might endure over time and following changes that affect subsequent arrangements, either in whole or in part [13]. These long-standing practices in the urban transport sector help explain the present (and frequent) gaps in data, research, planning, design, and policymaking regarding urban bicycling [14]. Despite recent growth in the number of studies and work in this area [6], some areas and facets of research on urban bicycling are still lacking, such as a comprehensive analysis of bikeway networks, bikeway safety design, the suitability of research methods, larger samples, longitudinal studies, greater geographic diversity, and larger datasets with more control variables [15]. This context is important to our hypothesis and motivated this study: at present, emerging digital data sources are virtually sensing all urban mobility modes and produce vast troves of data every day, which are overlooked by researchers, traffic engineers and city planners, who could access, process, and combine these data into a single analytical framework.
In the next section, two key aspects that differentiate this study and relate it to previous work will be made clear: the recent availability of geolocated data on bicycle crashes and traffic volumes, and the need for novel research frameworks to make sense of these data when promoting bicycling and road safety in cities. Here, we take advantage of the broad presence of information and communication technology (ICT) devices that are connected to mobile data networks, sensing vehicle and individual mobility. This represents a disruption in the field of urban studies, specifically in the causal relationship between bicycling traffic and crashes, because empirical data covering entire cities are now available. This paper analyzes and visualizes an unprecedented amount of digital data from these sources on bicycling crashes, traffic volumes, bikeway network design, and trip routing in Berlin on a city-wide scale to derive information and guidance for urban bicycling. What does integrated analysis of data from these novel sources reveal for urban bicycling research, planning, and network design?

2. Previous Work

After the bicycle was adopted on a large scale in German cities, and until the 1940s, it was gradually considered an inferior and outdated technology compared to motorized vehicles [16]. When its predominant social meaning was no longer urban transport, bicycle traffic volume was no longer surveyed by authorities and traffic regulations considerably restricted the circulation of this mode in Germany [17]; urban bicycling was excluded from Berlin’s travel surveys until the 1990s [18]. At present, roughly 1.5 million bicyclists use this mode every day in the city, which now has over 3.6 million inhabitants and nearly 2000 km of bikeways in its road network [19]. Like many other German cities, Berlin standardized, systematized, and invested in digital technology for bicycle traffic volume sensing and periodic urban travel surveys.
Since 2003, Berlin has participated in the nationwide Representative Travel Survey System (SRV), which is conducted every five years. Data are collected over an entire year via face-to-face interviews (primarily at residential addresses), with respondents ranging from 15,000 in 2013 [20] to 40,000 in 2018 [19]. Digitization, processing, analysis, and reporting of these data can take years after the surveys are conducted. More recently, information and communication technologies (ICT) have pervaded mobility systems, boosted the digital sensing of individual dynamics, and produced an unprecedented quality and quantity of spatiotemporal data [21]. Nevertheless, a recent review of the documents on the topic of smart cities and the internet of things published by the European Commission found that the vast majority of policy discussions revolve around cars, while hardly considering bicycles [22].
Germany has had more than one mobile phone subscription per inhabitant since 2006 [23]. In the early 2010s, 49% of Berliners reported using a smartphone for urban mobility purposes [20], and by 2020, 3 out of 4 residents in Germany used a smartphone every day [24]. The ubiquitous nature of digital mobile devices, along with their built-in sensors, memory, processor, data networks, and software applications, has captured growing attention from mobility researchers over the last two decades because of the potential they offer for sensing urban dynamics (such as far larger samples and datapoints and sharper thresholds) while requiring less time, staffing, and financial resources to collect data on urban mobility [25,26,27,28]. Urban cameras permit research breakthroughs based on unprecedented visual data for public and private spaces in cities [29], and 5G mobile and wireless communication systems have catalyzed research and new IoT technologies to prevent crashes between vehicles and pedestrians [30].
On the other hand, not all databases on transport modes and related dynamics are available to researchers, especially those sourced with private systems [31], given the strategic and economic value of data politics in the ongoing urban age [32]. Passengers on certain transport modes or socio-demographic cohorts may not yet be exploring (or even aware of) the urban mobility services and applications that are available through smartphones [33], and certain digital data sensors do not capture common variables used in transport research, such as transport mode or trip origin/destination [31]. For the most part, urban transport services and modes are operated and planned separately, and studies at the city scale are scarce [34].
The quality and quantity of evidence-based studies as well as data have been noted as problematic in reports by multilateral organizations with regard to urban bicycling, infrastructure, and safety [35]. Limited and poor-quality databases on bicycling crashes and trips often generate questionable guidance for policy-makers and transport planners, or severely limit the transferability of studies in terms of the location, dissemination, and generalization of the findings [36,37,38,39,40]. Transferring research methods that require large quantities of spatiotemporal data to the field of urban bicycling (which is done in epidemiology, for instance) is not suited to the study of bikeway design and safety [41]. For this reason, road interventions (or measures) with bicycling facilities are often highly politicized and react to circumstantial pressure from media outlets or specific advocacy groups, resulting in interventions that are not necessarily effective, in the leading economies of the global north [14] as well as the global south [10]. The constructed bikeway networks of cities may also exhibit traces of inequality [42].
Bicycling trip shares vary by as much as 10% to 80% in cities in the same country (or culture), such as in the Netherlands [7]. Bicycling trip volumes can also present asymmetrical distribution within the same city. In Berlin, 18% of daily trips are made by bicycle in the districts formerly considered as East Berlin; on the west side, bicycles account for 12% of trips [42]. In the district of Marzahn, the rate is as low as 5%, reaching 26% in Kreuzberg [43]. Counterintuitively, a horizontal study [44] revealed that bicycling trip shares fell dramatically during the twentieth century in the cities of Amsterdam (from 80% to 35%), Copenhagen (50% to 30%), and Hanover (75% to 20%).
The relationship between bicycle traffic volume, crash frequency, and risk is still unclear. Some research has found increasing safety to correspond with higher numbers of bicyclists [45,46], while other found a relationship between increased bicycling volumes and the number of crashes and fatalities [47]. Several other studies show that the risks of injury to bicyclists are highly non-linear and depend on spatiotemporal contexts [48]. Local knowledge needs to inform the implementation of local solutions [35]. Horizontal studies locate urban bicycling in space and time, and in relation to crashes involving other mobility modes. For example, the total daily number of trips in Berlin nearly quadrupled from 1975 to 2001 (275% growth) and the mode share for bicycles grew from 5% in 1990 [49] to 10% in 2007, accompanied by a 38% decline in serious accidents involving bicycles [11]. However, from 2010 to 2018, the number of bicycling crash fatalities rose 3% in Germany [8], and the bicycle share of urban trips in Berlin grew from 8% to 18% during the 2008–2018 period [19,20]. The total number of road crashes with fatalities is decreasing in Berlin; from 1990 to 2017, road fatalities dropped from 226 to 36 [50], while from 2001 to 2017, fatal road crashes diminished by 60% [51]. However, the number of bicyclists involved in a fatal crash remains stable in relation to the average number of deaths per year over a fifteen-year period. In 2000, 17 bicyclists died, 10 in 2001, 24 in 2003, 15 in 2012, 9 in 2013, 10 in 2015, and 17 in 2016 [52]. The yearly number of bicycle crash injuries between 2000 and 2016 is very close to the average for this entire period. Approximately 520 bicyclists are severely injured each year, and 4090 suffer moderate injuries [52]. The bicycling fatality rate in Berlin is three riders per 100 million bicycling kilometers; in contrast, Germany has a rate of 1.3 fatalities per 100 million bicycling kilometers, compared to the United States (where bicycling is predominantly recreational and accounts for fewer than 1% of urban trips), where this rate is 4.2 [53].
Bicyclists comprise one of the most vulnerable group of road users in Berlin and have been continuously classified as such by the city’s police over the last two decades [50]. In 2015, 7724 bicyclists were involved in road crashes, forming about 5.61% of all reported road accidents. Between 2001 and 2016, this percentage of bicyclists involved in road crashes in the city rose from 4.06% to 5.10% [52]. This group bears a disproportionate share of road crashes and injuries; in 2015, cyclists accounted for 21% of all fatal injuries (N = 48), and 618 bicycle riders represented 30% of all severe injuries (N = 2073), an alarming number considering their involvement in only 3.98% of all road crashes [54]. In Germany, cyclists account for 11% of all road crash fatalities, while at the European level, this number drops to 4% [55]. Between 2011 and 2015, the city recorded 55 fatally injured and 3284 severely injured bicyclists [52].
The presence of specific bicycle road facilities (or bikeways) on urban roadways is associated with lower crash risk [36]. Most collisions involving bicycles take place at road intersections/junctions, where almost two thirds of bicyclists are killed or seriously injured in urban road crashes [56]. New road treatments for existing bicycling road infrastructure (such as painting bikeways blue at road intersections in Copenhagen) reduced the number of traffic casualties by 10% in the observation period, and injuries by 19% [57]. A single lane roundabout design without a specific cycle lane and a central island radius exceeding 10 m was seen to reduce the number of bicycle collisions in roundabouts in Sweden and Denmark [58,59]. Still, roundabouts were seen to increase the risk of intersection bicycling crashes when the motorized speed limit was above 50 km/h [60]. In a review of 22 bikeway designs [39], considered bike lanes and the removal of on-street parking as defensible in terms of safety effectiveness, while most other bicycling road treatments still require rigorous research. Even so, the implementation of 23 km of pop-up bike lanes in Berlin during the coronavirus pandemic coincides with the four-year record in bicyclist fatalities, as more drivers and cyclists took to the streets as an alternative to mass transit [5].

3. Methods and Data Digitalization

Initially, three digital datasets, commissioned to us by the Berlin Police, Berlin Senate Department for the Environment, Transport and Climate Protection, and the company BikeCitizens, were analyzed. Secondary and aggregated data were obtained from travel survey reports and the Berlin-Brandenburg statistics office. Specific datasets were prepared with these data; the datapoints were aggregated into space and time observation units, and then linear correlation and multivariate regression analysis was performed to determine how bicycling crashes and traffic volumes varied over time and observation locations (bikeway types and districts, for example). The next step was to present and discuss correlations, visualizations, and regression results to permit a combined analysis of the variations, differences, and relationships in time and space between bicycling activity and crashes in Berlin. A secondary goal of this study was to validate a digital data source in urban bicycling travel behavior and discuss whether it substitutes or complements the outputs of conventional travel surveys specific to this transport mode. An additional, ultimate goal was to inform special interest groups about whether and where an integrated and horizontal and combined analysis of these novel data sources can contribute to urban bicycling research, planning, and network design.
For the spatial relationship between crashes, bikeway network and types, and bicycling volumes, 23 spatial units were considered, as seen in Figure 1 and 2. The analysis was further divided into three steps. First, the spatial distribution of bicycling crashes was investigated (Section 4.1) with a cross-sectional analysis of collision density at intersections and on-road sections. Using a three-meter buffer around the axis of the five bikeway typologies found in Berlin, bicycling crash locations were correlated with these bikeway types using GIS or were considered to not be associated with a bikeway. Next, an in-depth spatiotemporal analysis of bicycling traffic volumes was performed and compared to SRV results (Section 4.2), and bicycling in Berlin was described in detail. Selected districts where the bicycling mode share was higher according to SRV surveys [19] were then examined in more detail. Finally, the relationships between bicycling crashes and traffic volumes were explored (Section 4.3), mainly focusing on the contrasts between Berlin districts and the spatial distribution of crashes according to bikeway type, to comprise an integrated analysis of all the spatiotemporal data collected for this study.
This study analyzed data from three different sets of data on bicycling traffic and crashes: (i) 76,292 bicycle trips provided by the BikeCitizens smartphone application from users who recorded their bicycling routes in the city of Berlin, (ii) disaggregated and randomized data on 38,916 bicycling road crashes registered over 48 consecutive months, provided by the Berlin Police, and (iii) open data files from digital bicycle counters at 17 locations in Berlin’s bikeway network, commissioned by the Berlin Senate, shows five different bikeway types, which were named and grouped according to their key geometric and design aspects in relation to other urban mobility modes: pedestrians, motorized vehicles, buses, and road infrastructure. In Berlin, bicyclists are required to use these bicycle specific infrastructures [61], and their design follows the design recommendations for cycling facilities [62]. The Berlin Senate provided a GIS file with the bicycle network geometry and bikeway type axis geolocation. In this study, we aggregate these bikeway types into six road typologies refereeing to the key design characteristics present. Bikeways that use physical barriers (posts, lanes of car parking spaces, plantings, etc.) to separate bicycle traffic on both sides of the bikeway from motorized traffic were called protected bike paths (PBP). Dedicated bicycle lanes on the same level and on the right side of motorized lanes, marked with a continuous white stripe to delineate and separate them from other traffic, were considered type 1 dedicated lanes (DBL1). A second type of dedicated bicycle lane had an interrupted painted white stripe and car parking spaces to the right of the bicycling flow (DBL2). Segregated bus lanes where bicyclists are also allowed to circulate are found across Berlin, and were considered shared-use between bicycles and buses (SUBBB). Lanes at the same level as sidewalks but separated from pedestrian traffic by a continuous white stripe were considered to be shared between bicyclists and pedestrians (SUBBP). All other urban roads in Berlin without one of these five previously described bikeway types were denoted as without bikeway (WB).
After collection, the data were cleaned as described below. From the BikeCitizens dataset, we removed: (i) 832 rides longer than 30 km, (ii) 1195 rides shorter than 500 m, (iii) 793 rides lasting longer than 2 h, and (iv) 27 rides with a duration of less than 60 s. Exclusion of these samples was supported by the literature [8], where such measurements in urban bicycling are considered atypical and more typical of sports or leisure trips than utilitarian cycling. The final dataset contained 73,445 bicycling trips or 506,536 km of bike rides made between 1 January 2016, and 1 September 2017. From the bicycling road crash dataset, we removed records of self-crashes (such as collisions with static artifacts other than vehicles) and collisions involving anything other than one bicycle and one motorized vehicle, in order to focus on only this type of collision, since we found that these crashes resulted in 92% of fatalities and 97% of severe injuries to bicyclists. Figure 2 illustrates where these selected crashes occurred. The spatial correlation of bicycling crashes with bikeway type and the territory of Berlin consequently considered (N) 25,668 datapoints, 23 spatial units, and 1578 km of five bikeway types, as shown in Figure 1 and Figure 2.

4. Results and Discussion

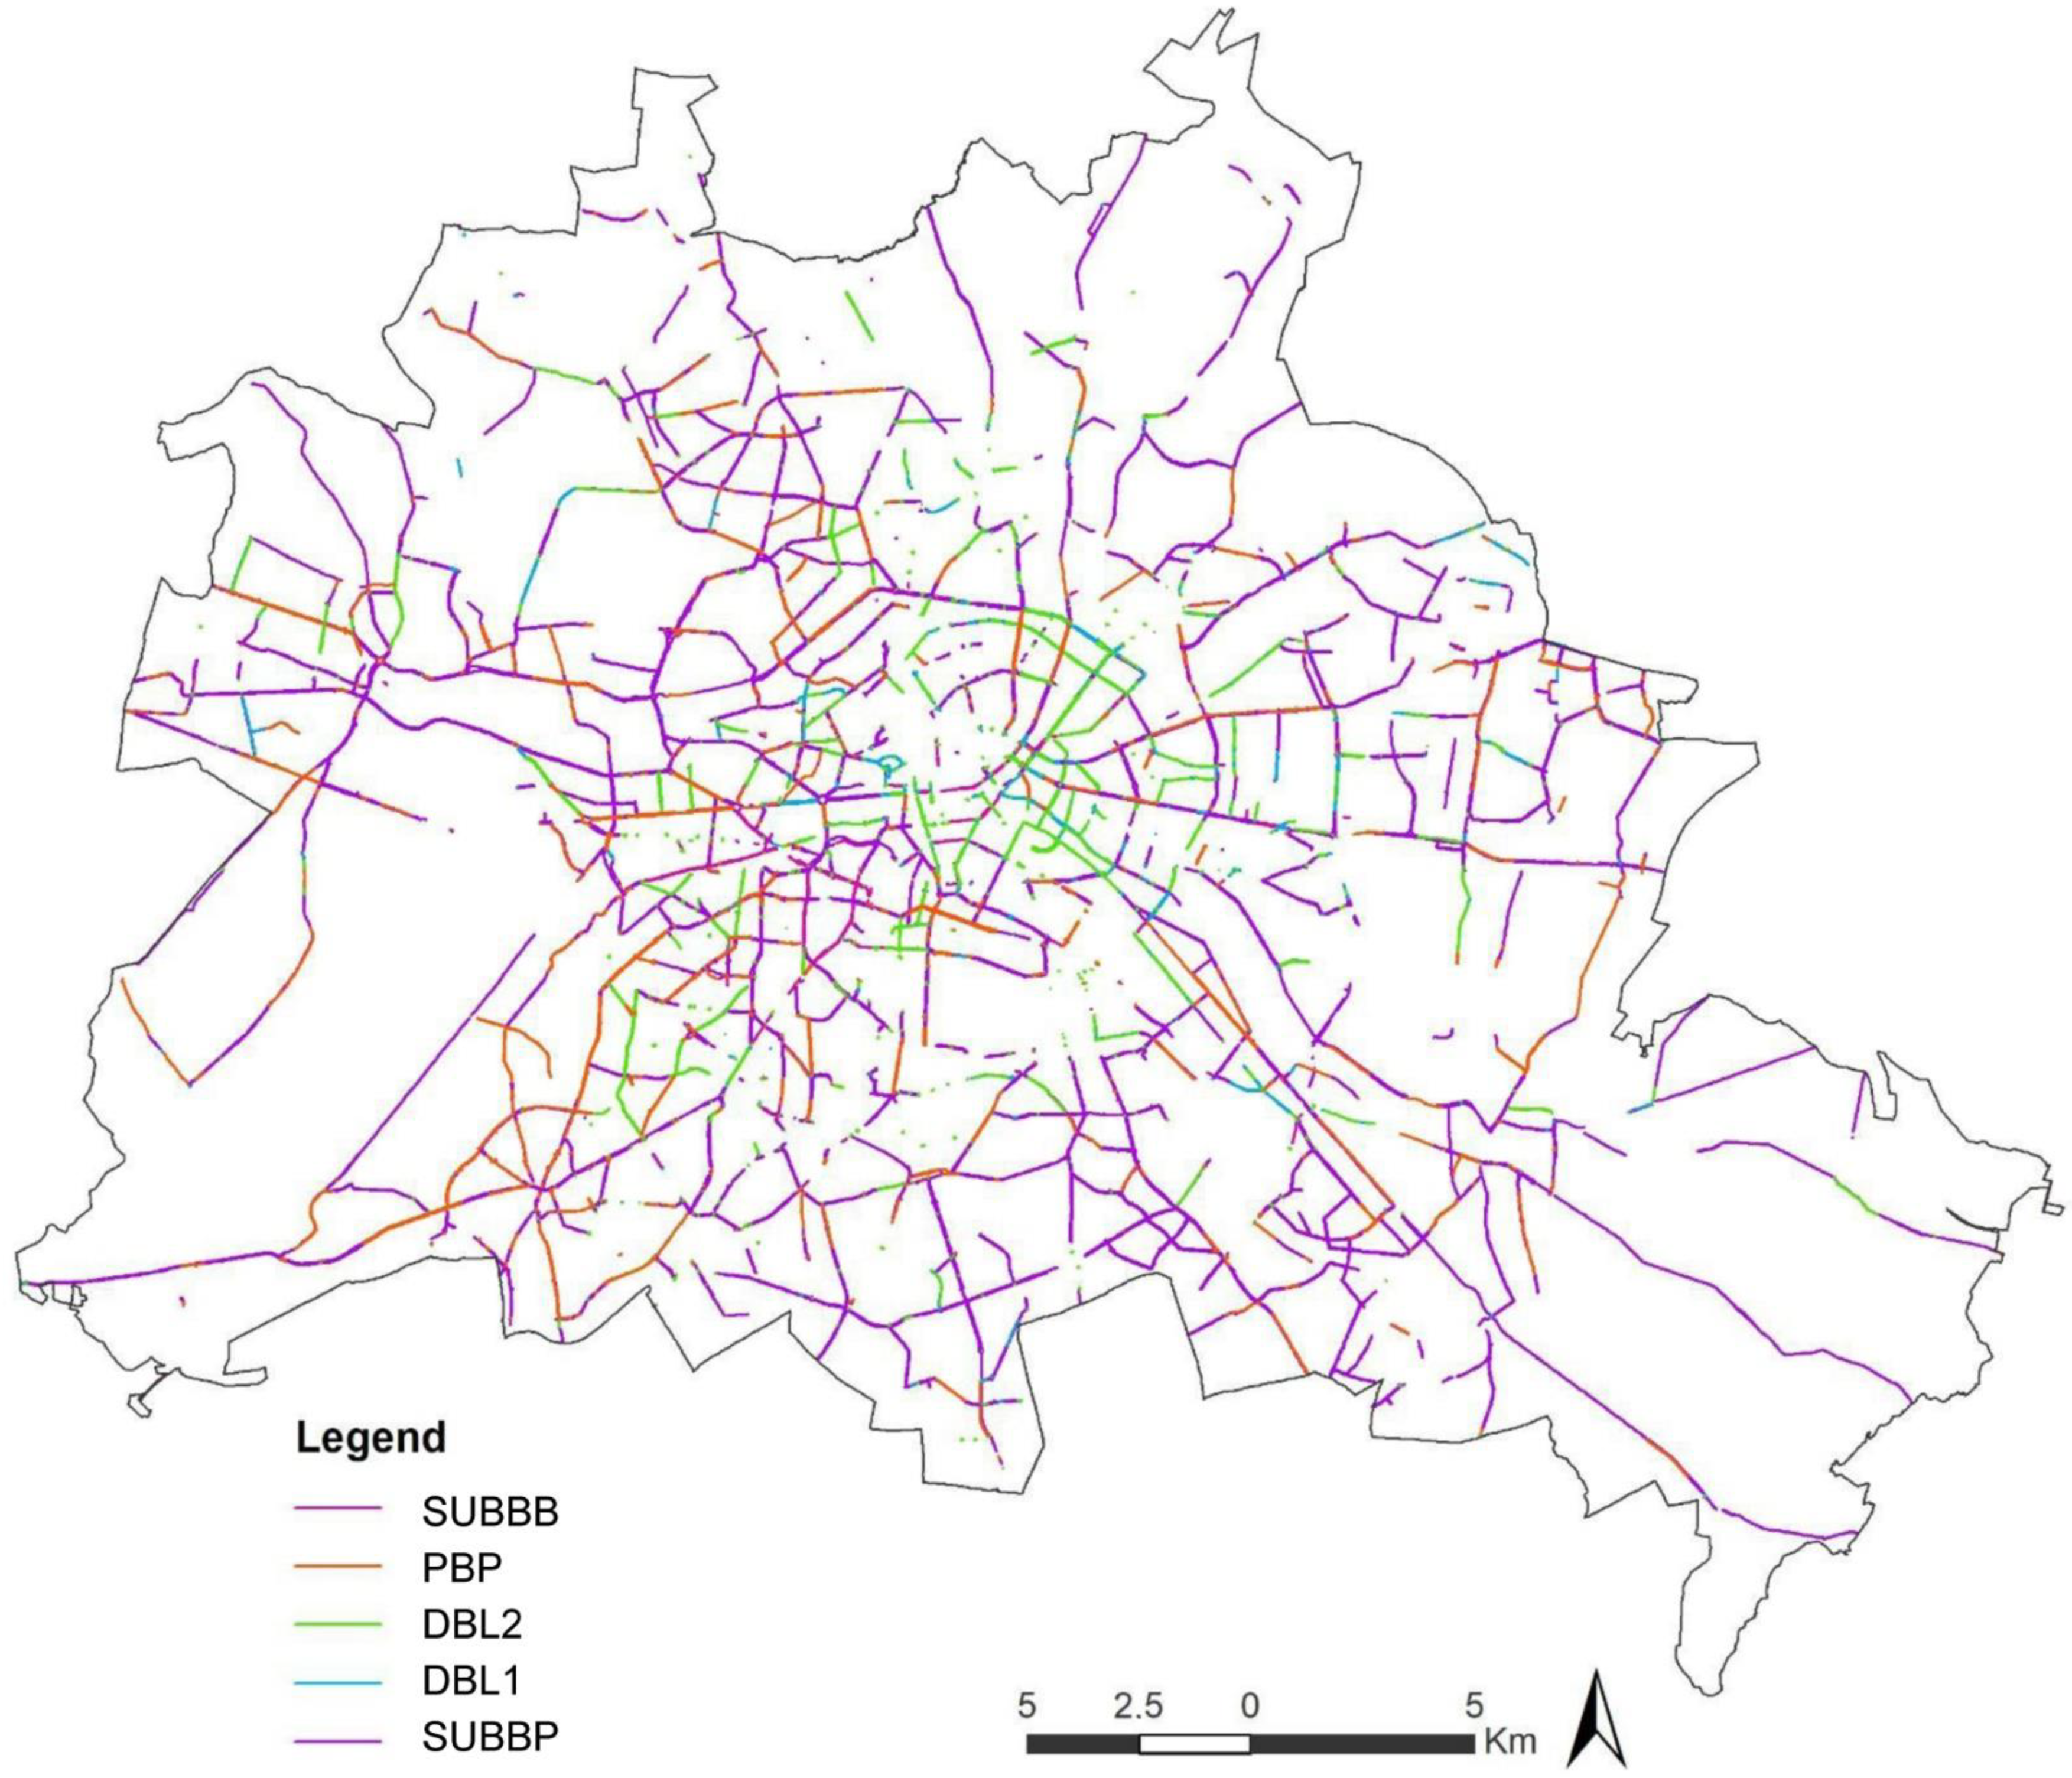
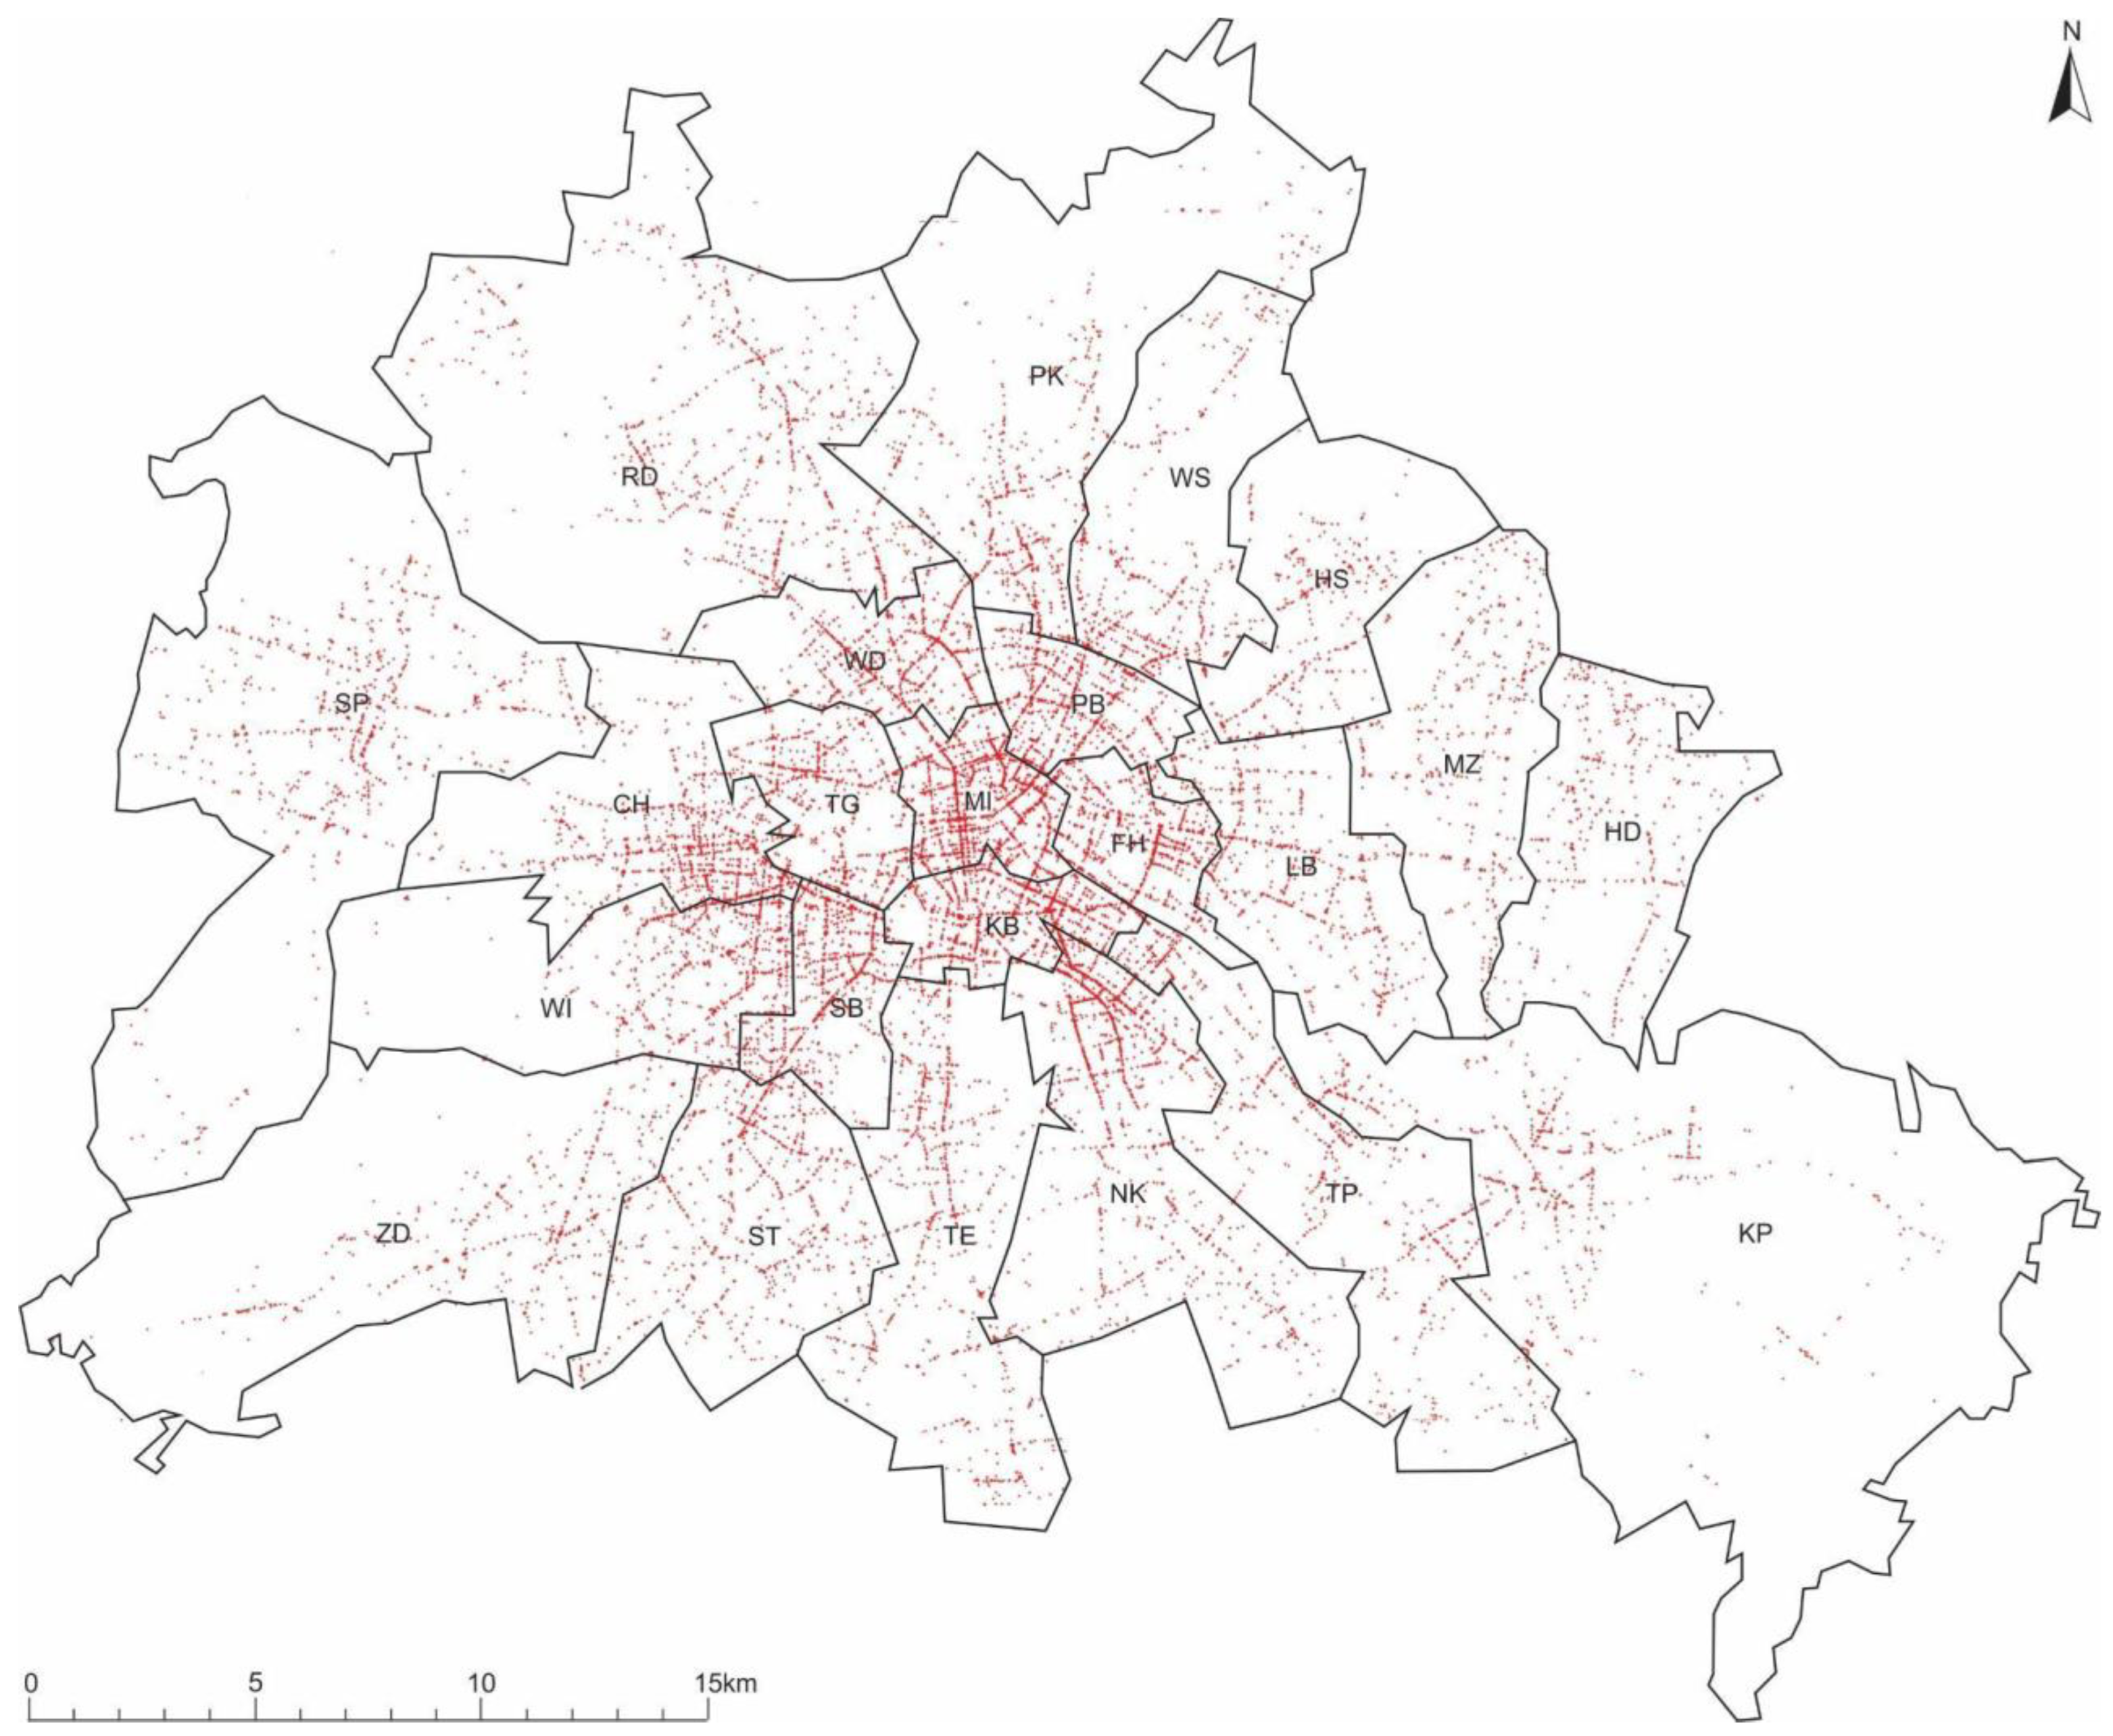
4.1. Spatial Correlation of Bicycling Crashes and Bikeway Types

A major share of the collisions involving bicycles and motorized vehicles was found to occur on WB roads where no bikeways are present. Mapping the crashes over 12 months revealed four highly similar spatial stamps, suggesting that the areas and locations with higher crash rates do not vary over time. At the bikeway network level in Berlin, 72% of all crashes, fatalities, and bicyclist injuries occurred at only 197 road intersections in the city. Of all the bicyclist fatalities, only 11% took place in road sections. For all crashes, 65% occurred at road intersections and 35% at road sections.
A spatial analysis of bicycle crash distribution in the bikeway network indicated that only in the SUBBB bikeway type were total crashes divided equally between the network geometry locations; roughly half of crashes occurred in road sections of the network (N2) and the other half at intersections (N2#). A comparison of total crashes on bikeways in road sections (N = 2333) and at intersections (N = 8021) indicated significant variation in the proportions of these two types of collisions. Viewed separately, the collision rate between intersections and road sections for each type of bikeway was 1 for SUBBB, 1.5 for DBL2, 4.4 for DBL1, 1.7 for SUBBP, 12.7 for PBP, and 1.3 for WB; the concentration of crashes at intersections on PBP-type bikeways is notable.
A strong, positive linear spatiotemporal correlation (R2 = 0.99) was found between bicycling crash density (N1) and severe injury (N6), considering the six bikeway types. The relationship between N1 and bicyclist fatality (N5) is strong and positive (R2 = 0.80), which is also true for moderate bicyclist injury (N7) (R2 = 0.97). No correlation was found between crash density, bikeway types and bicyclist fatalities. For this reason, regardless of bikeway type where crashes occurred, the density and frequency of bicycle crashes is strongly correlated with severe and moderate cyclist injuries. Multivariate regression analysis was performed with 23 observations, each related to the spatial units seen in Figure 2, with the number of bicycle crashes as the dependent variable (Y) and number of fatalities and severe injuries as independent variables (X1 and X2). The resulting R2 was 0.82, while the resulting p-value for the predictor bicyclist fatalities (X1) was 0.34, suggesting that the number of severely injured bicyclists (X2) has a better fit in models estimating total number of bicycling fatalities. In other words, the number of fatalities in crashes involving bicyclists and motor vehicles does not appear to explain much of the total number of crashes, while the number of severe and moderate injuries does.
Most collisions at intersections are notably concentrated in PBP-type bikeways; this is most evident in the Mitte (MI) district, where the share of bicycle trips is similar to the city-wide rate (13%), and most bikeways with a PBP-type infrastructure are located. Roughly half of the crashes at these intersections were turn-off type accidents, where the motorized vehicle crosses the bicycle’s trajectory. No significant differences were found in density per bikeway typology, except for SUBBB, where the lowest incidence of this crash type was seen (24%). At intersections, collision density is substantially higher (58%) when the bicycle road infrastructure is the PBP type, and lower for SUBBB. Berlin Police crash reports made at the accident site indicated that drivers exhibited erratic behavior in 57% of cases, while bicyclists appeared to be at fault in 31% of cases. We found that bicyclists were more likely to be at fault at intersections without bikeways (WB).
The design of bicycle road types appears to influence collision density. However, analysis of this correlation at the district level and a comparison of the results indicated that the road type design varied in density and frequency when each district was analyzed separately, suggesting the need to control for exposure (to motorized traffic) for a clear result when comparing safety in bikeway types. Crashes at intersections were approximately four times more common than those in bikeway sections. As access to buildings along road sections in Berlin is very restricted, these types of crashes may result when drivers cross the bikeway and sidewalk to access on-street parking parallel to the bikeway, as noted in the literature [39]. Traffic crashes on roads without bikeways (WB) have almost the same distribution in the two analyzed road locations (road sections or intersections), as seen in Table 1. This suggests that the crash risk for bicyclists is lower along the road sections of any bikeway type, while the risk at intersections (or street crossings) without bikeways is roughly the same.
Four roundabouts were analyzed (Table 2), and the highest crash density was seen at the Moritzplatz intersection, which lacks traffic lights and has a significantly smaller central island radius, two features which have been linked to bikeway safety [58,59]. In most collisions (90%) at the analyzed roundabouts, the data indicate that driver behavior was the key determinant for the crash. It is our opinion that the geometry and design of this road infrastructure type (or environmental design) is also a key determinant of the higher crash density observed at this roundabout.

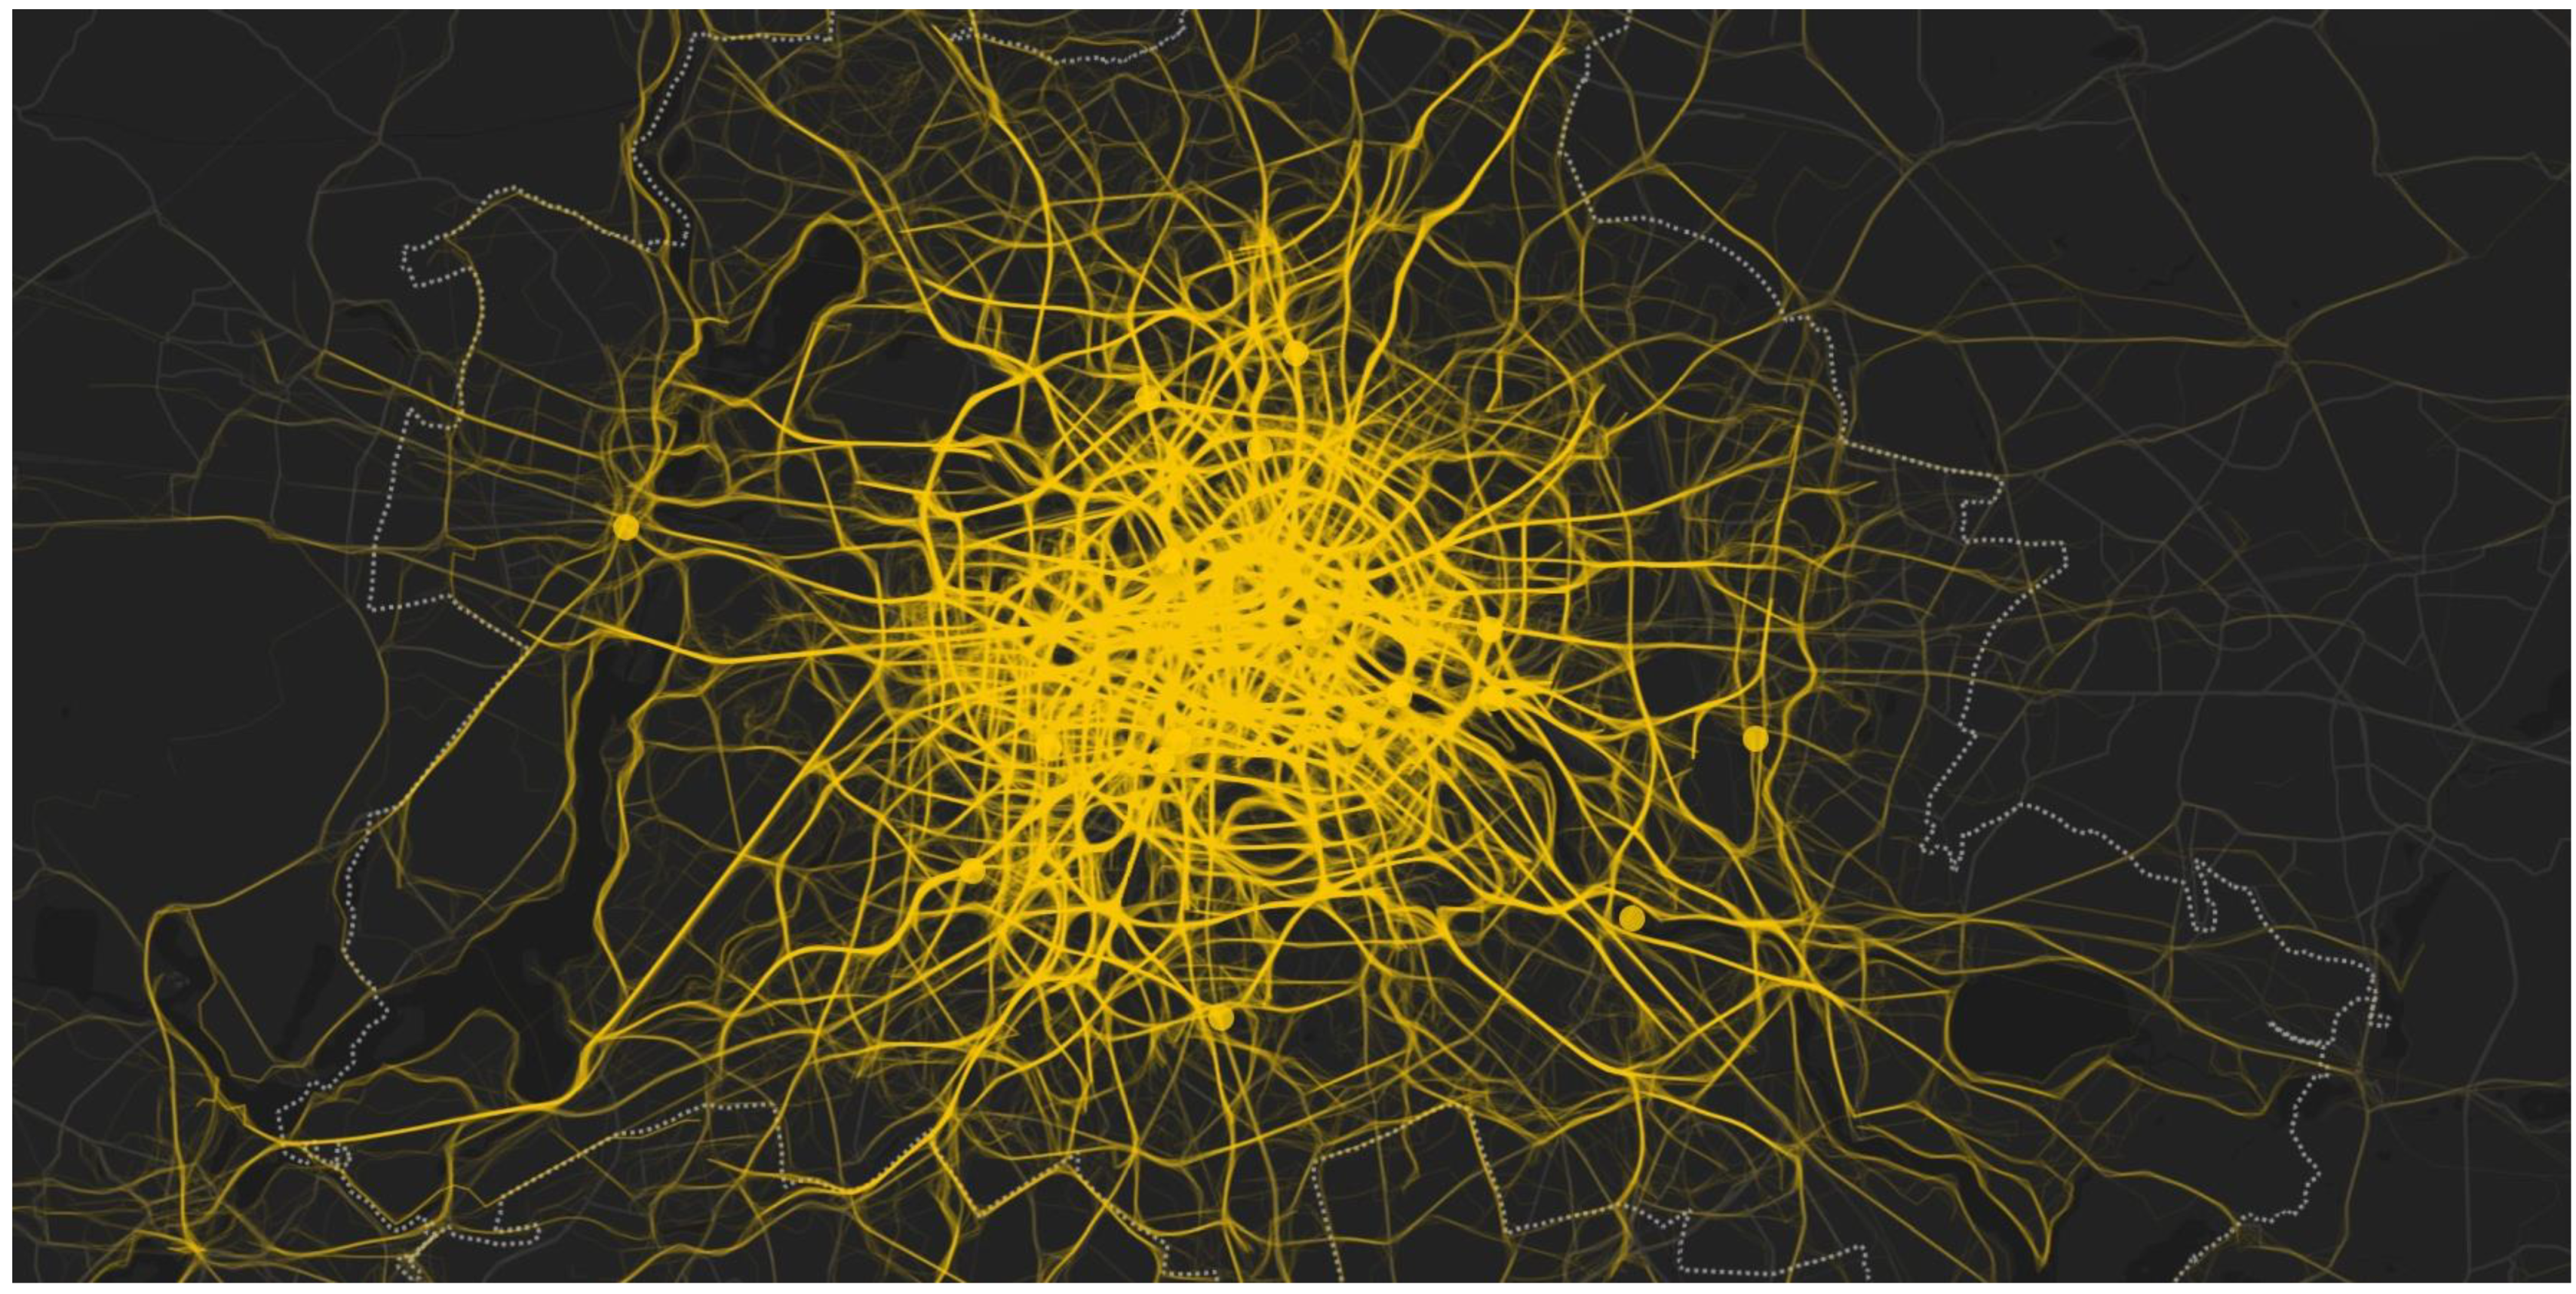
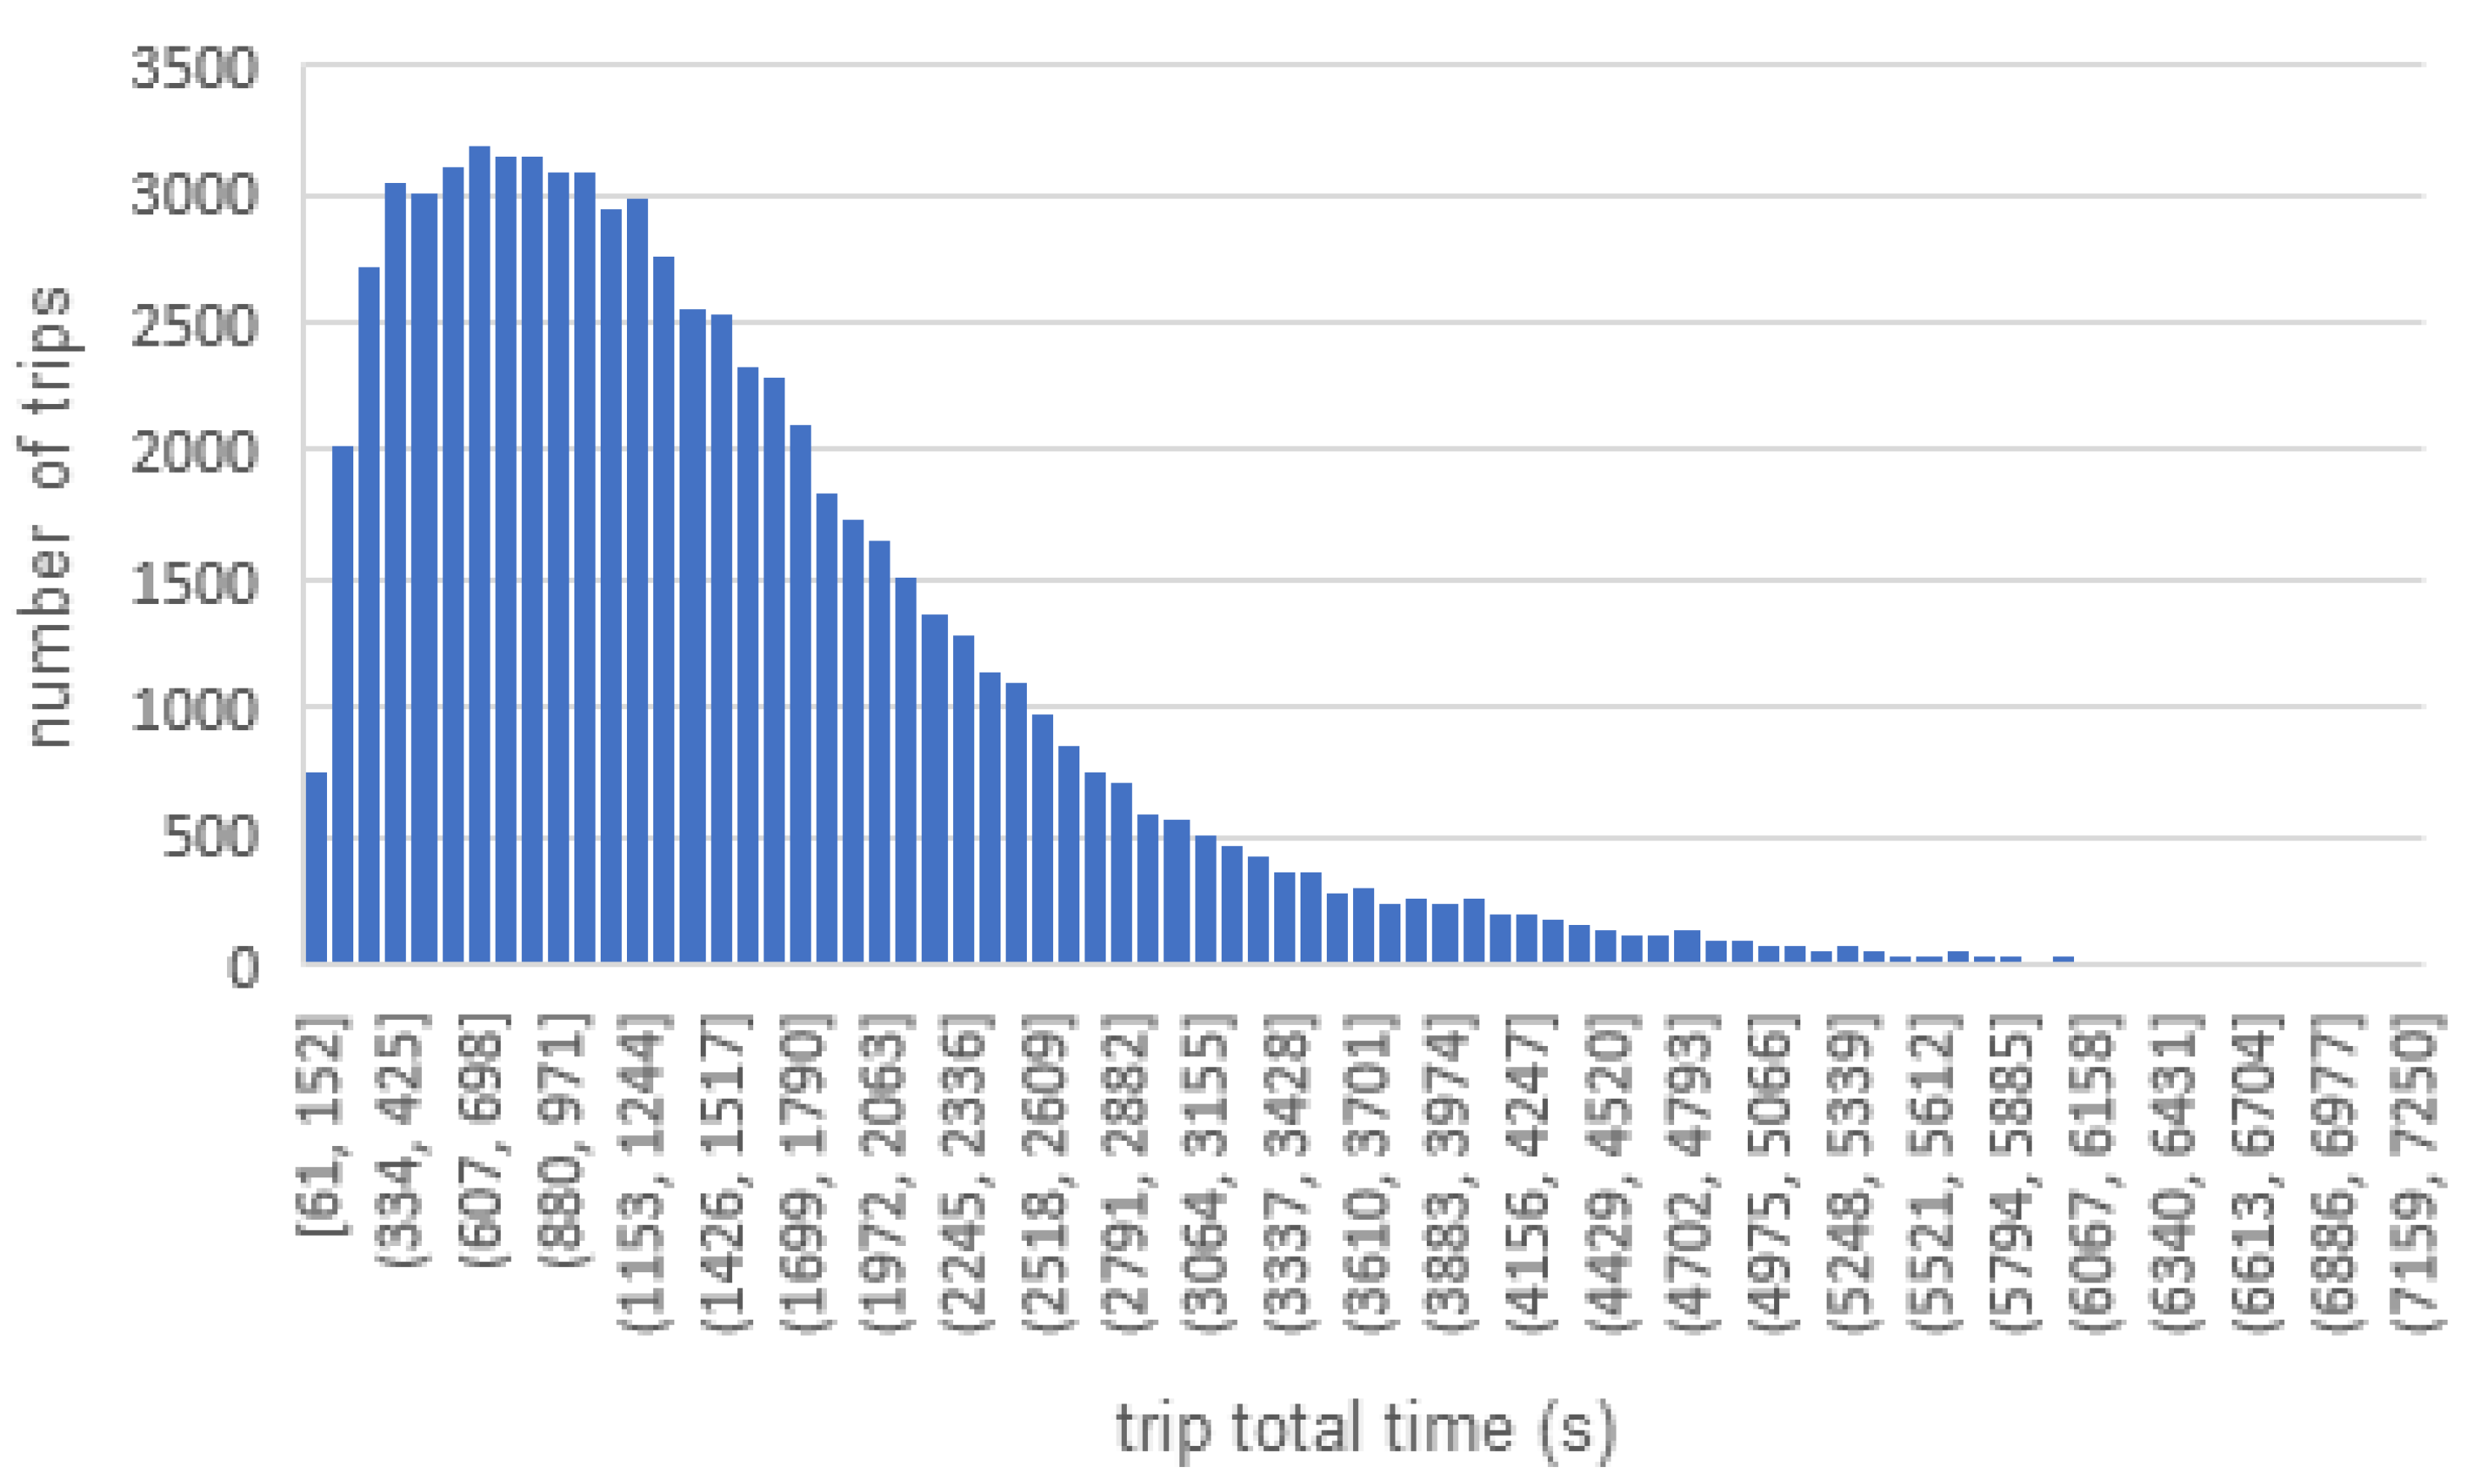
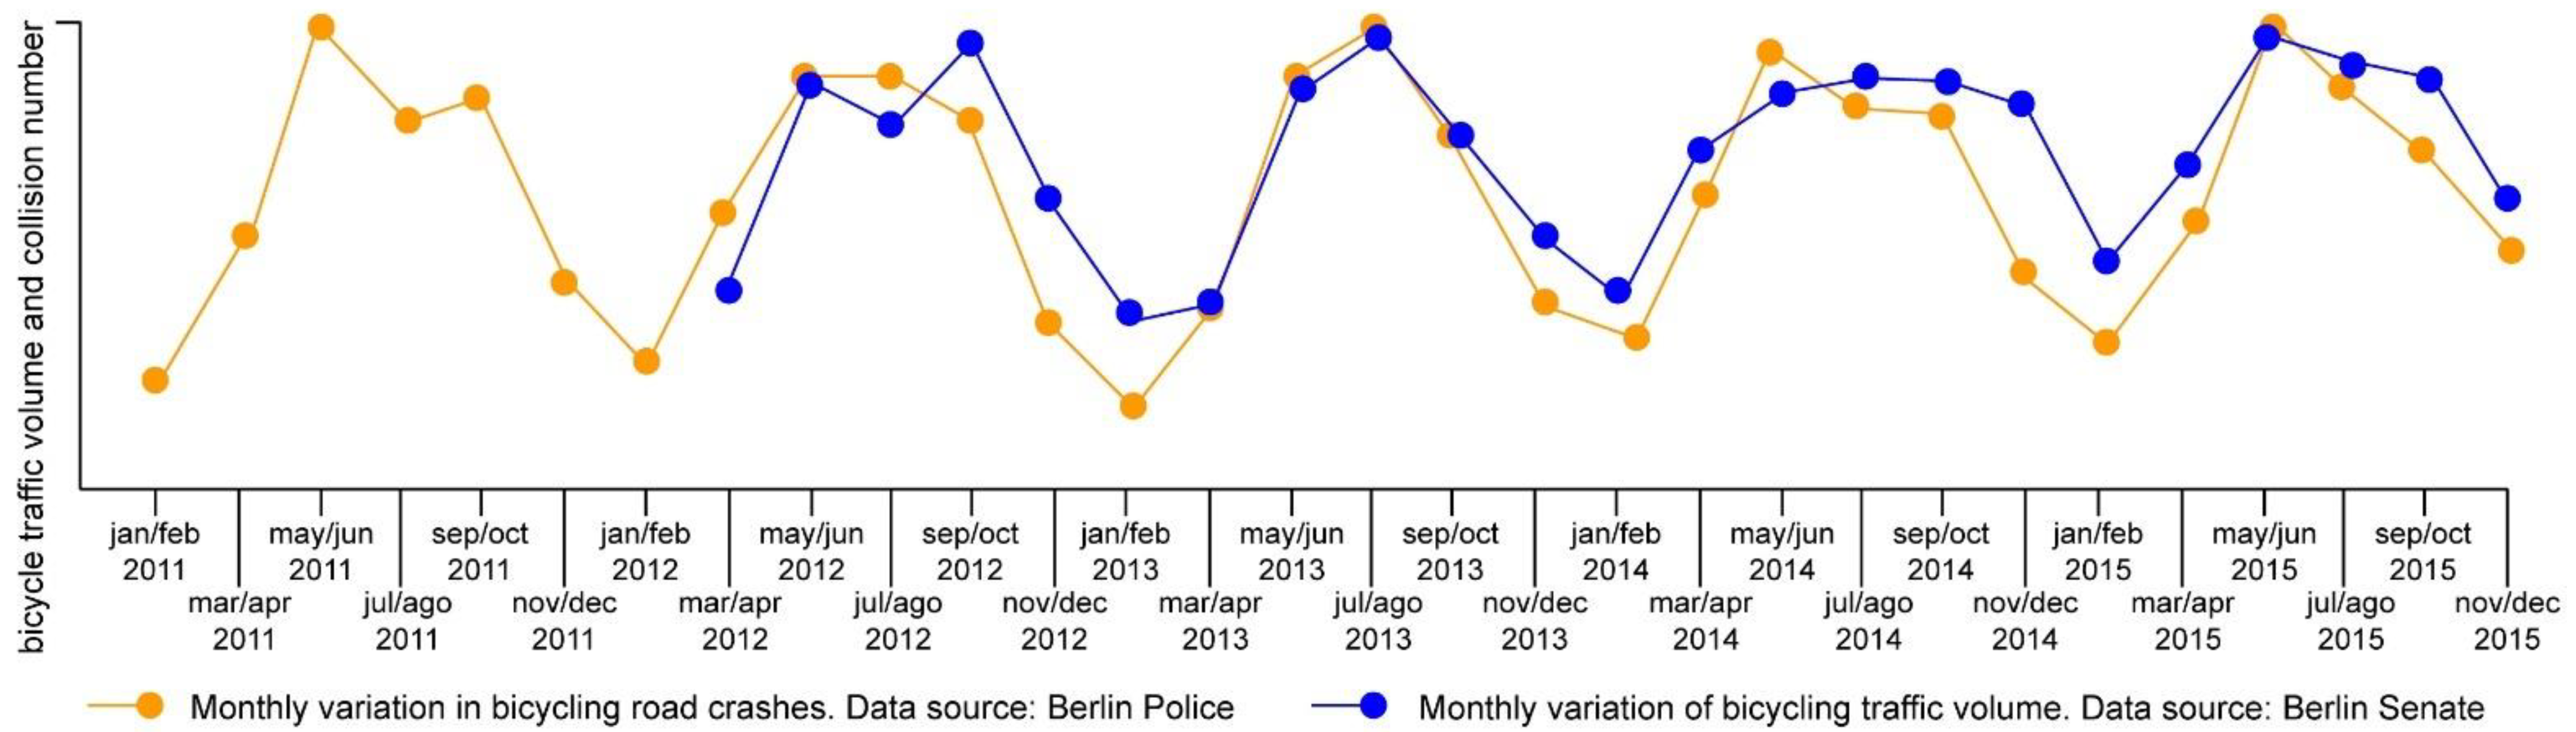
4.2. Spatiotemporal Analysis of Bicycle Traffic and Bicycling Trip Behavior

Analysis of the bikeway types in Berlin with regard to their adoption by bicyclists and relative safety is important to design future extensions or interventions in the network. As seen in Figure 1, the bicycle road infrastructure in Berlin is very segmented, with several interruptions in the network and multiple transitions from one bikeway type to another along the same road axis. It appears that neither the continuity of bikeway segments and integrative design, nor specific road treatments, were given priority in network planning. The bicycling facilities were separately financed, planned, and designed in 13 different district authorities in Berlin, and some districts have more urban cyclists than others [63].
A comparison of the Berlin bikeway infrastructure map (see Figure 1) and visualization of bicycle route volumes (Figure 3) shows that the components were likely implemented according to the available space or combined with other measures implemented at the same site. Visualization of bicycling traffic volumes and routes reinforces this observation; it appears that the planning for the bicycling network was carried out in combination with road interventions, instead of requirements based on bicyclist behavior or evidence-backed improvements in bicycling safety. As seen in Figure 1 and Figure 2, the bikeway network is equally distributed throughout the city, but the grid is finer in the city center, and the collision density and frequency are higher.
The data collected at 17 measurement points (bicycling traffic nodes) indicate that about 1.3 million bicycle trips are made each day in Berlin. An annual increase of 3% was seen in the average bicycle traffic volume since 2012. A comparison of the bicycle counts from 2019 and 2020 (the year of the COVID-19 pandemic) showed a 17% increase in bicycling traffic volumes (Figure 4). The plot of the sample histograms for the variables bicycling trip distance (Figure 5) and bicycling trip time (Figure 6) presented normal distribution; the sample subgroups created for trip time and trip distance are compatible with the distributions of bicycling trips seen in other European cities [11]. This suggests that, after calibrating the data, the confidence interval p-value would approach 95%.
Volumes can also differ significantly between days, with volumes being up to four times greater on weekdays than weekends, implying that bicycle trips are primarily for commuter or utilitarian purposes. The same variation was found in the BikeCitizens sample, reinforcing the representativeness and statistical significance of ICT-based utilitarian bicycling data collection.
The spatial distribution of cycle trip origins (O) and destinations (D) was also analyzed, depicting a larger share of bicycle commuting trips and denser bicycling activity in the central districts of Berlin. This is illustrated in Figure 7, where the visualizations clearly show that the O density matches D density, suggesting that the sample is predominantly composed of commuting and utilitarian trips, and consequently suitable for infrastructure planning and design purposes.
The map in Figure 7 also shows that 10,282 of the 73,445 O bicycling trips (13.9%) were located outside the territory of Berlin, highlighting an important inward flow. This shows about 40% more bicycling trips than those that originating within the Mitte district, which is the most frequent starting point of bicycle trips in Berlin according to our findings and the SRV.
To validate the BikeCitizens dataset, the origins of the trips were correlated with the shares of trips provided by the Berlin Senate travel survey reports (SRV). A positive and moderate correlation (R2 = 0.39) was found between bicycling traffic volumes in the BikeCitizens dataset and the volumes measured by the Senate system. The relationship between the spatial location of bikeway types and crashes was established using a buffer of 5 m from the bikeway axis. The BikeCitizens sample was not calibrated to increase correlation results, but since it contains over 70,000 bicycling trips (compared to roughly 15,000 interviews to represent the entire city and all transport modes in the SRV), we understand that calibration using the Senate measures as a reference would substantially improve the statistical significance of the BikeCitizens sample. Not surprisingly, a regression analysis with 23 observations, each referring to the spatial units seen in Figure 7 and using the estimated SRV number of daily bicycling trips as the dependent variable (Y), and inhabitant density (X1) and number of BikeCitizens O and D trips per observed spatial unit (X2) as independent variables, resulted in an e-model that explains 98% of the variation within the data.

4.3. Relationships between Bicycling Crashes and Traffic Volumes

As mentioned, the O and D of the bicycling trips coincide (see Figure 7). The districts with the greatest concentration of O are also those reported in the SRV Berlin 2008 and 2013 to have a larger modal share, suggesting that the sample analyzed in this study represents the bicycling in Berlin. It is important to mention the proximity of correlation results between the bicycling trip volumes found in the data and the SRV results, as well as the Berlin Senate results.
The correlation results are positive, but of median strength. The fact that we took the average daily number of O for trips in aggregate at the district level (or observed spatial unit) from the SRV data and adjusted this value to match the growth in average number of daily trips per inhabitant found in the SRV 2013 might explain the strength of this correlation. For the correlation of bicycling volumes at the 17 locations, one possible explanation for this median-strength correlation result is that 61,098 of the 76,292 trips did not pass through any of the 17 locations where bicycling volumes were measured by the Senate sensors (see Figure 3).
To evaluate the relationship between the bikeway network and proximity with bicycling O and D, Table 3 presents a summary of these spatial correlation results.
We also focused on the districts with a higher bicycle mode share than the city figures. The FH and KB districts accounted for 21% of total daily trips made by bicycle, corresponding to approximately 172,000 trips every day. Together, the PB, WS, and PK districts represent 17% of bicycle mode share, or about 179,000 daily trips made using a bicycle. In the MI, TG, and WD districts, 14% of daily trips are made by bicycle, representing 136,000 daily bicycling trips. Although daily bicycling trip numbers are similar in the first two groups of districts, they differ substantially in the number of collisions with motorized vehicles (see Table 4). There does not appear to be a significant correlation between district group bicycle mode share, bikeway typology extension, and collision density. One possible explanation for this is that the population density in these districts is responsible for the similar number of daily bicycle or motorized vehicle trips. We focused on these districts because they are in the city center, where bicycle collision density and frequency appear to be the highest.
The collision frequency and density rate on road sections and at intersections on roads without bikeways (WB) were highly similar in all the investigated district groups. On the other hand, for each collision on a road section of the other five bikeway types, an average of four were registered at road intersections, suggesting that the road sections of any of the five bicycle road facilities are safer for bicyclists than roads without bikeways, as seen in Table 5.
The Table 6 presents the results of a multivariate regression analysis with 23 observations, using the number of crashes on the roads without bikeways (WB) within spatial units as the dependent variable (Y) and the inhabitant density and estimated number of bicycling trips as independent variables (X1 and X2), resulted in an R2 value that explains 45% of the Y variable variation and high p-values (>0.1) for the variation in both X variables. This consequently indicates that this model cannot explain much of the variation in crash density per bikeway type. However, the Anova and resulting coefficients and p values for the e-model suggest that the inclusion of an additional independent variable, such as motor traffic volumes in the same observation unit, could improve the explanatory power of bicycling crashes in future e-models.
The density of bicycle collisions with motorized vehicles at road sections was higher than those at intersections for the SUBBB type of bicycle road infrastructure in districts FH and KB, as shown in Table 5. The frequency (col./km) varied substantially in the three groups of analyzed districts and for bicycle road type; this variation (highlighted in Table 5, which presents collision frequency by bicycle road type) is especially important compared with Berlin as a whole. The frequency for the PBP type of infrastructure within the FH+KB district group (101 collisions/km) was much higher than in the city of Berlin as a whole (21 collisions/km). No correlation was found between the length of bikeway type and collision number on bikeway type in the analyzed district groups, indicating that the collision frequency and density for each bicycle road type varied significantly according to the district in which these roads are found. For this reason, the safety of these five bicycle road facility types depends not only on design, but also on the spatial context.
We investigated the spatiotemporal variation in bicycling traffic volumes at the 17 digital counters located within Berlin’s bicycle road network, as seen in Figure 3 and Figure 6. Average bicycle traffic volumes were four times higher in July (summer) than in January (winter). A correlation analysis between the generated values of daily bicycling trips and the number of bicycle collisions was then performed, controlling these values in the 23 city districts and for the months from 2011 to 2015. A moderate positive correlation (R2 = 0.56) was found between these two variables in the 46 observations in the dataset; in other words, 56% of the variance in these two variables values is explained by this relationship. However, when the values for the MI district (which appeared as an outlier in plotting) were excluded from the database, a strong positive correlation (R2 = 0.80) was also found in the linear regression analysis of the relationship between these two variables. This implies that district bicycle volume significantly affects collision density and frequency in 22 of Berlin’s 23 observed spatial units (excluding MI). The common wisdom that an increased in bicyclists in time and space lead to safer bicycling environments does not seem to apply when the spatiotemporal and bicycling volume measures are considered.
The spatial unit MI represents Berlin’s city center, the largest absolute extension of bikeway types, and has a higher inhabitant density and congestion index [64], which is a proxy for motor vehicle traffic volume in this spatial unit. A linear correlation analysis between pairs of variables was performed, considering 24 spatial observations (23 districts + all of Berlin) for both variables. A strong correlation (R2 = 0.96) was found between bicycling collision density on bikeway types and the density of crashes at road intersections. On the other hand, a separate correlation analysis of only eight observation units (the central districts we focused on in this subsection: FH, KB, PB, WS, PK, MI, TG, and WD) exhibited a weak and negative correlation (R2 = 0.30) between the same two variables. This means that the volume of private motorized trips might influence bicycle collision density and frequency differently in the different spatial units and bikeway types in Berlin.
The plots in Figure 8 suggests that bicycle traffic volumes influence bicycle collision density and frequency. The trend line plots for the variable values are extremely similar, suggesting a strong positive correlation between bicycle traffic volumes in Berlin and bicycle collision density and frequency.
The average bicycling volumes during July and August are four times the volumes registered in January and February as of 1 April 2012, when all digital counters were fully operational. To obtain the bicycling volume trend line plot seen in Figure 8, we considered the variation in bicycle traffic in Berlin between the summer (June, July, August) and winter (December, January, February) and temporal distribution of bicycling crashes. As seen in Figure 8 and Figure 9, bicycling traffic volumes and crashes vary substantially over time, but a lower bicycling volume is accompanied by fewer crashes, and in January and February (the coldest part of winter), both form a quarter of the values seen during July or August, when temperatures are significantly higher. The temporal distribution of crashes seen in Figure 9 suggests that natural or artificial lighting does not significantly affect the density or frequency of bicycling crashes.

5. Conclusions

The contemporary quality and quantity of digital data on traffic volumes and crashes enable researchers and planners to make informed changes in the design of safer and more convenient bikeway networks. Although this study involved data collected in Berlin, a similar research design can be used for the integrated analyses of bicycling crashes and traffic volumes in other cities, if data at the city scale and geolocation of crashes and facilities are commissioned to researchers. As the previous sections show, data quality and quantity are the main obstacles to progress in the field of urban bicycling. However, in the case of Berlin, data on road crashes involving bicycles, traffic, and the geometry of the bikeway network since 2011, are available in digital format, making the city a reference for data collection and storage on bicycling road crashes, and other cities could develop and implement similar managerial and technical approaches to improve their own data on road crashes. The reproducibility of this study in other cities should consequently start with a preliminary investigation of potential data sources, followed by a formal inquiry of public and private data holders and assessment of data quality and quantity. Later, these datasets should be combined in an integrated analytical framework such as the one used here. One central limitation of this study is that we did not collect data on motor vehicles traffic at the same time as data on bicycling. This could be a promising independent variable when modeling of bicycling crashes using multivariate regression, to help conclusively discuss bicycling safety and crash risk in different bikeway designs.

5.1. Implications for Designing Future Networks

Berlin’s digital bicycle-counting system provides data on bicycling traffic volume in real time and both directions at 17 static locations. This system collects and stores data, and makes more data available to researchers at lower costs and significantly smaller thresholds than previous conventional (or manual) bicycle counts. The resulting data are combined with the BikeCitizens route dataset, which provides only partial data about its users but was more equally spread throughout the city. While the bicycle count data provided an accurate measure of traffic volumes at specific points in time and space, the app dataset makes it possible to visualize bicycling routes and volumes according to road segments. By correlation and regression analysis combining these data sources, this study demonstrated that the data from the BikeCitizens routing application are representative of all utilitarian bicycling in Berlin. Consequently, a geometry (or grid) derived from visualizations (as seen in Figure 3) allows planners to define future interventions and complement the Berlin bikeway network according to individual criteria, since it depicts routes with higher traffic volumes. Associated bicycle facilities such as parking spaces and racks could also be situated based on these data.
One potential intervention would be to prioritize extending the bicycling network from the city center to the outskirts, from streets with higher bicycling volumes to streets where these volumes are lower. Specifically in Berlin, connecting bikeway segments from the central districts and outward is an important priority. The city center, which concentrates far more trip origins and destinations, could feature a denser grid of bikeways, while longer high-speed segments (“bicycle highways”) could cross peripheral areas and connect to the city center. Another important finding is that erratic behavior is more common among cyclists in Berlin on streets that do not have cycle roadway facilities; expanding the bikeway network would consequently reduce the number of crashes resulting from human factors. The higher density of collisions at the Moritzplatz roundabout (which features a smaller radius and lacks traffic lights compared to other roundabouts in the city) suggests that this intersection requires an immediate redesign and review of the geometry recommendations for this type of road treatment.
The bicycling traffic volume peaks in summer, which means that these trips are substituted by other transport modes during winter. Since only a small share of trips in Berlin are intermodal [40], measures promoting intermodal trips involving bicycles and public transport or making them more convenient during winter might alter the behavior of the approximately 400,000 bicyclists who move to less sustainable transport modes. While this study clearly shows that bicycle use increased during the COVID-19 pandemic, public transit usage declined dramatically [65] and congestion levels are higher than in the pre-pandemic period [64].

5.2. Implications for Future Planning

As digital data sources are novel, new methods, institutional arrangements, and analytical frameworks are also required to safely foster an increase in urban bicycling. In the social construction of large technological systems, actors tend to crystallize practices over time [12]. In the Berlin case, it helps to explain why the actors and social groups involved in bicycling research and planning have not yet explored the full potential of new available data sources. Practices and cultures in cross-departmental and institutional were stabilized over decades. However, new research and planning schemes involving all the phases, databases and actors of urban bicycling research, planning, and network design could utilize integrated institutional frameworks, similar to the one presented here. As an example, it is important to mention that we did not find an ordinary GIS analyses of crashes or visualizations in the annual reports of the Berlin Police or other governmental websites. Urban mobility planning authorities are clearly more likely to have greater GIS capabilities and competencies, and it is due to police departments to enforce traffic laws and record and conduct descriptive statistical analysis of the road crashes, which in turn that normally take place in large cities in combination with bikeway design types at the local planning agencies. Urban collisions should be analyzed as any other externality for urban mobility, such as air pollution and congestion, and, therefore, fall under the authority of transport and traffic planning authorities. However, in the case of Berlin, no such spatial analysis has been conducted by any other urban mobility planning or urban design agencies in Berlin, since the GPS coordinates of road crashes were first recorded in 2011 [18].
Planning bikeway infrastructure at the city scale in Berlin requires the centralized coordination of traffic engineering and planning teams in 13 districts, which will facilitate the evolution and completion of a seamless network. This study found that most bicycling trips, traffic volumes, and road crashes occurred in only 8 of the 23 analyzed spatial units in the city. The districts in Berlin currently have independent planning teams focusing on their own spatial units, and bicycling research and planning personnel are scarce at the district administration level [63].
The preliminary analysis conducted here selected only collisions involving one bicycle and one motorized vehicle from the complete data. These crashes were found to result in 92% of fatalities and severe injuries to bicyclists. At intersections, the collision density was substantially higher than average (58%) on PBP-type bikeways, and lower than average for SUBBB-type facilities. The police indicate that erratic driver behavior appears to be the main cause of 57% of crashes, while bicyclists are at fault in 31% of cases. Bicyclists were also found to be more likely to be at fault at intersections without cycling infrastructure (WB).

5.3. Implications for Future Research

While conventional travel surveys depict the horizontal evolution of bicycling in the city, which is important for evaluating and drafting carbon-neutral urban mobility policies, digital surveys provide unprecedented, in-depth data on spatiotemporal distribution and variation in bicycle use and crashes in cities. We suggest that transport authorities systematize digital data collection on urban bicycling in Berlin to allow researchers to investigate the issue of safety via a systems approach [14]. Digital surveying appears to complement conventional surveys; permanently acquiring the data generated by private companies and publishing these datasets might stimulate the studies that are needed in this field.
After the findings generated in this study and the inconclusive results of regressions for certain variables (population density, bicycling trip volume, crash density, and type of bikeway extension), future safety studies might incorporate the volume of motorized traffic per observation unit as an independent variable, which could lead to better models explaining crashes as well as comparative bikeway safety. Further investigations could also focus on the share of collisions that occur on road segments in the various bikeway types (40.4%) compared to those that occur on roads without bikeways (59.6%). We were intrigued that certain bikeway types might not perform better in terms of safety than roads without bicycling facilities when considering only crashes at road sections. An in-depth analysis is recommended to compare the design of these bikeways with roads that do not have bikeways, to determine which type of road infrastructure is safer for bicyclists along road segments. A comparison between spatial units with a marked speed limit of 30 km/h and those with higher speed limits could reveal if the bikeway types associated with limited motor vehicle speeds perform better than those outside these areas. Considering the SUBBP type extension and the growing number of road crashes involving bicycles and pedestrians in the city, a specific investigation within the same framework might prove fruitful. This type, which has the largest extension among Berlin’s bikeway types, separates bicycle traffic from pedestrians only by color, or lines painted on the sidewalk. Collisions at transitions between bikeway types and road intersections also merit attention, especially in research that compares data before and after painting the pavement at intersections or street crossings; accidents on road types with visual barriers between bike lanes (for example, parking lanes between motorized traffic and the bikeway) also need further investigation.
Another avenue for further investigation is the shared use of bus lanes (denoted SUBBB here), for two reasons. First, we found a lower density of crashes in road intersections with this bikeway type: the presence of buses might make drivers more cautious as they cross these lanes. Second, this type of bikeway is uncommon worldwide, but has been used in Berlin since the 1990s. If bicyclists are found to be safer on this type of road, the city can combine new road infrastructure with both of these sustainable modes in debates on removing parking spaces and car lanes.

Author Contributions

Conceptualization, R.M.M.; methodology, R.M.M.; software, R.M.M. and Q.J.-P.; validation, R.M.M. and I.B.; formal analysis, R.M.M.; investigation, R.M.M. and Q.J.-P.; resources, R.M.M. and I.B.; data curation, R.M.M. and Q.J.-P.; writing original draft preparation, R.M.M. and I.B.; writing review and editing, R.M.M.; visualization, R.M.M.; supervision, R.M.M.; project administration, R.M.M.; funding acquisition, R.M.M. and I.B. All authors have read and agreed to the published version of the manuscript.

Funding

This research was funded by Brazil’s Conselho Nacional de Desenvolvimento Científico e Tecnológico (CNPq), grant number [202010/2017-1], Coordenação de Aperfeiçoamento de Pessoal de Nível Superior (Capes), grant numbers [40003019014P7 and BEX6594/15-8], Germany’s Deutscher Akademischer Austauschdienst (DAAD), grant number [91638074]. The APC was generously waived by MDPI.

Institutional Review Board Statement

Not applicable.

Informed Consent Statement

Informed consent was obtained from all subjects involved in the study.

Data Availability Statement

No new data were created by authors’ instruments in this study. Restrictions apply to the availability of these data. Raw data obtained from BikeCitizens and Berlin Police are available from the correspondent author for academic research, with the permission of these data commissioners, and can be publicly visualized online at https://urbanbeing.ape1001.com.br/ (accessed on 25 June 2021). Data obtained from Berlin Senate are publicly available at https://www.berlin.de/sen/uvk/verkehr/verkehrsplanung/radverkehr/weitere-radinfrastruktur/zaehlstellen-und-fahrradbarometer/karte/ (accessed on 25 June 2021).

Acknowledgments

The authors would also like to thank the Berlin Police and BikeCitizens for commissioning datasets, the Singapore’s National Research Foundation of the Prime Minister’s Office, under its CREATE program and SMART Mobility, and to the MDPI assigned editor and three anonymous referees for their significant contributions in reviewing previous versions of this paper.

Conflicts of Interest

The authors declare no conflict of interest.

References

  1. Hong, J.; McArthur, D.; Raturi, V. Did Safe Cycling Infrastructure Still Matter During a COVID-19 Lockdown? Sustainability 2020, 12, 8672. [Google Scholar] [CrossRef]
  2. World Health Organization. Supporting Healthy Urban Transport and Mobility in the Context of COVID-19; World Health Organization: Geneva, Switzerland, 2020. Available online: https://www.who.int/publications/i/item/9789240012554 (accessed on 25 June 2021).
  3. Abdullah, Z. Singapore’s E-Bike Numbers Double over the Past Year Amid Demand from Food Delivery Riders. Channel New Asia. 25 June 2021. Available online: https://www.channelnewsasia.com/news/singapore/e-bike-numbers-double-singapore-demand-food-delivery-riders-15067674 (accessed on 25 June 2021).
  4. Buehler, R.; Pucher, J. COVID-19 Impacts on Cycling, 2019–2020. Transp. Rev. 2021, 41, 393–400. [Google Scholar] [CrossRef]
  5. Oltermann, P. Berlin Reports Rise in Fatalities as New Bike Lanes Fail to Keep Cyclists Safe. The Guardian. 24 August 2020. Available online: https://amp-theguardian-com.cdn.ampproject.org/v/s/amp.theguardian.com/world/2020/aug/24/berlin-reports-rise-in-fatalities-as-new-bike-lanes-fail-to-keep-cyclists-safe?amp_js_v=a3&amp_gsa=1&usqp=mq331AQFKAGwASA%3D#referrer=https%3A%2F%2Fwww.google.com&amp (accessed on 25 June 2021).
  6. Schröter, B.; Hantschel, S.; Koszowski, C.; Buehler, R.; Schepers, P.; Weber, J.; Wittwer, R.; Gerike, R. Guidance and Practice in Planning Cycling Facilities in Europe—An Overview. Sustainability 2021, 13, 9560. [Google Scholar] [CrossRef]
  7. Rietveld, P.; Daniel, V. Determinants of bicycle use: Do municipal policies matter? Transp. Res. Part A Policy Pract. 2004, 38, 531–550. [Google Scholar] [CrossRef]
  8. Buehler, R.; Pucher, J. Cycling for Sustainable Cities; MIT Press: Cambridge, MA, USA, 2021. [Google Scholar]
  9. Wijnen, W.; Schroten, A.; Hoen, M. The Cost of Road Crashes in the Nederlands: An Assessment of Scenarios for Making; CE Delft: Delft, The Netherlands, 2016. Available online: https://trimis.ec.europa.eu/sites/default/files/project/documents/thecostofroadtrafficaccidentsinthenetherlands.pdf (accessed on 2 November 2021).
  10. Medeiros, R.M.; Duarte, F. Policy to promote bicycle use or bicycle to promote politicians? Bicycles in the imagery of urban mobility in Brazil. Urban Plan. Transp. Res. 2013, 1, 28–39. [Google Scholar] [CrossRef]
  11. Pucher, J.; Dill, J.; Handy, S. Infrastructure, programs, and policies to increase bicycling: An international review. Prev. Med. 2010, 50, S106–S125. [Google Scholar] [CrossRef]
  12. Hughes, T.P. The evolution of large technological systems. In The Social Construction of Technological Systems: New Directions in the Sociology and History of Technology; MIT Press: Cambridge, MA, USA, 1987. [Google Scholar]
  13. Bijker, W.E. Of Bicycles, Bakelites, and Bulbs: Toward a Theory of Sociotechnical Change; MIT Press: Cambridge, MA, USA, 1997. [Google Scholar]
  14. World Health Organization. Global Status Report on Road Safety 2015; WHO: Geneva, Switzerland, 2015. [Google Scholar]
  15. Buehler, R.; Dill, J. Bikeway Networks: A Review of Effects on Cycling. Transp. Rev. 2016, 36, 9–27. [Google Scholar] [CrossRef]
  16. Ebert, A.-K. Radelnde Nationen: Die Geschichte des Fahrrads in Deutschland und den Niederlanden bis 1940; Campus Verlag: Frankfurt, Germany, 2010. [Google Scholar]
  17. Briese, V. Radwege-Fluchtraeume oder Hindernisparcours. Z. Verk. 2011, 61. [Google Scholar]
  18. Medeiros, R.M. Obduracy and Change in Urban Mobility Sociotechnical Ensembles Involving Information and Communication Technologies. Ph.D. Thesis, Technische Universität Berlin, Berlin, Germany, 2018. [Google Scholar]
  19. Berlin Senate. Berlin Senatsverwaltung für Umwelt, Verkehr und Klimaschutz. Tabellenbericht zum Forschungsprojekt Mobilität in Städten—SrV 2018 in Berlin. 31 January 2020. Available online: https://www.berlin.de/sen/uvk/_assets/verkehr/verkehrsdaten/zahlen-und-fakten/mobilitaet-in-staedten-srv-2018/berlin_tabellen_berlin_gesamt.pdf (accessed on 25 June 2021).
  20. Berlin Senate. Senatsverwaltung für Stadtentwicklung und Umwelt: Tabellenbericht zum Forschungsprojekt Mobilität in Städten—SrV 2013 in Berlin. 2014. Available online: https://www.berlin.de/sen/uvk/_assets/verkehr/verkehrsdaten/zahlen-und-fakten/mobilitaet-in-staedten-srv-2013/srv_2013_berlin_tabellen.pdf (accessed on 10 May 2017).
  21. Abduljabbar, R.; Dia, H.; Tsai, P.-W.; Liyanage, S. Short-Term Traffic Forecasting: An LSTM Network for Spatial-Temporal Speed Prediction. Futur. Transp. 2021, 1, 21–37. [Google Scholar] [CrossRef]
  22. Behrendt, F. Cycling the Smart and Sustainable City: Analyzing EC Policy Documents on Internet of Things, Mobility and Transport, and Smart Cities. Sustainability 2019, 11, 763. [Google Scholar] [CrossRef] [Green Version]
  23. Statista. Mobile Cellular Subscriptions per 100 Inhabitants in Germany from 2000 to 2019. 2021. Available online: https://www.statista.com/statistics/640154/mobile-cellular-subscriptions-per-100-inhabitant-germany/ (accessed on 24 June 2021).
  24. Statista. Number of Smartphone Users in Germany from January 2009 to 2020. 2020. Available online: https://www.statista.com/statistics/461801/number-of-smartphone-users-in-germany/ (accessed on 24 June 2021).
  25. Heinickel, G.; Dienel, H.-L. Mobilitäts-und Verkehrsforschung: Neuere empirische Methoden im Vergleich; Technische Universität Berlin: Berlin, Germany, 2021. [Google Scholar]
  26. Calabrese, F.; Diao, M.; Di Lorenzo, G.; Ferreira, J.; Ratti, C. Understanding individual mobility patterns from urban sensing data: A mobile phone trace example. Transp. Res. Part C Emerg. Technol. 2013, 26, 301–313. [Google Scholar] [CrossRef]
  27. Thomopoulos, N.; Givoni, M. ICT for Transport: Opportunities and Threats; Edward Elgar Publishing: Cheltenham, UK, 2015. [Google Scholar]
  28. Mostofi, H. The Association between ICT-Based Mobility Services and Sustainable Mobility Behaviors of New Yorkers. Energies 2021, 14, 3064. [Google Scholar] [CrossRef]
  29. Duarte, F.; Ratti, C. What Urban Cameras Reveal About the City: The Work of the Senseable City Lab. In The Urban Book Series; Springer: Dordrecht, The Netherlands, 2021; pp. 491–502. [Google Scholar]
  30. Tang, S.; Saito, K.; Obana, S. Transmission control for reliable pedestrian-to-vehicle communication by using context of pedestrians. In Proceedings of the 2015 IEEE International Conference on Vehicular Electronics and Safety (ICVES), Yokohama, Japan, 5–7 November 2015. [Google Scholar] [CrossRef]
  31. Medeiros, R.M.; Duarte, F.; Achmad, F.; Jalali, A. Merging ICT and informal transport in Jakarta’s ojek system. Transp. Plan. Technol. 2018, 41, 336–352. [Google Scholar] [CrossRef]
  32. Duarte, F.; Álvarez, R. The data politics of the urban age. Palgrave Commun. 2019, 5, 54. [Google Scholar] [CrossRef] [Green Version]
  33. Zegras, P.C.; Eros, E.; Butts, K.; Resor, E.; Kennedy, S.; Ching, A.; Mamun, M. Tracing a path to knowledge? Indicative user impacts of introducing a public transport map in Dhaka, Bangladesh. Camb. J. Reg. Econ. Soc. 2015, 8, 113–129. [Google Scholar] [CrossRef]
  34. Bojic, I.; Kondor, D.; Tu, W.; Mai, K.; Santi, P.; Ratti, C. Identifying the Potential for Partial Integration of Private and Public Transportation. Sustainability 2021, 13, 3424. [Google Scholar] [CrossRef]
  35. World Health Organization. World Report on Road Traffic Injury Prevention; WHO: Geneva, Switzerland, 2004. [Google Scholar]
  36. Reynolds, C.C.; Harris, M.A.; Teschke, K.; Cripton, P.A.; Winters, M. The impact of transportation infrastructure on bicycling injuries and crashes: A review of the literature. Environ. Health 2009, 8, 47. [Google Scholar] [CrossRef] [Green Version]
  37. Thomas, B.; DeRobertis, M. The safety of urban cycle tracks: A review of the literature. Accid. Anal. Prev. 2013, 52, 219–227. [Google Scholar] [CrossRef]
  38. A Mulvaney, C.; Smith, S.; Watson, M.C.; Parkin, J.; Coupland, C.; Miller, P.; Kendrick, D.; McClintock, H. Cycling infrastructure for reducing cycling injuries in cyclists. Cochrane Database Syst. Rev. 2015, CD010415. [Google Scholar] [CrossRef] [Green Version]
  39. DiGioia, J.; Watkins, K.E.; Xu, Y.; Rodgers, M.; Guensler, R. Safety impacts of bicycle infrastructure: A critical review. J. Saf. Res. 2017, 61, 105–119. [Google Scholar] [CrossRef]
  40. Useche, S.; Montoro, L.; Alonso, F.; Oviedo-Trespalacios, O. Infrastructural and Human Factors Affecting Safety Outcomes of Cyclists. Sustainability 2018, 10, 299. [Google Scholar] [CrossRef] [Green Version]
  41. Kary, M. Unsuitability of the epidemiological approach to bicycle transportation injuries and traffic engineering problems. Inj. Prev. 2015, 21, 73–76. [Google Scholar] [CrossRef] [PubMed]
  42. Anker, J. Täglich Steigen bis zu 500.000 Berliner auf das Fahrrad. Berliner Morgenpost. Berliner Morgenpost. 18 June 2016. Available online: https://www.morgenpost.de/berlin/article207697943/Taeglich-steigen-bis-zu-500-000-Berliner-auf-das-Fahrrad.html (accessed on 29 June 2021).
  43. Berlin Senate. Datensatz Mobilität in Städten—SrV 2008, Stichprobe Berlin. In Senatsverwaltung für Stadtentwicklung und Umwelt, Abteilung Verkehr; TU Dresden: Dresden, Germany, 2008. [Google Scholar]
  44. De La Bruheze, A.; Veraart, F. Bicycle Traffic in Practice and Policy in the 20th Century. The Hague: Stichting Historie der Techniek, Hg. Ministerie van Verkeer en Waterstaat. 1999. Available online: https://nationaler-radverkehrsplan.de/sites/default/files/brr-112-1999-en.pdf (accessed on 25 June 2021).
  45. Jacobsen, P.L. Safety in numbers: More walkers and bicyclists, safer walking and bicycling. Inj. Prev. 2015, 21, 271–275. [Google Scholar] [CrossRef]
  46. Vandenbulcke, G.; Thomas, I.; de Geus, B.; Degraeuwe, B.; Torfs, R.; Meeusen, R.; Panis, L.I. Mapping bicycle use and the risk of accidents for commuters who cycle to work in Belgium. Transp. Policy 2009, 16, 77–87. [Google Scholar] [CrossRef]
  47. Wegman, F.; Zhang, F.; Dijkstra, A. How to make more cycling good for road safety? Accid. Anal. Prev. 2012, 44, 19–29. [Google Scholar] [CrossRef] [PubMed]
  48. Elvik, R. The non-linearity of risk and the promotion of environmentally sustainable transport. Accid. Anal. Prev. 2009, 41, 849–855. [Google Scholar] [CrossRef] [PubMed]
  49. Brög, W.; Erl, E. Can daily mobility be reduced or transferred to other modes? In Proceedings of the European Conference of Ministers of Transport (ECMT), Round Table, Paris, France, 13–14 June 1996; 1996. [Google Scholar]
  50. Berlin Police. Pressekonferenz zur Verkehrssicherheitslage 2017 in Berlin. 2018. Available online: https://www.berlin.de/polizei/_assets/aufgaben/anlagen-verkehrssicherheit/pk-verkehrssicherheitslage2017bln.pdf (accessed on 25 June 2021).
  51. Berlin Police. Polizei Pressekonferenz: Verkehrsopferbilanz 2002. 2003. Available online: https://www.berlin.de/polizei/_assets/aufgaben/anlagen-verkehrssicherheit/verkehrsopferbilanz2002.pdf (accessed on 25 June 2021).
  52. Berlin Police. Sonderuntersuchung Radfahrerverkehrsunfälle in Berlin 2016. 2017. Available online: https://www.berlin.de/polizei/_assets/aufgaben/anlagen-verkehrssicherheit/radfahrer2016.pdf (accessed on 25 June 2021).
  53. Buehler, R.; Pucher, J. Trends in Walking and Cycling Safety: Recent Evidence from High-Income Countries, With a Focus on the United States and Germany. Am. J. Public Health 2017, 107, 281–287. [Google Scholar] [CrossRef] [PubMed]
  54. Berlin Police. Verkehrssicherheitslage 2015 Berlin: Dahlen, Daten, Fakten. 2015. Available online: https://www.berlin.de/polizei/_assets/aufgaben/anlagen-verkehrssicherheit/verkehrssicherheitslage2015.pdf (accessed on 25 June 2021).
  55. Destatis Statistisches Bundesamt. Gesellschaft und Umwelt: Verkehrsunfälle. Destatis. 2021. Available online: https://www.destatis.de/DE/Themen/Gesellschaft-Umwelt/Verkehrsunfaelle/_inhalt.html (accessed on 25 June 2021).
  56. Knowles, J.; Adams, S.; Cuerden, R.; Savill, T.; Reid, S.; Tight, M. Collisions Involving Pedal Cyclists on Britain’s Roads: Establishing The Causes; TRL: Crowthorne, UK, 2009. [Google Scholar]
  57. Jensen, S.U. Safety effects of blue cycle crossings: A before-after study. Accid. Anal. Prev. 2008, 40, 742–750. [Google Scholar] [CrossRef] [PubMed]
  58. Brude, U. What roundabout design provides the highest possible safety? In Nordic Road and Transport Research; Swedish National Road and Transport Research Institute (VTI): Linköping, Sweden, 2000. [Google Scholar]
  59. Hels, T.; Orozova-Bekkevold, I. The effect of roundabout design features on cyclist accident rate. Accid. Anal. Prev. 2007, 39, 300–307. [Google Scholar] [CrossRef]
  60. Daniels, S.; Nuyts, E.; Wets, G. The effects of roundabouts on traffic safety for bicyclists: An observational study. Accid. Anal. Prev. 2008, 40, 518–526. [Google Scholar] [CrossRef] [Green Version]
  61. Germany. Straßenverkehrs-Ordnung (StVO). From Bundesrepublik Deutschland. 2013. Available online: https://www.gesetze-im-internet.de/stvo_2013/BJNR036710013.html (accessed on 25 June 2021).
  62. FGSV. Empfehlungen für Radverkehrsanlagen; Deutschen Instituts für Urbanistik: Köln, Germany, 2010. [Google Scholar]
  63. Sullivan, P. Bike-friendly city? The reality of cycling in Berlin. Tip Berlin. 13 July 2019. Available online: https://www-tip--berlin-de.cdn.ampproject.org/v/s/www.tip-berlin.de/bike-friendly-city-the-reality-of-cycling-in-berlin/amp/?amp_js_v=a3&amp_gsa=1#referrer=https%3A%2F%2Fwww.google.com&amp_tf=From%20%251%24s&ampshare=https%3A%2F%2Fwww.tip-berlin.de%2Ftip- (accessed on 2 November 2021).
  64. TomTom. TomTom Traffic Congestion Index: Berlin. 2021. Available online: https://www.tomtom.com/en_gb/traffic-index/berlin-traffic/ (accessed on 25 June 2021).
  65. Google. Google Community Mobility Reports: Berlin. 2021. Available online: https://www.google.com/covid19/mobility/ (accessed on 25 June 2021).
Figure 1. Spatial distribution of the bicycling bikeway network and bikeway types, as named in this study. GIS data source: Berlin Senate. Figure source: the authors.
Futuretransp 01 00037 g001
Figure 2. Spatial stamp of collisions between one bicycle and one motor vehicle in Berlin, 1 January 2011–31 December 2015. Data source: Berlin Police. Image source: the authors.
Futuretransp 01 00037 g002
Figure 3. Visualization of bicycle counters, bicycling traffic volumes, and routes in Berlin. Data sources: BikeCitizens and Berlin Senate.
Futuretransp 01 00037 g003
Figure 4. Temporal variation in bicycle traffic volumes measured by the digital bicycle counters in Berlin. Data source: Berlin Senate. Figure source: the authors.
Futuretransp 01 00037 g004
Figure 5. Histogram of trip distance. Data source: BikeCitizens. Image source: the authors.
Futuretransp 01 00037 g005
Figure 6. Histogram of trip time. Image source: the authors.
Futuretransp 01 00037 g006
Figure 7. (Left): heat map illustrating origins (O) of bicycling trips in Berlin. (Right): Heat map illustrating destinations (D) of bicycling trips in Berlin. Red indicates higher density, moving to lower density in green. Data source: BikeCitizens. Figure source: the authors.
Futuretransp 01 00037 g007
Figure 8. Temporal variation in bicycle traffic volumes and bicycle collisions. Variable values at peak are normalized in the y axis plot. Data sources: Berlin Police, Berlin Senate. Figure source: the authors.
Futuretransp 01 00037 g008
Figure 9. Hourly distribution of bicycling crashes with motorized vehicles in Berlin during Sommer and Winter months. Data source: Berlin Police. Figure source: the authors.
Futuretransp 01 00037 g009
Table 1. Dictionary of variables and summary of selected variables quantified in collisions between one bicycle and one motorized vehicle in Berlin (N = 25,668).
kmN1col./kmN2#%1#N2%2N5N6N7
PBP23950172146505836717163933119
SUBBP99628242.817832310414551401171
SUBBB866597.7334432513023208
DBL1916577.253571225138322
DBL216611977.2719847820347437
WB3509 115,3144.48768_6546_2010759453
N1: number of crashes on this bikeway type. N2#: number of crashes on this bikeway type and at intersections. %1#: percentage of total crashes at bikeway intersections, excluding WB. N2: number of crashes on this bikeway type, in road sections. %2: percentage of total crashes on bikeways, excluding WB. N5: number of fatalities per bikeway type. N6: number of severely injured bicyclists per bikeway type. N7: number of moderately injured bicyclists per bikeway type. 1 this value was calculated considering the 5087 km of public roads in Berlin (2006), minus the 1578 km of bikeways (PBP, SUBBP, SUBBB, DBL1 and DBL2) as of 2013.
Table 2. Density of collisions between one bicycle and one motorized vehicle at Berlin roundabouts. Data source: Berlin Police.
RoundaboutN CollisionsDiameter (m)Traffic Light
SUBBPGrosser Stern13154 myes
SUBBPErnst Reuter Platz16148 myes
DBL1Moritzplatz10854 mno
DBL1Kottbusser Tor3763 myes
Table 3. Spatial distribution of 65,895 bicycling trip origins and destinations, within a buffer of 100 m from bicycle road infrastructure types. Source of data: BikeCitizens and Berlin Senate.
Bicycle Road TypeNtrip(O)Bicycle Road TypeNtrip(D)
DBL13085DBL13229
DBL27704DBL27850
PBP3996PBP4129
SUBBB2968SUBBB3096
SUBBP14,842SUBBP14,996
Total trips originating within 100 m of bicycling road network32,595Total trip destination within 100 m of bicycling road network33,300
Table 4. Comparison of bicycle mode share in district groups and percentage of total bicycle collisions with a motorized vehicle, by bicycle road type in Berlin (N = 4760).
%1%2%3%4%5%6
FH + KB21161432324
PB + WS + PK17101032013
MI + TG + WD142014253028
%1: bicycle mode share (Berlin Senate, 2008), within inhabitants of the district group (DG). %2: percentage of total bicycle collisions with one motorized vehicle on PBP-type bicycle roads, within DG. %3: percentage of total bicycle collisions with one motorized vehicle on SUBBP-type bicycle roads, within DG. %4: percentage of total bicycle collisions with one motorized vehicle on SUBBB-type bicycle roads, within DG. %5: percentage of total bicycle collisions with one motorized vehicle located on DBL1-type bicycle roads, within DG. %6: percentage of total bicycle collisions with one motorized vehicle located on DBL2-type bicycle roads, within DG.
Table 5. Variable dictionary and summary of selected variables quantified in bicycle collisions with a motorized vehicle occurring on bicycle road types, within district groups (N = 4760). Data source: Berlin Senate and Berlin Police; SRV Berlin 2008 and 2013. Table source: the authors.
km1km2km3N1N1#N2N2#N3N3#col/km1col/km2col/km3
PBP8.213.617.33477828471549551013859
SUBBP36.79065.28920499192107288836
SUBBB2.23.815.41561076110611411
DBL110.91322.420131231052517414109
DBL223.824.526130157649212221312713
WB78.7 1416.5 2175.8 3 652 783 1071
km1: length of the bikeway type in districts FH and KB. km2: length of the bikeway type in districts PB, WS, and PK. km3: length of the bikeway type in districts MI, TG, and WD. N1: number of bicycle collisions with motorized vehicles within bikeway type, on road sections in districts FH and KB. N1#: bicycle collisions with motorized vehicles within bikeway type, at road intersections. N2: bicycle collisions with motorized vehicles within bikeway type, on road sections in districts PB, WS, and PK. N2#: number of bicycle collisions with motorized vehicles within bikeway type, at road intersections in districts PB, WS, and PK. N3: number of bicycle collisions with motorized vehicles within bikeway type, on road sections in districts MI, TG, and WD. N3#: number of bicycle collisions with motorized vehicles within bikeway type, at road intersections in districts MI, TG, and WD. col./km1: bicycle collision with motorized vehicle frequency rate [(N1 + N1#)/m1] for bikeway type in districts FH and KB. col./km2: bicycle collision with motorized vehicle frequency rate [(N2 + N2#)/m2] for bikeway type in districts PB, WS, and PK. col./km3: bicycle collision with motorized vehicle frequency rate [(N3 + N3#)/m3] for bikeway type in districts MI, TG, and WD. 1 This value considered the 160 km of public roads in FH and KB (Senate, 2006), discounting the length of bicycle road infrastructure types (PBP, SUBBP, SUBBB, DBL1, and DBL2) in the district group. 2 This value considered the 561.4 km of public roads in PB, WS, and PK (Senate, 2006), discounting the length of bicycle road infrastructure types (PBP, SUBBP, SUBBB, DBL1 and DBL2) in the district group. 3 This value considered the 322.1 km of public roads in MI, TG, and WD (Senate, 2006), discounting the length of bicycle road infrastructure types (PBP, SUBBP, SUBBB, DBL1 and DBL2) in the district group.
Table 6. Multivariate regression outputs with 23 observations, using the number of crashes on the roads without bikeways (WB) within spatial units as the dependent variable (Y) and the inhabitant density and estimated number of bicycling trips as independent variables (X1 and X2). Data source: Berlin Senate and Berlin Police. Table source: the authors.
Multiple R0.67 Coefficientsp-value
R Square0.45Intercept447.800.14
Adjusted R0.39Inhab./km20.070.09
Standard Error586.33N Bicycle trip0.010.06
Observations23 Anova Significance F0.002
Publisher’s Note: MDPI stays neutral with regard to jurisdictional claims in published maps and institutional affiliations.

