1. Introduction
Sarcoma cancers including chondrosarcomas (CS), the most common form of bone cancer, can be extremely aggressive with high mortality rates. Therapeutic options for CS have not advanced in the last few decades, where resistance to chemo- and radiation therapy remains, with surgery being the treatment regimen of choice for primary tumors. CS have been shown to harbor genetic mutations in either isocitrate-dehydrogenase 1 (IDH1) or 2 (IDH2) [
1]. When present, mutant IDH1 and IDH2 confer a cellular gain-of-function by converting alpha-ketoglutarate (αKG) produced by wild-type IDHs, to D-2-hydroxyglutarate (D2HG), a potent oncometabolite. The conversion of αKG to D2HG by mutant IDH1 occurs in the cytosol, whereas conversion by mutant IDH2 occurs in the mitochondria as part of the Krebs Cycle [
2]. Mitochondria are key players in cancer progression, specifically their through involvement in oncogenicity, immune evasion, and resistance to therapies (e.g., chemo- and radiation therapy) [
3,
4]. A mitochondrial transfer, once considered a rare or compensatory mechanism, has emerged as a prominent phenomenon in both physiological and pathological contexts. Mechanistic studies have identified TNTs as one vehicle through which mitochondria can move between cells and influence recipient cell behavior [
5,
6]. TNTs are F-actin-rich cytoplasmic connections that enable the direct trafficking of organelles over considerable distances, with their formation encouraged by stressors such as hypoxia or chemotherapy. In cancer cells, increased levels of Miro1, a mitochondrial Rho-GTPase, along with actin remodeling proteins, aid in TNT formation and the movement of mitochondria [
5,
7,
8]. Mouse bone marrow stromal cells can convey mitochondria to T cells, boosting their metabolic functions and anti-tumor activities [
9], suggesting that a mitochondrial transfer influences not only cancer progression, but also immune responses. In both solid tumors and hematologic malignancies, mitochondria that passed from endothelial or stromal cells may shield cancer cells against oxidative stress and enhance therapy resistance [
10].
The impact of this phenomenon in cancer, where transferred mitochondria can modulate the energy metabolism, redox status, and immune responses in the tumor microenvironment [
11,
12], is particularly salient in cancers with IDH2 mutations where D2HG-producing mitochondria transferred to normal recipient cells may expose recipient cells to epigenetic and metabolic dysregulation [
13,
14]. However, direct experimental evidence linking the mitochondrial transfer to D2HG-mediated reprogramming in recipient immune cells remains limited. Although most studies on IDH mutations have focused on cell-autonomous effects, emerging work suggests that IDH2-mutant mitochondria may be capable of transmitting these epigenetic and metabolic aberrations to neighboring cells via a mitochondrial transfer. This hypothesis is informed by the convergence of data on D2HG’s ability to inhibit α-KG-dependent dioxygenases and the demonstrated capacity of mitochondria to retain and shuttle such metabolites into recipient cells [
15,
16]. Tumor cells with IDH mutations export intracellularly accumulated D2HG into the microenvironment and confer growth advantages to tumor cells through suppressing the anti-tumor activity of immune cells. Recently, the solute carrier family (SLC22) has been shown to be present in the mitochondrial membrane and transport D2HG across the cell membrane. SLCs are present in both the cell and plasma membranes of organelles (Genecards.org) and may play a role in the mitochondrial transport of D2HG out of mitochondria [
17,
18].
Despite these advancements, gaps remain in our understanding of how transferred mitochondria can reprogram recipient cells. This is especially true in the context of immune cell interactions, where relatively few studies have dissected how the mitochondrial uptake alters the cellular immunity or tolerance [
19]. Standardized models, including those utilizing cancer cell lines such as IDH2-mutant chondrosarcoma cells (SW1353) and primary stromal cells, are necessary to elucidate these mechanisms under conditions that mimic the tumor microenvironment. Moreover, the lack of robust quantification methods and the challenge of distinguishing true transfer events from dye artifacts continue to complicate the interpretation across studies, underscoring the need for carefully controlled in vitro systems to examine the mitochondrial exchange accompanied by metabolic changes.
This research framework provides a compelling rationale for the investigation of a mutant mitochondrial transfer and its broader cellular effects. The integration of metabolic, epigenetic, and immunological perspectives offers a more holistic understanding of tumor progression and intercellular crosstalk. The continued exploration of these processes, especially through co-culture models and high-resolution flow cytometry, holds promise for uncovering novel mechanisms of the tumor–host interaction and informing future mechanistic and therapeutic studies.
2. Methods
2.1. Approvals and Biosafety Compliance
All experimental work was conducted in ODU BSL-2 facilities in accordance with institutional policies and applicable regulations. The ODU Biosafety Committee approved all work on this project (IBC protocol #24-015). No human subjects or primary patient materials were involved beyond established cell lines; standard chemical and biological waste procedures were followed.
2.2. Cell Culture
Five human-derived cell types were used: SW1353 (IDH2 mutant) (ATCC, Manassas, VA, USA) and JJ012 (wild-type IDH2/mutant IDH1 kindly provided by Dr. Block, Rush Medical Center, Chicago, IL, USA) chondrosarcoma cells, primary fibroblasts (ATCC) and primary chondrocytes (PromoCell, Heidelberg, Germany), and a normal lymphoblastoid B-cell line (N-LCLs) (Coriell Institute for Medical Research, Camden, NJ, USA). Chondrosarcoma, chondrocyte, and fibroblast cells were cultured in DMEM/F12 medium supplemented with 10% fetal bovine serum (FBS), 2 mM L-glutamine (Invitrogen, Waltham, MA, USA), 50 IU/mL penicillin (Invitrogen), and 50 µg/mL streptomycin (Invitrogen). N-LCL cells were cultured in RPMI-1640 medium with the same supplement concentrations and incubated at 37 °C in a humidified atmosphere containing 5% CO2 in air.
Cocultures were established in 8-chambered incubation chambers with glass bottoms (0.15 mm thickness), which were selected to enhance optical clarity and resolution during microscopy. For SW1353:N-LCL cocultures, SW1353 cells (30,000–35,000 cells) were seeded into the chambers and allowed to attach overnight before the addition of an equal number of N-LCLs directly on top of the adherent SW1353 monolayer. Cocultures were incubated for 12–24 h before imaging, ensuring sufficient time for TNT formation and potential mitochondrial transfer, while avoiding overgrowth or degradation of the dye signal.
2.3. Mitochondrial Staining
Experiments used MitoBright Green (Dojindo Molecular Technologies, Inc., Rockville, MD, USA) to label SW1353 mitochondria and BioTracker Red (Sigma-Aldrich, Burlington, MA, USA) to label N-LCL mitochondria. Both dyes were mitochondrial-specific and demonstrated stable fluorescence retention for up to 6–7 days post-staining under standard culture conditions. Working dilutions were empirically optimized to balance signal intensity and background fluorescence and ranged from 1:200 to 1:500 for MitoBright Green and from 1:200 to 1:2500 for BioTracker Red, depending on whether the experiment was designed for microscopy or flow cytometry. Staining was carried out by incubating cells in complete medium containing the appropriate dye for 30 min at 37 °C, followed by two washes with pre-warmed medium. All mitochondrial staining procedures were performed on sub-confluent cultures to preserve healthy mitochondrial morphology, and paired coculture conditions were always stained in parallel to minimize variability between samples. SW1353 cells were consistently labeled with the green mitochondrial dye and N-LCL cells were labeled with the red mitochondrial dye.
2.4. Nuclear Staining
Following mitochondrial staining, cells were counterstained with Hoechst 33342 (Thermo Fisher Scientific, Waltham, MA, USA) at 1 µg/mL in complete medium for 10 min at 37 °C. Cells were then washed twice in pre-warmed medium before imaging. Nuclear staining was used to confirm cell counts, visualize nuclei for coculture identification, and assess cell health.
2.5. Microscopy and Image Acquisition
Imaging was performed on the Leica TCS SP8 using filter sets for Hoechst (nuclei), green mitochondrial dyes (MitoBright Green), and red mitochondrial dyes (BioTracker Red). Phase contrast or DIC images were acquired alongside fluorescence channels to visualize TNT morphology. Images were collected from multiple random fields per chamber well and adjusted for brightness/contrast in Leica LasX software (v5.3.0, Leica Microsystems, Wetzlar, Germany) without altering relative fluorescence intensities between samples.
2.6. Mitochondrial Metabolism
Mitochondrial oxygen consumption rate (OCR) and extracellular acidification rate (ECAR) were assessed using the Seahorse XFp Analyzer (Agilent Technologies, Santa Clara, CA, USA) using XFp 8-well miniplates following the manufacturer’s guidelines. Briefly, the XFp sensor cartridge was hydrated overnight (≥12 h) at 37 °C in a non-CO2 incubator using Seahorse Calibrant. On the day of the assay, cells were seeded into XFp miniplates at densities pre-optimized for monolayer uniformity and signal linearity (SW1353 ~15,000 cells/well). Due to the difference in size of N-LCLs compared to SW1353, the ideal seeding concentration for N-LCLs was determined to be ~100,000 cells/well.
2.7. Data Processing and Normalization
Data were processed in Agilent Wave Pro software (v10.1.0), applying background correction and default instrument algorithms. To account for well-to-well variation, values were normalized to cell number (post-run nuclei stain, e.g., Hoechst/DAPI + imaging count), keeping the normalization method constant within an experiment. In SW1353 wells, ~600 cells were counted and normalized to pmol/103 cells. In N-LCL wells, ~5000 cells were counted and normalized to pmol/103 cells. From OCR traces we derived basal respiration, ATP-linked respiration (pre- vs. post-oligomycin), proton leak, maximal respiration (FCCP), and spare respiratory capacity; from ECAR we tracked basal acidification and stress-induced changes as a proxy for glycolytic flux.
2.8. Flow Cytometry
All cocultures and separate controls were incubated for approximately 12–16 h before analysis. Cells were harvested the following morning, resuspended in phosphate-buffered saline (PBS) containing 2% fetal bovine serum (FBS), and analyzed using the MACSQuant® Analyzer (Miltenyi Biotec, Bergisch Gladbach, Germany). Green fluorescence was detected on the FITC channel (525/50 nm) and red fluorescence was detected on the B4 channel (576/26 nm), corresponding to the emission spectra of MitoTracker Green (Thermo Fisher Scientific) and Mitotracker Red FM (Thermo Fisher Scientific), respectively. Data were exported and analyzed using FlowJo™ software (v10.9, BD Biosciences, Ashalnd, OR, USA).
2.9. Optimization and Final Protocol (BD FACSAria)
Subsequent flow cytometry experiments were conducted using the BD FACSAria™ III cell sorter (BD Biosciences) to analyze mitochondrial transfer with improved dye stability and multi-day coculture compatibility. These experiments employed MitoBright Green (Dojindo) to label SW1353 chondrosarcoma cell mitochondria and BioTracker Red (Sigma) to label N-LCL B lymphocyte mitochondria, as described in Section 2.X (fluorescent labeling of mitochondria and live-cell imaging). The choice of these dyes was based on their demonstrated ability to retain fluorescence for 6–7 days independent of acute changes in mitochondrial membrane potential, in contrast to the 24 h signal stability of the MitoTracker dyes used in the initial MACSQuant runs. Cocultures and controls were prepared in suspension at a total of 1 × 10⁶ cells per tube in PBS. Coculture samples contained equal proportions of each cell type (5 × 10⁵ SW1353 cells and 5 × 10⁵ N-LCLs). Concentrations for each cell type were as follows: N-LCL at 1:200 Biotracker Red and SW1353 at 1:2500 MitoBright Green. Flow cytometry was performed in analysis mode, with green fluorescence detected in the FITC channel (excitation: 488 nm, emission: 530/30 nm) and red fluorescence detected in the PE-Cy5 channel. Data acquisition was carried out using BD FACSDiva™ software (v9.2), and results were analyzed in FlowJo™ (v10.9). To control for potential dye leakage or nonspecific dye redistribution, conditioned-media experiments were performed for both MitoTracker-based labeling (used in initial MACSQuant analyses) and MitoBright Green/BioTracker Red labeling (used in FACSAria analyses). Media from mitochondrially labeled monocultures were collected, cleared of cells, and applied to unlabeled recipient monocultures for 17 h, matching coculture conditions. Under these conditions, no appreciable dual-positive population was detected by flow cytometry, indicating that dual-positive events observed in coculture require cell–cell contact and are not attributable to passive dye transfer.
2.10. Directionality Estimation by FSC/SSC Template Gating with Quadrant Readout
To infer the direction of mitochondrial transfer without antibody-based cell identification, we used a two-stage gating workflow in FlowJo with fixed PMT voltages, and a single compensation matrix applied to all tubes. Debris was excluded on FSC-A vs. SSC-A, followed by singlet discrimination on FSC-A vs. FSC-H (and SSC-A vs. SSC-H as needed). All downstream analyses were performed within the singlet gate.
On FSC-A (Y) vs. SSC-A (X) plots of the unstained coculture, two conservative polygon templates were defined to capture the two size/granularity ridges while leaving a low-density gap between them: LCL template (low-FSC, low–mid-SSC) and SW1353 template (high-FSC, high-SSC). Template boundaries were finalized on the unstained coculture and then applied unchanged to all tubes in the experiment.
2.11. Cytochalasin B Treatment and Flow Cytometric Analysis of Cocultures
Cytochalasin B dissolved in DMSO was used at a final working concentration of ~10 µg/mL (20.8 µM) at ~0.10% v/v DMSO. Vehicle controls received 0.10% DMSO without drug.
Following staining, SW1353 and N-LCL cells were combined at a 1:1 ratio to establish cocultures. At coculture initiation, either cytochalasin B (as above) or an equivalent volume of its vehicle control (e.g., DMSO) was added and cultures were incubated for six hours in standard conditions. As cytochalasin B’s effects are transient in these cultures, incubation was limited to 6 h; overnight exposures were avoided. Cells were then gently collected (adherent cells with minimal enzymatic dissociation; suspension cells by centrifugation), washed, and resuspended in PBS for analysis. In parallel with flow analysis, replicate cocultures were imaged by confocal microscopy on a Leica system controlled with LAS X software (v5.3.0) to assess TNT formation and the presence of cross-cell mitochondrial signal under vehicle versus cytochalasin B conditions. SW1353 mitochondria (green) and N-LCL mitochondria (red) were acquired as single optical sections per field at the focal plane of the maximal cell–cell contact, with laser power, detector gain, pinhole, and exposure held constant across all groups. Single-stain controls were used to set channel exposure and to evaluate spectral bleed-through; where applicable, channels were captured sequentially. TNTs were operationally defined as thin, continuous protrusions connecting two distinct cells.
2.12. Statistical Analysis
Statistical significance was determined by Welch’s unpaired t-test using GraphPad software (v10.2.0, San Diego, CA, USA). p < 0.05 reflects significance.
3. Results
3.1. Metabolic Analysis Distinguishes Respiratory and Glycolytic Phenotypes
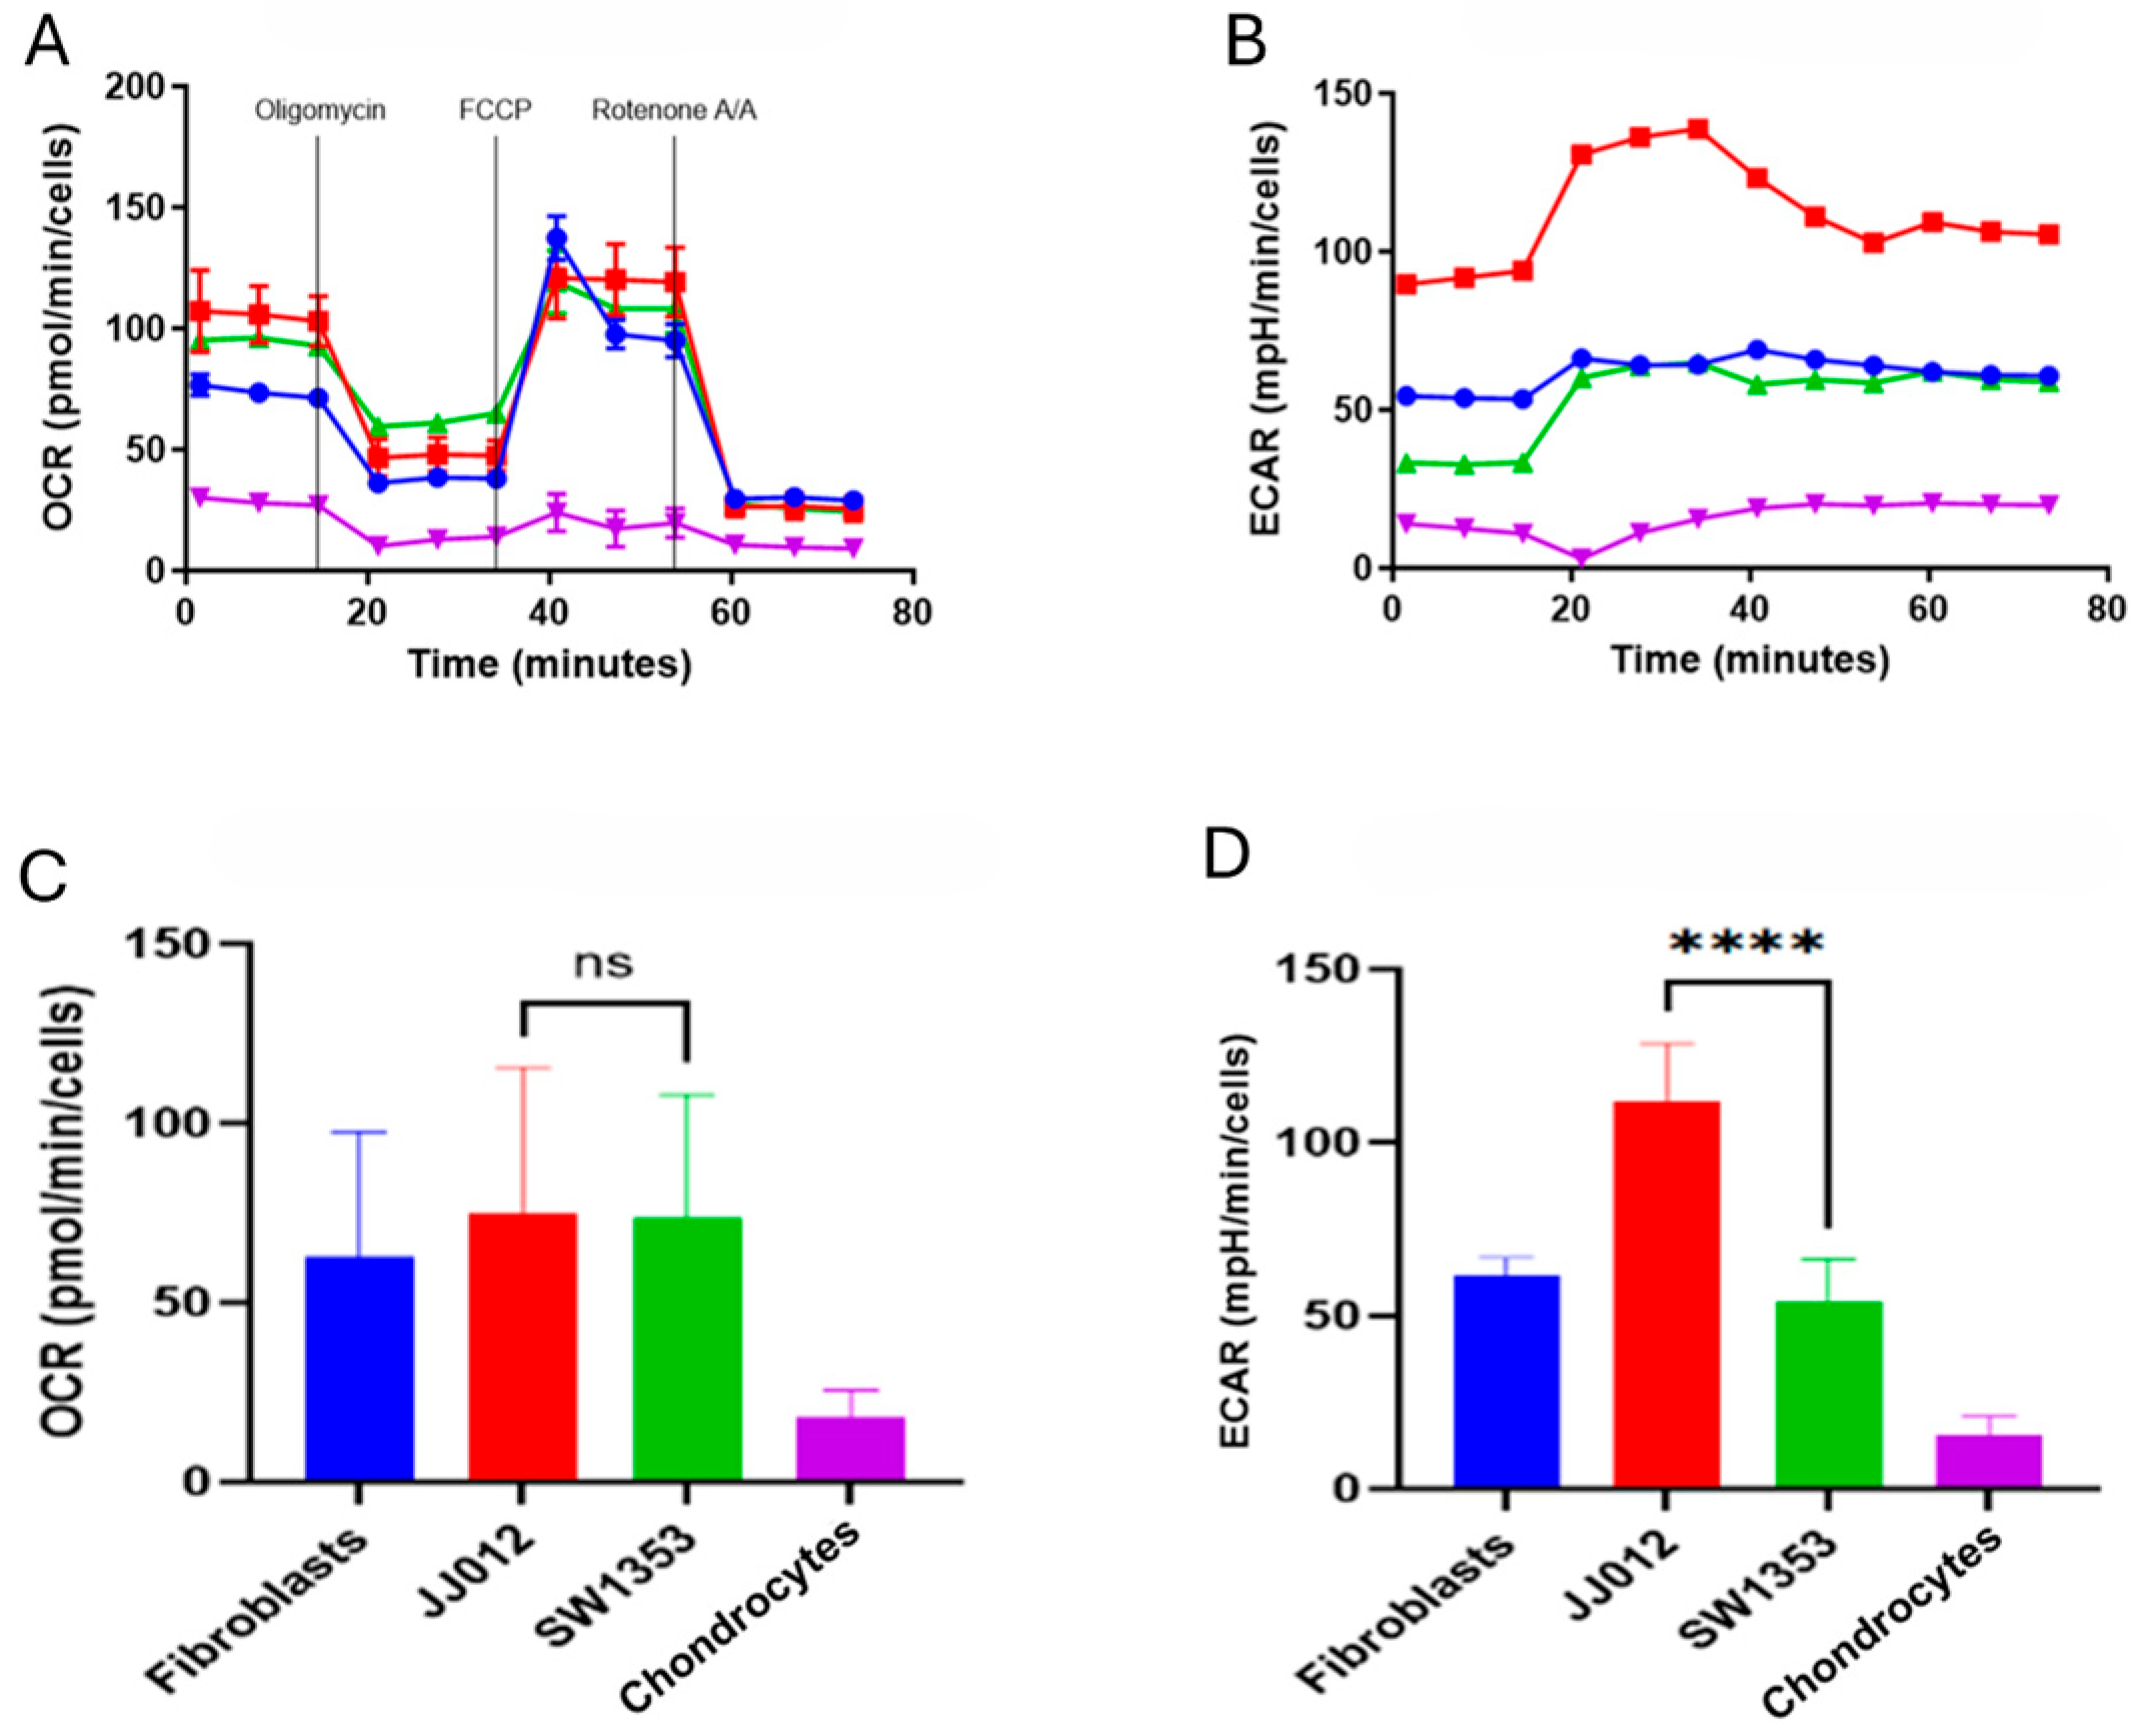
Initially, we set out to determine the metabolic profile of the IDH2-mutant chondrosarcoma line SW1353 compared to an IDH2 wild-type chondrosarcoma line (JJ012, IDH1 mutant) and two normal human primary cell types, fibroblasts and chondrocytes. Primary cells were chosen as potential cell types a chondrosarcoma could interact with in its tumor microenvironment. Across lines, the XFp Cell Mito Stress Test produced the expected response profile: the OCR fell after oligomycin, rose with FCCP to reveal maximal respiration, and dropped to near baseline after rotenone/antimycin A. At the optimized seeding density (~15,000 cells/well) and with values normalized to per-well cell counts, the basal and FCCP-stimulated OCR were broadly comparable among fibroblasts, JJ012, and SW1353, with chondrocyte wells remaining low (
Figure 1). The chondrocyte profile is consistent with their quiescent, low-demand phenotype in the 2D culture: primary chondrocytes have fewer mitochondria, a lower ATP turnover, and are adapted to the low-oxygen, avascular cartilage niche, so per-cell oxidative and glycolytic fluxes are modest compared with proliferative fibroblasts and glycolysis-biased tumor lines. With matched seeding and cell-count normalization, the low rates are likely to reflect true per-cell metabolism rather than differences in cell numbers. Summary bars recapitulated this pattern, showing overlapping means and variability for the OCR across cell types within this preliminary dataset (
Figure 1).
In contrast, the ECAR differed markedly by line. JJ012 exhibited a higher basal ECAR and sustained acidification throughout the assay window relative to SW1353 and fibroblasts, consistent with a more glycolytic phenotype under these conditions. The chondrocyte values were low under all conditions, reflecting the low metabolic rate of these cartilage-producing cells. This pattern was evident in the time-course traces and reflected in the ECAR summary bars. All assays were processed with identical instrument settings and normalized to the cell number; no additional transformations were applied. (Data are expressed as mean ± standard deviation; ns denotes none-significance).
Although primary chondrocytes and fibroblasts are cells a chondrosarcoma may encounter, the presence of immune cells in the tumor microenvironment and the loss of the immunosuppressive function is crucial, particularly with respect to the resistance to chemo- and radiotherapy exhibited by chondrosarcoma. Our interest became focused on the potential immunomodulatory response an IDH2-mutant mitochondrial transfer may have and utilized normal B-cell lymphoblastoid cell lines (N-LCL) as they offer a good model for studying immune cell interactions. LCLs are human B-lineage cells with a robust mitochondrial content and well-characterized immune signaling, giving a controlled, reproducible “immune-adjacent” partner to model tumor–immune crosstalk without the variability of primary cells. Since a bidirectional mitochondrial exchange between cancer and immune cells has been implicated in blunting anti-tumor immunity, an LCL provides a tractable system to define the directionality, triggers, and consequences of a transfer (e.g., antigen presentation or cytokine responses).
3.2. Confocal Microscopy Reveals Bidirectional Mitochondrial Transfer Between SW1353 and N-LCL Cells
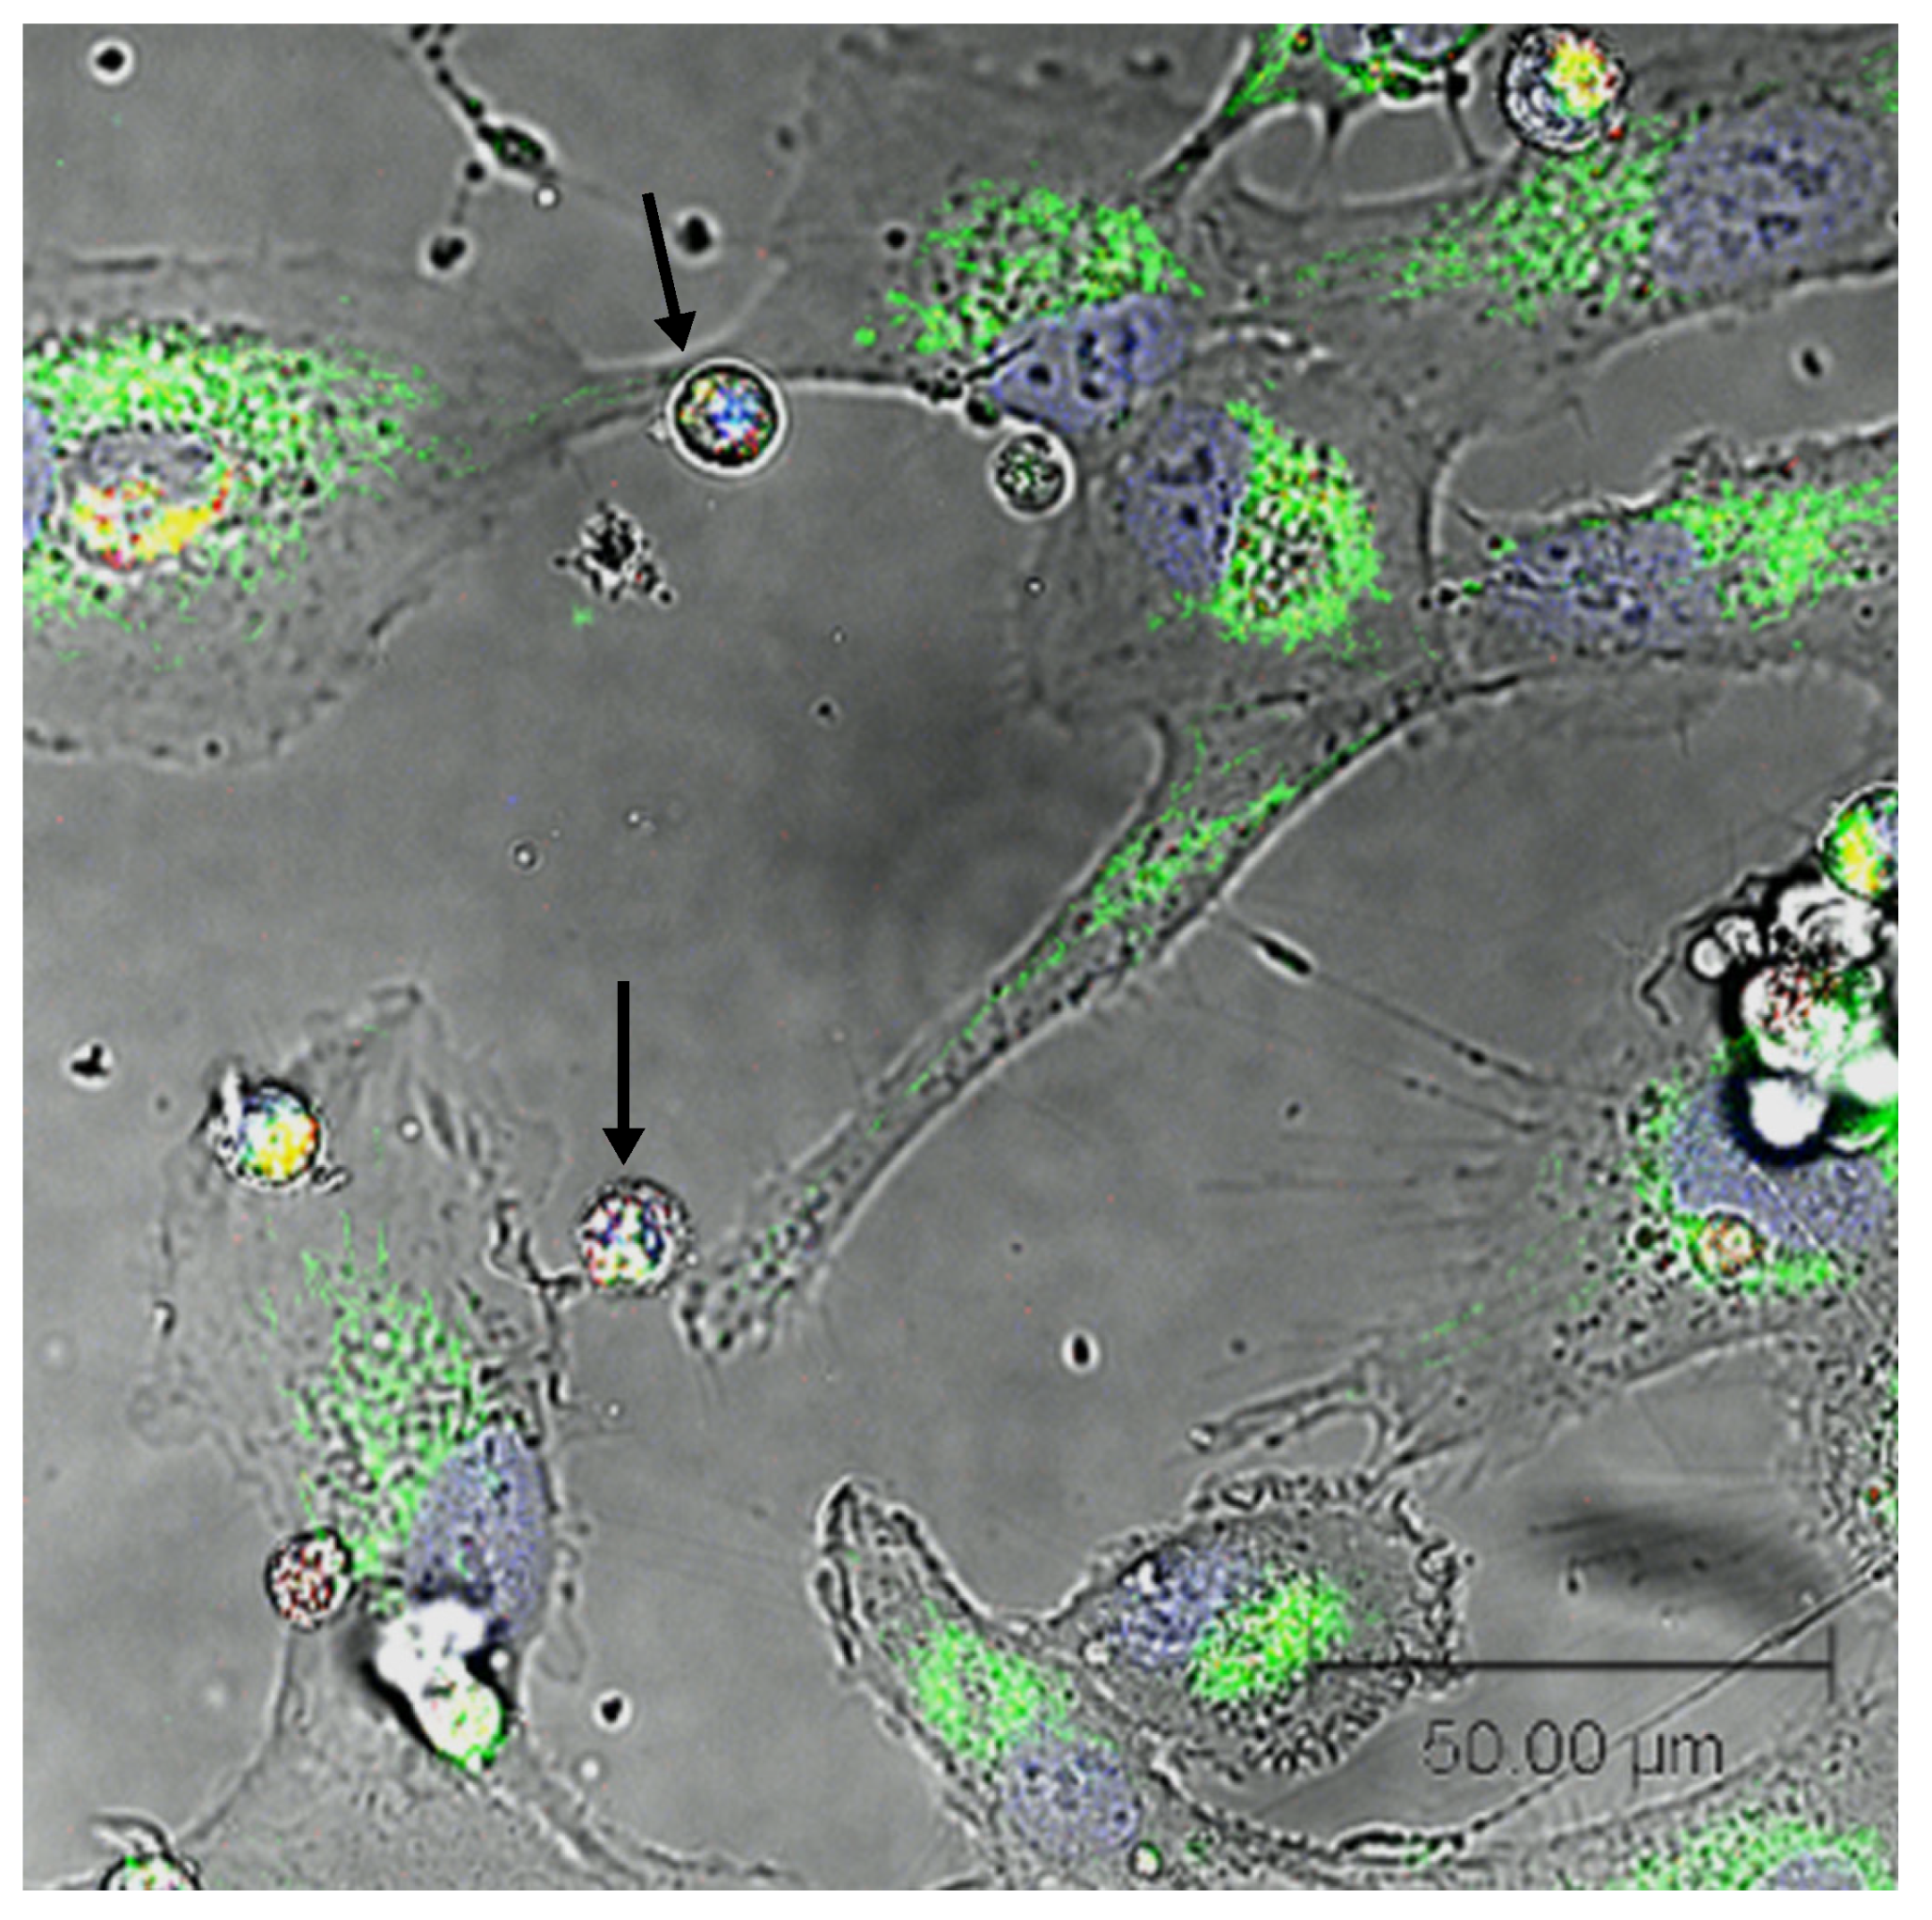
Single-plane confocal imaging of SW1353:N-LCL cocultures showed thin, continuous protrusions spanning intercellular gaps morphologically consistent with TNT-like structures. With SW1353 mitochondria labeled green and N-LCL mitochondria labeled red, both colors were frequently present within these protrusions and in opposing cell bodies, suggesting an exchange of a mitochondrial-associated signal within the imaging window. TNT-like structures were distinguished from broad lamellipodia and closely apposed membranes by their narrow caliber, continuity, and elevation above the substrate. Representative fields are shown in
Figure 2.
Qualitatively, TNT-like projections were common at 12–24 h of coculture. A media-transfer (dye-leakage) control remained negative (no labeling of previously unstained cells), supporting the interpretation that detected fluorescence reflected an on-mitochondrion signal rather than free dye. Since the images were collected as single optical sections (no z-stacks), the counts are conservative and focus on clearly resolved TNT-like structures and the observational confirmation of the bidirectional transfer.
3.3. Respective Oxygen Consumption Rates of Co-Cultured N-LCL and SW1353 Cells
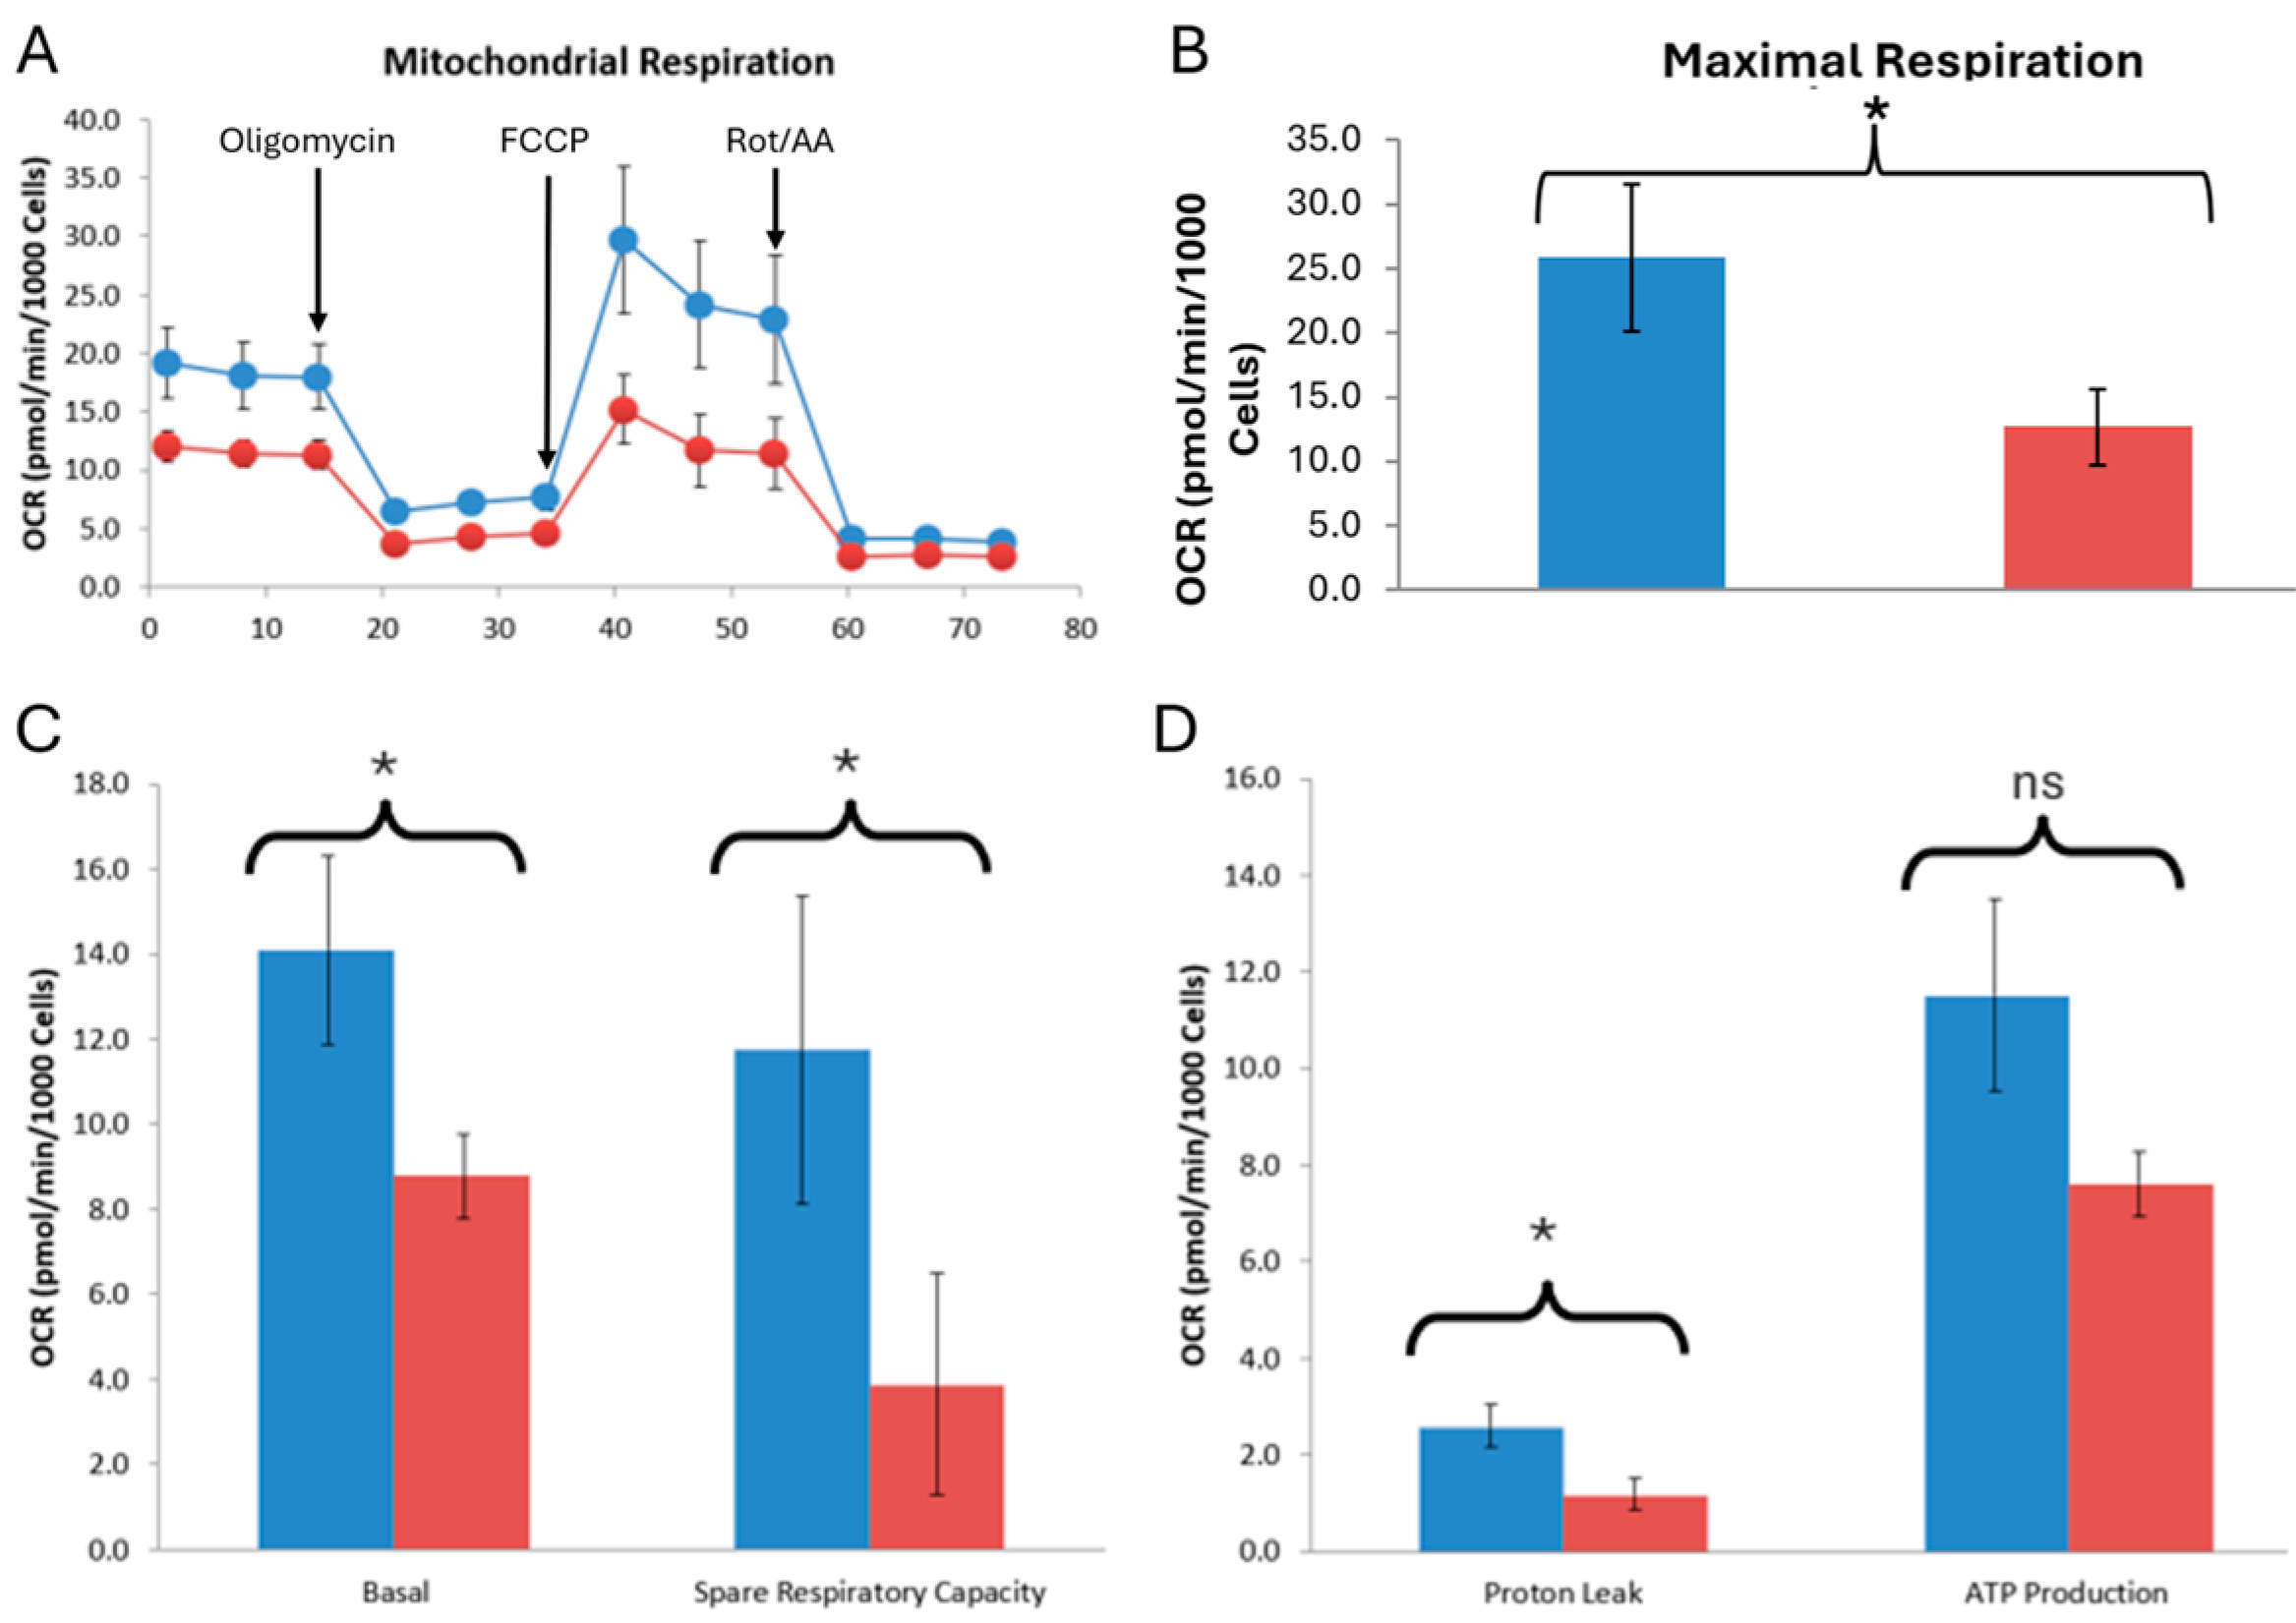
N-LCLs co-cultured with SW1353 cells exhibited significantly reduced basal and maximal respiration, spare respiratory capacity, and a proton leak compared with the controls, while ATP-linked respiration trended lower but did not reach statistical significance. Mitochondrial transport is a two-way process (
Figure 2), and we next determined the metabolic profiling of monocultured SW1353 and N-LCL cells compared to co-cultured cells. We next examined whether coculture with SW1353 cells was associated with altered metabolic activity in N-LCLs and, conversely, whether coculture with N-LCLs was associated with metabolic changes in SW1353 cells.
Normalized OCR traces showed consistent and significant differences between the control N-LCLs and those co-cultured with SW1353. Control monoculture N-LCL cells exhibited higher basal respiration (14.3 ± 2.29 vs. 9.0 ± 0.98 pmol/min/10
3 cells,
p = 0.040) and maximal respiration (21.52 ± 5.21 vs. 10.15 ± 3.06,
p = 0.039), as well as greater spare respiratory capacity (7.19 ± 3.34 vs. 1.17 ± 2.75,
p = 0.043). The proton leak was also significantly higher in control cells (3.04 ± 0.49 vs. 1.6 ± 0.29,
p = 0.018) (
Table S3). ATP-linked respiration trended lower in experimental cocultured cells, but did not reach significance (
p = 0.06). Interestingly, the coupling efficiency was slightly, but significantly increased in the experimental cells (64% vs. 61%,
p = 0.048), largely due to the reduced leak component. Together, these findings demonstrate that co-cultured N-LCL cells exhibit impaired oxidative phosphorylation, characterized by reduced respiratory flexibility (
Figure 3).
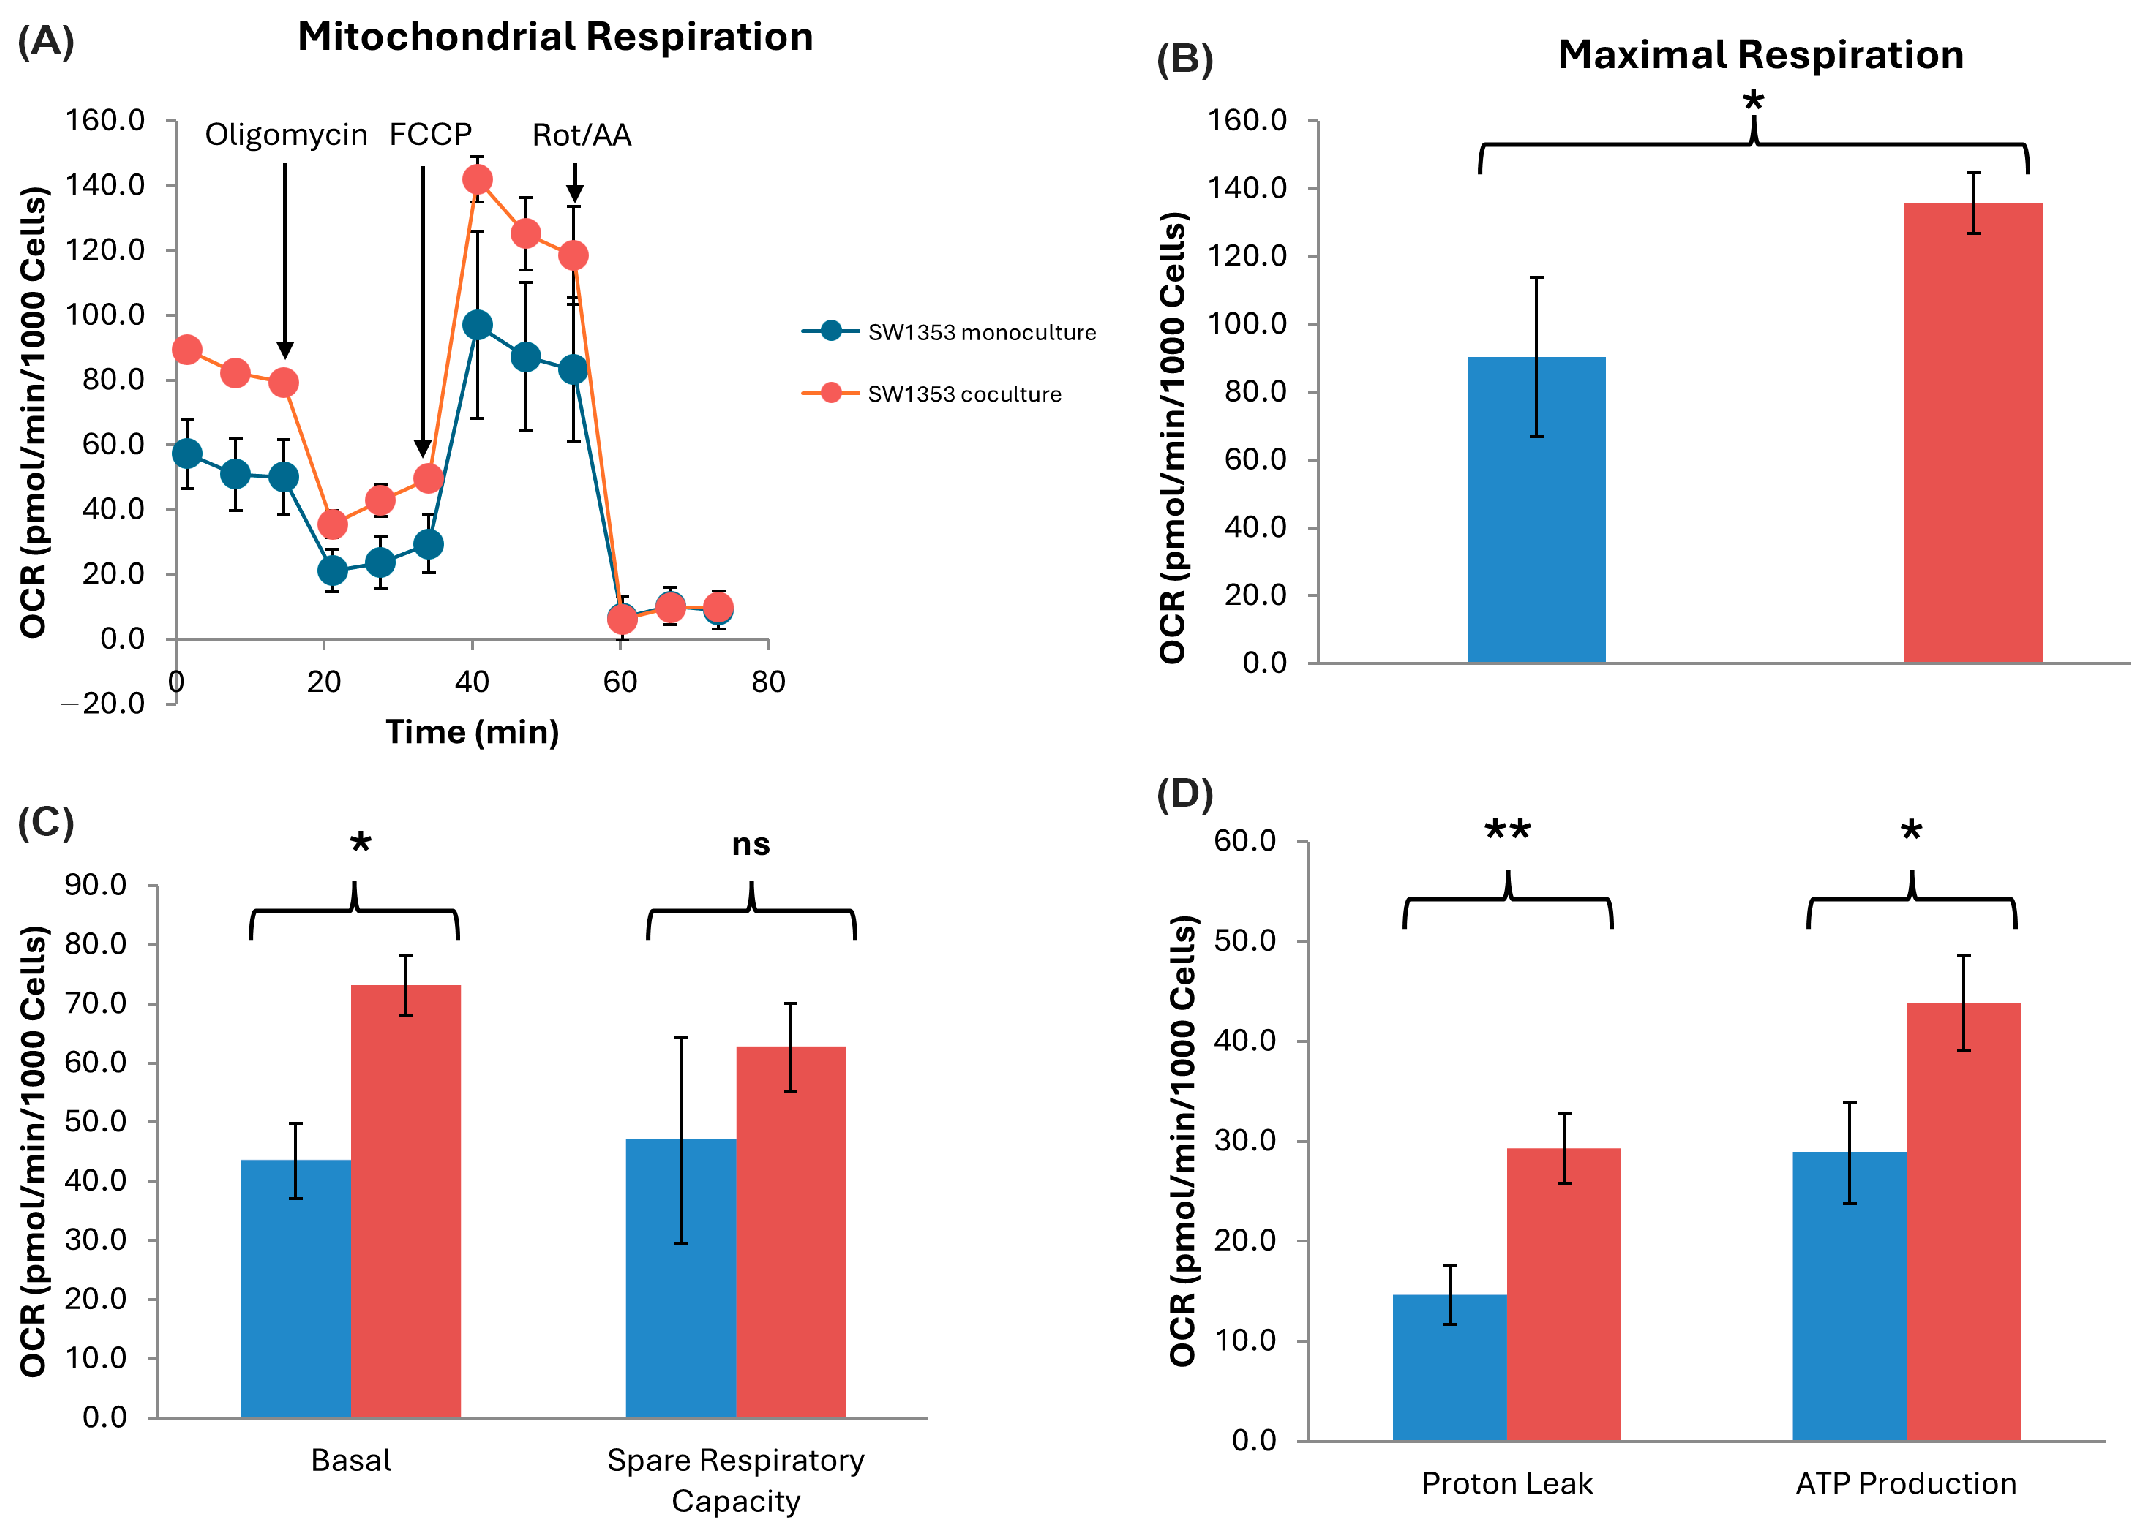
SW1353 cells co-cultured with N-LCLs exhibited significantly higher basal respiration compared with monoculture controls (83.67 ± 2.83 vs. 52.78 ± 11.15 pmol/min/10
3 cells,
p = 0.034) and markedly elevated ATP production (40.98 ± 4.97 vs. 27.98 ± 3.70 pmol/min/10
3 cells,
p = 0.025), representing an approximate 46% increase in ATP-linked respiration. The maximal OCR was likewise increased in co-cultured SW1353 cells (119.93 ± 11.57 vs. 80.51 ± 18.55 pmol/min/10
3 cells,
p = 0.045), indicating an enhanced respiratory capacity under conditions of mitochondrial uncoupling. Collectively, these findings suggest that short-term co-culture with N-LCLs augments oxidative phosphorylation in SW1353 cells, consistent with a metabolic shift toward heightened mitochondrial activity (
Figure 4).
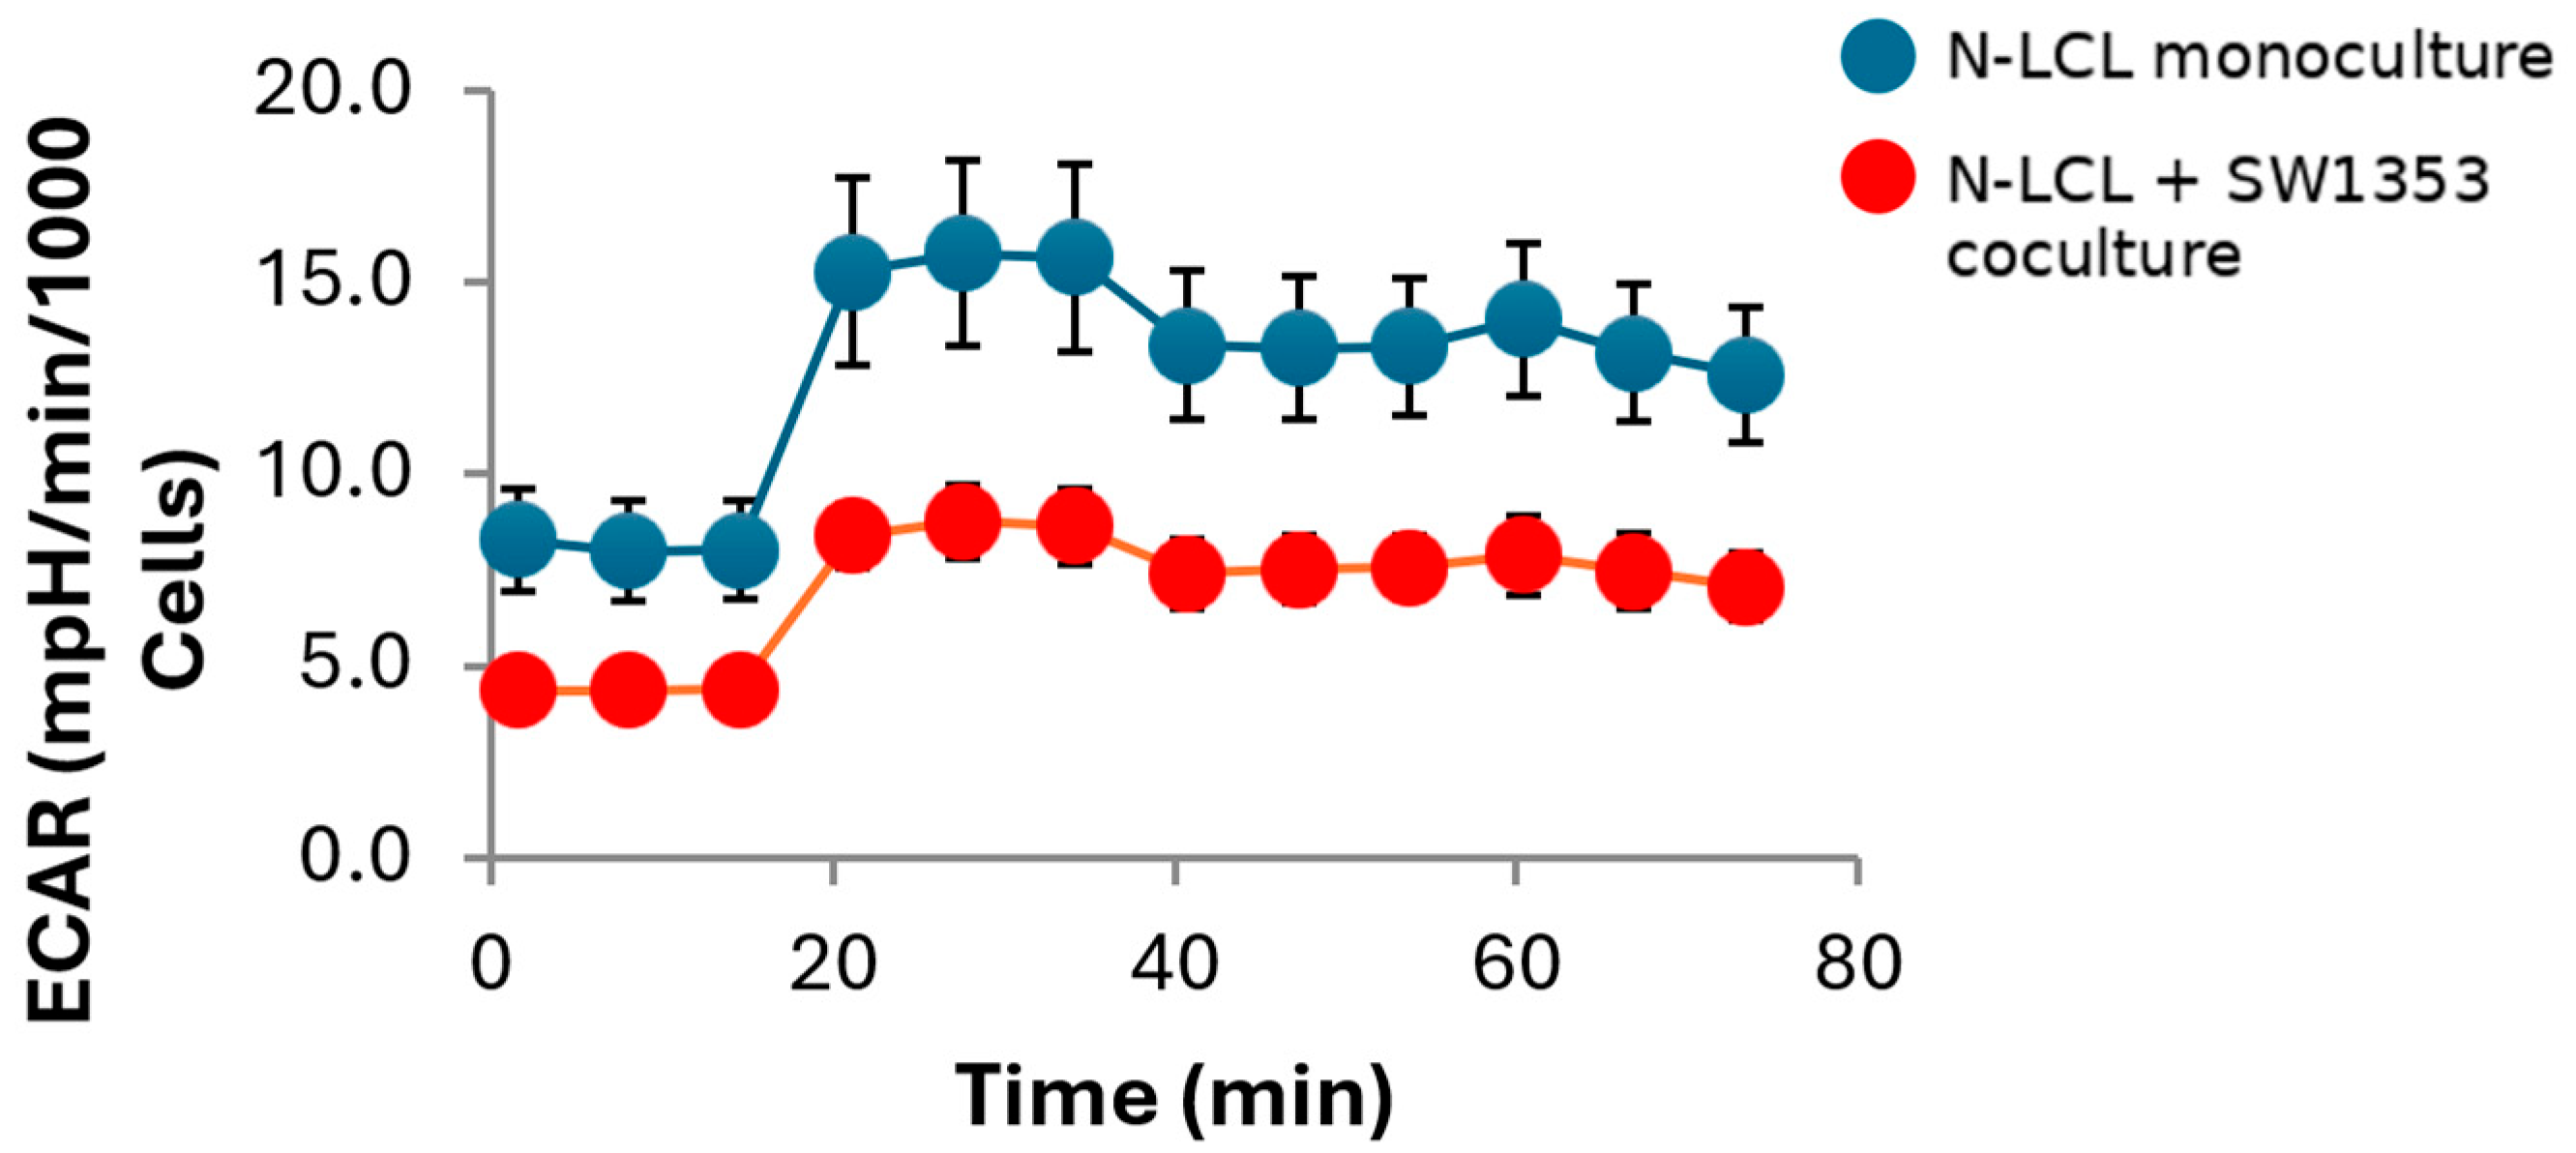
3.4. Extracellular Acidification Rate Analysis of N-LCLs
Normalized ECAR analysis further supported a hypo-energetic phenotype. The pre-oligomycin ECAR was significantly lower in the experimental cells (4.4 ± 0.51 vs. 8.1 ± 1.29 mpH/min/10
3 cells,
p = 0.027), as was non-glycolytic acidification (7.70 ± 0.85 vs. 13.3 ± 1.85,
p = 0.017). Both glycolysis (4.23 ± 0.62 vs. 7.46 ± 1.68,
p = 0.07) and the glycolytic capacity (0.91 ± 0.46 vs. 2.28 ± 0.83,
p = 0.07) trended lower, but did not reach significance at
n = 3. The glycolytic reserve was minimal in both groups and unchanged (
Figure 5 and
Table S2).
The ECAR was measured in control N-LCLs (blue) and N-LCLs cocultured with SW1353 chondrosarcoma cells (red) during a Seahorse XF Mito Stress Test. Data were normalized to cell counts (Hoechst staining, per 1000 cells). Control cells exhibited higher baseline ECAR values compared with experimental cells (p = 0.027), as well as significantly greater non-glycolytic acidification following rotenone/antimycin A (p = 0.017). Both glycolysis and the glycolytic capacity trended lower in the experimental cells, but did not reach statistical significance (p = 0.07, n = 3). Together, these results indicate that experimental N-LCLs display reduced glycolytic activity in parallel with impaired oxidative phosphorylation. The data shown are the mean ± SD of three wells per group.
3.5. Cytochalasin B Transiently Reduces Dual-Positive Events and TNT-like Features
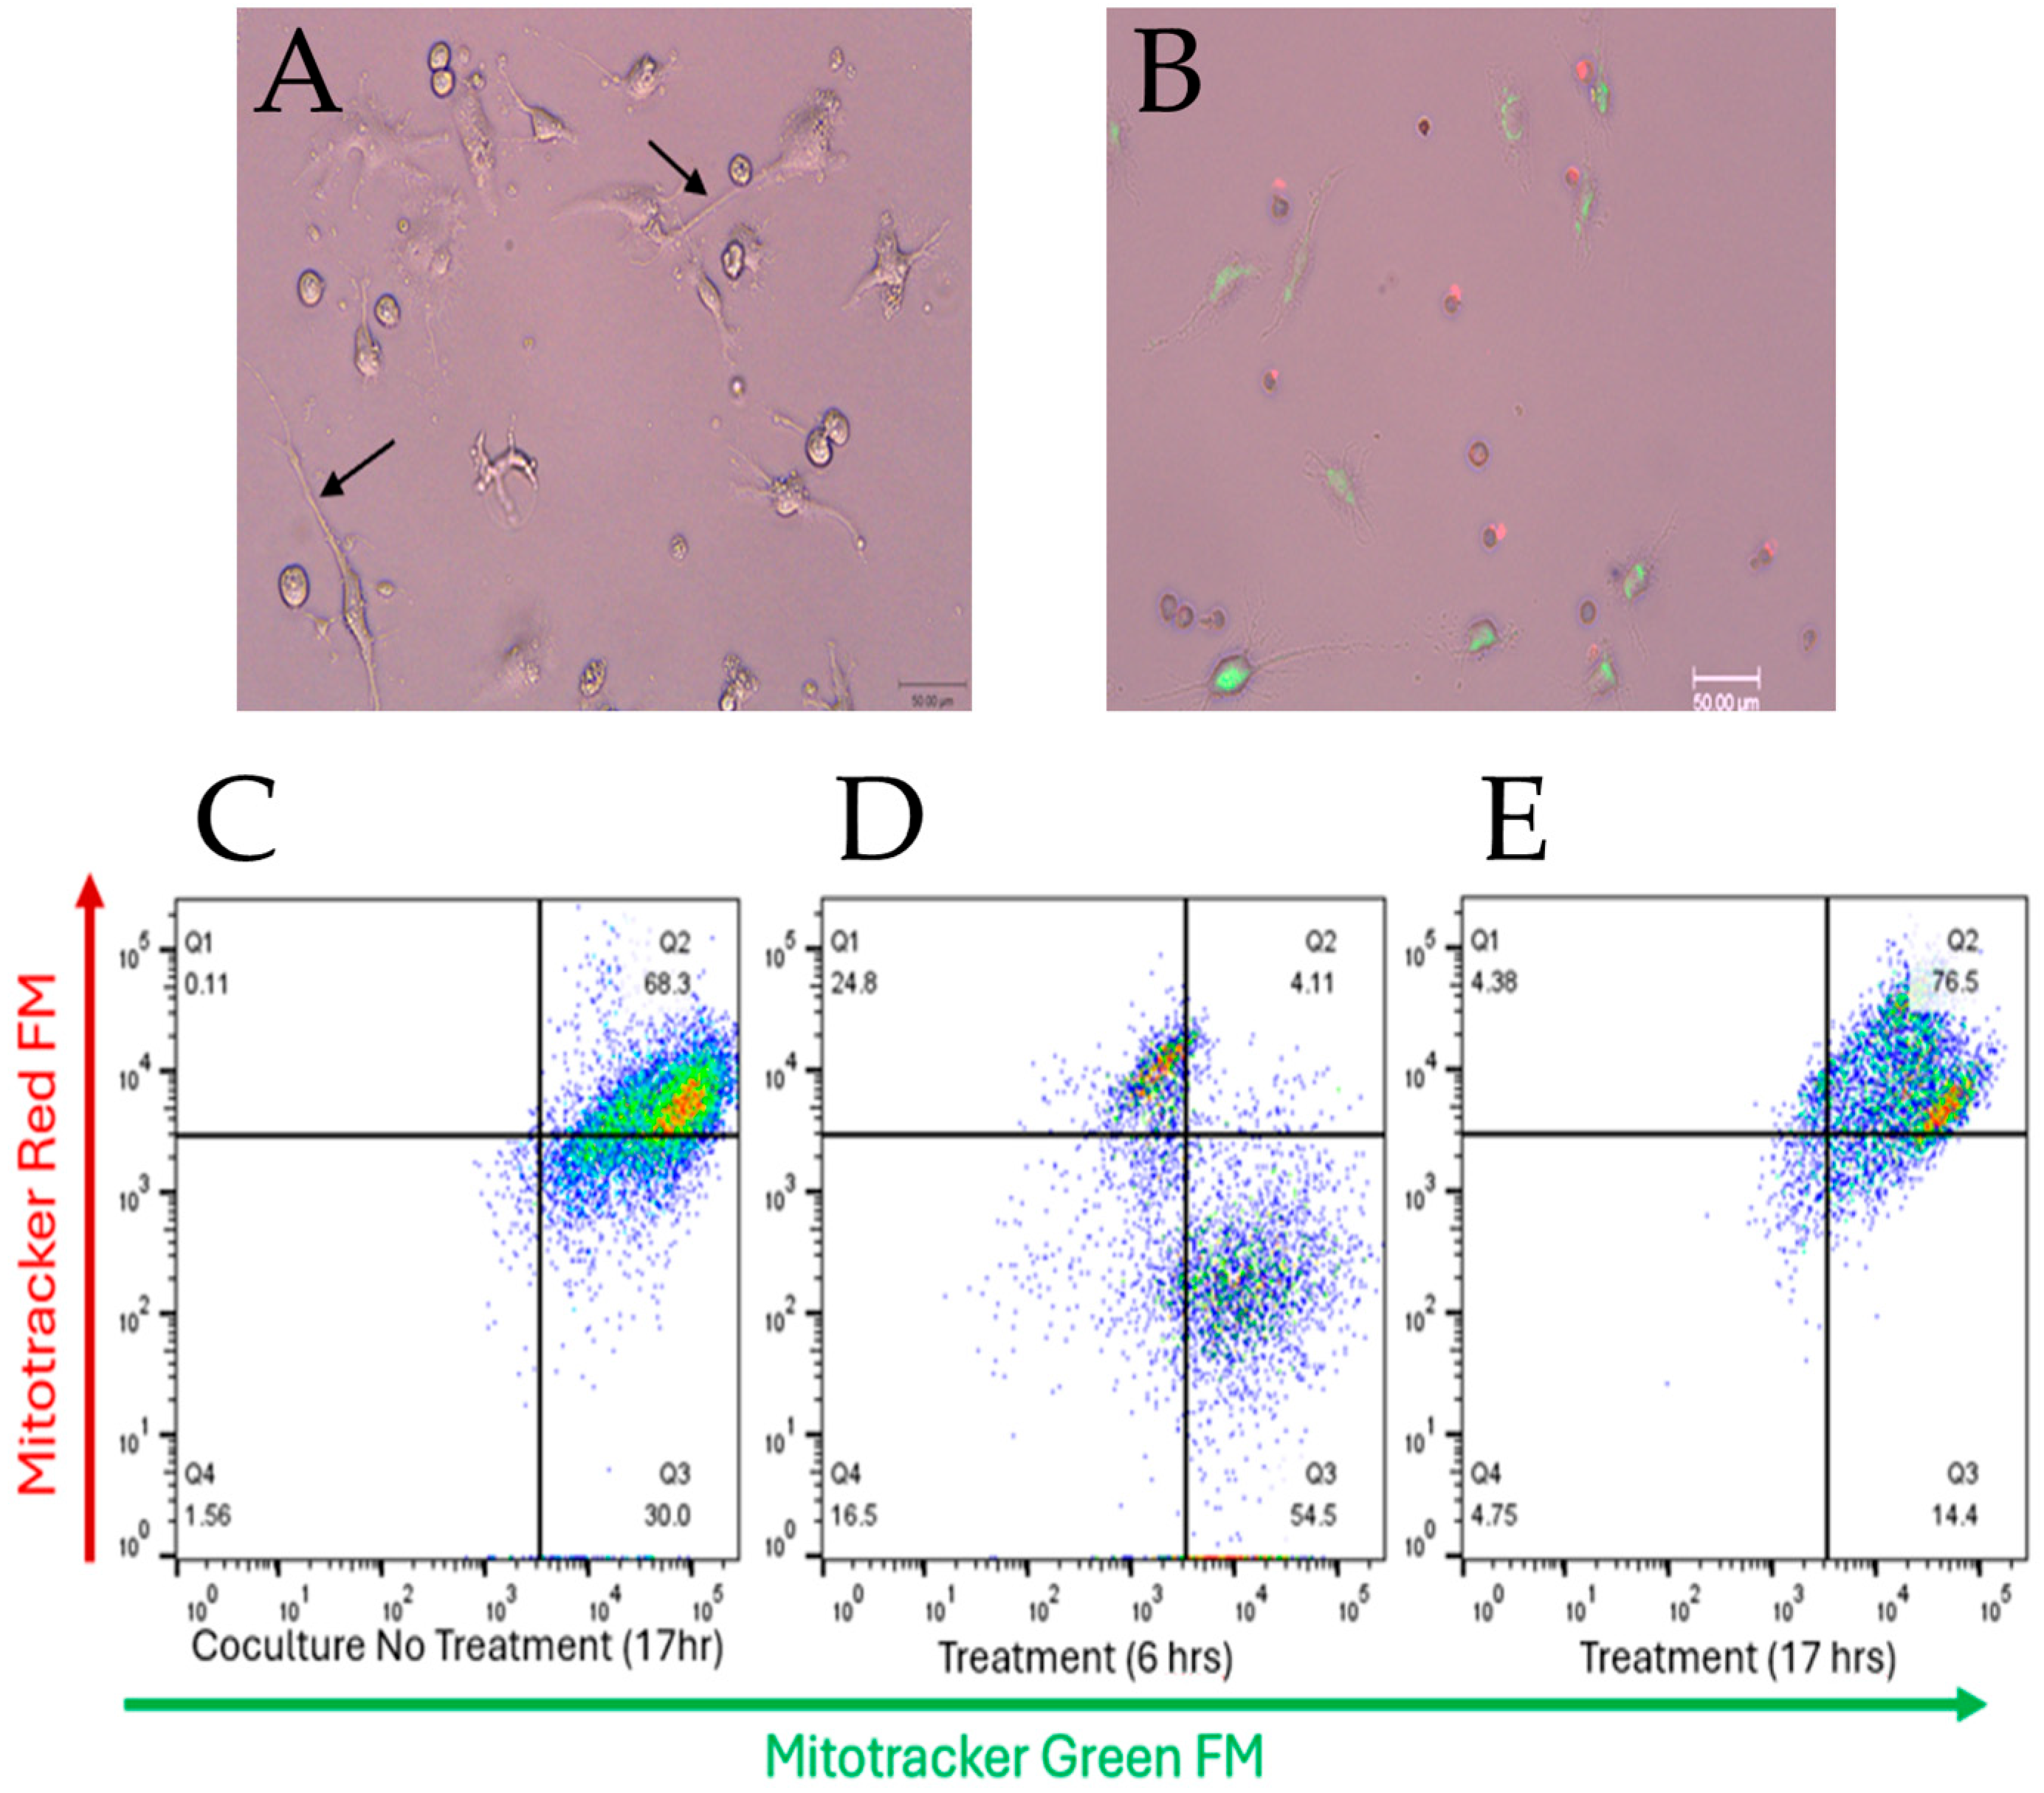
Live single-plane confocal images of cocultured SW1353:N-LCL cells (
Figure 6A) and from matched 6 h-treated chambers showed sparse TNT-like projections and few opposite-color puncta (
Figure 6B), qualitatively aligning with the cytometry profile. In SW1353:N-LCL cocultures labeled with MitoTracker Green (SW1353) and MitoTracker Red (N-LCL), the untreated 17 h condition showed a predominant dual-positive population (Q2 = 68%) when gates set from single-stained controls were applied across the panels (
Figure 6C). Cytochalasin B (10 µg/mL; 0.10% DMSO) was used for 6 h redistributed events away from Q2 toward single-positive quadrants (
Figure 6D), with Q2 falling to ~4% and green-only Q3 rising to ~55% in this representative run.
When incubation continued to 17 h in the presence of cytochalasin B, the dual-positive population rebounded (Q2 = 77%;
Figure 6E), indicating recovery between 6 and 17 h consistent with the short-lived/reversible nature of actin disruption under these culture conditions.
Gates and positivity thresholds were defined from unstained and single-stained mixes and held constant within the run; the acquisition settings were matched across the panels. The data are shown descriptively (no inferential testing for these preliminary assays). Together, the plots and images support a rapid, actin-dependent step in intercellular mitochondrial signal acquisition that is strongly reduced at 6 h and largely restored by 17 h.
3.6. Detection of Dual-Positive Mitochondria in Labeled Cells and Direction of Transfer
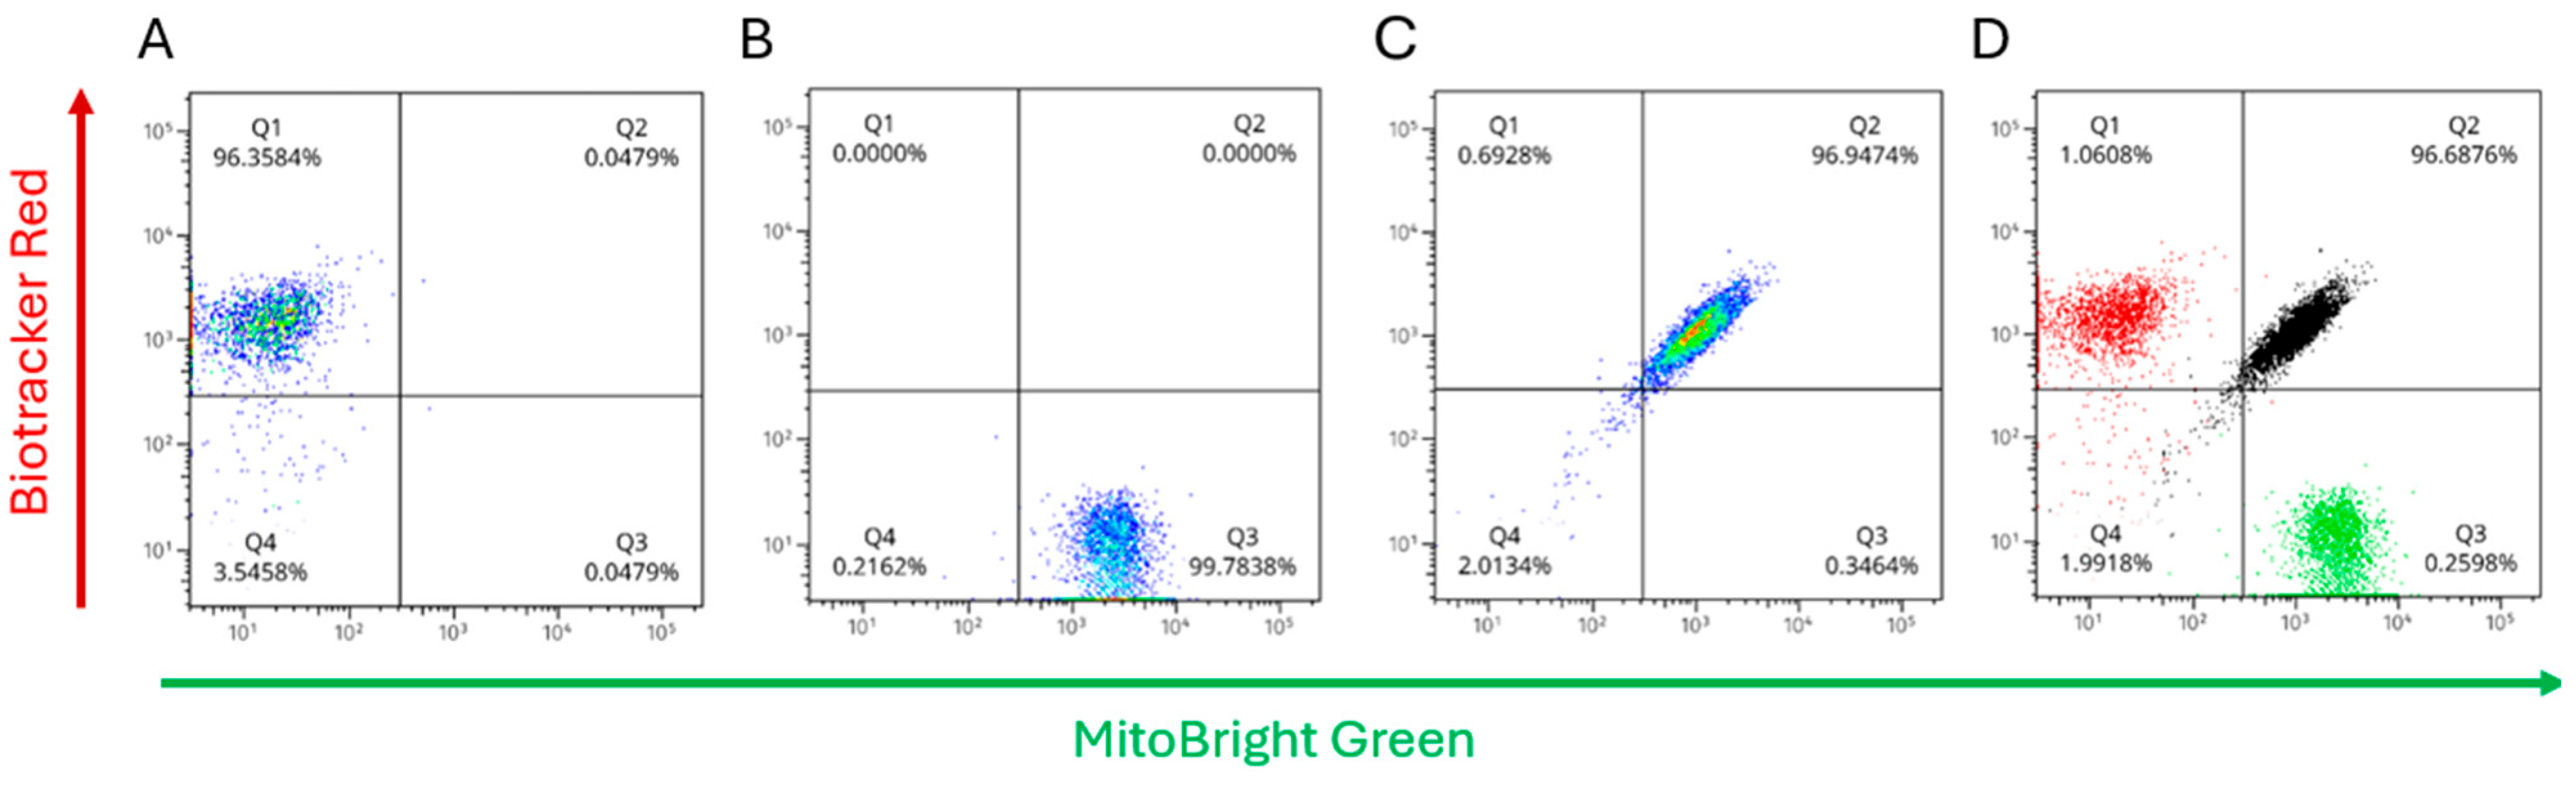
Single-stain controls with mitochondrial dyes established the gating and compensation used to quantify the labeling in SW1353:N-LCL cocultures (
Figure 7A,B). N-LCL mitochondria were stained with Biotracker Red (detected in PE-Cy5) and SW1353 mitochondria were stained with Mitobright Green (detected in FITC). These controls defined the quadrant thresholds and verified the spectral separation; the same gates were then applied unchanged to all coculture samples. After 17 h of coculture, the full-stained sample showed a predominant dual-positive cluster (
Figure 7C; Q2 = 96.9% of singlets under matched gates). Single-positive quadrants were correspondingly sparse. As doublets were excluded by pulse-geometry gating, the large Q2 fraction reflects single cells exhibiting both mitochondrial-associated fluorescent signals rather than coincident events. An overlay of the single-stain controls with the coculture (
Figure 7D) illustrates the gate placement and channel specificity.
Together with the confocal images, these data are consistent with the extensive intercellular exchange of the mitochondrial signal over 17 h of coculture. Two points bolster this interpretation. First, the media-transfer (dye-leakage) control remained negative, arguing against free dye as a source of dual-color events. Second, immediate-mix suspension assays yielded a low dual-positive fraction under the same gates, indicating that the high Q2 signal emerges over time and with cell–cell contact, rather than from acquisition artifacts. While the bulk flow does not assign directionality at the single-cell level, the near-universal Q2 population after 17 h implies labeling in both partners; mechanistically, this aligns with the actin-dependent behavior observed in the cytochalasin-B experiments.
3.7. Directionality of Transfer Resolved Within Size/Granularity Templates
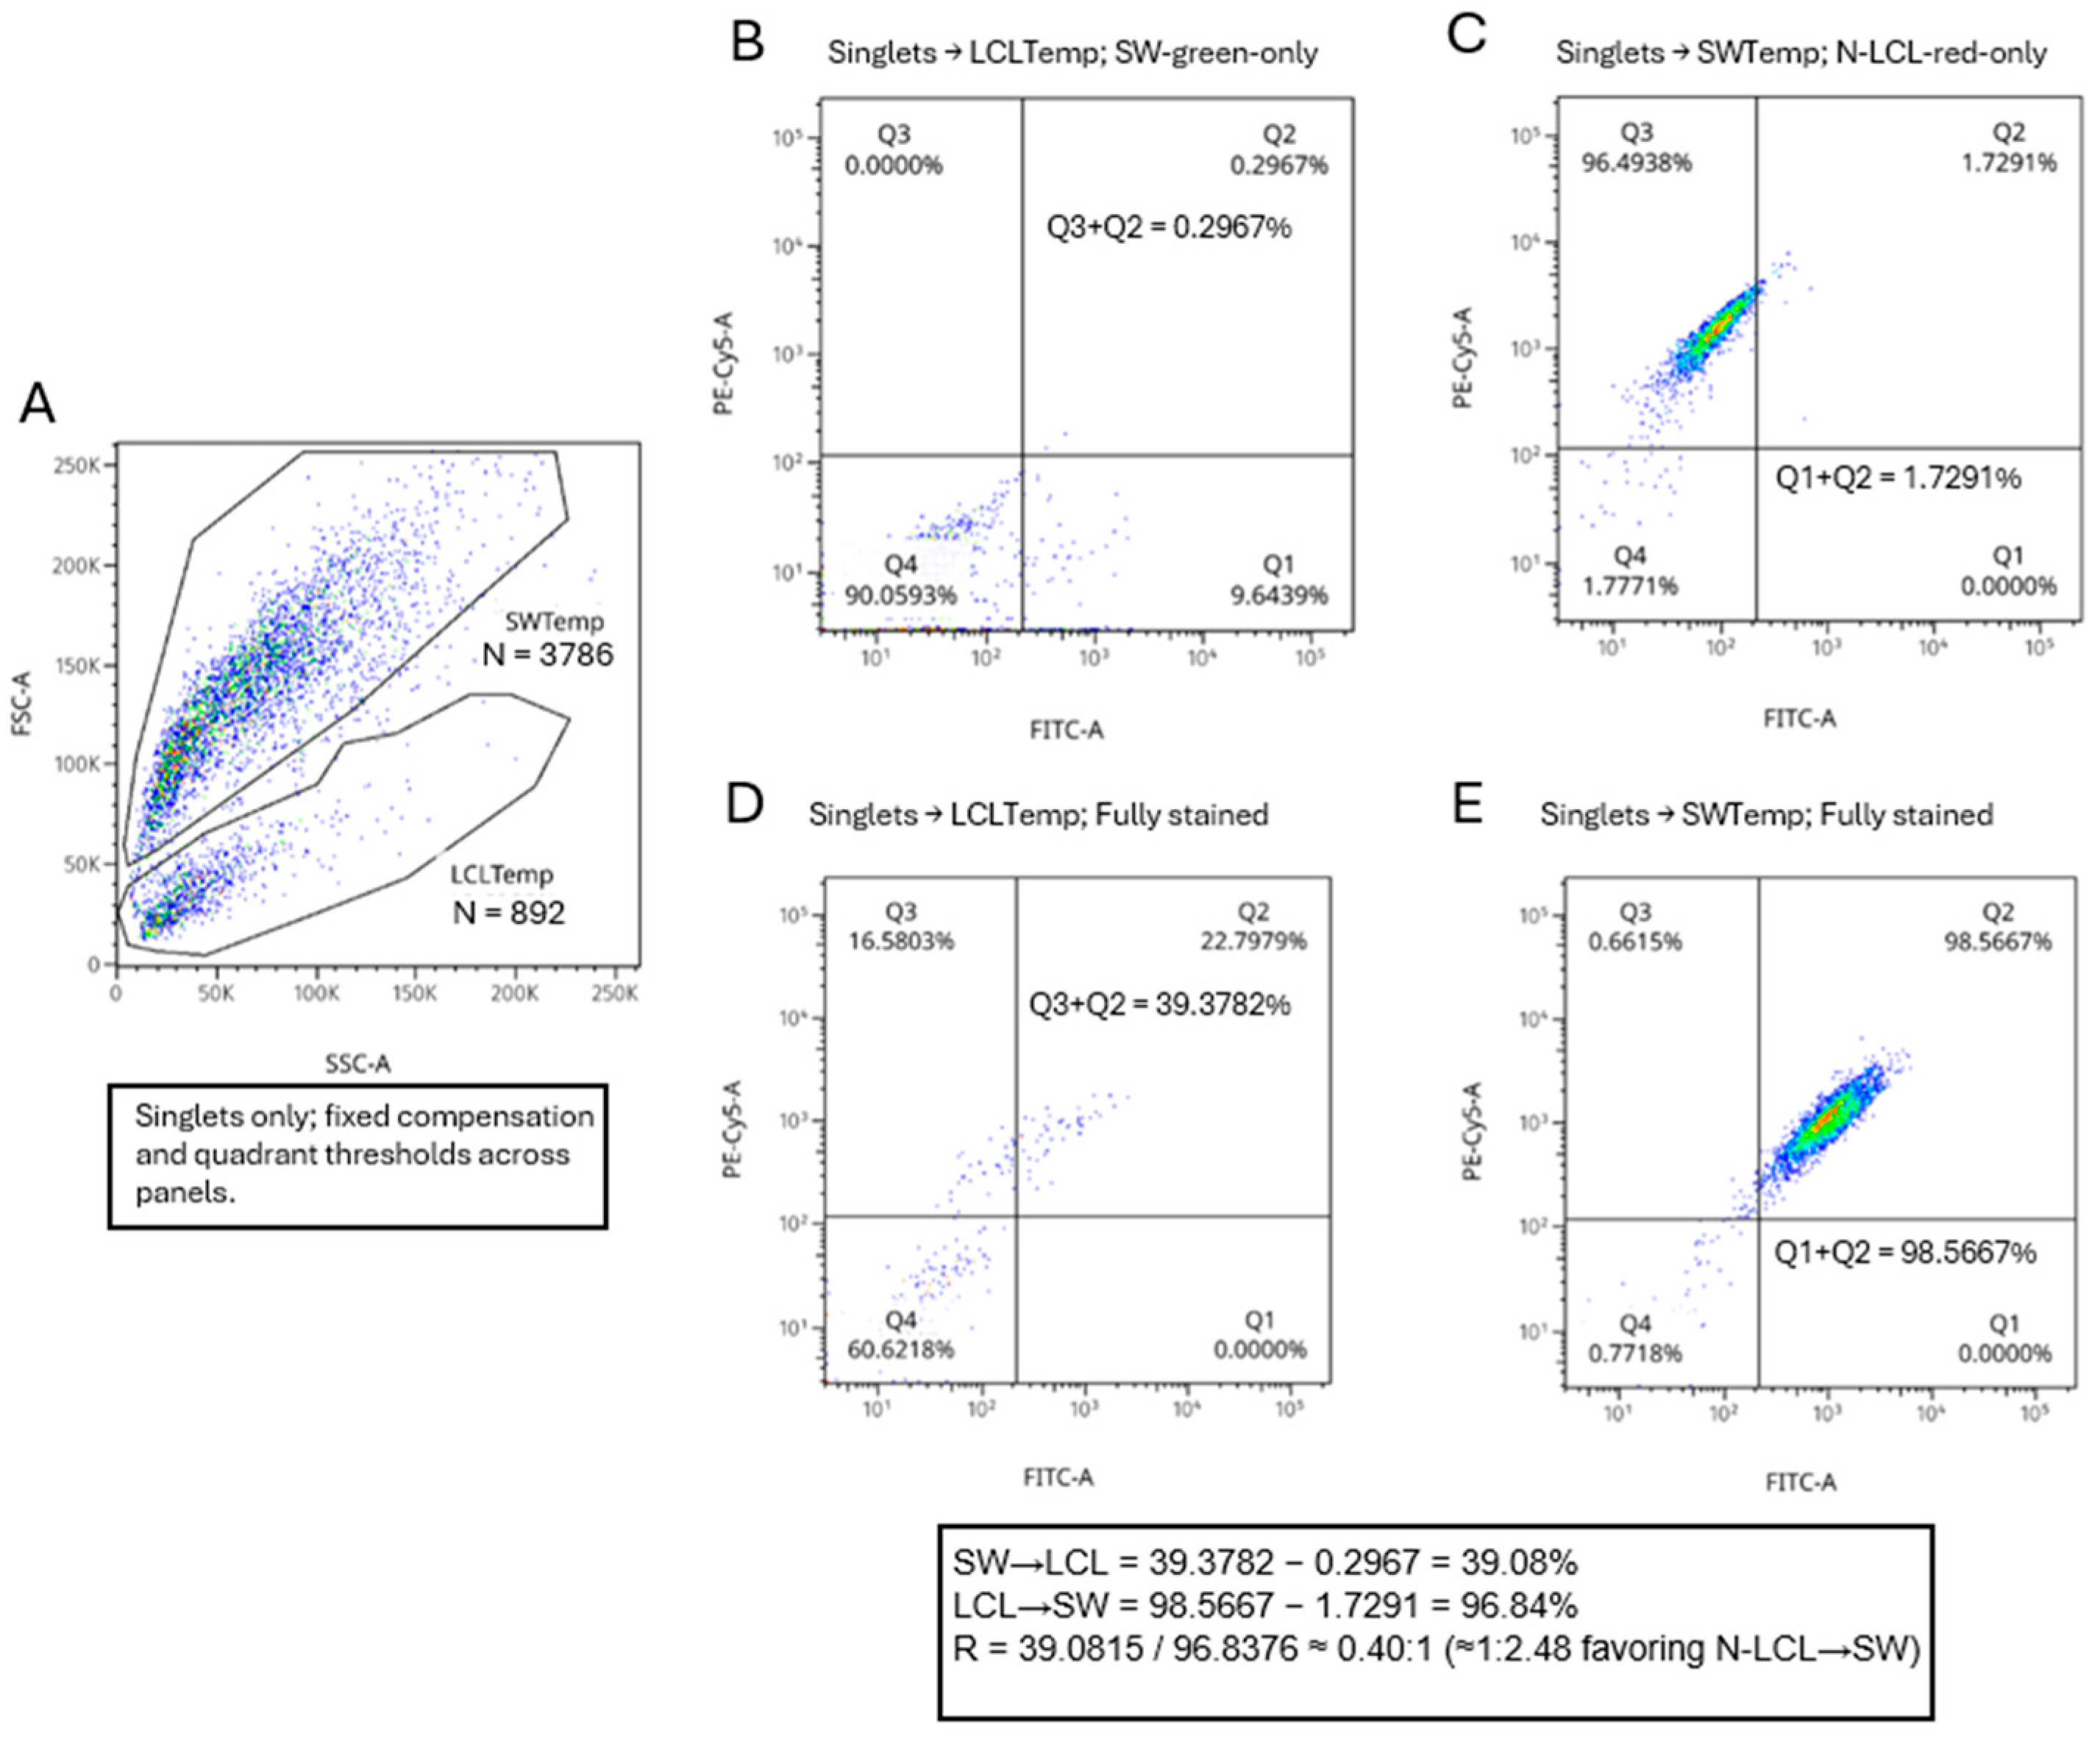
Restricting the analysis to singlets and applying the fixed FSC/SSC templates, monostained cocultures yielded a low template-classification error (misassignment) (
Figure 8A). These proportions are reported relative to the parent template gates (temp) shown in
Figure 8A and were obtained under identical compensation and quadrant thresholds across all panels. Q3 + Q2 in LCLtemp on the SW-green-only tube = 0.2967% (
Figure 8B) and Q1 + Q2 in SWtemp on the N-LCL-red-only tube = 1.7291% (
Figure 8C). In the fully stained coculture, the directionality inputs read from the same quadrants were Q3 + Q2 in LCLtemp = 39.3782% (
Figure 8D) and Q1 + Q2 in SWtemp = 98.5667% (
Figure 8E). After subtracting the corresponding misassignment values, the leak-corrected fractions were 39.0815% (SW → N-LCL) and 96.8376% (N-LCL → SW), giving a directionality ratio of R = 0.40:1 (1:2.48, favoring N-LCL → SW). These proportions are reported relative to the parent template gates and were obtained under identical compensation and quadrant thresholds across all panels. Together with singlet gating (removing doublets) and negative results in the media-transfer control, these data indicate that, over 17 h, SW1353 cells acquire a mitochondrial label from N-LCLs more frequently than the reverse under the conditions tested.
While flow cytometric analyses validated the bidirectional transfer, leak-corrected quadrant gating revealed a consistent bias toward an N-LCL-to-SW1353 transfer, suggesting that tumor cells prefer the acquisition of mitochondria from immune cells. This directional predominance persisted across replicates, even after normalization for unequal events counts, indicating a biological outcome rather than a technical artifact. Cytochalasin B treatment significantly reduced both TNT formation and, consequently, the mitochondrial exchange, thereby establishing the process as actin-dependent. Altogether, these results identify the TNT-mediated exchange as a route through which chondrosarcoma cells may acquire mitochondrial-associated material from surrounding immune cells under the conditions tested.
4. Discussion
The mitochondrial transfer has been investigated mainly in the context of rescuing damaged or stressed cells, particularly in stem cells and regenerative biology [
11,
20,
21].
Less attention has been paid to pathological scenarios where this transfer may be deleterious or hijacked by tumor cells. For example, malignant cells may use a mitochondrial transfer to promote the metabolic reprogramming of immune cells, potentially impairing their anti-tumor activity, but definitive studies demonstrating such mechanisms are urgently required. Intercellular mitochondrial trafficking and its therapeutic implications [
22,
23] have been documented in several malignancies and recent findings [
19] which demonstrate mitochondrial trafficking between cancer and immune cells, further underscoring the need to examine the immunomodulatory consequences of this cross talk.
Chondrosarcoma, a common form of bone cancer with very limited treatment options, provides an interesting phenomenon in this context because a mutant IDH2 enzyme converts α-ketoglutarate to the oncometabolite D2HG in the mitochondria [
2]. Whether the mitochondria-associated transfer contributes to the exposure of recipient cells to D2HG remains incompletely understood. Understanding how the mitochondrial exchange in IDH2-mutant chondrosarcoma may influence the recipient cell function, particularly within the immune compartment, remains an underexplored area [
24,
25] with potential therapeutic relevance.
TNTs are open-ended conduits that directly connect the cytoplasm of two cells. TNTs can transfer cargo of various sizes, encompassing not only small ions and molecules, but also larger organelles, such as lysosomes and mitochondria [
26]. Mitochondrial transport between cells is now recognized as a mechanism whereby the metabolic reprogramming of donor and recipient cells can be achieved because of the transfer. TNTs are actin-filled structures [
27] that are continually forming and breaking. Previous observations in our laboratory have shown TNT connections between a monoculture of SW1353 cells with mitochondria present in TNTs. As this cell type is IDH2-mutant, we were interested in the transfer of these mitochondria to other cell types and their receipt of normal mitochondria. To characterize the TNT structures, we tested whether actin disruption by cytochalasin B would prevent TNT formation between normal and SW1353 cells and reduce the mitochondrial exchange. Untreated cocultures displayed a predominant dual-positive population indicative of an active mitochondrial exchange; however, after cytochalasin B treatment markedly reduced, the dual-positive events were observed consistently with the inhibition of actin-based TNTs. After 17 h of treatment, the dual-positive population partially recovered, suggesting the restoration of the intercellular connectivity indicative of reduced cytochalasin potency. Confocal imaging further supported this interpretation, as the mitochondrial signal was primarily localized within thin intercellular connections and not within obvious vesicular structures following 17 h of coculture. Although a vesicle-mediated transfer cannot be excluded, these findings are consistent with the actin-dependent TNT-based mechanism under the conditions studied. As expected, this observation is similar to others [
28,
29,
30] where cytochalasin B abolished the formation of TNTs, inhibiting intercellular transport.
Without time-lapse imagery, microscope analysis is limited, and we could not quantify the mitochondrial movement or direction. By using a combination of confocal microscopy, flow cytometry, and Seahorse metabolic analysis we show, for the first time, that the mitochondrial exchange occurs bidirectionally between chondrosarcoma and B-lymphoblastoid cells, an observation in broad agreement with other studies using different cancer models [
20,
28,
31,
32]. Additionally, we provide new evidence that the intercellular mitochondrial exchange comes with measurable metabolic consequences to both cell types. Interestingly, our data show an unequal transfer of mitochondria, with more mitochondria transferred from N-LCL cells to the chondrosarcoma cell line SW1353 with a 46% increase in ATP production. Although higher than other studies [
28,
33] that observed an ~1.5-fold increase in ATP production by cancer cells, that which is in common between the studies is that the referenced cancer cells are empowered while immune cells become metabolically depleted. Interestingly, using RNA seq, a near-unidirectional mitochondrial transfer from primary murine T cells to a murine lung cancer cell line was observed [
32]. Given that our study uses cell lines which are different to other studies does not negate the possibility that different cancer types may initiate a mitochondrial ‘grab’ to promote their metabolism that may be dependent on the original metabolic requirements of the cancers’ originating cells. Cartilage-forming tumors with IDH2 mutations more closely reflect the lower metabolic activity of primary chondrocytes and do not require a large influx of mitochondria to achieve the higher relative increase in metabolic activity. These observations raise the possibility that distinct metabolic programs in IDH1- versus IDH2-mutant chondrosarcoma may influence mitochondrial exchange dynamics, a hypothesis that will require direct testing in future studies using comparative coculture systems. IDH1- and IDH2-mutant chondrosarcoma could be susceptible to different therapeutic approaches if this hypothesis could be confirmed in primary resected tumors. Likewise, the differential depletion of mitochondria from immune cells will leave these cells metabolically exhausted and a loss of immune response would be different in the IDH1-mutant tumor microenvironment compared to that of IDH2-mutant. The reduced metabolic rates in IDH2-mutant contexts may reflect contributions from D2HG-associated mitochondrial alterations, although direct evidence for this mechanism was not examined in the present study. Although direct evidence is lacking that mitochondrial RNA expression may be compromised in IDH2-mutant mitochondria, it is known that D2HG inhibits RNA demethylases in IDH1-mutant glioma [
34], suppressing their function, and could, therefore, be confirmed by RNA sequencing in IDH2-mutant cells.
We examined how the mitochondrial transfer affected the metabolic function in both cell types. Seahorse extracellular flux analysis using the MitoStress Test revealed that N-LCLs cocultured with SW1353 exhibited a marked reduction in both the OCR and ECAR, implying a hypometabolic phenotype. Despite lower metabolic activity, however, ATP production remained stable, suggesting that transferred mitochondria or altered redox conditions may transiently sustain cellular energy homeostasis. These data suggest that donating mitochondria imposes a bioenergetic cost on immune cells, consistent with the observed directionality of the transfer. Although the precise molecular drivers of metabolic enhancement in SW1353 were not directly resolved, the preferred uptake of mitochondria by tumor cells suggests a conferred adaptive advantage under oxidative or nutrient stress. Notably, the concurrent reduction in both oxidative phosphorylation and glycolytic activity indicates that N-LCLs do not compensate for impaired respiration by upregulating glycolysis, but instead remain globally suppressed across the metabolic pathways. This pattern is consistent with the altered mitochondrial input during coculture, although the molecular mechanisms underlying this response were not examined in the present study.
The tumor microenvironment includes stromal, endothelial, and fibroblast populations that may also participate in the mitochondrial exchange with tumor cells. While the present study focused on immune cell interactions, extending these findings to additional microenvironmental cell types will be important to define the broader relevance of the mitochondrial exchange in chondrosarcoma.
The higher basal ECAR and sustained acidification in JJ012 indicate a greater glycolytic flux and proton export at the baseline (i.e., more lactate production), consistent with a glycolysis-biased/Warburg-like phenotype under these conditions. This profile could reflect mitochondrial coupling limits or a lower spare reserve, and/or oncogenic programs (e.g., HIF-1α/PI3K-AKT-mTOR signaling, an altered redox from IDH-pathway contexts) that upregulate glycolytic enzymes and acid extrusion. Media were bicarbonate-free and pH-controlled, so the ECAR here primarily tracks glycolysis rather than CO2 hydration. Whether these metabolic features influence the mitochondrial exchange behavior remains to be determined. Taken together, we believe wild-type tumor controls would strengthen future mechanistic and translational studies, although their absence here does not invalidate the current findings nor prevent the clear interpretation of the data within the defined scope of this manuscript.