Article

EvoFuzzy: Evolutionary Fuzzy Approach for Ensembling Reconstructed Genetic Networks

1
Health Innovation and Transformation Centre, Federation University, Churchill, VIC 3842, Australia
2
BioThink Pty Ltd., Brisbane, QLD 4061, Australia
*
Author to whom correspondence should be addressed.
BioMedInformatics 2025, 5(4), 59; https://doi.org/10.3390/biomedinformatics5040059
Submission received: 6 June 2025 / Revised: 26 September 2025 / Accepted: 9 October 2025 / Published: 20 October 2025
(This article belongs to the Topic Computational Intelligence and Bioinformatics (CIB))

Abstract

Background: Reconstructing gene regulatory networks (GRNs) from gene expression data remains a major challenge in systems biology due to the inherent complexity of biological systems and the limitations of existing reconstruction methods, which often yield high false-positive rates. This study aims to develop a robust and adaptive approach to enhance the accuracy of inferred GRNs by integrating multiple modelling paradigms. Methods: We introduce EvoFuzzy, a novel algorithm that integrates evolutionary computation and fuzzy logic to aggregate GRNs reconstructed using Boolean, regression, and fuzzy modelling techniques. The algorithm initializes an equal number of individuals from each modelling method to form a diverse population, which evolves through fuzzy trigonometric differential evolution. Gene expression values are predicted using a fuzzy logic-based predictor with confidence levels, and a fitness function is applied to identify the optimal consensus network. Results: The proposed method was evaluated using simulated benchmark datasets and a real-world SOS gene repair dataset. Experimental results demonstrated that EvoFuzzy consistently outperformed existing state-of-the-art GRN reconstruction methods in terms of accuracy and robustness. Conclusions: The fuzzy trigonometric differential evolution approach plays a pivotal role in refining and aggregating multiple network outputs into a single, optimal consensus network, making EvoFuzzy a powerful and reliable framework for reconstructing biologically meaningful gene regulatory networks.

1. Introduction

Gene regulatory networks (GRNs) are sophisticated biological systems that control the way in which genes are expressed and interact with each other. GRNs involve a comprehensive group of regulators interacting with their corresponding targets for gene regulation. The development of high-throughput technologies, such as microarrays and next-generation sequencing, has led to research focused on uncovering the complexities of GRNs and understanding the underlying biological processes. Reconstructing GRNs has always remained challenging due to the nature of the available data. These challenges include high dimensionality, limited sample size, and imprecise characteristics [1], along with the task of identifying the appropriate combination of regulators controlling a target gene. In addressing these challenges, different models have been developed based on various strategies such as Boolean methods, Bayesian methods, differential equation methods, machine learning-based methods, fuzzy concepts, and information theory-based approaches [2,3,4,5,6].
However, these different types of inference approaches differ in their fundamental concepts, and thus suffer from inherent biases, resulting in varied outcomes depending on the specific problem context. Therefore, pre-determining the optimal reverse engineering method for reconstructing a specific GRN becomes extremely challenging, with no single method being able to effectively capture various genetic interactions and accurately model a GRN [7,8,9]. As a result, numerous recent reverse engineering strategies have started embracing ensemble techniques to construct consensus GRNs. These approaches aggregate the varied outcomes produced by multiple GRN inference methods, effectively harnessing the combined strengths of these methods to form a robust solution [8,9,10,11,12,13,14,15].
To use ensemble modelling for GRN inference, most methods involve taking a single approach and generating ensemble variations by averaging their outcomes when applied to resampled datasets. For instance, GENEI3 [16] employs the random forest algorithm [17], running it multiple times on resampled training datasets, and consolidating the resulting GRNs to improve accuracy. An enhanced version, dynGENEI3 [18], expands on GENEI3, while BTNET [19], another notable method, adopts an ensemble approach using the boosted-tree algorithm. However, the dependence of these algorithms on a single methodology led to unresolved issues specific to that particular approach. Therefore, to mitigate the limitations of individual methods, Marbach [8] introduced the idea of community networks, which merge networks inferred using different methods. They combined these inferred interactions using an unweighted rank-averaging method, known as the Borda count. Marbach’s method lacks a reliable mechanism to identify the optimal methods when aggregating the inferred networks of an entirely unknown network for which the exact network structure is not known [8].
Recent ensemble methods are often integrating classic aggregation techniques like rank average (such as Borda count), scaleSum, and scaleLSum [20]. For instance, ComHub is a recent ensemble method which is used to predict hub genes based on a community approach using rank averaging to model aggregation [21]. However, EnGRaiN, a new method, distinguishes itself as the first supervised ensemble network learning approach, offering accurate predictions of regulatory interactions. EnGRaiN surpasses rank average and scaleLSum in certain scenarios. Nevertheless, it relies on prior knowledge of known interactions, making it poorly suited to real-world scenarios in which the network structures are unknown [20]. Unlike the above methods, TopkNet employs a novel dataset similarity-based approach to determine the best algorithms for a dataset linked to a regulatory network in which the network structure is not known. However, assessing gene expression data similarity between datasets obtained based on algorithm diversity, further evaluated using confidence level differences, is not always a reliable approach [9]. GRAMP, a new network aggregation method based on gene scores, was introduced in [13] to combine networks derived from various inference approaches. The score assigned to each gene, corresponding to a target gene, is evaluated by considering both local and global gene rankings, as well as by the performance of the inference methods in a specific problem context. It prioritizes high-performing methods during network aggregation, based on their performance, which is determined using a dataset similarity-based approach. However, its effectiveness depends on the availability of benchmark datasets and gene expression similarity.
With the increasing popularity of ensemble approaches, as a further enhancement, researchers are now focussing on the application of evolutionary algorithms (EAs) for ensemble model building [12]. EAs are optimization techniques inspired by natural selection and biological evolution. The EAs work by using operations like mutation and crossover for evolving a population of potential solutions over several generations, selecting the fittest individuals, to improve the overall performance of the model. EAs have also been used to identify an effective combination of methods for ensemble model building. For example, in [16], genetic algorithms and frequent itemset mining techniques are used to identify optimal combinations of methods for creating efficient yet concise ensembles for GRN inference using machine learning-based methods. While these methods perform well in terms of accuracy with the given data, their fitness functions may exhibit limitations in identifying novel interactions, especially when applied to real-world biological networks [22,23]. GENECI (GEne NEtwork Consensus Inference), is an evolutionary machine learning method designed to organize ensembles for analyzing outcomes from various existing reverse engineering methods. GENECI optimizes the consensus network by taking into account confidence levels and topological features utilizing a genetic algorithm. However, being primarily focused on machine learning and information theory-based methods, it has limitations in providing the diversity to the ensemble model [12]. Here, diversity refers to using different methods or algorithms considered within the ensemble framework. This diversity is crucial because different models are more likely to capture different characteristic of the underlying GRN, leading to more accurate and robust solutions.
This paper introduces a novel ensemble approach, called EvoFuzzy, for inferring consensus GRNs using an evolutionary and fuzzy logic-based algorithm for network aggregation. This approach, not limited to a single category of inference methods, combines the inferred networks from three distinct modelling approaches. We used Boolean, regression, and fuzzy algorithms, and improved upon our recently reported research [5,6,15] where each method was independently developed and validated. These models were selected not only for their complementary inference paradigms: Boolean captures discrete logic, regression models linear quantitative relationships, and fuzzy systems handle uncertainty through linguistic rules, but also because each addresses specific challenges in gene regulatory network inference. Together, they provide modelling diversity while maintaining computational efficiency, which is essential given the iterative nature of evolutionary algorithms. Compared to more complex alternatives like Bayesian networks or neural networks, which typically involve higher time complexity and parameter tuning, these methods allow faster convergence without compromising inference quality. Thus, the novelty of this proposed method lies in its ability to aggregate networks inferred from distinct modelling categories using the evolutionary and fuzzy concepts for ensembling. This is done by using the confidence levels of these networks input to a fuzzy trigonometric differential evolution that helps to eventually identify the optimal network. The initial population, obtained from each of the key modelling paradigms, is evolved using the fuzzy evolutionary algorithm-based aggregation to obtain a consensus network. This approach can be considered as a hybrid computational method that combines the optimization power of evolutionary algorithms with the ability of fuzzy logic to handle uncertainty and imprecise information, allowing for more flexible and adaptable solutions to complex problems, especially when dealing with real-world scenarios with vague or incomplete data. Essentially, using evolutionary algorithms helps to optimize the parameters of the fuzzy system to improve its performance. The key contributions of the research are
i.
A new network aggregation method that employs a fuzzy trigonometric differential evolution, which offers a more robust and flexible solution than traditional methods currently used to build consensus networks.
ii.
A novel fuzzy gene expression predictor, in which the confidence levels of networks are interpreted as regulatory relationship strengths and are used to predict gene expression levels.
The predicted gene expression levels for each individual network are evaluated by a fitness function to determine the optimal inferred network, the final consensus network. The effectiveness of our ensemble approach, particularly its novel use of the evolutionary algorithm and fuzzy gene expression predictor, is demonstrated by evaluating its performance on both simulated datasets and the real-world Escherichia coli SOS gene repair dataset.

2. Materials and Methods

Figure 1 is a schematic outline of the proposed inference approach, EvoFuzzy. The evolutionary network aggregation-based ensemble method has two main components: Initial population generation and evolutionary network aggregation, including a fuzzy gene expression predictor.

2.1. Evolutionary Network Aggregation-Based Ensemble Method

Initially, gene expression datasets were resampled, and the key inference methods were executed on the sub datasets to produce inferred networks and the confidence levels between genes, treated as individuals in a population (Figure 1). This process is considered as initial population generation for the subsequent evolutionary network aggregation. As described in previous studies [9,13], combining the outcome from a small number of diverse reverse engineering methods is more effective than aggregating results from many methods in ensemble methods. Expanding on this concept, our proposed ensemble method integrates three primary inference methods (Boolean, regression and fuzzy) that employ distinct modelling techniques. Each method offers its unique approach to solving GRN inference problems. The Boolean approach ensures computational efficiency by simplifying gene interactions into discrete logic, making it suitable for large-scale data. The regression-based method, using quantile regression, offers stable inference under noise by reducing parameter tuning uncertainty. The MICFuzzy method enhances efficiency and accuracy by capturing complex, non-linear regulatory patterns through fuzzy rule-based reasoning. These complementary methods together provide modelling diversity, robustness, and computational tractability, essential for iterative evolutionary algorithms. Further information regarding these methods is available in [5,6,15].

2.1.1. Generation of the Initial Population

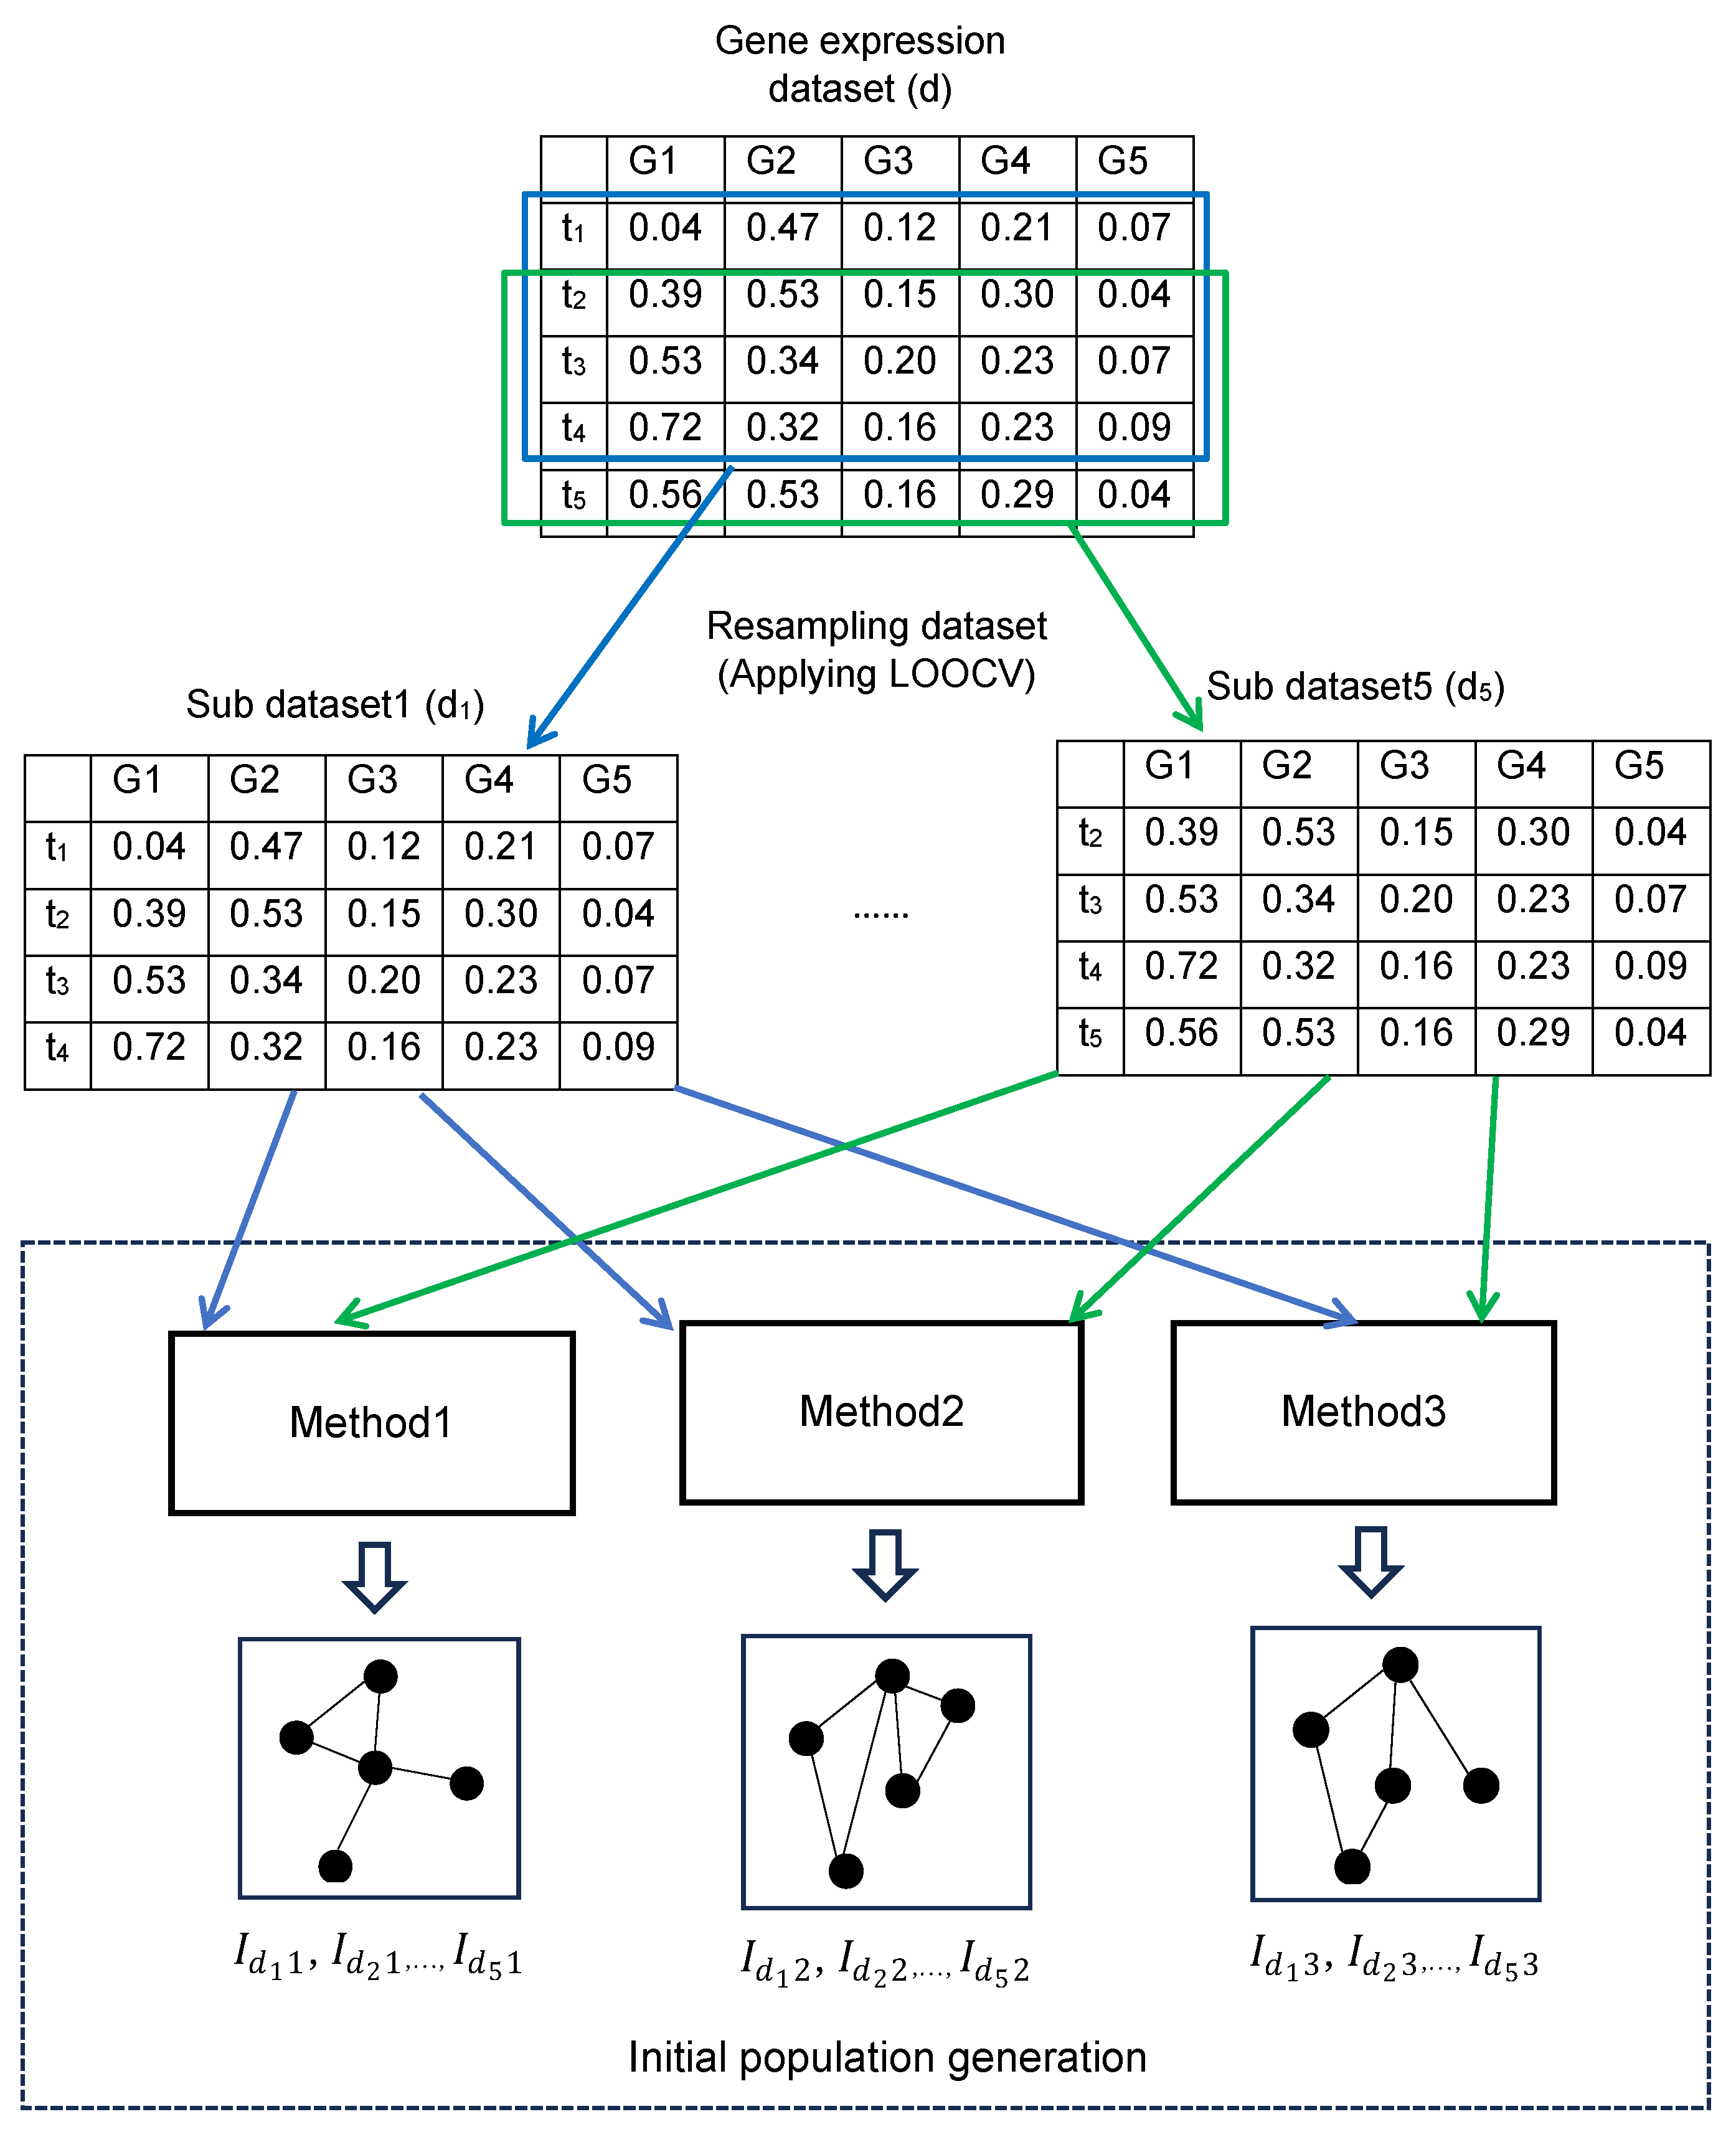
We developed a new method to initialize the population, utilizing a dataset resampling approach. In this method, a given gene expression dataset, d, is resampled using cross-validation techniques (Figure 2). Since gene expression datasets typically have limited sample sizes, we primarily employ Leave-One-Out cross-validation (LOOCV) to generate sub-datasets. Additionally, k-fold cross-validation is employed to further increase the population size, depending on the problem context. As demonstrated in previous studies [24], small sample size datasets can uncover valuable information, as opposed to using the entire dataset for GRN inference. Following resampling, the generated sub-datasets (dy) are executed on key inference methods. The network inferred using each method is then treated as an individual ( I d y x ) in a population where y represents the sub-dataset and x represents the method. An initial population is generated (Figure 2) by repeating this process for all generated sub-datasets. In each generated individual, the confidence levels between the genes are also evaluated and normalized to the [0, 1] scale (Figure 3).
The generated individuals are input into the evolutionary network aggregation to find the final consensus network.

2.1.2. Evolutionary Network Aggregation

Various evolutionary algorithms offer unique advantages. Genetic Algorithms (GA) are effective for complex optimization, using selection, crossover, and mutation, enabling the exploration of large search spaces [25]. Genetic Programming extends GA by evolving expressions or programs to discover new regulatory patterns [26]. Simulated Annealing helps escape local optima by probabilistically accepting solutions, and thus us useful for complex landscapes [27]. Particle Swarm Optimization, inspired by social behaviours, aids in efficient exploration and exploitation of the search space. However, Differential Evolution (DE) is especially well-suited for identifying the best individual in GRN reconstruction due to its efficiency in high-dimensional spaces [28,29]. In DE, mutations are generated by adding the weighted difference between two randomly selected population members to a third individual, rather than using predefined mutation probabilities as in GAs. This approach allows DE to explore the solution space more effectively, often leading to faster convergence with fewer parameters to tune compared to GAs [29]. In this research, we used a trigonometric differential evolution (TDE) based approach to build the final consensus genetic network.
TDE enhances DE by incorporating a trigonometric mutation operation (TMO), which improves convergence speed and robustness [30]. TDE uses trigonometric functions in the mutation process to better handle complex, multi-modal problems. Each generation involves creating a trial vector. In this research a trial vector is an individual with confidence levels on the association between each gene pair which are evaluated through mutation and crossover, evaluating its fitness, and replacing less fit individuals with individuals of higher fitness, ultimately leading to the best candidate solution. The specifics of the crossover, mutation, and fitness evaluation functions are detailed below.
Mutation: In DE, mutation is used to generate new candidate solutions (or trial vectors including confidence levels between genes) by perturbing existing ones. Mutation is defined as
V i , G + 1 = I r 1 , G + F   ( I r 2 , G I r 3 , G ) ,
where V i , G + 1 is the mutated vector or the new candidate solution. In TDE, the TMO enhances mutation by incorporating fitness values into the mutation process to improve convergence speed and search efficiency. The TMO is defined as
V i , G + 1 = 1 3 I r 1 , G + I r 2 , G + I r 3 , G + ( p r 2 p r 1 ) ( I r 1 , G   I r 2 , G )           + ( p r 3 p r 2 ) ( I r 3 , G   I r 2 , G ) + ( p r 2           p r 3 ) ( I r 1 , G   I r 3 , G ) ,
where
p r 1 = f I r 1 , G / p ,   p r 2 = f I r 2 , G / p , p r 3 = f I r 3 , G / p       p = | f I r 1 , G | + | f I r 2 , G | + | f I r 3 , G |   .
Here, the trial vector V i , G + 1 for the ith individual in generation G is generated by selecting three random individuals I r 1 , G   I r 2 , G   and I r 3 , G from the population, ensuring that the random set excludes the current target vector i, i.e., r1 ≠ r2 ≠ r3 ≠ i. f I r 1 , G , f I r 2 , G and f I r 3 , G are the calculated fitness values of the three selected random individuals. F is the scaling factor (typically between 0 and 1) that controls the magnitude of the mutation. In TDE, the algorithm uses both the traditional mutation operation (Equation (1)) and TMO (Equation (2)), with each being used based on a specified probability of occurrence.
Crossover: The crossover function is performed after the mutation vector has been generated. During this process, the mutation vector ( V i , j , G + 1 ) and the target vector ( I i , j , G ) are combined to create a trial vector U i , j , G + 1 , with the degree of mixing controlled by the crossover rate. The crossover function is described as follows:
U i , j , G + 1   = V i , j , G + 1 ,   R a n d ( j )     C R   o r   j   =   j r a n d     I i , j , G ,   R a n d ( j )   >   C R   a n d   j     j r a n d   .
For each parameter, a random number ( R a n d ( j)) is generated between 0 and 1. The variable j r a n d is a randomly selected index that ensures that the trial vector differs from the target vector. The crossover rate varies between 0 and 1. After generating the trial vector, the evaluated confidence levels of the trial vector are input into the fuzzy gene expression predictor.
Fuzzy gene expression predictor: The resulting confidence levels of a trial individual are utilized in the fuzzy gene expression predictor to predict gene expression levels. Unlike previous fuzzy methods [6], which consider only one or two factors, such as regulatory relationship strength and gene expression level, the proposed fuzzy approach evaluates regulatory influences between genes considering three factors: regulatory relationship strength; positional value; and gene expression level (Equation (4)). We enhanced the fuzzy approach (MICFuzzy) proposed in [6] by incorporating the confidence levels as the regulatory relationship strength between a regulatory gene and a target gene, as shown in Equation (1). Subsequently, we evaluated the regulatory influence by considering three factors: the regulatory relationship strength between an activator (positive) or repressor (negative) gene and the target gene; the expression levels of regulatory genes (activator-repressor pairs); and the positional value, which denotes the number of methods selecting a considered gene as a regulatory gene for a given target gene. While MICFuzzy [6] considered only the first two factors, our approach extends this by including the positional value to improve inference robustness and consensus evaluation.
R e g u l a t o r y   i n f l u e n c e = R e g u l a t o r y   R e l a t i o n s h i p   S t r e n g t h × P o s i t i o n a l   V a l u e   ×             G e n e   e x p r e s s i o n   l e v e l
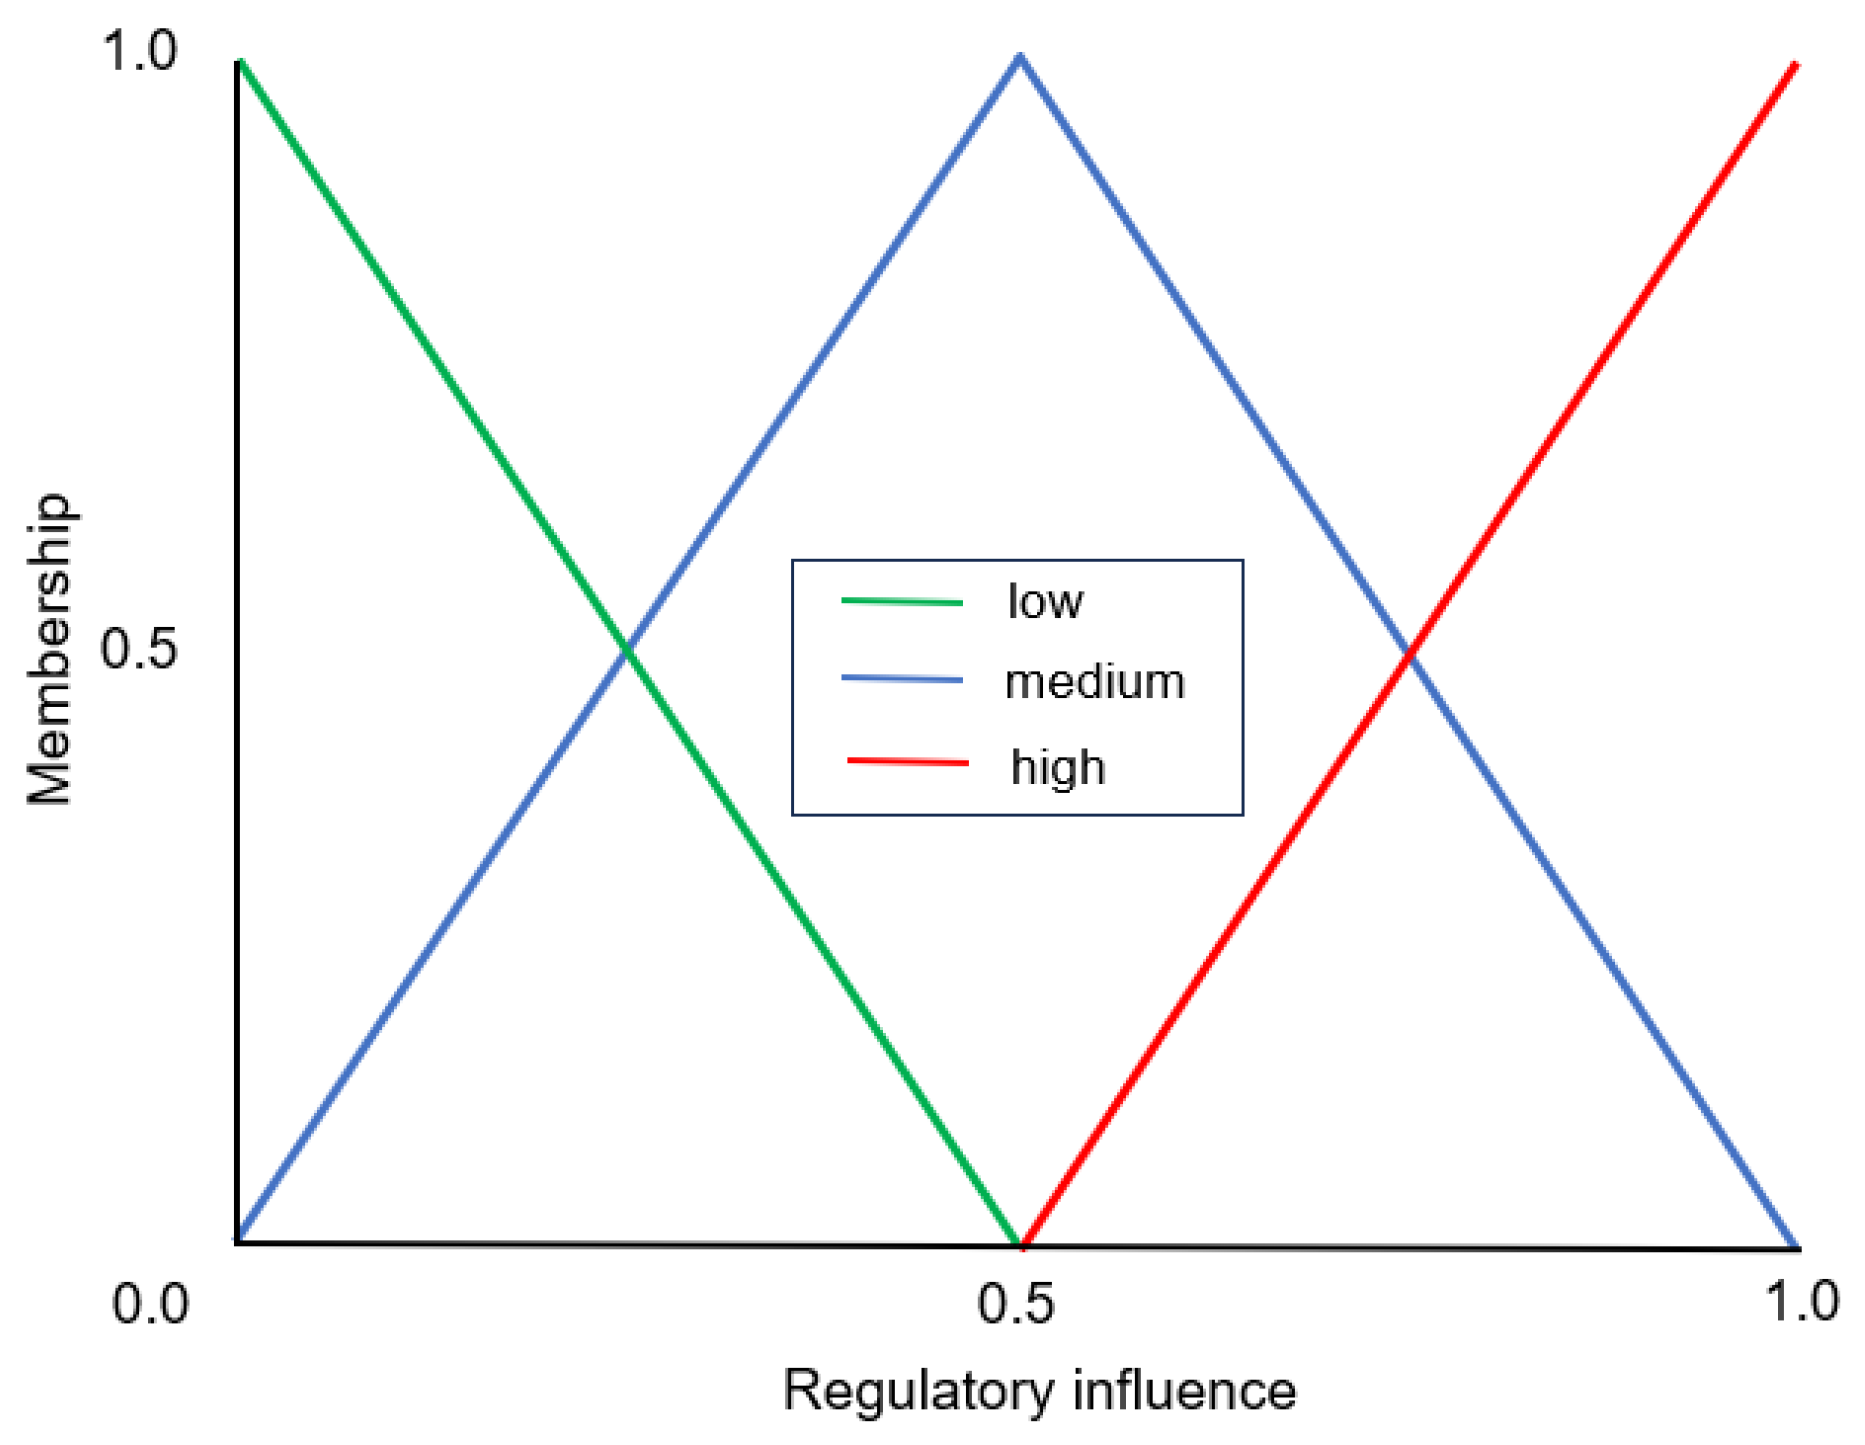
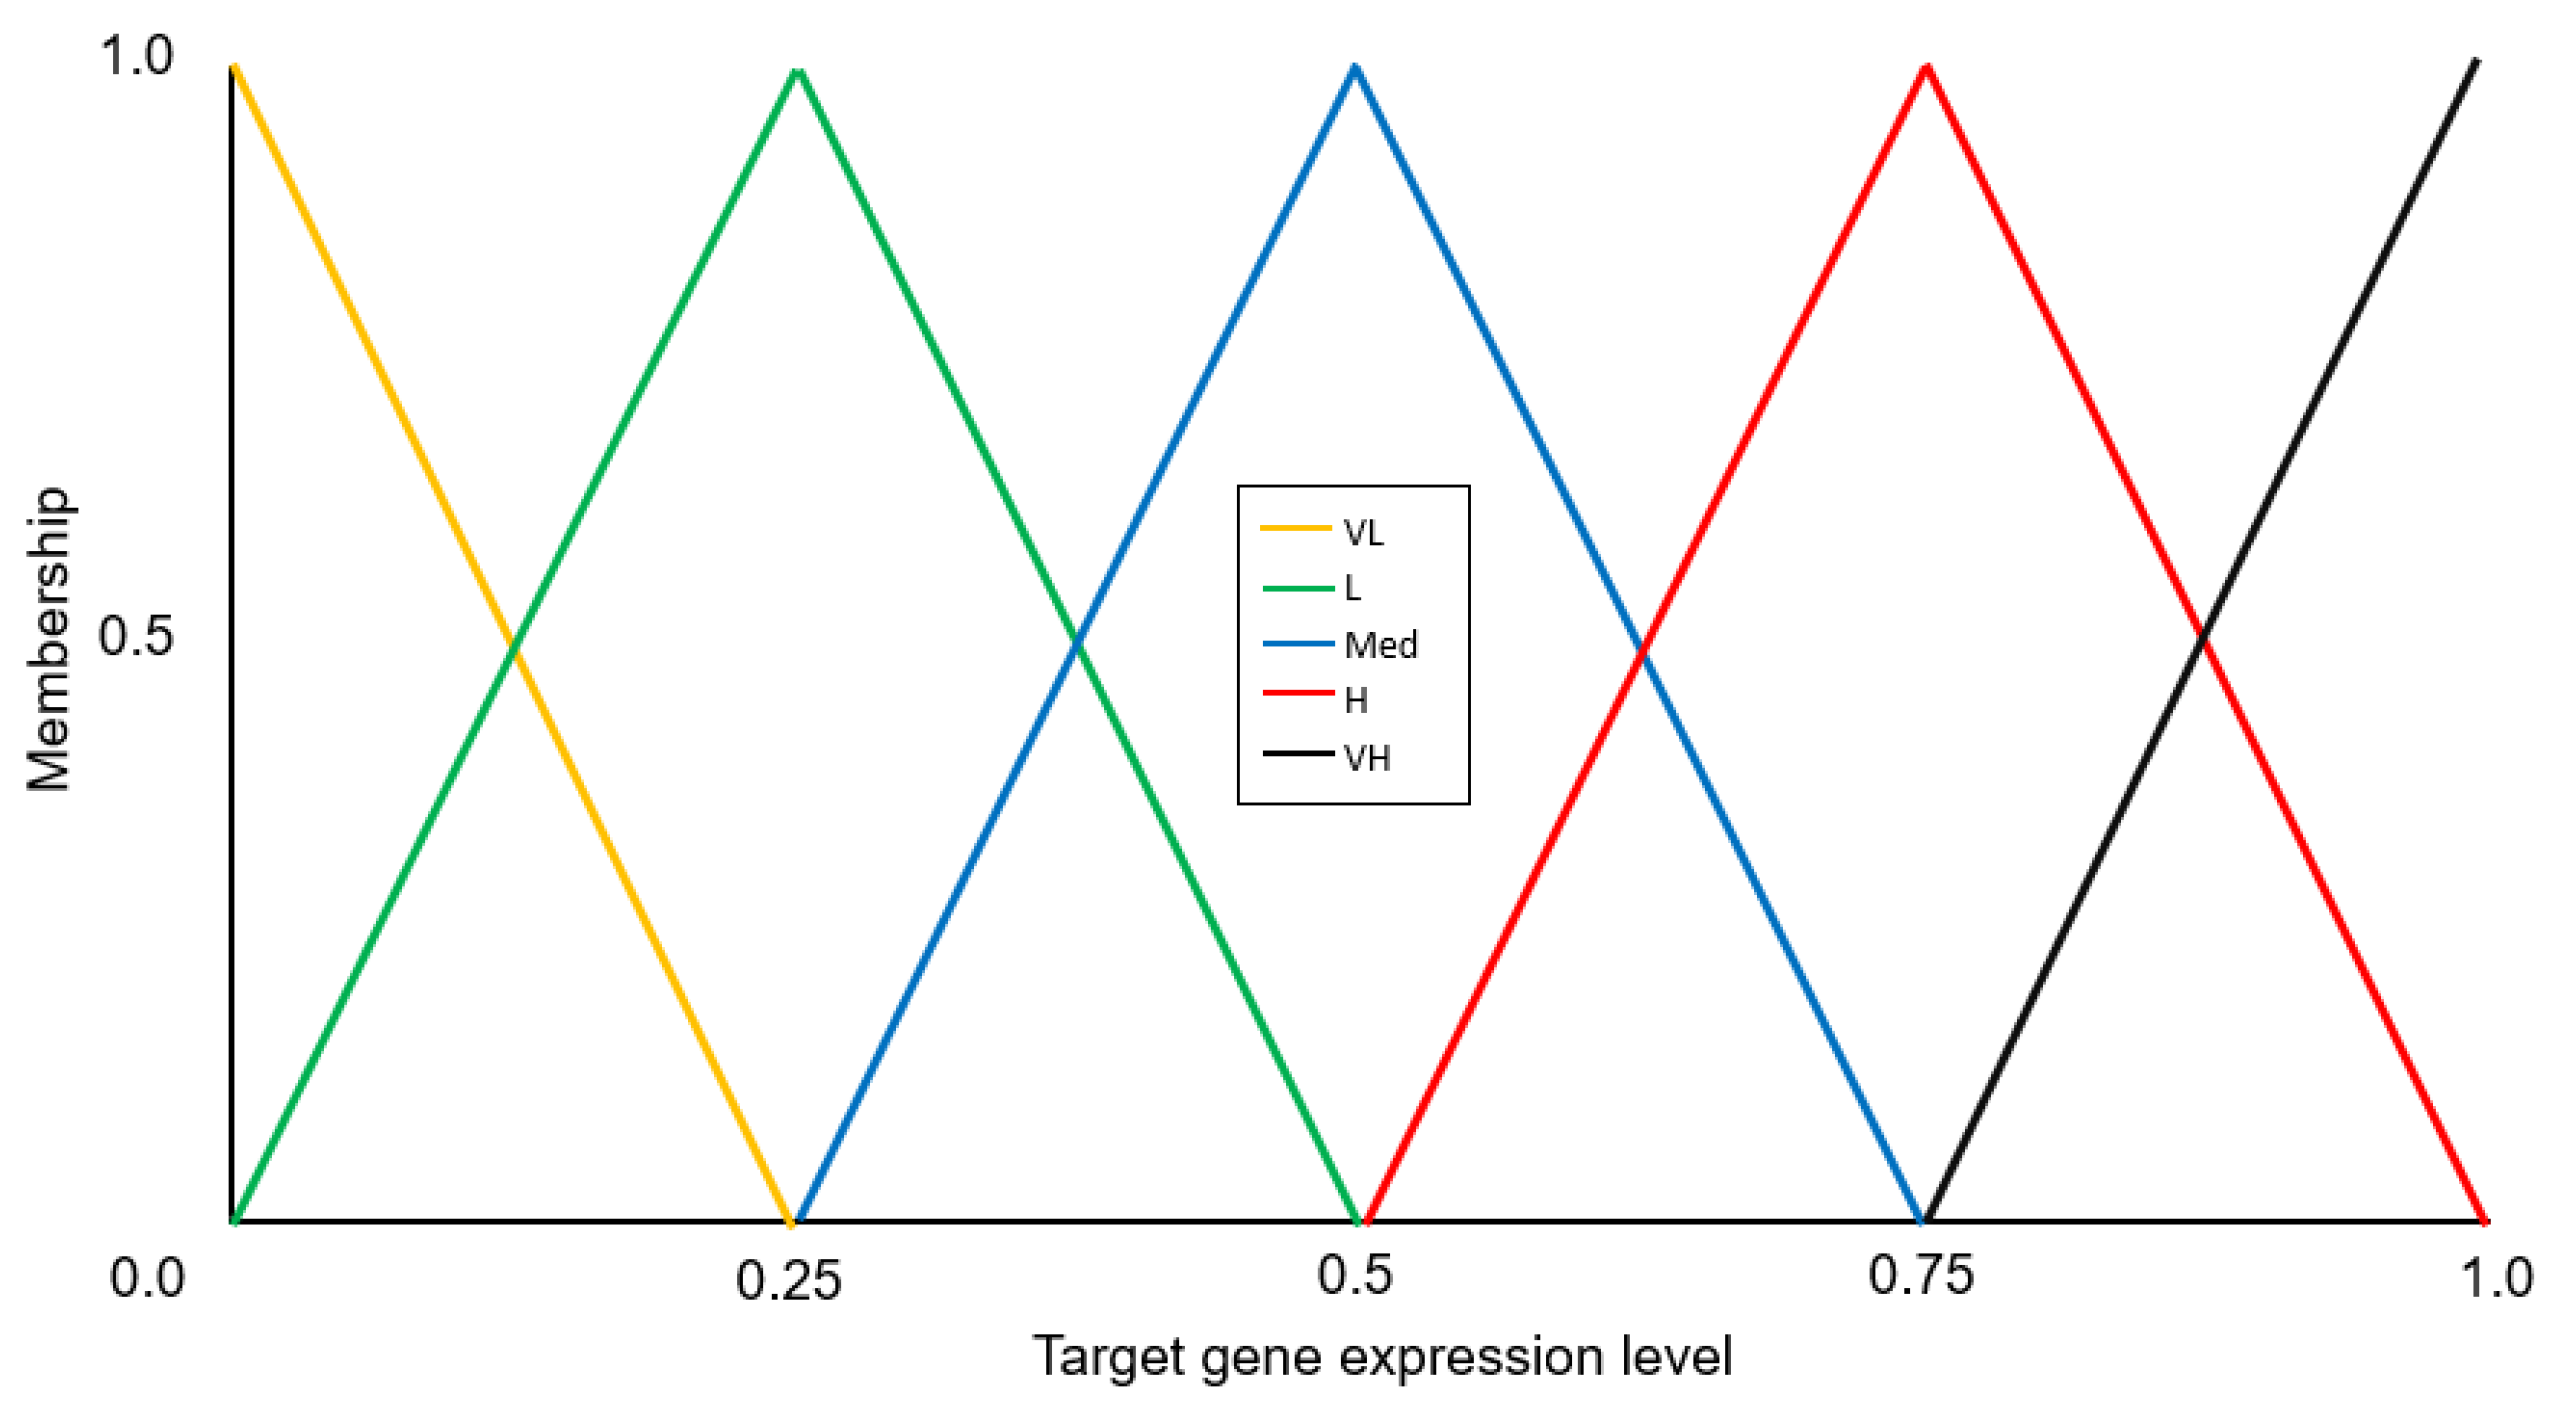
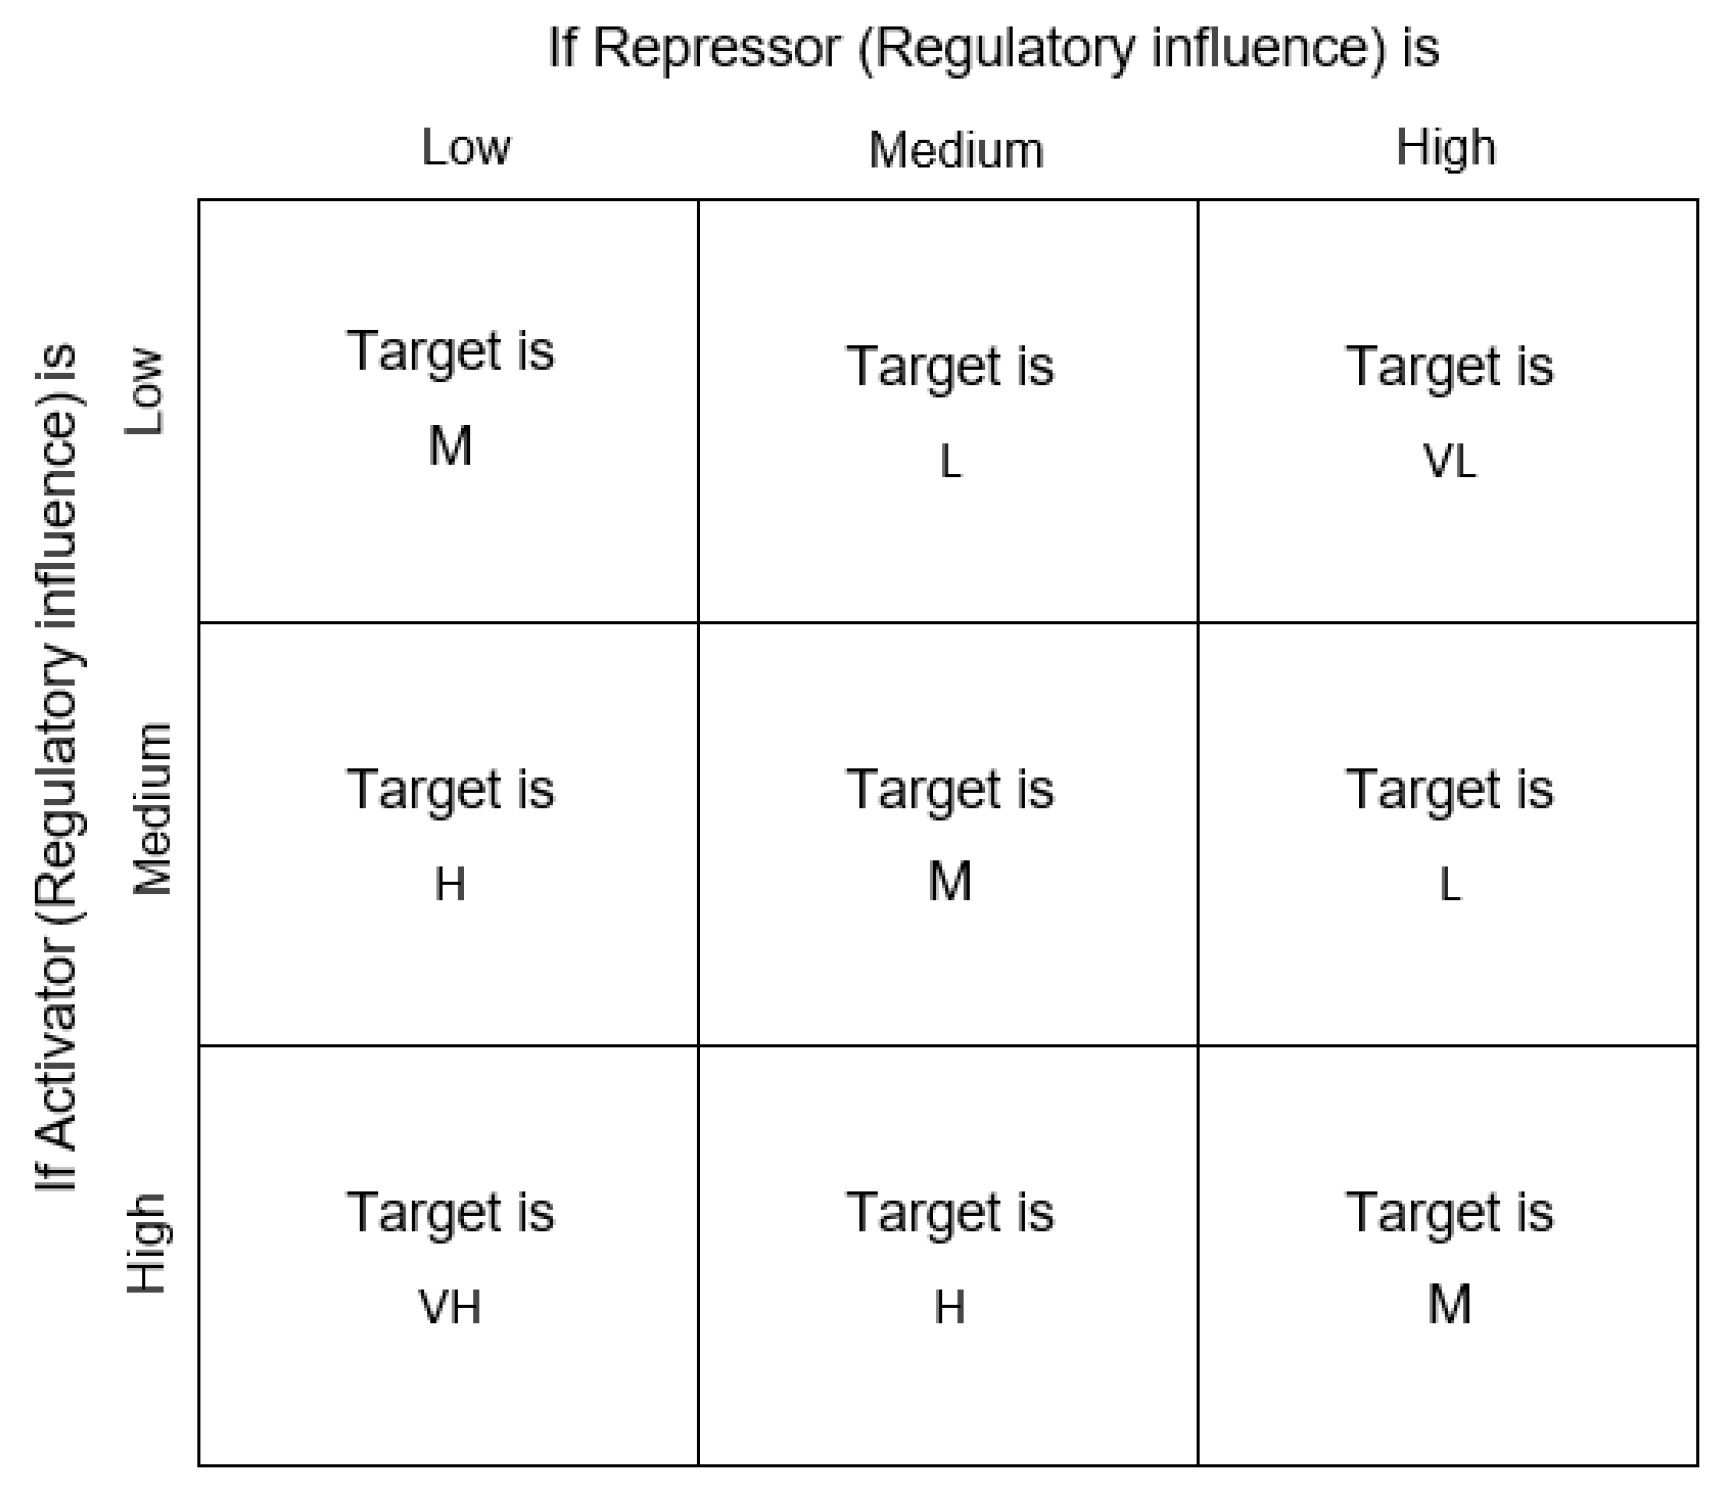
The evaluated regulatory influence of each regulatory gene is normalized using min-max normalization, where the values are adjusted to fall within the range [0, 1]. Subsequently, this normalized regulatory influence is transformed into three distinct levels—Low, Medium, or High—via fuzzification (Figure 4). As shown in Figure 4, if the normalized regulatory influence of an activator or repressor is 0.1, the corresponding fuzzified membership values would be Low = 0.8, Medium = 0.2, and High = 0. Genes with a confidence level of 0 with the target gene under consideration are excluded, and the repressor and activator gene pairs are formed from the remaining selected genes. We utilize a set of heuristic fuzzy rules, the activator/repressor regulatory rule, and discrete levels of input and output variables outlined in [6], to predict the expression level of the target gene. The expression level of the target gene is categorized into five discrete levels (Figure 5). For instance, as shown in Figure 6, we formulate a fuzzy rule [31] as follows:
“If the regulatory influence of an activator is Low AND the regulatory influence of the repressor is High, then the expression level of the target gene will be Very Low”.
The results from each fuzzy rule are aggregated using the bounded sum technique. Subsequently, the fuzzified output for the target gene is converted back to a precise value using the centroid defuzzification method [32]. This procedure is repeated until the expression level of the target gene has been estimated for each activator-repressor gene pair across all time points in the dataset. Then, the predicted gene expression values at each time point are input into the fitness function.
These predicted gene expression levels ( X k , i p r e   ( t ) ) are then utilized by the fitness function to identify the optimal individual, representing the best solution.
Model fitness evaluation: The choice between a trial and target individual depends on their fitness. The predicted expression values X k , i p r e   ( t )   are compared with the observed values X k , i e x p ( t ) to determine a model’s fitness. The predicted expression values X k , i p r e   ( t )   are evaluated using the novel fuzzy approach. This fitness function, previously used with successful results in earlier research [29], guides the evolutionary process by minimizing the normalized squared error between predicted and observed gene expression values, thereby ensuring accurate and biologically meaningful model selection with successful results:
f i =   k = 1 M t = 1 T X k , i p r e   ( t )     X k , i e x p ( t )   X k , i e x p   ( t ) 2   .
The first part of the function ( k = 1 M t = 1 T X k , i p r e   ( t )     X k , i e x p ( t )   X k , i e x p   ( t ) 2 ) represents the mean squared error (MSE), where M is the number of datasets and T is the number of time points.
Finally, after a specified number of generations, the optimal inferred network for the given problem context can be identified.

3. Results and Discussion

The effectiveness of the proposed method was evaluated through experiments conducted on simulated datasets, which were generated using the gene expression simulator GeneNetWeaver (GNW) [33], as well as real gene expression datasets derived from the SOS DNA repair network of E. coli [34].

3.1. Experiments on Simulated Datasets

The simulated datasets encompassed various network sizes, ranging from 20 to 100 genes. For each network size, datasets with varying numbers of time series were generated from five distinct networks (Net1, Net2, Net3, Net4, and Net5), depending on the required population size. The first three networks were extracted from the E. coli network, while the remaining two networks were derived from the yeast Saccharomyces cerevisiae cell-cycle network. For a 20-gene network, a dataset was generated with four different time series; for a 40-gene network, it consisted of eight time series. Similarly, for a 60-gene network, the number of time series was 12, and for an 80-gene and 100-gene networks, it was 16 and 20 time series, respectively.
For each dataset of different network sizes, leave-one-out cross-validation (LOOCV) was employed as a resampling technique to create sub-datasets, and the three modelling approaches were executed on each sub-dataset. This process was repeated for all five different networks generated at each network size. For instance, the number of sub-datasets generated for each 20-gene network is 84, given that the dataset contains four different time series with 21 time points in each. Following the analysis of the datasets generated from each network (e.g., 20-gene—Net1) using three inference approaches, the resulting inferred networks with confidence levels between genes were treated as individuals within the population. For the 20-gene Net1 dataset, the number of individuals obtained from one modelling approach was 84, and from all three modelling approaches, it was 252, constituting the population. Subsequently, after applying the evolutionary network aggregation approach and evaluating fitness, the best solution was taken. The performance of the proposed method was evaluated in terms of True Positive Rate (TPR) lowest False Positive Rate (FPR) and highest Structural Accuracy (Equations (6)–(8)):
T r u e   P o s i t i v e   R a t e = T P T P   +   F N   ,
F a l s e   P o s i t i v e   R a t e = F P F P + T N   ,
S t r u c t u r a l   A c c u r a c y = T P + T N T P + F P + F N + T N ,
where TP signifies the count of accurately identified true interactions within the inferred network, FP represents the quantity of falsely predicted regulations, TN denotes the number of correctly identified non-regulations, and FN indicates the number of absent edges existing in the target network but not present in the inferred network.
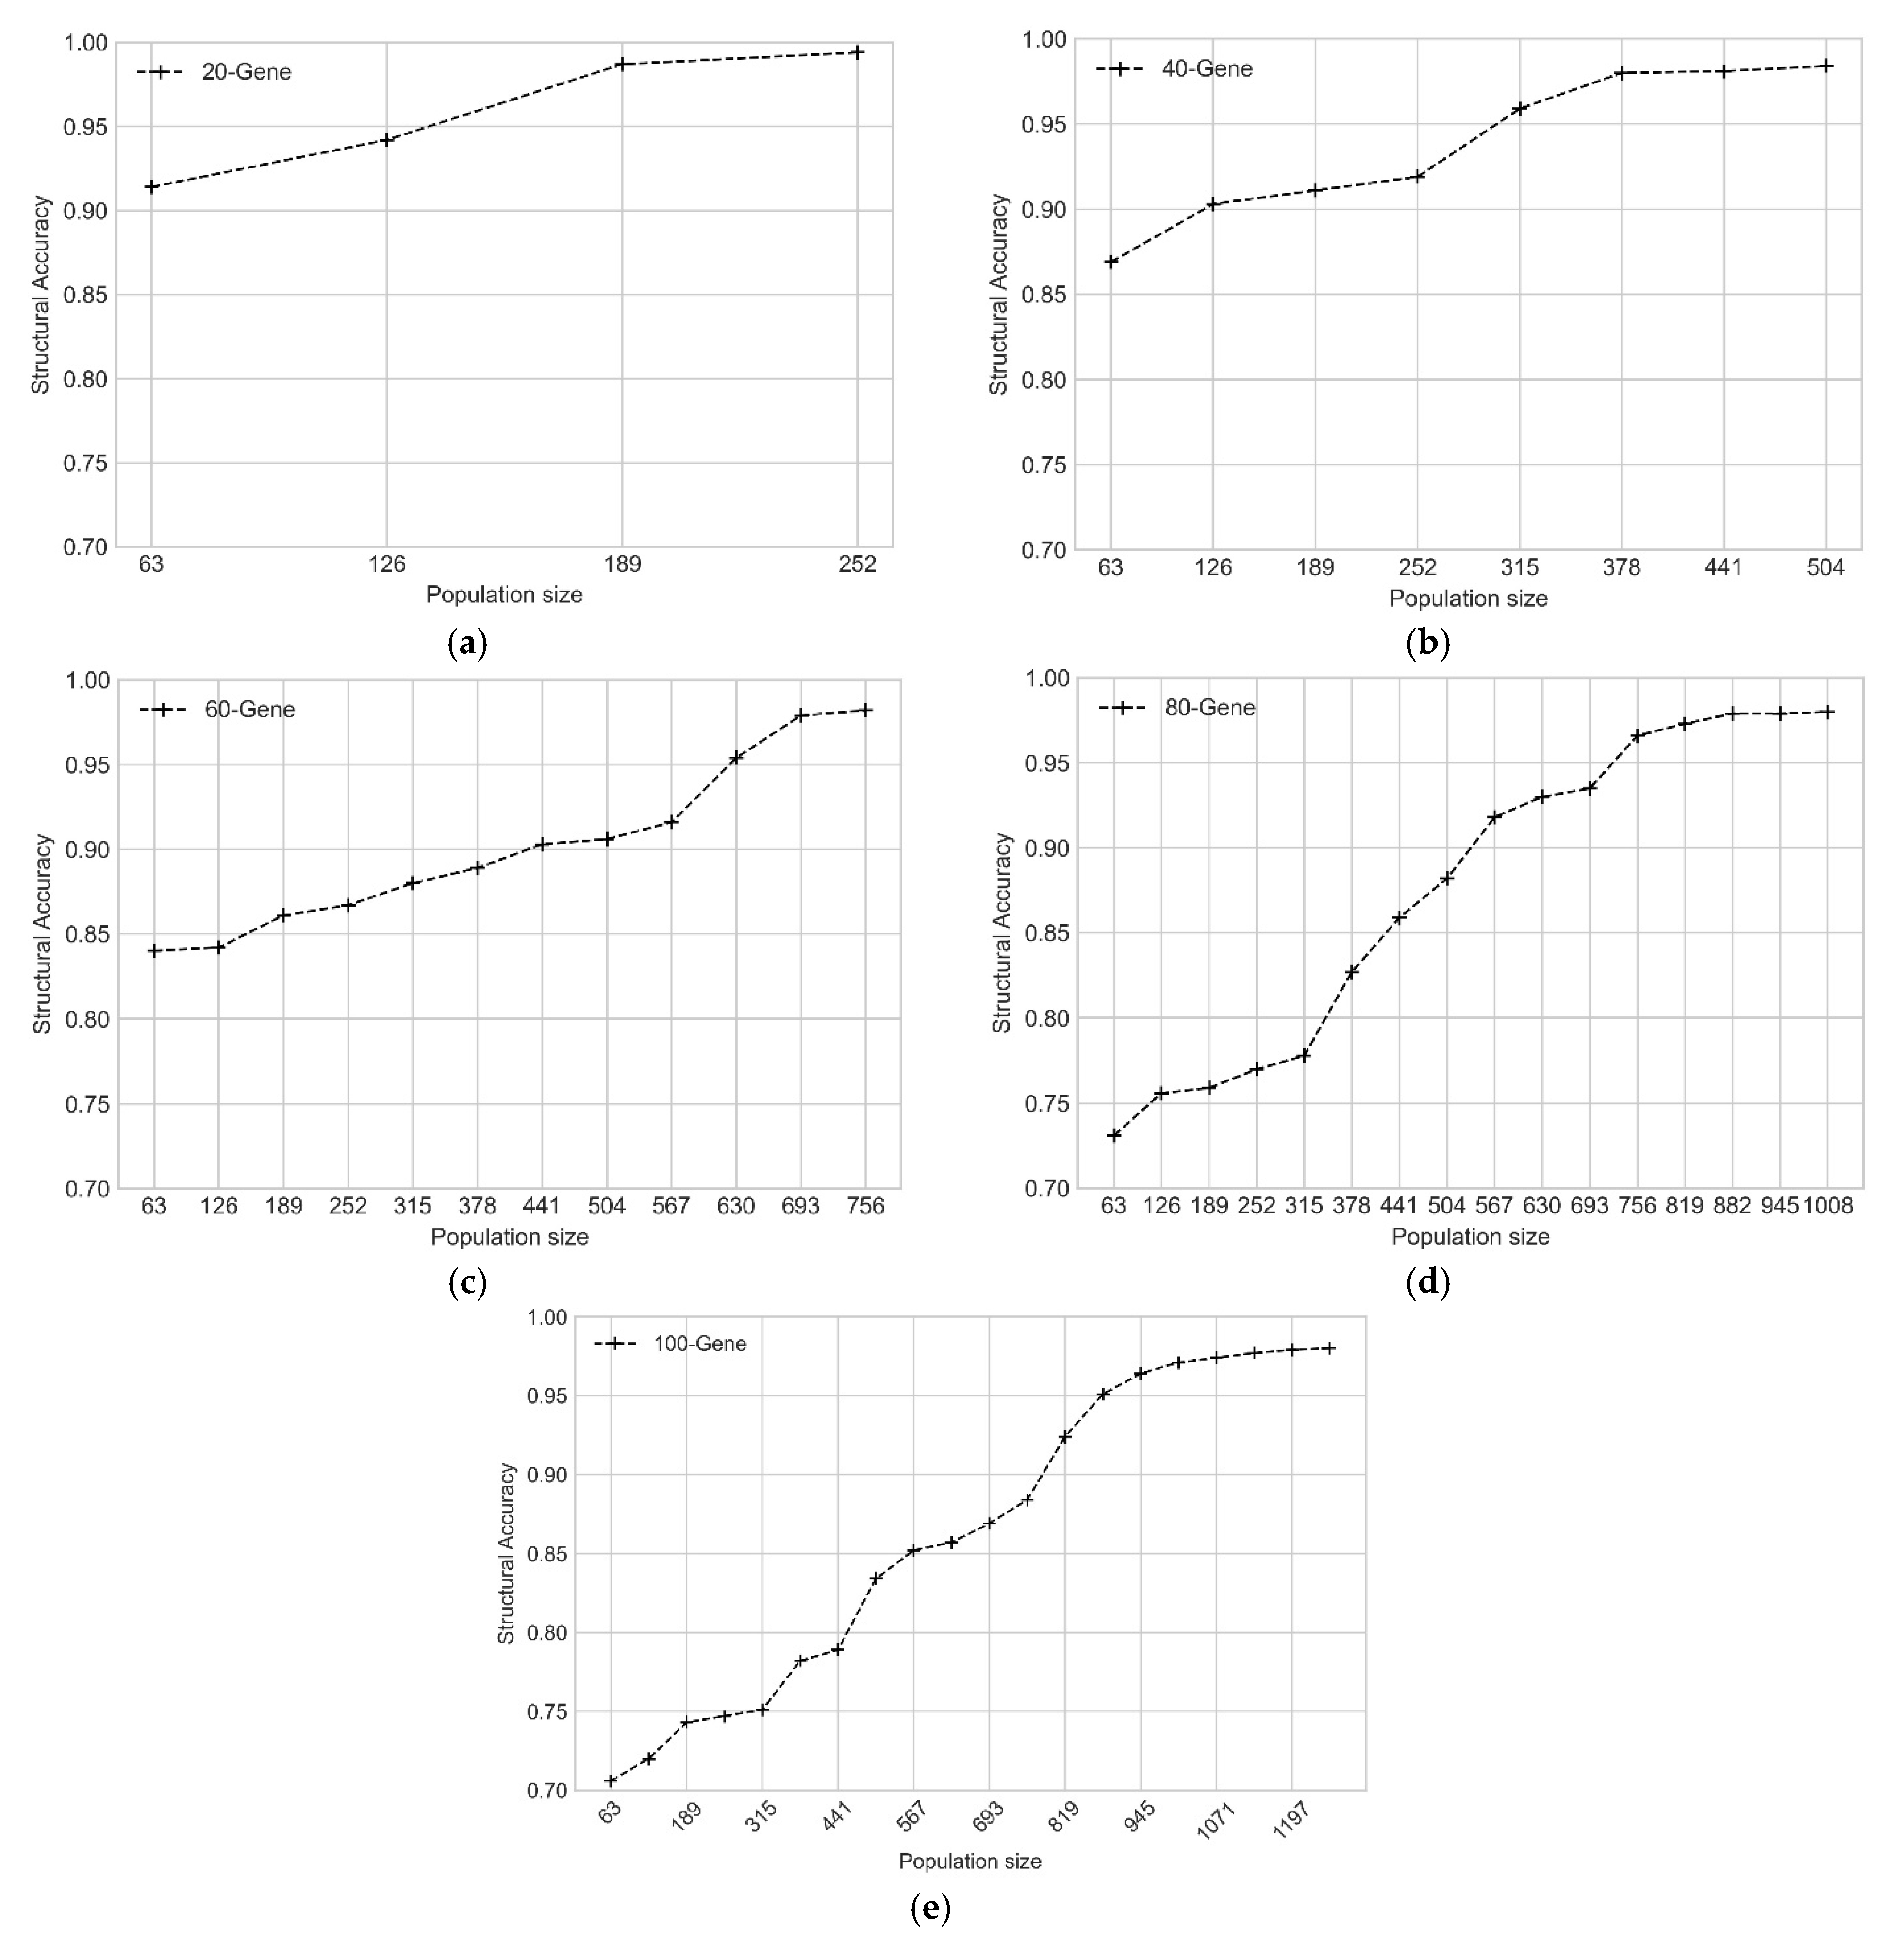
The process was carried out for all five networks, and the average Structural Accuracy calculated. For the 20-gene network, the best average Structural Accuracy achieved was 0.994 (Figure 7a). For the 40-gene, 60-gene, 80-gene, and 100-gene networks, it was 0.984, 0.981, 0.98, and 0.98, respectively. As the number of individuals or the population size increased for a network, the Structural Accuracy also increased (Figure 7).
We chose a specific number of individuals to strike a balance between efficiency and accuracy using the ensemble approach. This decision aims to achieve high accuracy within few generations (Table 1). For instance, in the case of the 20-gene network, the Structural Accuracy plateaued at 0.994 after the population size reached 252 individuals, with no notable further improvement (Figure 7a).
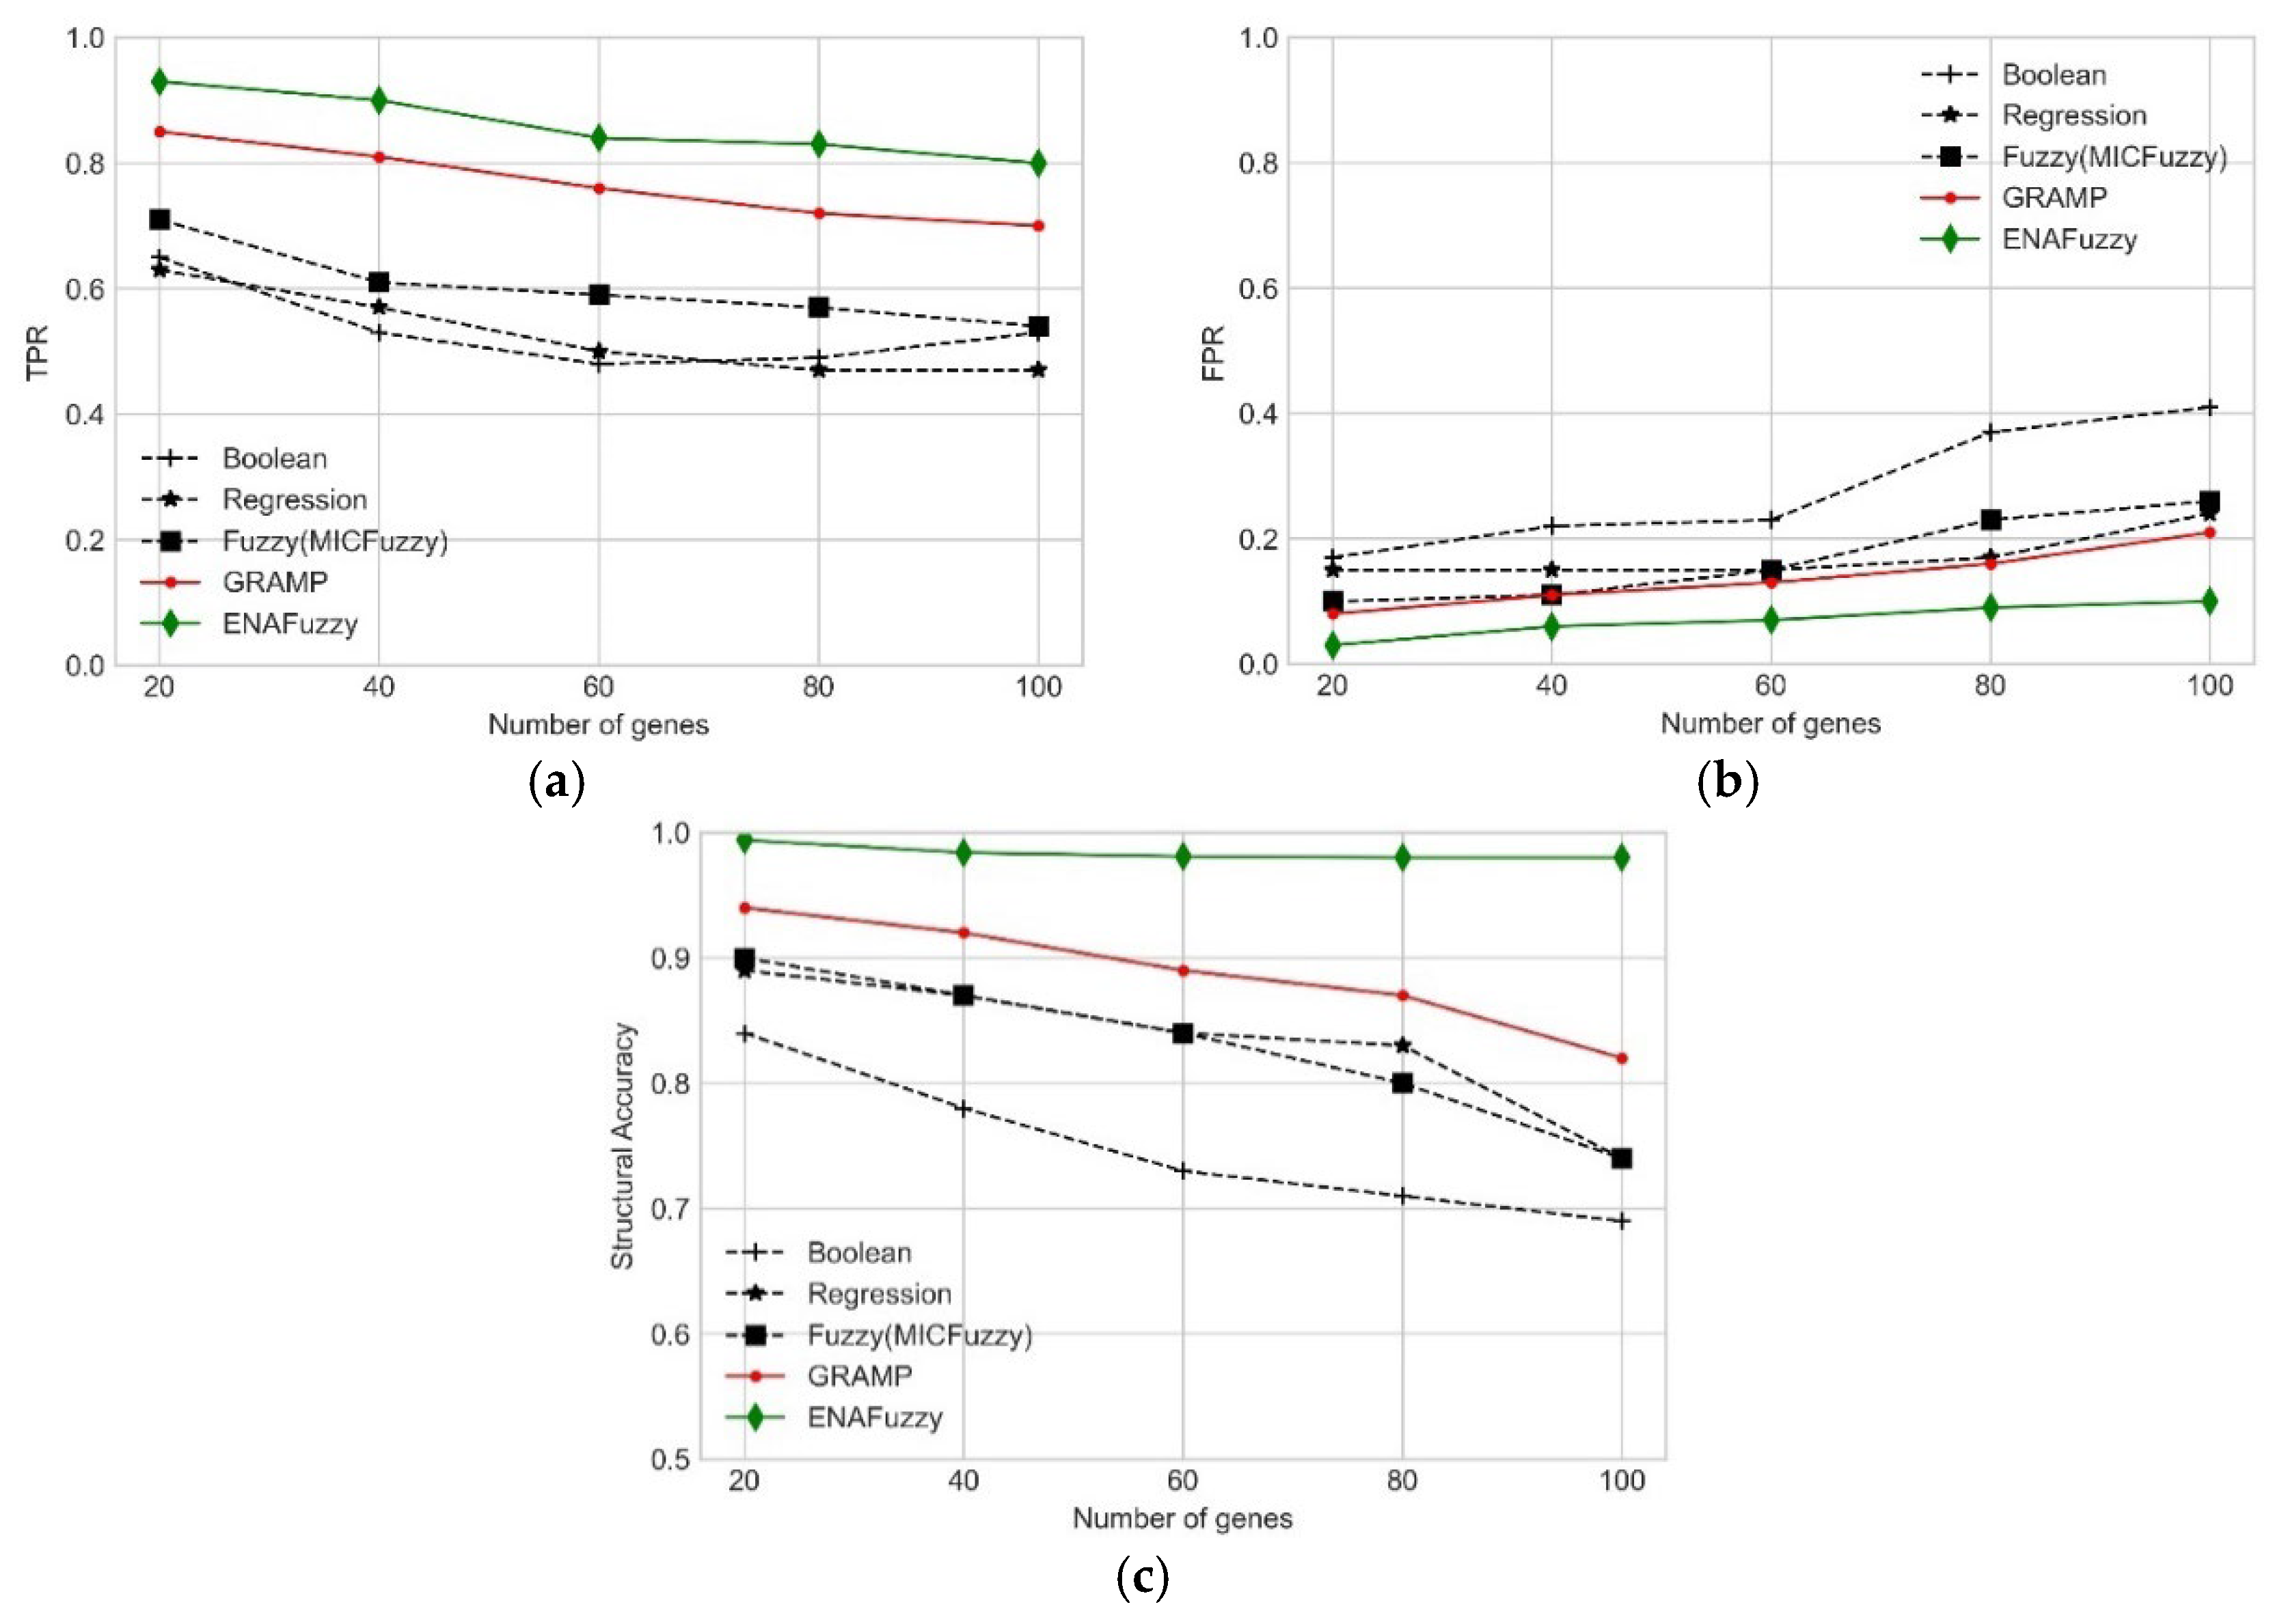
The performance of EvoFuzzy was compared with that of the individual key inference methods Boolean, regression, and fuzzy (MICFuzzy), as well as the existing ensemble approach GRAMP. GRAMP and EvoFuzzy exhibited better accuracy than the individual methods, highlighting the effectiveness of ensemble modelling over single modelling approaches. However, the proposed method demonstrated superior performance in terms of TPR, FPR, and Structural Accuracy than the individual and alternative ensemble approaches across gene regulatory networks of sizes ranging from 20 to 100 genes (Figure 8).
As the key modelling approaches yield nearly optimal results, the number of generations necessary is low (Table 1), and high Structural Accuracy can be attained even with few individuals (Figure 7). In the inference of a 20-gene network, for instance, a Structural Accuracy of approximately 0.92 was achieved with only 63 individuals (Figure 7a). Similarly, for both 40-gene and 60-gene networks, a Structural Accuracy of over 0.84 was obtained with 63 individuals (Figure 7b,c), while with the same population size the Structural Accuracy for an 80-gene network and a 100-gene network was 0.73 and 0.70, respectively (Figure 7d,e). Since irrelevant genes are filtered out by the evolutionary approach, the required time for the proposed fuzzy approach is reduced.
The time complexity of EvoFuzzy is O(nanrntg), where n represents the number of genes and t denotes the sample size of the dataset, g stands for the number of generations, na indicates the number of selected activators, and nr is the number of selected repressors. Comparatively, the time complexity of EvoFuzzy is higher than that of the MICFuzzy approach, which is O(nanrnt). Nonetheless, despite this disparity, the effectiveness measured in TPR, FPR, and Structural Accuracy achieved by EvoFuzzy surpasses those of MICFuzzy (Figure 8). This finding further demonstrates that relying on a single approach, such as in MICFuzzy, to derive the confidence levels between genes, based solely on the maximal information coefficient from information theory, is not as effective as obtaining these confidence levels through an ensemble approach.

Comparison of Performance with Other State-of-the-Art Methods

We conducted a performance evaluation of our proposed ensemble method in terms of Structural Accuracy, contrasting it with existing high-performing ensemble methods such as GENEI3, dynGENEI3, BTNET and GRAMP, along with the key inference approaches considered in our study. Our proposed approach was applied to three simulated datasets derived from two distinct networks. The first network pertains to a yeast cell-cycle network [35], comprising nine genes and 17 interactions. This network encompasses two expression datasets, CDC-15 and CDC-28, with 24 and 17-time samples, respectively [36]. The second network corresponds to the S. cerevisiae G1 cell-cycle network [37], encompassing 11 genes and 22 interactions. The dataset extracted from this network contains expression values observed over 18 time points. The availability of performance results of GENEI3, dynGENEI3, and BTNET on these datasets allowed for a direct comparison [38].
In this study, when generating the population within the CDC-15 network inference problem context, we produced 24 individuals from each model following the application of leave-one-out cross-validation for the given dataset, resulting in a total of 72 individuals from all three models combined. Subsequently, to further enhance the Structural Accuracy, we implemented three-fold cross-validation, resulting in the generation of eight sub-datasets from which an additional 24 individuals were derived. The population size for the CDC-15 network inference problem was thus 96. The same procedure was employed for the CDC-28 and S. cerevisiae networks, yielding 69 and 72 individuals, respectively. The maximum Structural Accuracy was achieved within 581, 266, and 470 generations for the CDC-15, CDC-28, and S. cerevisiae datasets, respectively (Table 2 and Table 3).
When comparing performance based on Structural Accuracy, individual methods such as regression and fuzzy exhibited higher performance than GENEI3, dynGENEIE3, and BTNET. Although these latter methods are well-known ensemble approaches, they essentially utilize a single method within their ensemble. However, both demonstrate higher accuracy than individual methods, suggesting that aggregating diverse inference methods can enhance overall accuracy of the ensemble model. GRAMP and EvoFuzzy produced significantly better results than GENEI3, dynGENEI3, and BTNET. The proposed method surpassed all ensemble and individual methods, achieving a Structural Accuracy of 0.98 in CDC-28 and S. cerevisiae network inference and 0.84 in CDC-15 network inference (Table 3).
While GRAMP relies on a dataset similarity-based approach for network aggregation, EvoFuzzy surpassed GRAMP by utilizing an evolutionary network aggregation method. This result is evidenced by EvoFuzzy outperforming GRAMP across all of the aforementioned network inference approaches, demonstrating the effectiveness of the fuzzy TDE-based network aggregation approach. Combining the ensemble effect with the fuzzy method further enhanced overall method performance.

3.2. Experiments on Real Gene Expression Datasets

In the subsequent phase of experiments, the performance of EvoFuzzy was assessed by implementing it on an eight-gene network derived from the SOS DNA repair network in E. coli. This network contains eight genes: uvrD, lexA, umuD, recA, uvrA, uvrY, ruvA, and polB. The SOS DNA dataset was collected from four distinct experiments conducted under various UV light conditions, with gene expression measured at 50-time points evenly distributed at six-minute intervals [35]. In this evaluation, standard performance metrics cannot be utilized since the true structure of the network is unknown. Hence, the performance of the proposed method was evaluated based on the nine known regulatory interactions among the eight genes, as illustrated in Figure 9.
The performance of the proposed method was assessed against the individual methods: Boolean, regression, and fuzzy (MICFuzzy), as well as the existing ensemble method, GRAMP. Evaluations were conducted using a combined dataset from all four experiments of the SOS DNA repair network. A 10-fold cross-validation was applied, resulting in the generation of 20 sub-datasets. Subsequently, 60 individuals were produced from all three different methods, yielding the highest number of true regulations. Compared to all three individual methods, GRAMP and EvoFuzzy produced the highest performance by correctly identifying eight regulations. Most algorithms utilized in this study lack the ability to infer the regulation types of gene interactions, and do not offer insights into the number of false regulations detected. MICFuzzy correctly identified six regulations and three of these had the correct regulation type, activation or inhibition, but the algorithm produced eight false regulations. MICFuzzy disregarded self-regulations [6]. GRAMP accurately identified the regulation types (activation or inhibition), including self-regulations, of five out of the eight regulations, but it yielded 11 false regulations [13]. However, in comparison to MICFuzzy and GRAMP, EvoFuzzy correctly determined regulatory type of five regulations including the self-regulation lexA → lexA, and produced fewer false positives, six (Table 4). This observation further highlights the promising potential of the EvoFuzzy approach for GRN inference in real-world applications. Given that the current evaluation is limited to small- to medium-sized networks, comprehensive assessment of its performance and scalability on larger, more complex gene networks will be undertaken in future work. This study serves as a proof of concept, and we are also exploring the use of parallelization techniques to enhance computational efficiency, particularly in the population evaluation and fitness computation steps, which are currently under investigation but not implemented in the present version.
The current study employs standard parameters for the trigonometric differential evolution algorithm (i.e., scaling factor F = 0.5, crossover rate CR = 0.9, TMO probability = 0.5) without conducting comprehensive hyperparameter optimization. This represents a methodological assumption that may impact the generalizability of results across diverse biological contexts. Although TDE is known for its reduced parameter sensitivity compared to genetic algorithms, systematic parameter tuning could potentially yield further performance improvements. Hyperparameter optimization was not the primary focus of this initial algorithmic development, as our work concentrated on establishing the foundational ensemble aggregation methodology and demonstrating its effectiveness relative to existing approaches. Future research should prioritize sensitivity analysis of evolutionary algorithm parameters and automated hyperparameter optimization to maximize the method’s adaptability across different gene regulatory network inference scenarios.

4. Conclusions

This paper introduces EvoFuzzy, an innovative method that significantly enhances the accuracy and effectiveness of GRN inference. By integrating an evolutionary algorithm and a fuzzy method, EvoFuzzy combines the strengths of different modelling approaches, in this case Boolean, regression, and fuzzy, to create a more robust solution than the other approaches used. The evolutionary algorithm-based network aggregation method, utilizing trigonometric differential evolution, aggregates the networks inferred from these diverse approaches into consensus networks. These aggregated networks are then employed within a fuzzy gene expression predictor to interpret the strength of regulatory relationships and predict gene expression levels to input a fitness function to identify the optimal solution. This process culminates in the construction of a final consensus network that represents a reliable and accurate GRN for the given data. The role of the fuzzy trigonometric differential evolution method in refining and aggregating multiple network outputs into a single, optimal consensus network is key to the success of EvoFuzzy. Extensive testing demonstrated that EvoFuzzy outperformed state-of-the-art methods on both simulated datasets and the real-world E. coli SOS gene repair dataset, making it a powerful tool for GRN inference. In future work, we aim to extend the application of EvoFuzzy to the inference of larger-scale gene regulatory networks involving more than 100 genes. This expansion will allow us to address more complex biological systems and further validate the scalability and robustness of our approach in real-world scenarios.

Author Contributions

Conceptualization, H.N.G., J.G., M.C., S.L. and J.H.; methodology, H.N.G., J.G., M.C., S.L. and J.H.; software, H.N.G. and J.G.; validation, H.N.G., J.G. and M.C.; formal analysis, H.N.G.; investigation, H.N.G. and M.C.; resources, H.N.G. and M.C.; data curation, H.N.G.; writing—original draft preparation, H.N.G., J.G. and M.C.; writing—review and editing, H.N.G., M.C., S.L. and J.H.; visualization, H.N.G.; supervision, M.C., S.L. and J.H.; project administration, H.N.G., M.C., S.L. and J.H.; funding acquisition, M.C., S.L. and J.H. All authors have read and agreed to the published version of the manuscript.

Funding

This research did not receive any specific grant from funding agencies in the public, commercial, or not-for-profit sectors.

Data Availability Statement

The EvoFuzzy software (version 2) and datasets are available at https://federation.figshare.com/articles/software/EvoFuzzy_-_Source_code_and_datasets/27200241. Accessed date: 13 October 2025.

Conflicts of Interest

Author Jennifer Hallinan was employed by the company BioThink Pty Ltd. The remaining authors declare that the research was conducted in the absence of any commercial or financial relationships that could be construed as a potential conflict of interest.

References

  1. Peter, I.S. The function of architecture and logic in developmental gene regulatory networks. Curr. Top. Dev. Biol. 2020, 139, 267–295. [Google Scholar]
  2. Marku, M.; Pancaldi, V. From time-series transcriptomics to gene regulatory networks: A review on inference methods. PLOS Comput. Biol. 2023, 19, e1011254. [Google Scholar] [CrossRef]
  3. Lei, J.; Cai, Z.; He, X.; Zheng, W.; Liu, J. An approach of gene regulatory network construction using mixed entropy optimizing context-related likelihood mutual information. Bioinformatics 2023, 39, btac717. [Google Scholar] [CrossRef]
  4. Gamage, H.N.; Chetty, M.; Shatte, A.; Hallinan, J. An Efficient Boolean Modelling Approach for Genetic Network Inference. In Proceedings of the IEEE Conference on Computational Intelligence in Bioinformatics and Computational Biology (CIBCB), Melbourne, Australia, 13–15 October 2021. [Google Scholar]
  5. Gamage, H.N.; Chetty, M.; Shatte, A.; Hallinan, J. Filter feature selection based Boolean Modelling for Genetic Network Inference. Biosystems 2022, 221, 104757. [Google Scholar] [CrossRef]
  6. Gamage, H.N.; Chetty, M.; Lim, S.; Hallinan, J. MICFuzzy: A maximal information content based fuzzy approach for reconstructing genetic networks. PLoS ONE 2023, 18, e0288174. [Google Scholar] [CrossRef]
  7. Marbach, D.; Prill, R.J.; Schaffter, T.; Mattiussi, C.; Floreano, D.; Stolovitzky, G. Revealing strengths and weaknesses of methods for gene network inference. Biophys. Comput. Biol. 2010, 107, 6286–6291. [Google Scholar] [CrossRef] [PubMed]
  8. Marbach, D.; Costello, J.C.; Küffner, R.; Vega, N.M.; Prill, R.J.; Camacho, D.M.; Allison, K.R.; Kellis, M.; Collins, J.J.; Stolovitzky, G. Wisdom of crowds for robust gene network inference. Nat. Methods 2012, 9, 796–804. [Google Scholar] [CrossRef] [PubMed]
  9. Hase, T.; Ghosh, S.; Yamanaka, R.; Kitano, H. Harnessing Diversity towards the Reconstructing of Large Scale Gene Regulatory Networks. PLOS Comput. Biol. 2013, 9, e1003361. [Google Scholar] [CrossRef]
  10. Shen, B.; Coruzzi, G.; Shasha, D. EnsInfer: A simple ensemble approach to network inference outperforms any single method. BMC Bioinform. 2023, 24, 114. [Google Scholar] [CrossRef]
  11. Alawad, D.M.; Katebi, A.; Kabir, M.W.U.; Hoque, M.T. AGRN: Accurate gene regulatory network inference using ensemble machine learning methods. Bioinform. Adv. 2023, 3, vbad032. [Google Scholar] [CrossRef]
  12. Segura-Ortiz, A.; García-Nieto, J.; Aldana-Montes, J.F.; Navas-Delgado, I. GENECI: A novel evolutionary machine learning consensus-based approach for the inference of gene regulatory networks. Comput. Biol. Med. 2023, 155, 106653. [Google Scholar] [CrossRef]
  13. Gamage, H.N.; Chetty, M.; Lim, S.; Hallinan, J. GRAMP: A gene ranking and model prioritisation framework for building consensus genetic networks. Knowl. Based Syst. 2024, 302, 112374. [Google Scholar] [CrossRef]
  14. Gamage, H.N.; Chetty, M.; Shatte, A.; Hallinan, J. Ensemble Regression Modelling for Genetic Network Inference. In Proceedings of the IEEE Conference on Computational Intelligence in Bioinformatics and Computational Biology (CIBCB), Ottawa, ON, Canada, 15–17 August 2022. [Google Scholar]
  15. Gamage, H.N.; Chetty, M.; Lim, S.; Hallinan, J.; Nguyen, H. A Robust Ensemble Regression Model for Reconstructing Genetic Networks. In Proceedings of the International Joint Conference on Neural Networks (IJCNN), Gold Coast, Australia, 18–23 June 2023. [Google Scholar]
  16. Huynh-Thu, V.A.; Irrthum, A.; Wehenkel, L.; Geurts, P. Inferring Regulatory Networks from Expression Data Using Tree-Based Methods. PLoS ONE 2010, 5, e12776. [Google Scholar] [CrossRef]
  17. Breiman, L. Random Forests. Mach. Learn. 2001, 45, 5–32. [Google Scholar] [CrossRef]
  18. Huynh-Thu, V.A.; Geurts, P. dynGENIE3: Dynamical GENIE3 for the inference of gene networks from time series expression data. Sci. Rep. 2018, 8, 3384. [Google Scholar] [CrossRef] [PubMed]
  19. Park, S.; Kim, J.M.; Shin, W.; Han, S.W.; Jeon, M.; Jang, H.J.; Jang, I.-S.; Kang, J. BTNET: Boosted tree based gene regulatory network inference algorithm using time-course measurement data. BMC Syst. Biol. 2018, 12, 20–77. [Google Scholar] [CrossRef]
  20. Aluru, M.; Shrivastava, H.; Chockalingam, S.P.; Shivakumar, S.; Aluru, S. EnGRaiN: A supervised ensemble learning method for recovery of large-scale gene regulatory networks. Bioinformatics 2022, 38, 1312–1319. [Google Scholar] [CrossRef] [PubMed]
  21. Åkesson, J.; Lubovac-Pilav, Z.; Magnusson, R.; Gustafsson, M. ComHub: Community predictions of hubs in gene regulatory networks. BMC Bioinform. 2021, 22, 58. [Google Scholar] [CrossRef] [PubMed]
  22. Peignier, S.; Sorin, B.; Calevro, F. Ensemble Learning Based Gene Regulatory Network Inference. In Proceedings of the in 2021 IEEE 33rd International Conference on Tools with Artificial Intelligence (ICTAI), Washington, DC, USA, 1–3 November 2021. [Google Scholar]
  23. Fujii, C.; Kuwahara, H.; Yu, G.; Guo, L.; Gao, X. Learning gene regulatory networks from gene expression data using weighted consensus. Neurocomputing 2017, 220, 23–33. [Google Scholar] [CrossRef]
  24. Ruyssinck, J.; Huynh-Thu, V.A.; Geurts, P.; Dhaene, T.; Demeester, P.; Saeys, Y. NIMEFI: Gene Regulatory Network Inference using Multiple Ensemble Feature Importance Algorithms. PLoS ONE 2014, 9, e92709. [Google Scholar] [CrossRef]
  25. Liu, J.; Chi, Y.; Zhu, C. A Dynamic Multiagent Genetic Algorithm for Gene Regulatory Network Reconstruction Based on Fuzzy Cognitive Maps. IEEE Trans. Fuzzy Syst. 2016, 24, 419–431. [Google Scholar] [CrossRef]
  26. Prachedes, L.N.S.; Silva, J.E.H.D.; Bernardino, H.S.; Oliveira, I.L.D. High-performance cartesian genetic programming on GPU for the inference of gene regulatory networks using scRNA-seq time-series data. In Proceedings of the Genetic and Evolutionary Computation Conference Companion, Boston, MA, USA, 9–13 July 2022. [Google Scholar]
  27. Deng, X.; Wen, Z.; Wang, Y.; Xiang, P. An Improved PSO Algorithm Based on Mutation Operator and Simulated Annealing. Int. J. Multimed. Ubiquitous Eng. 2015, 10, 369–380. [Google Scholar] [CrossRef]
  28. Fefelov, A.; Lytvynenko, V.; Voronenko, M.; Babichev, S.; Osypenko, V. Reconstruction of the Gene Regulatory Network by Hybrid Algorithm of Clonal Selection and Trigonometric Differential Evolution. In Proceedings of the 2018 IEEE 38th International Conference on Electronics and Nanotechnology (ELNANO), Kyiv, Ukraine, 24–26 April 2018. [Google Scholar]
  29. Gill, J.; Chetty, M.; Shatte, A.; Hallinan, J. Combining kinetic orders for efficient S-System modelling of gene regulatory network. Biosystems 2022, 220, 104736. [Google Scholar] [CrossRef] [PubMed]
  30. Fan, H.-Y.; Lampinen, J. A Trigonometric Mutation Operation to Differential Evolution. J. Glob. Optim. 2003, 27, 105–129. [Google Scholar] [CrossRef]
  31. Reynolds, N.; O’SHaughnessy, A.; Hendrich, B. Transcriptional repressors: Multifaceted regulators of gene expression. Development 2013, 140, 505–512. [Google Scholar] [CrossRef]
  32. Raza, K. Fuzzy logic based approaches for gene regulatory network inference. Artif. Intell. Med. 2019, 97, 189–203. [Google Scholar] [CrossRef]
  33. Schaffter, T.; Marbach, D.; Floreano, D. GeneNetWeaver: In silico benchmark generation and performance profiling of network inference methods. Bioinformatics 2011, 27, 2263–2270. [Google Scholar] [CrossRef]
  34. Ronen, M.; Rosenberg, R.; Shraiman, B.I.; Alon, U. Assigning numbers to the arrows: Parameterizing a gene regulation network by using accurate expression kinetics. Biol. Sci. 2002, 99, 10555–10560. [Google Scholar] [CrossRef]
  35. Simon, I.; Barnett, J.; Hannett, N.; Harbison, C.T.; Rinaldi, N.J.; Volkert, T.L.; Wyrick, J.; Zeitlinger, D.K.; Gifford, T.S. Jaakkola and R. A. Young, “Serial regulation of transcriptional regulators in the yeast cell cycle. Cell 2001, 106, 697–708. [Google Scholar] [CrossRef]
  36. Spellman, P.T.; Sherlock, G.; Zhang, M.Q.; Iyer, V.R.; Anders, K.; Eisen, M.B.; Brown, P.O.; Botstein, D.; Futcher, B. Comprehensive Identification of Cell Cycle–regulated Genes of the Yeast Saccharomyces cerevisiae by Microarray Hybridization. Mol. Biol. Cell 2017, 9, 12. [Google Scholar] [CrossRef]
  37. Rubiolo, M.; Milone, D.H.; Stegmayer, G. Extreme learning machines for reverse engineering of gene regulatory networks from expression time series. Bioinformatics 2018, 34, 1253–1260. [Google Scholar] [CrossRef] [PubMed]
  38. Barman, S.; Kwon, Y.-K. A neuro-evolution approach to infer a Boolean network from time-series gene expressions. Bioinformatics 2020, 36 (Suppl. S2), i762–i769. [Google Scholar] [CrossRef] [PubMed]
Figure 1. Schematic diagram of the proposed method, EvoFuzzy. EvoFuzzy has two main components: Initial population generation and evolutionary network aggregation. First, gene expression datasets are sampled to generate multiple sub-datasets, which are then input to key inference methods, i.e., Boolean, regression, and fuzzy, to create a population of inferred networks consisting of confidence levels [0, 1] of interactions between genes. An example network (individual) consisting of confidence levels, generated using one of the inference methods is given inside initial population. In the fuzzy trigonometric differential evolution, each generation involves creating a trial vector, representing an individual with confidence levels between gene pairs, after undergoing mutation and crossover operations. The gene expression values for each gene in the trial individual are then predicted using a fuzzy gene expression predictor, which are then used to determine the fitness function. Based on the fitness function, an optimal final network is inferred.
Biomedinformatics 05 00059 g001
Figure 2. Example of initial population generation. The gene expression dataset, denoted as d, comprises five genes and five-time samples, and undergoes resampling using Leave-One-Out cross-validation (LOOCV). This process results in the creation of five different sub-datasets, d1, d2, d3, d4, and d5. Subsequently, three inference methods—Method1, Method2, and Method3—are executed on each of these sub-datasets to generate individuals, I d y x , where y represents the sub-dataset and x represents the method. From each method, a total of five individuals are generated (i.e., from Method1 the generated individuals are, I d 1 1 , I d 2 1 , I d 3 1 , I d 4 1 , I d 5 1 ).
Biomedinformatics 05 00059 g002
Figure 3. Example representation of an individual ( I d 1 1 ). Each individual consists of the confidence values [0, 1] calculated for each gene pair in the network (i.e., confidence value between G1 → G5 is 0.3).
Biomedinformatics 05 00059 g003
Figure 4. The fuzzy membership function of the regulatory influence of repressors and activators, with three distinct levels: Low, Medium, and High.
Biomedinformatics 05 00059 g004
Figure 5. The fuzzy membership function of target gene expression levels consists of six discrete levels: VL for Very Low, L for Low, Med for Medium, H for High, and VH for Very High.
Biomedinformatics 05 00059 g005
Figure 6. The fuzzy decision rule matrix predicts the expression level of a target gene based on the regulatory influence of activator and repressor gene pairs.
Biomedinformatics 05 00059 g006
Figure 7. Variation in Structural Accuracy with population size across GRNs of different sizes: (a) 20-gene; (b) 40-gene; (c) 60-gene; (d) 80-gene; (e) 100-gene. The Structural Accuracy increases with increasing population size in gene regulatory networks ranging from 20 to 100 genes.
Biomedinformatics 05 00059 g007
Figure 8. Performance analysis of individual and ensemble methods. Comparison of (a) true positive rate (b) false positive rate, (c) Structural Accuracy of GRN inference methods based on: Boolean, regression, and fuzzy (MICFuzzy) models, the GRAMP ensemble method, and the proposed method, EvoFuzzy.
Biomedinformatics 05 00059 g008
Figure 9. The reconstructed SOS DNA repair network from EvoFuzzy. (a) The target network structure: true regulations predicted by EvoFuzzy denoted by green lines with their identified regulation type. (b) Both true and false regulations inferred by EvoFuzzy, where blue lines denote accurately inferred regulations, and red dashed lines signify false predictions. The arrows and barred lines in the figure, respectively, represent positive and negative interactions.
Biomedinformatics 05 00059 g009
Table 1. Population size and corresponding number of generations for achieving maximum Structural Accuracy across gene networks ranging from 20 to 100 genes.
Number of GenesPopulation SizeNumber of Generations
20252308
40504761
607561194
8010082831
10012606115
Table 2. Population sizes and their corresponding numbers of generations required to achieve maximum Structural Accuracy for the CDC-15, CDC-28, and S. cerevisiae networks.
NetworkPopulation SizeNumber of Generations
CDC-15 (9-gene)96581
CDC-28 (9-gene)69266
S. cerevisiae (11-gene)72470
Table 3. Structural Accuracies of small-scale real gene networks.
MethodCDC-15 (9-Gene)CDC-28 (9-Gene)S. cerevisiae (11-Gene)
GENIE30.610.540.67
dynGENIE30.610.560.67
BTNET0.580.570.69
Boolean0.540.590.69
Regression0.700.800.74
Fuzzy (MICFuzzy)0.740.770.76
GRAMP0.810.940.90
EvoFuzzy0.840.980.98
Table 4. Comparison of true regulations inferred by the EvoFuzzy with other methods in the SOS DNA repair network.
RegulationBooleanRegressionFuzzy (MICFuzzy)GRAMPEvoFuzzy
lexA → uvrDyy yy
lexA → lexAyy yy
lexA→ umuDy yyy
lexA → recA yyyy
lexA → uvrAyyyyy
lexA → uvrYy yyy
lexA → ruvA
lexA → polB yyyy
recA → lexA yyy
Disclaimer/Publisher’s Note: The statements, opinions and data contained in all publications are solely those of the individual author(s) and contributor(s) and not of MDPI and/or the editor(s). MDPI and/or the editor(s) disclaim responsibility for any injury to people or property resulting from any ideas, methods, instructions or products referred to in the content.