Development of a Machine Learning-Based Predictive Model for Urinary Tract Infection Risk in Patients with Vitamin D Deficiency: A Multidimensional Clinical Data Analysis
Abstract
1. Introduction
2. Materials and Methods
- 1.
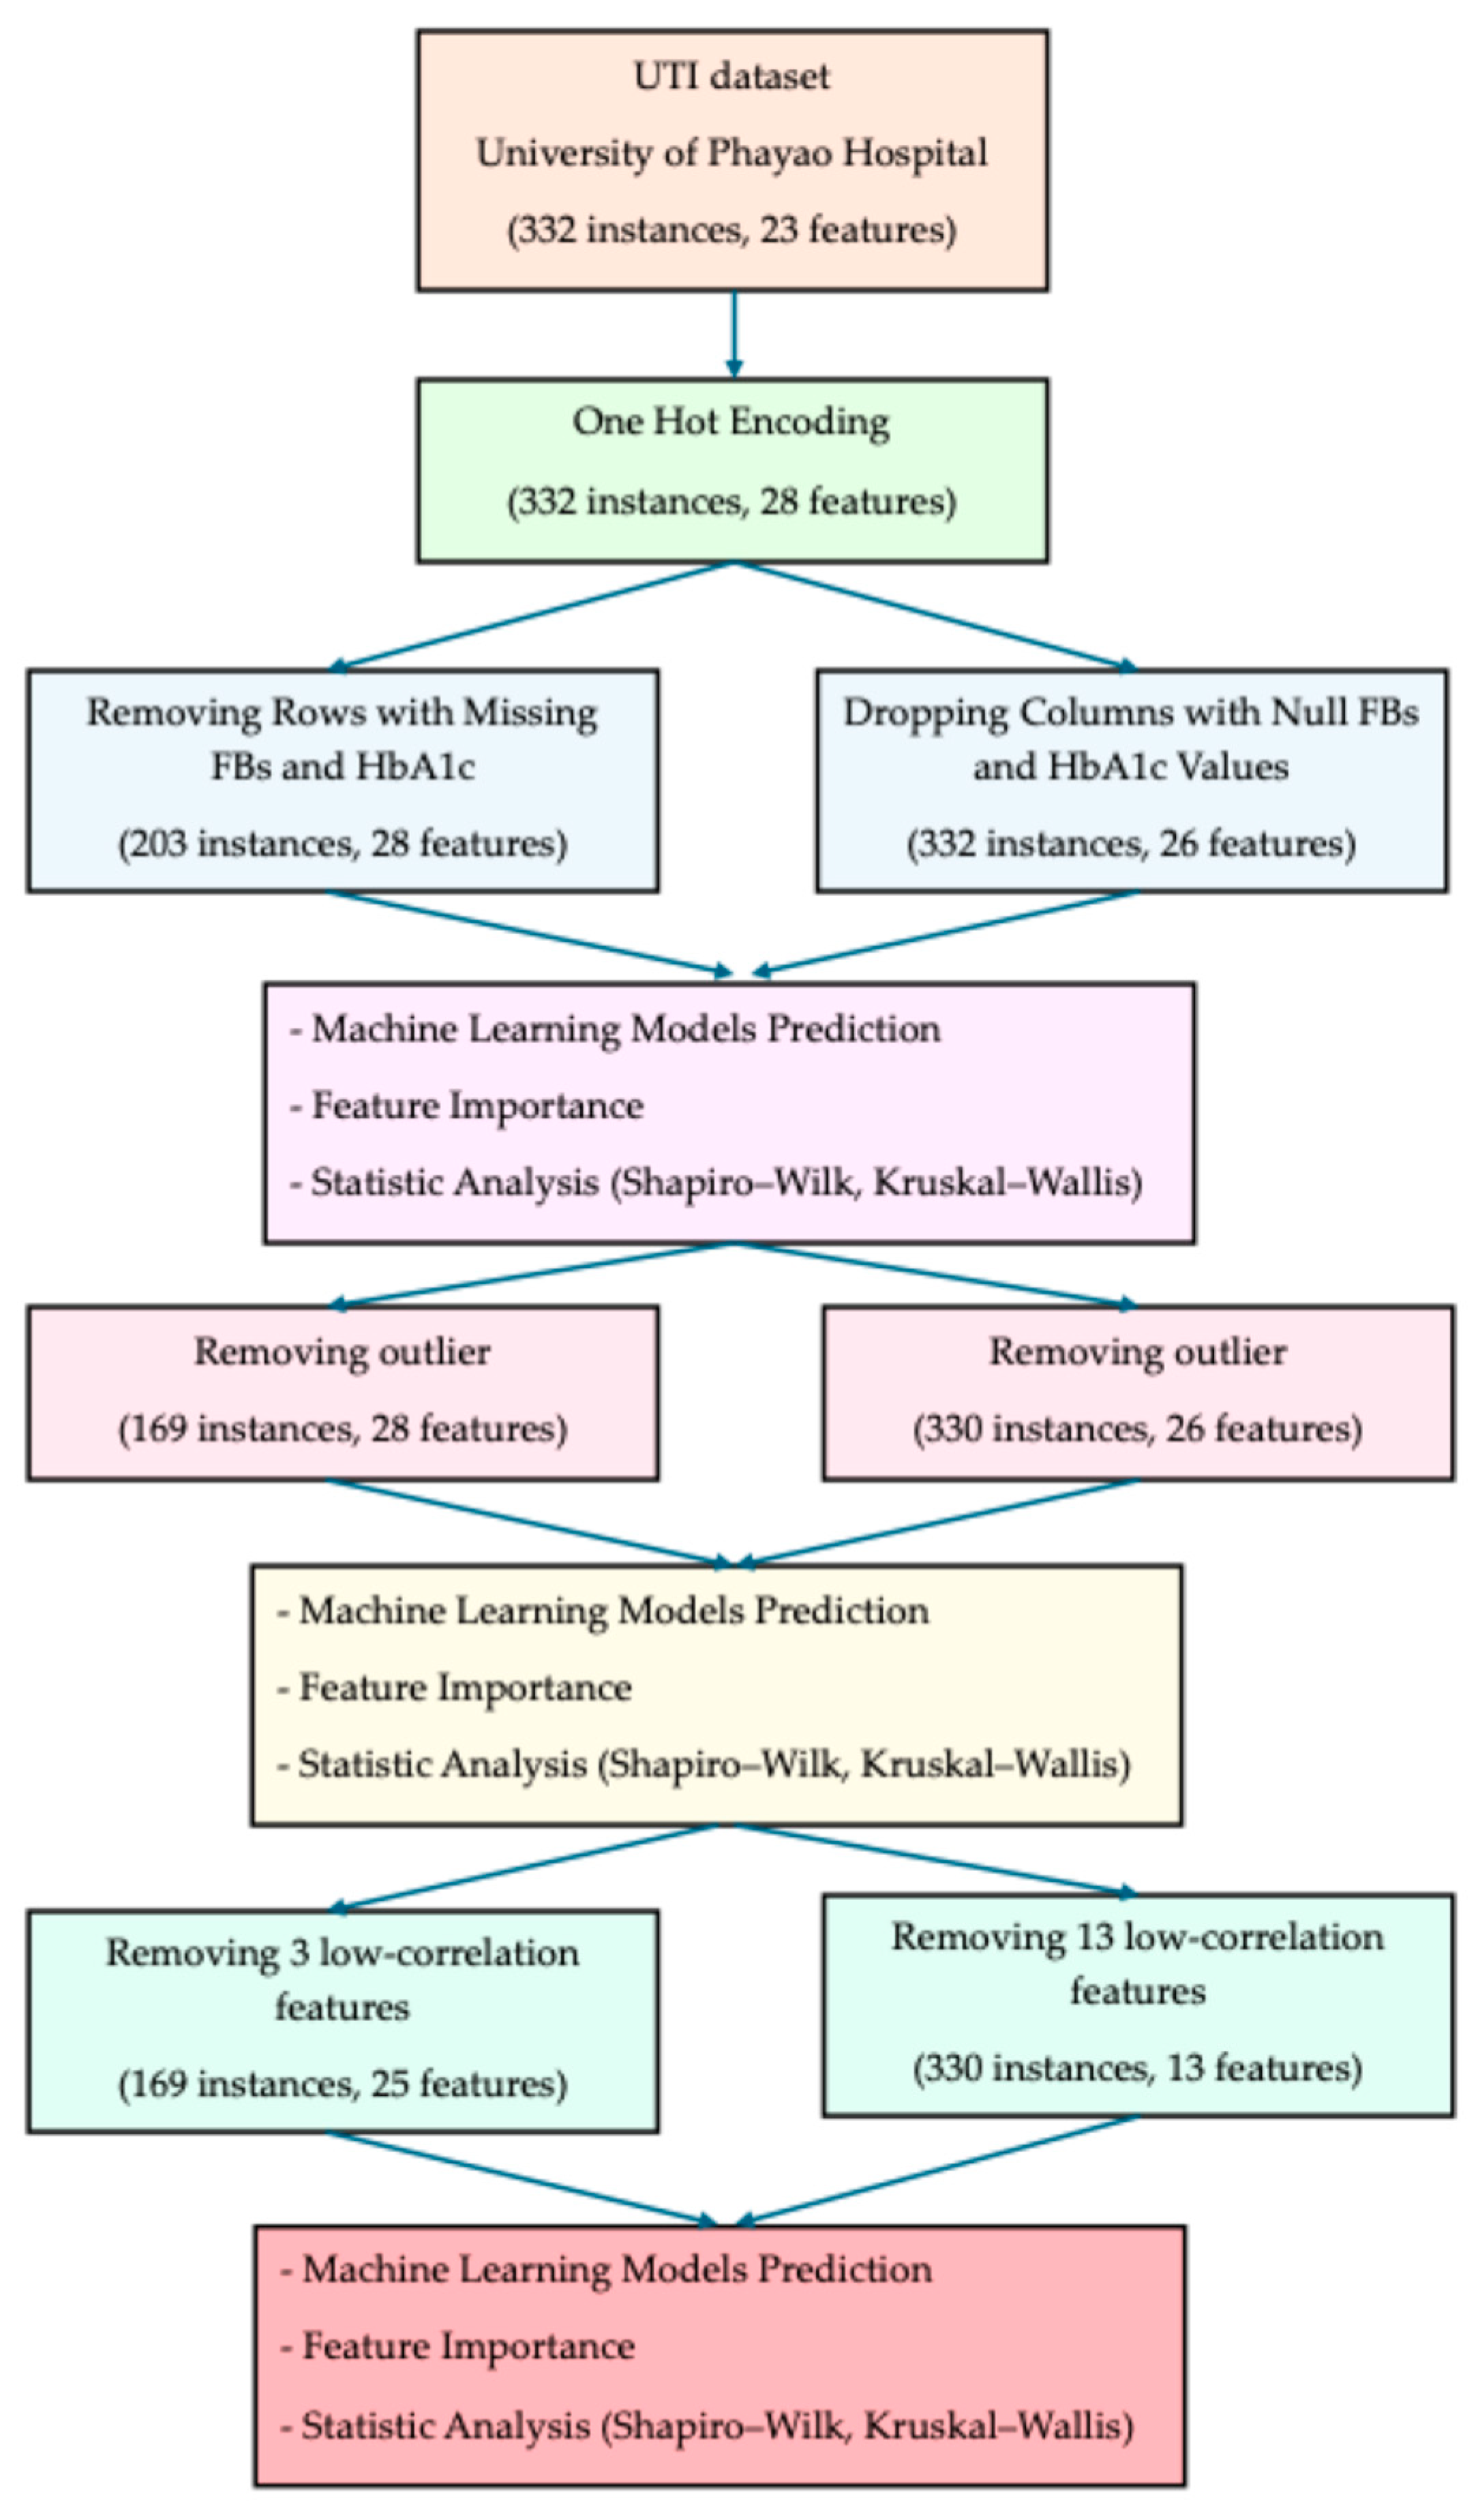
- All categorical variables were transformed using one-hot encoding, expanding the dataset to 28 features while retaining 332 instances.
- 2.
- Two parallel strategies were employed to address missing values in fasting blood sugar (FBs) and HbA1c:
- Row-removal strategy: Entire rows with missing FBs or HbA1c were excluded, resulting in 203 instances and 28 features.
- Column-dropping strategy: Instead of removing patients, the columns FBs and HbA1c were dropped, yielding 332 instances and 26 features.
- 3.
- For each strategy, three analytical steps were conducted:
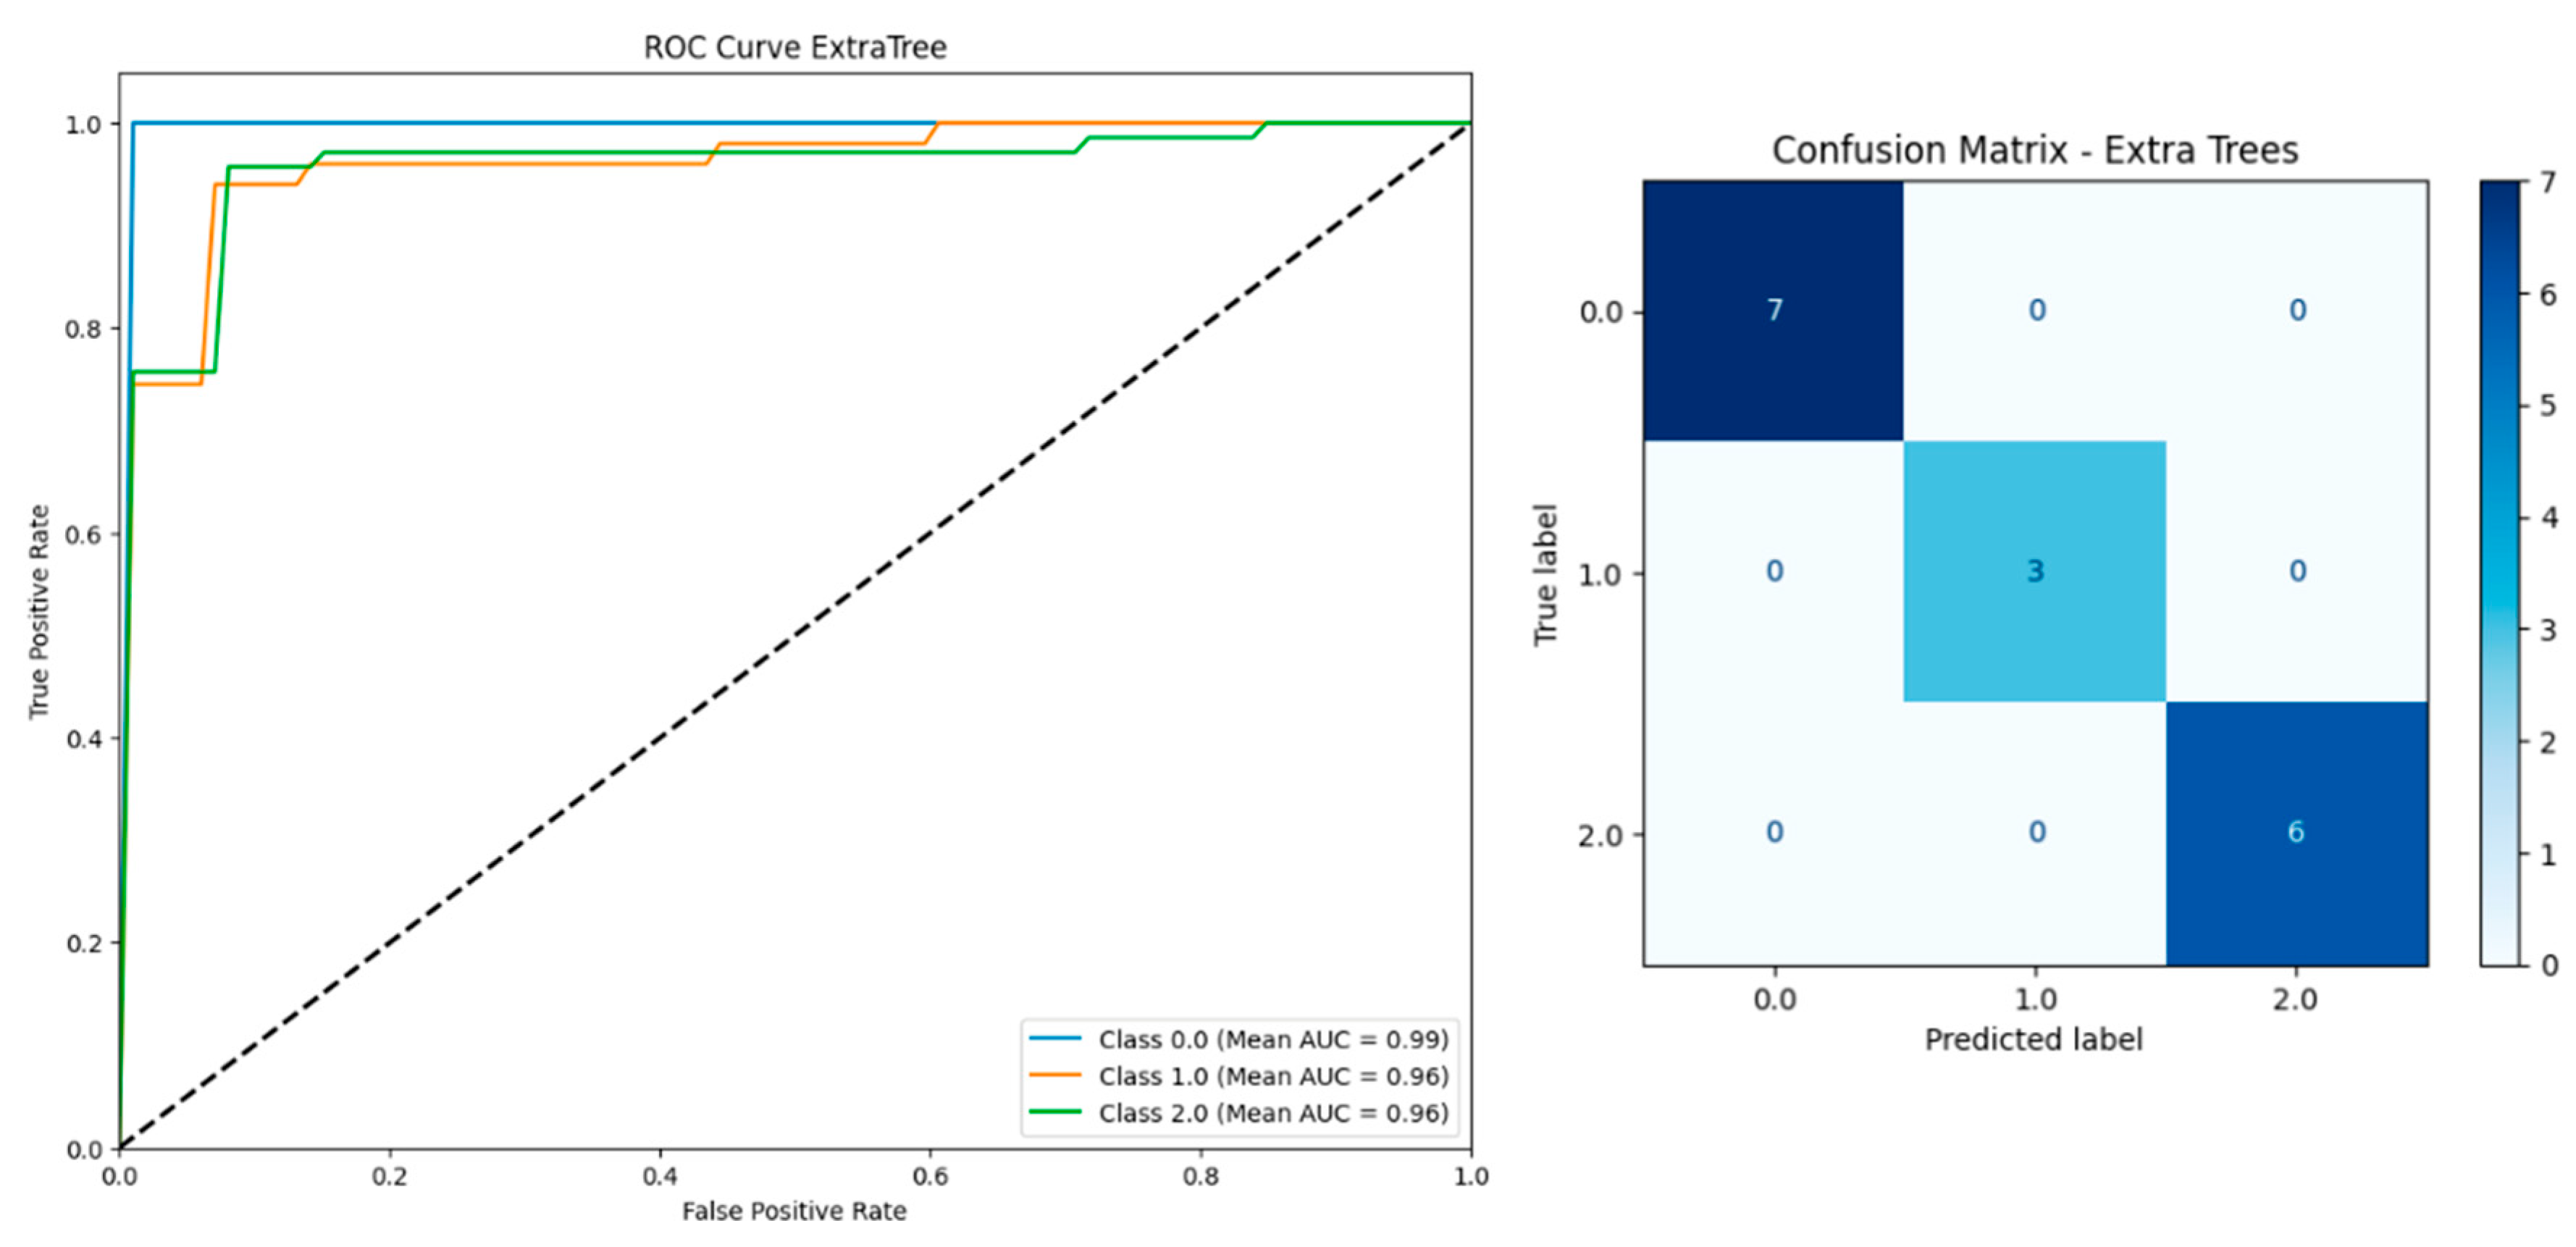
- Machine learning model prediction using six algorithms (Extra Trees, Gradient Boosting, XGBoost, Logistic Regression, Random Forest, LightGBM).
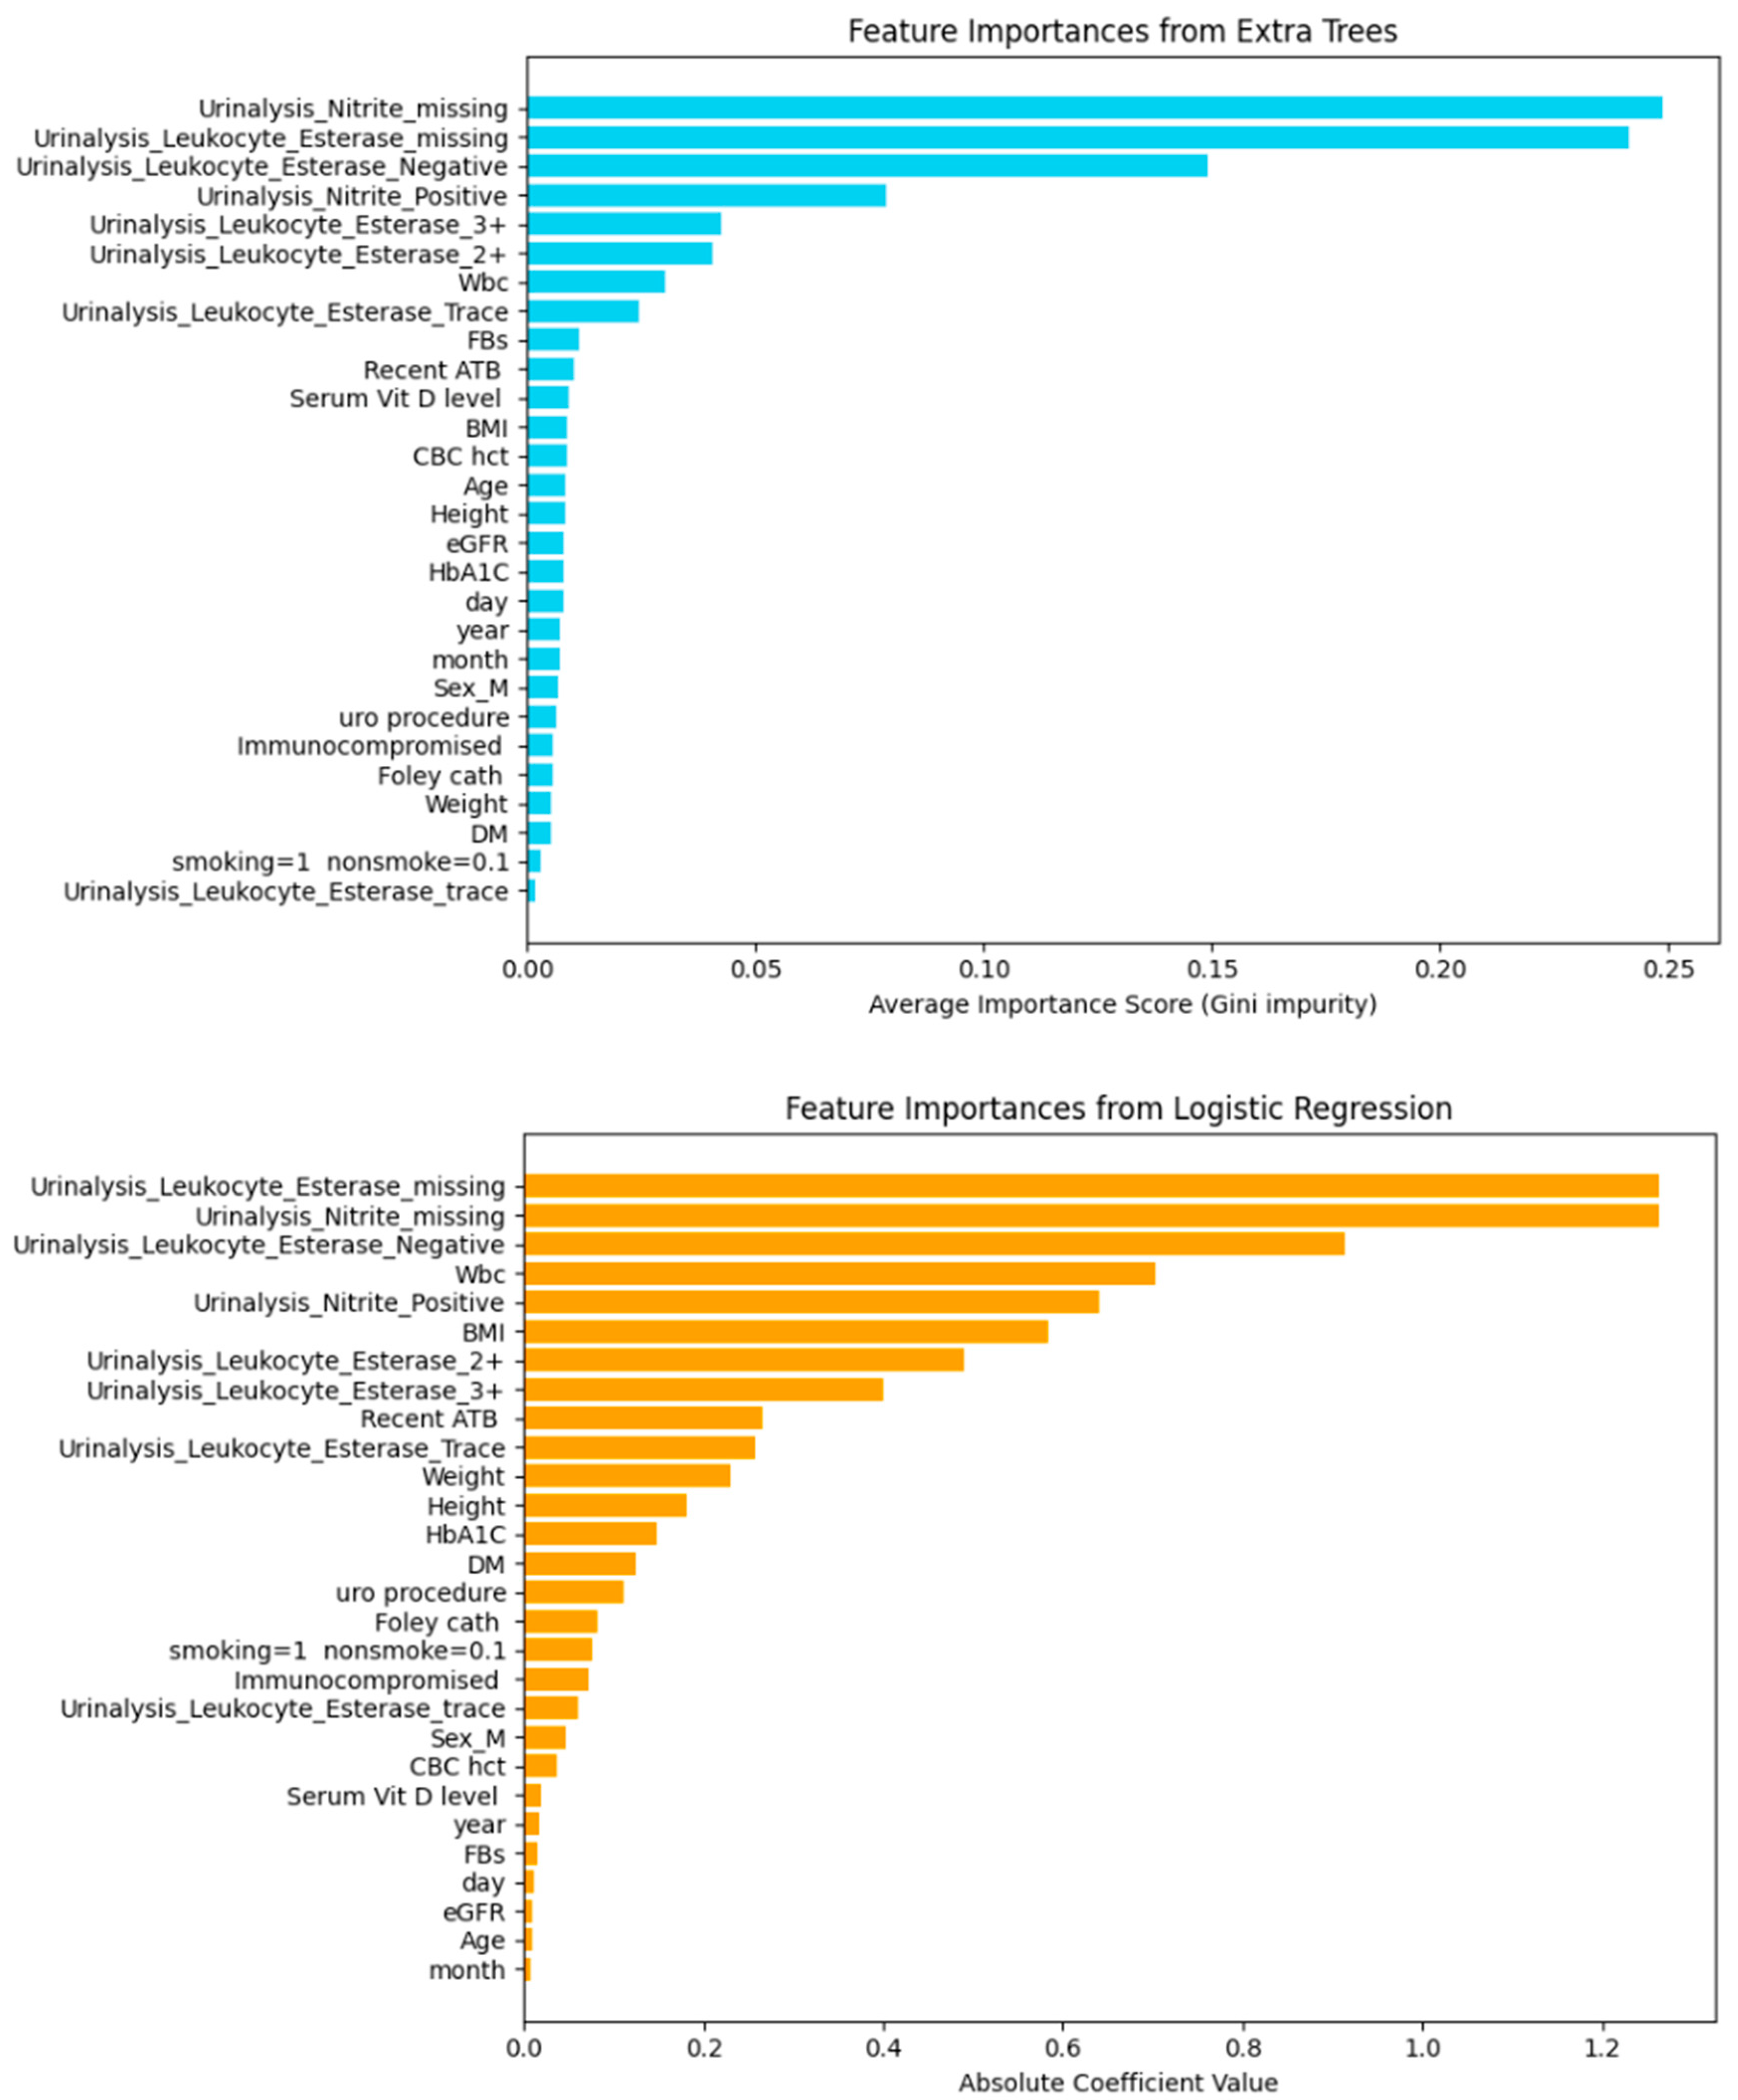
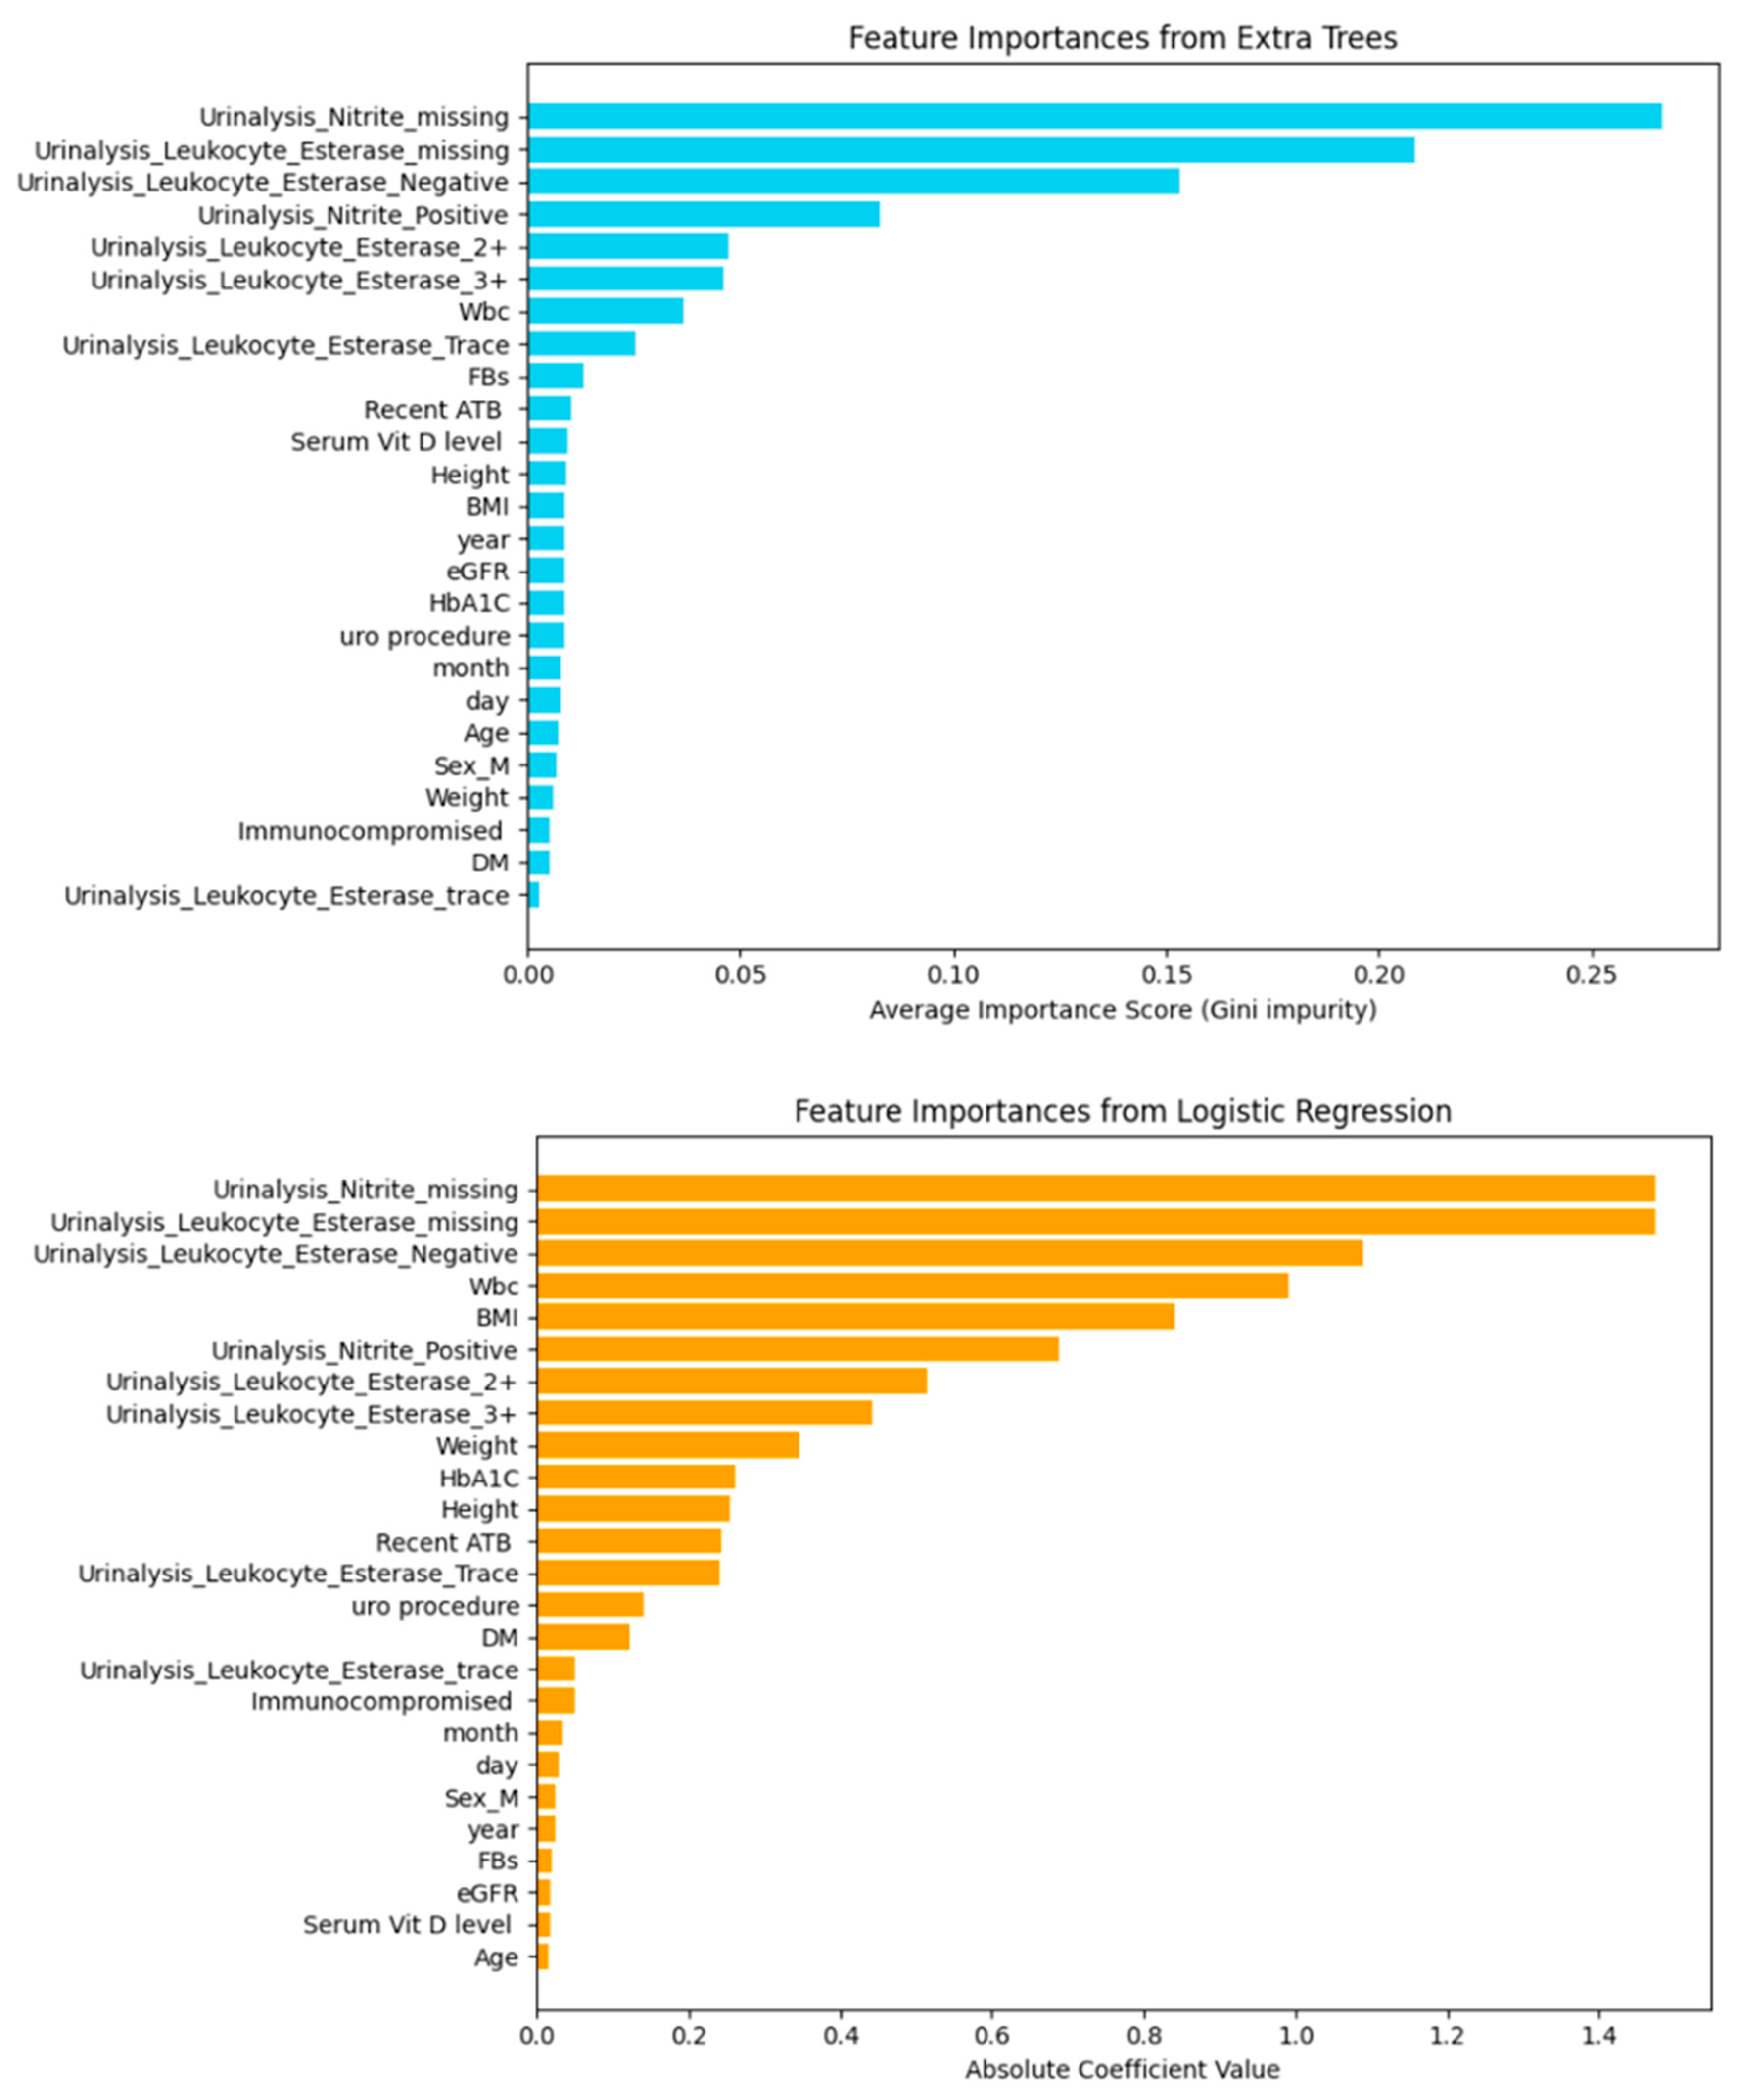
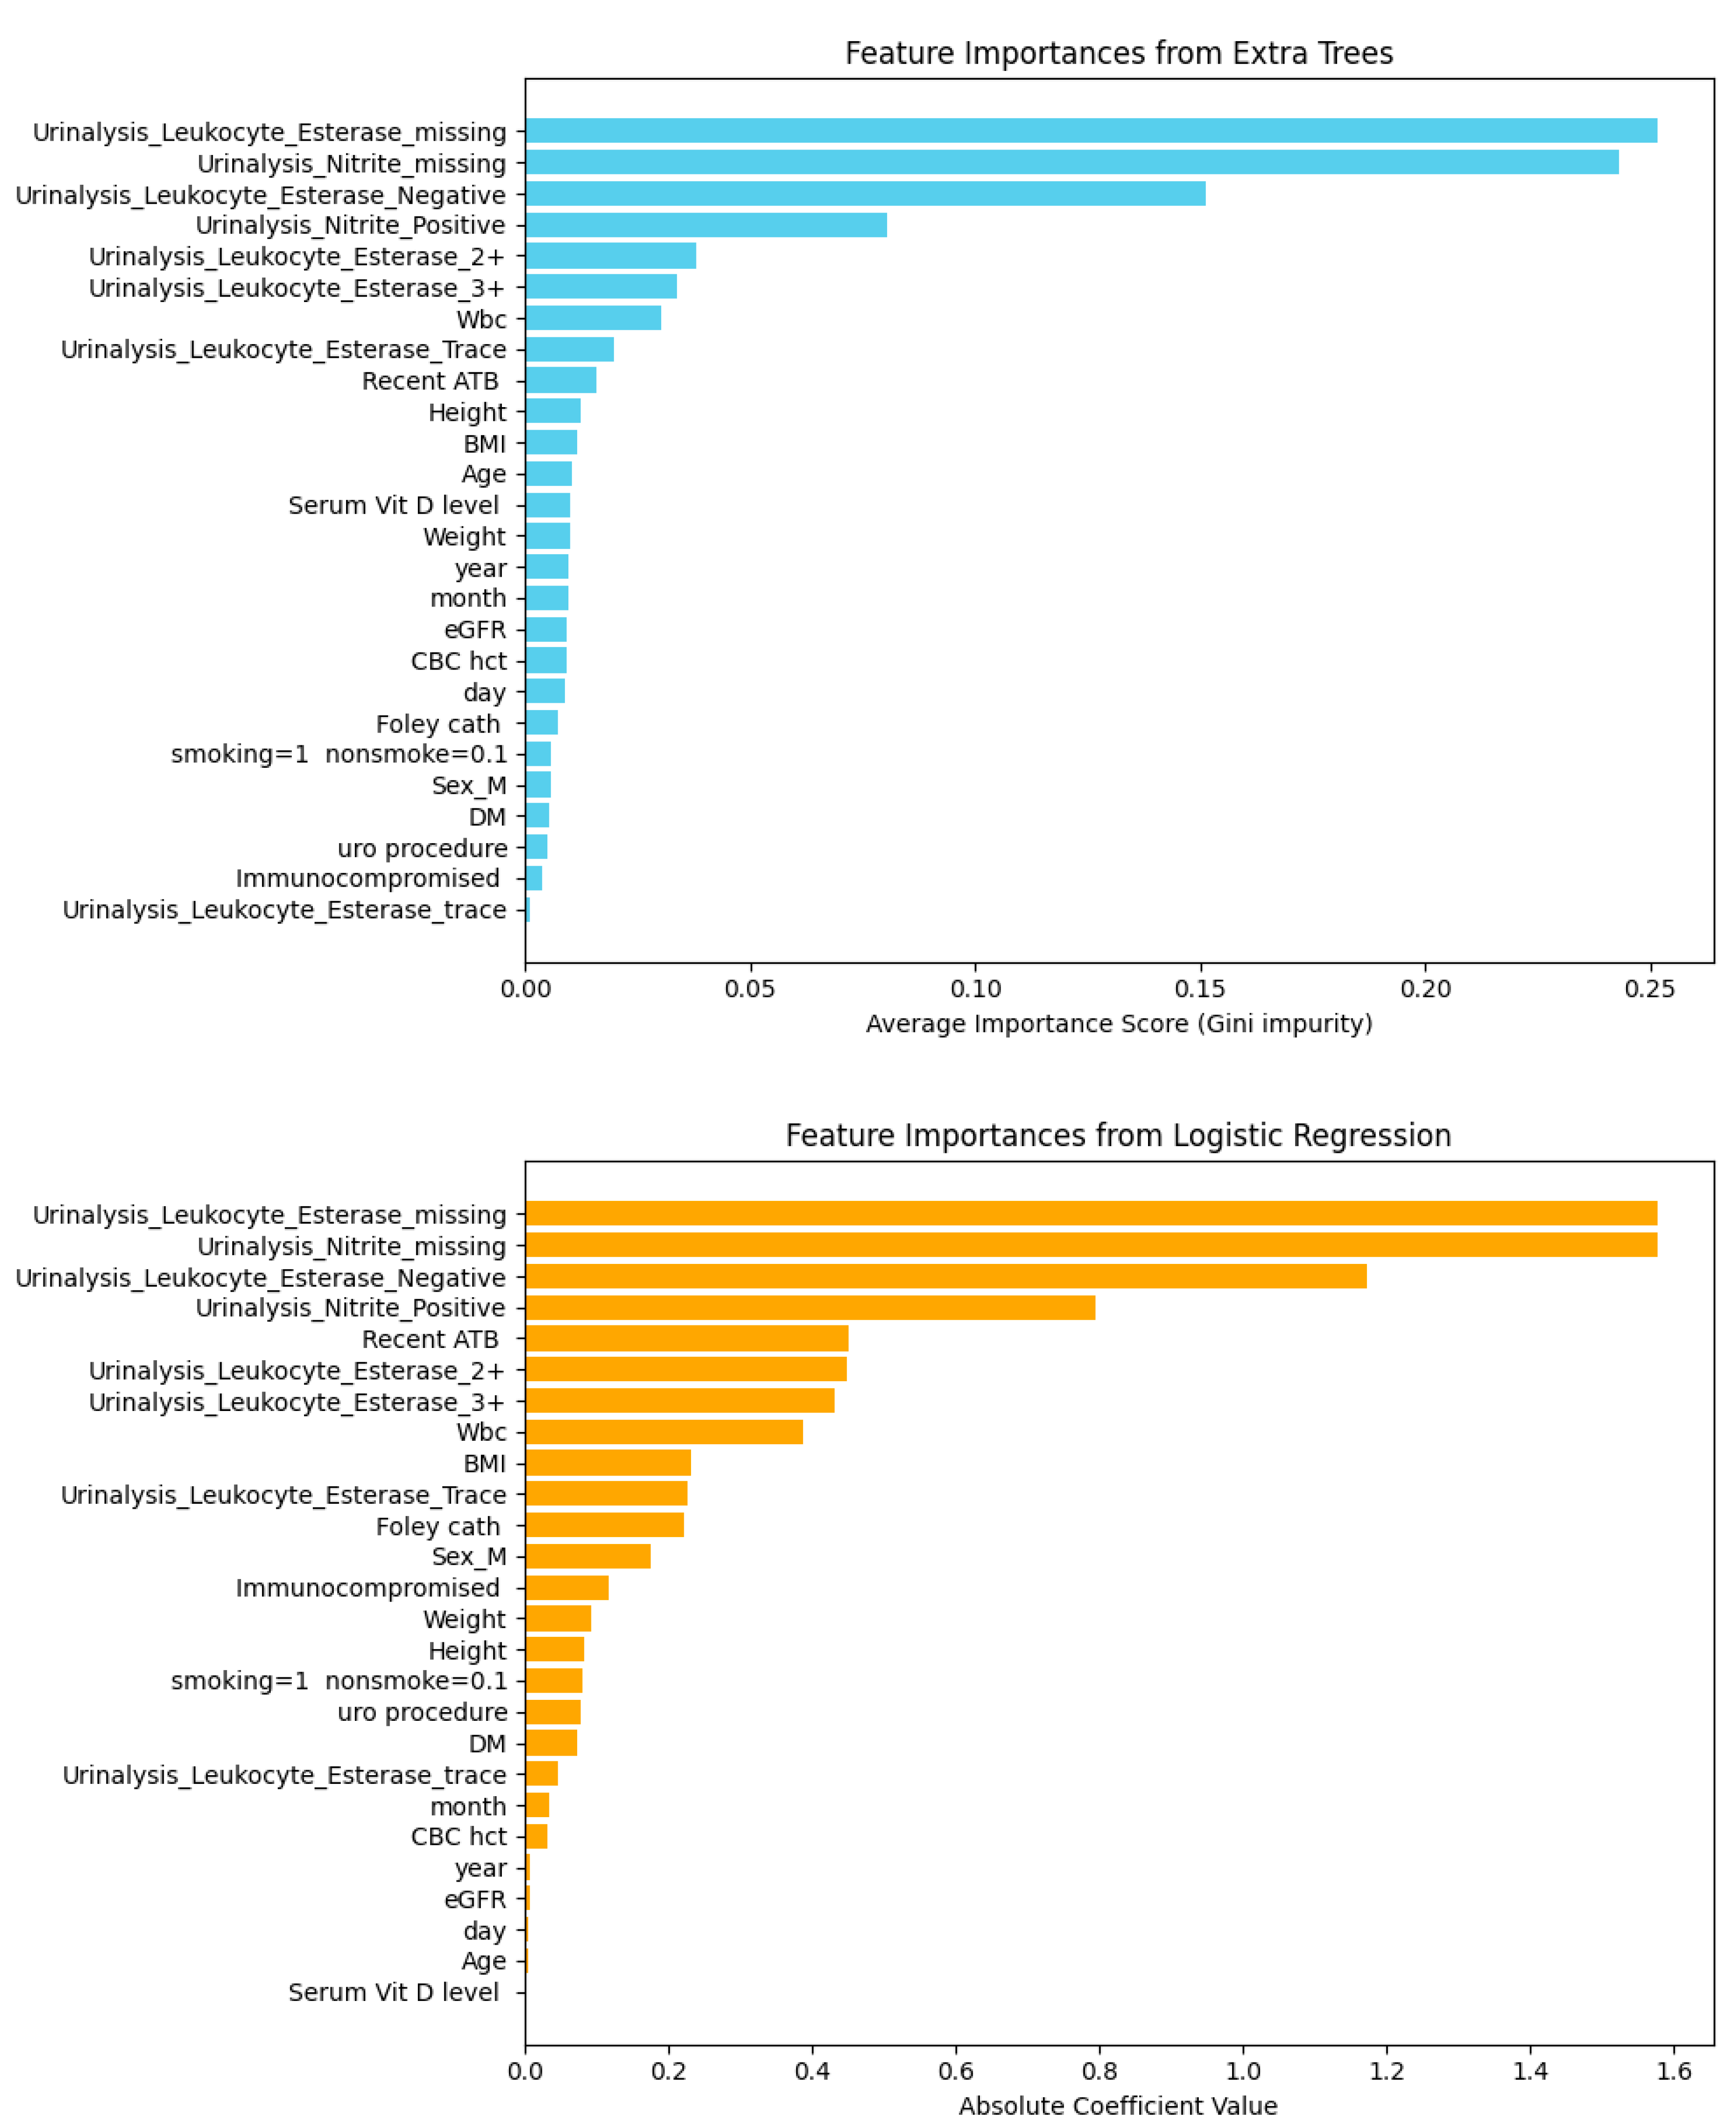
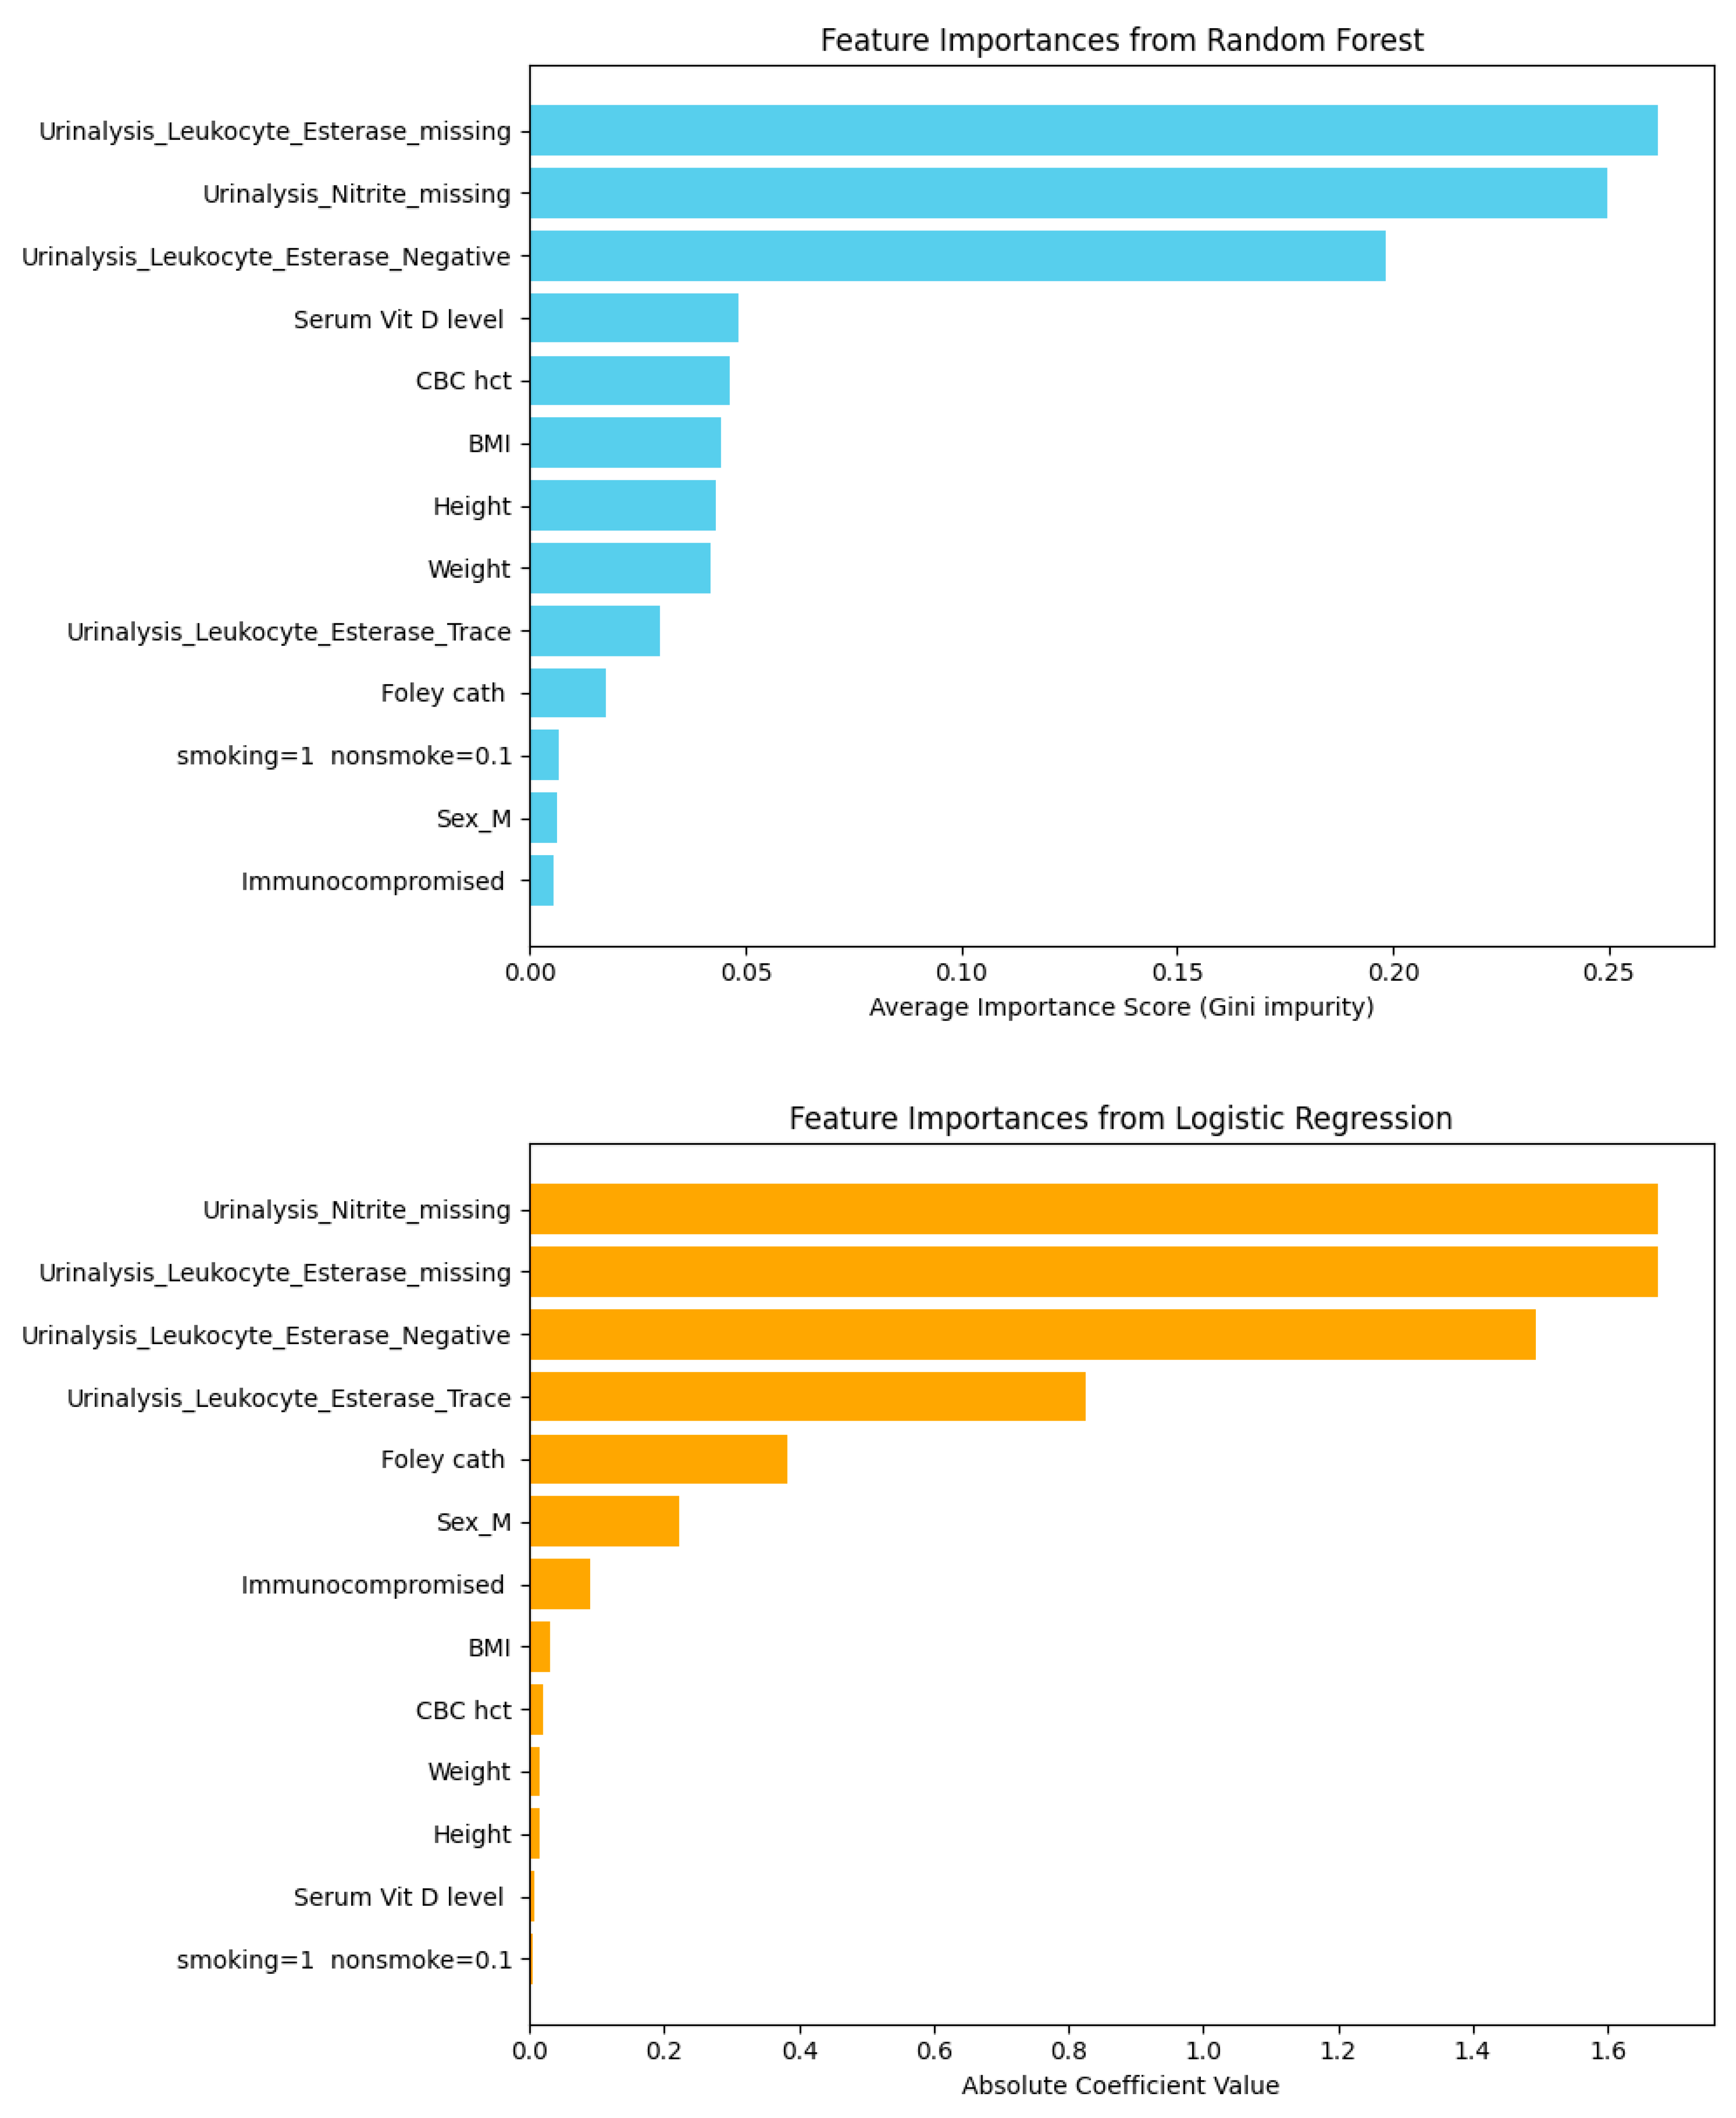
- Feature importance analysis to identify the most influential predictors.
- Statistical testing of serum vitamin D distribution using the Shapiro–Wilk test for normality and the Kruskal–Wallis test for group comparisons.
- 4.
- Outlier removals were excluded from each strategy:
- Row-removal strategy: Outliers were reduced to 169 instances with 28 features.
- Column-dropping strategy: Outliers were reduced to 330 instances with 28 features.
- 5.
- Following outlier removal, the same three analytical steps were repeated (machine learning model prediction, feature importance, and statistical analysis).
- 6.
- Features with low correlation to the target outcome were further excluded:
- Row-removal strategy: In total, 3 low-correlation features were removed, yielding 169 instances with 25 features.
- Column-dropping strategy: In total, 13 low-correlation features were removed, yielding 330 instances with 13 features.
- 7.
- The refined datasets were subjected once more to machine learning prediction, feature importance, and statistical analysis to confirm the robustness of the results.
3. Results
3.1. Removing Rows with Missing FBs and HbA1c
3.2. Dropping Columns with Null FBs and HbA1c Values
4. Discussion
5. Conclusions
Author Contributions
Funding
Institutional Review Board Statement
Informed Consent Statement
Data Availability Statement
Conflicts of Interest
References
- Foxman, B. Urinary tract infection syndromes: Occurrence, recurrence, bacteriology, risk factors, and disease burden. Infect. Dis. Clin. North Am. 2014, 28, 1–13. [Google Scholar] [CrossRef]
- He, Y.; Zhao, J.; Wang, L.; Han, C.; Yan, R.; Zhu, P.; Qian, T.; Yu, S.; Zhu, X.; He, W. Epidemiological trends and predictions of urinary tract infections in the Global Burden of Disease Study 2021. Sci. Rep. 2025, 15, 4702. [Google Scholar] [CrossRef]
- Amrein, K.; Scherkl, M.; Hoffmann, M.; Neuwersch-Sommeregger, S.; Köstenberger, M.; Tmava Berisha, A.; Martucci, G.; Pilz, S.; Malle, O. Vitamin D deficiency 2.0: An update on the current status worldwide. Eur. J. Clin. Nutr. 2020, 74, 1498–1513. [Google Scholar] [CrossRef]
- Martineau, A.R.; Jolliffe, D.A.; Hooper, R.L.; Greenberg, L.; Aloia, J.F.; Bergman, P.; Dubnov-Raz, G.; Esposito, S.; Ganmaa, D.; Ginde, A.A.; et al. Vitamin D supplementation to prevent acute respiratory tract infections: Systematic review and meta-analysis of individual participant data. BMJ 2017, 356, i6583. [Google Scholar] [CrossRef]
- Gan, Y.; You, S.; Ying, J.; Mu, D. The association between serum vitamin D levels and urinary tract infection risk in children: A systematic review and meta-analysis. Nutrients 2023, 15, 2690. [Google Scholar] [CrossRef]
- Hewison, M. Vitamin D and immune function: An overview. Proc. Nutr. Soc. 2012, 71, 50–61. [Google Scholar] [CrossRef] [PubMed]
- Shaikh, N.; Morone, N.E.; Bost, J.E.; Farrell, M.H. Prevalence of urinary tract infection in childhood: A meta-analysis. Pediatr. Infect. Dis. J. 2008, 27, 302–308. [Google Scholar] [CrossRef]
- Flores-Mireles, A.L.; Walker, J.N.; Caparon, M.; Hultgren, S.J. Urinary tract infections: Epidemiology, mechanisms of infection and treatment options. Nat. Rev. Microbiol. 2015, 13, 269–284. [Google Scholar] [CrossRef]
- Tandogdu, Z.; Wagenlehner, F.M. Global epidemiology of urinary tract infections. Curr. Opin. Infect. Dis. 2016, 29, 73–79. [Google Scholar] [CrossRef] [PubMed]
- Cashman, K.D.; Dowling, K.G.; Škrabáková, Z.; Gonzalez-Gross, M.; Valtueña, J.; De Henauw, S.; Moreno, L.; Damsgaard, C.T.; Michaelsen, K.F.; Mølgaard, C.; et al. Vitamin D deficiency in Europe: Pandemic. Am. J. Clin. Nutr. 2016, 103, 1033–1044. [Google Scholar] [CrossRef] [PubMed]
- Aranow, C. Vitamin D and the immune system. J. Investig. Med. 2011, 59, 881–886. [Google Scholar] [CrossRef]
- Bikle, D.D. Vitamin D metabolism, mechanism of action, and clinical applications. Chem. Biol. 2014, 21, 319–329. [Google Scholar] [CrossRef]
- Nseir, W.; Taha, M.; Nemarny, H.; Mograbi, J. The association between serum levels of vitamin D and recurrent urinary tract infections in premenopausal women. Int. J. Infect. Dis. 2013, 17, e1121–e1124. [Google Scholar] [CrossRef] [PubMed]
- Hertting, O.; Holm, Å.; Lüthje, P.; Brauner, H.; Dyrdak, R.; Jonasson, A.F.; Wiklund, P.; Chromek, M.; Brauner, A. Vitamin D induction of the human antimicrobial peptide cathelicidin in the urinary bladder. PLoS ONE 2010, 5, e15580. [Google Scholar] [CrossRef]
- Lagishetty, V.; Misharin, A.V.; Liu, N.Q.; Lisse, T.S.; Chun, R.F.; Ouyang, Y.; McLachlan, S.M.; Adams, J.S.; Hewison, M. Vitamin D deficiency in mice impairs colonic antibacterial activity and predisposes to colitis. Endocrinology 2010, 151, 2423–2432. [Google Scholar] [CrossRef] [PubMed]
- Wang, T.T.; Nestel, F.P.; Bourdeau, V.; Nagai, Y.; Wang, Q.; Liao, J.; Tavera-Mendoza, L.; Lin, R.; Hanrahan, J.W.; Mader, S.; et al. Cutting edge: 1,25-dihydroxyvitamin D3 is a direct inducer of antimicrobial peptide gene expression. J. Immunol. 2004, 173, 2909–2912. [Google Scholar] [CrossRef] [PubMed]
- Tekin, M.; Konca, C.; Celik, V.; Almis, H.; Kahramaner, Z.; Erdemir, A.; Gulyuz, A.; Uckardes, F.; Turgut, M. The association between vitamin D levels and urinary tract infection in children. Horm. Res. Paediatr. 2015, 83, 198–203. [Google Scholar] [CrossRef]
- Jorde, R.; Sollid, S.T.; Svartberg, J.; Joakimsen, R.M.; Grimnes, G.; Hutchinson, M.Y. Prevention of urinary tract infections with vitamin D supplementation 20,000 IU per week for five years: Results from an RCT including 511 subjects. Infect. Dis. 2016, 48, 823–828. [Google Scholar] [CrossRef]
- Beam, A.L.; Kohane, I.S. Big data and machine learning in health care. JAMA 2018, 319, 1317–1318. [Google Scholar] [CrossRef]
- Lee, S.; Choe, E.K.; Park, B. Exploration of machine learning for hyperuricemia prediction models based on basic health checkup tests. J. Clin. Med. 2019, 8, 172. [Google Scholar] [CrossRef]
- Guo, J.; He, Q.; Li, Y. Machine learning-based prediction of vitamin D deficiency: NHANES 2001-2018. Front. Endocrinol. 2024, 15, 1327058. [Google Scholar] [CrossRef]
- Tadesse, B.T.; Ashley, E.A.; Ongarello, S.; Havumaki, J.; Wijegoonewardena, M.; González, I.J.; Dittrich, S. Antimicrobial resistance in Africa: A systematic review. BMC Infect. Dis. 2017, 17, 616. [Google Scholar] [CrossRef]
- Taylor, R.A.; Moore, C.L.; Cheung, K.H.; Brandt, C. Predicting urinary tract infections in the emergency department with machine learning. PLoS ONE 2018, 13, e0194085. [Google Scholar] [CrossRef] [PubMed]
- Rajkomar, A.; Dean, J.; Kohane, I. Machine learning in medicine. N. Engl. J. Med. 2019, 380, 1347–1358. [Google Scholar] [CrossRef] [PubMed]



| Model | Including Serum Vitamin D | Without Serum Vitamin D | ||||||||
|---|---|---|---|---|---|---|---|---|---|---|
| Accuracy | F1-Score | Precision | Recall | AUC | Accuracy | F1-Score | Precision | Recall | AUC | |
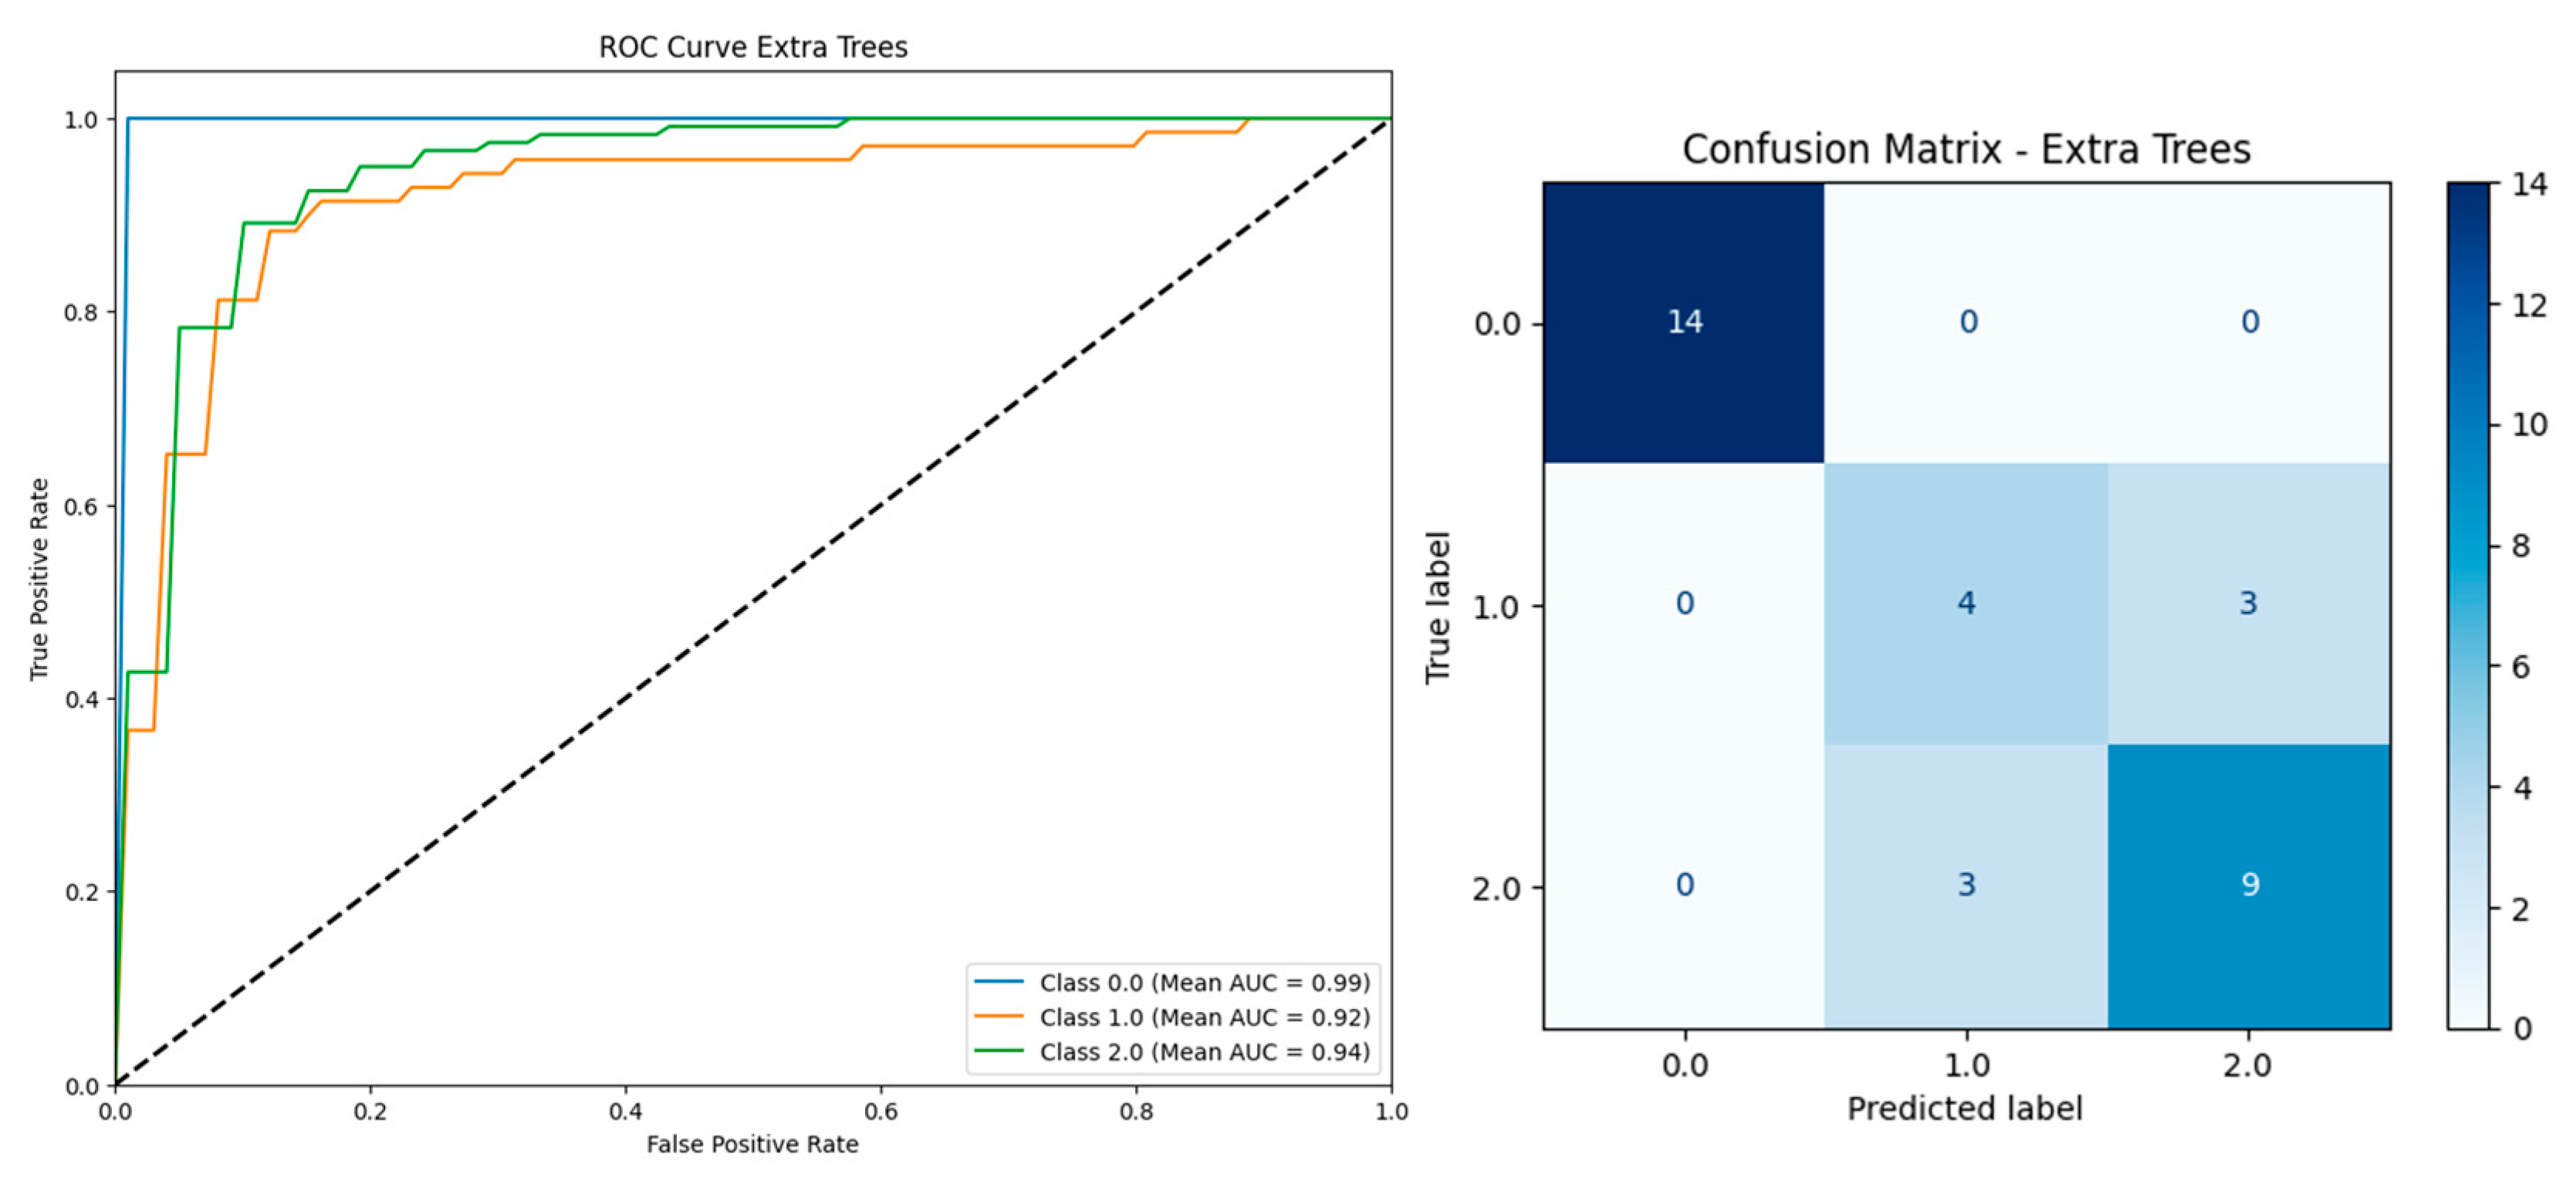
| Extra Trees | 0.9510 | 0.9503 | 0.9591 | 0.9510 | 0.9899 | 0.9460 | 0.9453 | 0.9550 | 0.9460 | 0.9910 |
| Gradient Boosting | 0.9457 | 0.9453 | 0.9569 | 0.9457 | 0.9877 | 0.9410 | 0.9405 | 0.9511 | 0.9410 | 0.9929 |
| XGBoost | 0.9410 | 0.9405 | 0.9482 | 0.9410 | 0.9825 | 0.9407 | 0.9405 | 0.9513 | 0.9407 | 0.9876 |
| Logistic Regression | 0.9362 | 0.9359 | 0.9410 | 0.9362 | 0.9783 | 0.9360 | 0.9354 | 0.9452 | 0.936 | 0.9866 |
| Random Forest | 0.9410 | 0.9405 | 0.9511 | 0.9410 | 0.9921 | 0.9264 | 0.9262 | 0.9335 | 0.9264 | 0.9772 |
| LightGBM | 0.9262 | 0.9245 | 0.9349 | 0.9262 | 0.9835 | 0.9262 | 0.9246 | 0.9353 | 0.9262 | 0.9843 |
| Model | Including Serum Vitamin D | Without Serum Vitamin D | ||||||||
|---|---|---|---|---|---|---|---|---|---|---|
| Accuracy | F1-Score | Precision | Recall | AUC | Accuracy | F1-Score | Precision | Recall | AUC | |
| Extra Trees | 0.9467 | 0.9446 | 0.9561 | 0.9467 | 0.9924 | 0.9479 | 0.9462 | 0.9524 | 0.9479 | 0.9890 |
| Gradient Boosting | 0.9349 | 0.9338 | 0.9403 | 0.9349 | 0.9901 | 0.9374 | 0.9356 | 0.9479 | 0.9374 | 0.9767 |
| XGBoost | 0.9408 | 0.9387 | 0.9444 | 0.9408 | 0.9922 | 0.9532 | 0.9523 | 0.9602 | 0.9532 | 0.983 |
| Logistic Regression | 0.9173 | 0.9180 | 0.9260 | 0.9173 | 0.9806 | 0.9374 | 0.9362 | 0.9431 | 0.9374 | 0.988 |
| Random Forest | 0.9408 | 0.9389 | 0.9494 | 0.9408 | 0.9901 | 0.9111 | 0.9101 | 0.9188 | 0.9111 | 0.9733 |
| LightGBM | 0.9349 | 0.9340 | 0.9367 | 0.9349 | 0.9784 | 0.9376 | 0.9369 | 0.9416 | 0.9376 | 0.9837 |
| Feature | Score Corr Spearman |
|---|---|
| Urinalysis_Leukocyte_Esterase_2+ | 0.06871976629978133 |
| Urinalysis_Leukocyte_Esterase_3+ | 0.06576329960128459 |
| Urinalysis_Leukocyte_Esterase_Negative | 0.7487478543213254 |
| Urinalysis_Leukocyte_Esterase_Trace | 0.2746986268964347 |
| Urinalysis_Leukocyte_Esterase_missing | −0.9224985939982852 |
| Urinalysis_Leukocyte_Esterase_trace | 0.09267029028118784 |
| Urinalysis_Nitrite_Positive | 0.053962344266818764 |
| Urinalysis_Nitrite_missing | −0.9224985939982852 |
| Sex_M | −0.0065972980013197504 |
| Feature | Score Corr Pearson |
|---|---|
| Age | −0.129088606 |
| Height | −0.045594458 |
| Weight | 0.102508819 |
| BMI | 0.120294279 |
| Wbc | −0.004173642 |
| Immunocompromised | −0.071001376 |
| Recent ATB | −0.081696011 |
| DM | 0.014477774 |
| Foley cath | 0.002105744 |
| uro procedure | 0.023142569 |
| CBC hct | −0.006954641 |
| eGFR | 0.159680643 |
| Smoking = 1 nonsmoke = 0.1 | −0.002005269 |
| Serum Vit D level | −0.081335186 |
| Year | 0.080705383 |
| month | −0.06605901 |
| Day | 0.060379042 |
| Model | Including Serum Vitamin D | Without Serum Vitamin D | ||||||||
|---|---|---|---|---|---|---|---|---|---|---|
| Accuracy | F1-Score | Precision | Recall | AUC | Accuracy | F1-Score | Precision | Recall | AUC | |
| Extra Trees | 0.9467 | 0.9446 | 0.9561 | 0.9467 | 0.9910 | 0.9374 | 0.9356 | 0.9435 | 0.9374 | 0.9869 |
| Gradient Boosting | 0.9349 | 0.9338 | 0.9403 | 0.9349 | 0.9906 | 0.9268 | 0.9247 | 0.9319 | 0.9268 | 0.9538 |
| XGBoost | 0.9408 | 0.9387 | 0.9444 | 0.9408 | 0.9920 | 0.9321 | 0.9302 | 0.939 | 0.9321 | 0.9648 |
| Logistic Regression | 0.9471 | 0.9463 | 0.9538 | 0.9471 | 0.9909 | 0.9426 | 0.9408 | 0.9478 | 0.9426 | 0.9817 |
| Random Forest | 0.9408 | 0.9389 | 0.9494 | 0.9408 | 0.9919 | 0.9268 | 0.9255 | 0.937 | 0.9268 | 0.9645 |
| LightGBM | 0.9290 | 0.9276 | 0.9306 | 0.9290 | 0.9748 | 0.9005 | 0.8986 | 0.9069 | 0.9005 | 0.9449 |
| Dataset | Distribution of Serum Vitamin D Level by the Shapiro–Wilk | Kruskal–Wallis |
|---|---|---|
| Removing Rows with Missing FBs and HbA1c (203 instances, 28 features). | 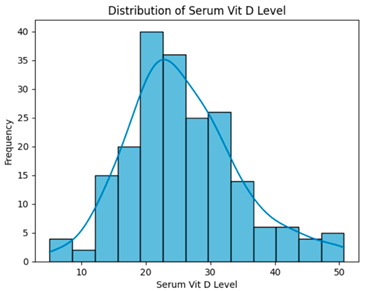 | H = 0.8483, p = 0.6543 Serum vitamin D levels did not differ significantly across groups. |
| Removing outlier (169 instances, 28 features). | 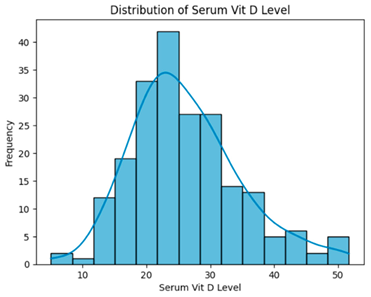 | H = 0.8035, p = 0.6691, Serum vitamin D levels did not differ significantly across groups. |
| Removing low-correlation features (smoking, CBC hct, Foley cath) (169 instances, 25 features). | 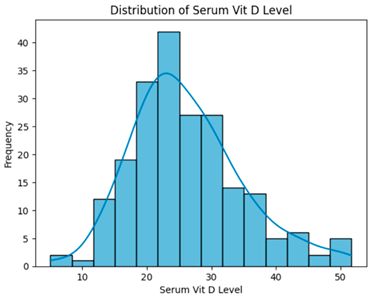 | H = 0.8035, p = 0.6691, Serum vitamin D levels did not differ significantly across groups. |
| Model | Including Serum Vitamin D | Without Serum Vitamin D | ||||||||
|---|---|---|---|---|---|---|---|---|---|---|
| Accuracy | F1-Score | Precision | Recall | AUC | Accuracy | F1-Score | Precision | Recall | AUC | |
| Extra Trees | 0.9406 | 0.9397 | 0.9441 | 0.9406 | 0.9855 | 0.9376 | 0.9363 | 0.9421 | 0.9376 | 0.9851 |
| Gradient Boosting | 0.9258 | 0.9253 | 0.9298 | 0.9258 | 0.9621 | 0.9288 | 0.9285 | 0.9339 | 0.9288 | 0.9686 |
| XGBoost | 0.9317 | 0.9312 | 0.9356 | 0.9317 | 0.9775 | 0.9258 | 0.9251 | 0.929 | 0.9258 | 0.9806 |
| Logistic Regression | 0.9406 | 0.9394 | 0.9438 | 0.9406 | 0.9844 | 0.9406 | 0.9394 | 0.9438 | 0.9406 | 0.9839 |
| Random Forest | 0.9526 | 0.9517 | 0.954 | 0.9526 | 0.9828 | 0.9466 | 0.9454 | 0.949 | 0.9466 | 0.9835 |
| LightGBM | 0.9228 | 0.921 | 0.9265 | 0.9228 | 0.9815 | 0.9229 | 0.922 | 0.9255 | 0.9229 | 0.9782 |
| Model | Including Serum Vitamin D | Without Serum Vitamin D | ||||||||
|---|---|---|---|---|---|---|---|---|---|---|
| Accuracy | F1-Score | Precision | Recall | AUC | Accuracy | F1-Score | Precision | Recall | AUC | |
| Extra Trees | 0.9394 | 0.9375 | 0.9452 | 0.9394 | 0.9867 | 0.9364 | 0.9345 | 0.9419 | 0.9364 | 0.9869 |
| Gradient Boosting | 0.9212 | 0.9203 | 0.927 | 0.9212 | 0.9616 | 0.9182 | 0.9174 | 0.9231 | 0.9182 | 0.9628 |
| XGBoost | 0.9212 | 0.9196 | 0.9266 | 0.9212 | 0.9784 | 0.9152 | 0.9134 | 0.9194 | 0.9152 | 0.979 |
| Logistic Regression | 0.9364 | 0.9352 | 0.9424 | 0.9364 | 0.9886 | 0.9333 | 0.9315 | 0.9403 | 0.9333 | 0.987 |
| Random Forest | 0.9455 | 0.9443 | 0.9478 | 0.9455 | 0.9833 | 0.9455 | 0.9436 | 0.9475 | 0.9455 | 0.9849 |
| LightGBM | 0.9121 | 0.9106 | 0.917 | 0.9121 | 0.973 | 0.9091 | 0.9066 | 0.913 | 0.9091 | 0.974 |
| Feature | Score Corr Spearman |
|---|---|
| Urinalysis_Leukocyte_Esterase_2+ | 0.05384808248284584 |
| Urinalysis_Leukocyte_Esterase_3+ | 0.06591310096367214 |
| Urinalysis_Leukocyte_Esterase_Negative | 0.7375196223456809 |
| Urinalysis_Leukocyte_Esterase_Trace | 0.23910641565796778 |
| Urinalysis_Leukocyte_Esterase_missing | −0.9207435275744111 |
| Urinalysis_Leukocyte_Esterase_trace | 0.06473859089883398 |
| Urinalysis_Nitrite_Positive | 0.04769910761148201 |
| Urinalysis_Nitrite_missing | −0.9207435275744111 |
| Sex_M | −0.04386365833988913 |
| Feature | Score Corr Spearman |
|---|---|
| Age | −0.05853161001375016 |
| Height | 0.18227749330017073 |
| Weight | 0.16244022779755593 |
| BMI | 0.10343395458190982 |
| Wbc | −0.093081839913421 |
| Immunocompromised | −0.1411028142482889 |
| Recent ATB | −0.02968019759761633 |
| DM | −0.025770879732438978 |
| uro procedure | 0.04809317469941063 |
| eGFR | 0.05520181492066498 |
| Serum Vit D level | −0.04437762002432005 |
| year | −0.051789898770276996 |
| month | 0.06287313934574602 |
| day | 0.05532694108956496 |
| Model | Including Serum Vitamin D | Without Serum Vitamin D | ||||||||
|---|---|---|---|---|---|---|---|---|---|---|
| Accuracy | F1-Score | Precision | Recall | AUC | Accuracy | F1-Score | Precision | Recall | AUC | |
| Extra Trees | 0.9212 | 0.921 | 0.9248 | 0.9212 | 0.9783 | 0.9364 | 0.9354 | 0.941 | 0.9364 | 0.9801 |
| Gradient Boosting | 0.9091 | 0.9096 | 0.9150 | 0.9091 | 0.9526 | 0.9242 | 0.9234 | 0.9306 | 0.9242 | 0.9495 |
| XGBoost | 0.9152 | 0.915 | 0.9185 | 0.9152 | 0.9708 | 0.9152 | 0.9145 | 0.9197 | 0.9152 | 0.9632 |
| Logistic Regression | 0.9273 | 0.9275 | 0.9328 | 0.9273 | 0.976 | 0.9333 | 0.9323 | 0.9392 | 0.9333 | 0.9795 |
| Random Forest | 0.9333 | 0.9336 | 0.9379 | 0.9333 | 0.9706 | 0.9333 | 0.9324 | 0.9365 | 0.9333 | 0.9715 |
| LightGBM | 0.9000 | 0.8996 | 0.9043 | 0.9000 | 0.9618 | 0.8939 | 0.8926 | 0.8963 | 0.8939 | 0.9585 |
| Dataset | Distribution of Serum Vitamin D Level by the Shapiro–Wilk | Kruskal–Wallis |
|---|---|---|
| Dropping Columns with Null FBs and HbA1c Values (337 instances, 26 features) | 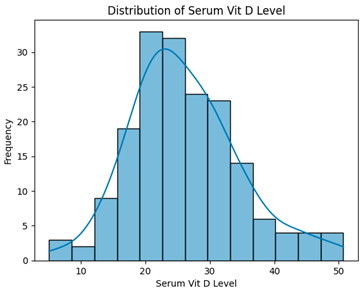 | H = 3.3194, p = 0.1902, Serum vitamin D levels did not differ significantly across groups. |
| Removing Outlier Using IQR (330 instances, 26 features) | 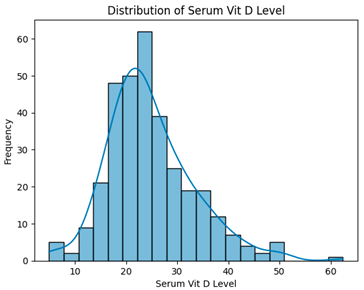 | H = 3.4995, p = 0.1738, Serum vitamin D levels did not differ significantly across groups. |
| Removing 13 low-correlation features (330 instances, 13 features) | 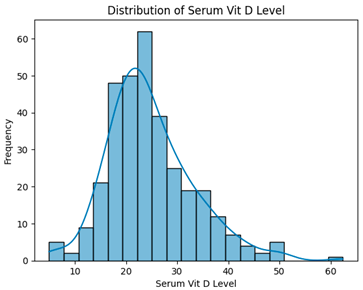 | H = 3.4995, p = 0.1738, Serum vitamin D levels did not differ significantly across groups. |
Disclaimer/Publisher’s Note: The statements, opinions and data contained in all publications are solely those of the individual author(s) and contributor(s) and not of MDPI and/or the editor(s). MDPI and/or the editor(s) disclaim responsibility for any injury to people or property resulting from any ideas, methods, instructions or products referred to in the content. |
© 2025 by the authors. Licensee MDPI, Basel, Switzerland. This article is an open access article distributed under the terms and conditions of the Creative Commons Attribution (CC BY) license (https://creativecommons.org/licenses/by/4.0/).
Share and Cite
Naravejsakul, K.; Cholamjiak, W.; Yajai, W.; Inpun, J.; Waratamrongpatai, W. Development of a Machine Learning-Based Predictive Model for Urinary Tract Infection Risk in Patients with Vitamin D Deficiency: A Multidimensional Clinical Data Analysis. BioMedInformatics 2025, 5, 57. https://doi.org/10.3390/biomedinformatics5040057
Naravejsakul K, Cholamjiak W, Yajai W, Inpun J, Waratamrongpatai W. Development of a Machine Learning-Based Predictive Model for Urinary Tract Infection Risk in Patients with Vitamin D Deficiency: A Multidimensional Clinical Data Analysis. BioMedInformatics. 2025; 5(4):57. https://doi.org/10.3390/biomedinformatics5040057
Chicago/Turabian StyleNaravejsakul, Krittin, Watcharaporn Cholamjiak, Watcharapon Yajai, Jakkaphong Inpun, and Waragunt Waratamrongpatai. 2025. "Development of a Machine Learning-Based Predictive Model for Urinary Tract Infection Risk in Patients with Vitamin D Deficiency: A Multidimensional Clinical Data Analysis" BioMedInformatics 5, no. 4: 57. https://doi.org/10.3390/biomedinformatics5040057
APA StyleNaravejsakul, K., Cholamjiak, W., Yajai, W., Inpun, J., & Waratamrongpatai, W. (2025). Development of a Machine Learning-Based Predictive Model for Urinary Tract Infection Risk in Patients with Vitamin D Deficiency: A Multidimensional Clinical Data Analysis. BioMedInformatics, 5(4), 57. https://doi.org/10.3390/biomedinformatics5040057


