Article

Development of a Machine Learning-Based Predictive Model for Urinary Tract Infection Risk in Patients with Vitamin D Deficiency: A Multidimensional Clinical Data Analysis

by
Krittin Naravejsakul
1,
Watcharaporn Cholamjiak
2,
Watcharapon Yajai
2,
Jakkaphong Inpun
3 and
Waragunt Waratamrongpatai
1,*
1
School of Medicine, University of Phayao, Phayao 56000, Thailand
2
Department of Mathematics, School of Science, University of Phayao, Phayao 56000, Thailand
3
School of Information and Communication Technology, University of Phayao, Phayao 56000, Thailand
*
Author to whom correspondence should be addressed.
BioMedInformatics 2025, 5(4), 57; https://doi.org/10.3390/biomedinformatics5040057
Submission received: 7 August 2025 / Revised: 3 October 2025 / Accepted: 9 October 2025 / Published: 10 October 2025
(This article belongs to the Special Issue Editor's Choices Series for Clinical Informatics Section)

Abstract

Background: Urinary tract infections (UTIs) remain among the most common bacterial infections, yet reliable risk stratification remains challenging. Serum vitamin D has been linked to immune regulation, but its predictive role in UTI subtypes is unclear. Methods: We analyzed 332 de-identified clinical records using six machine learning algorithms: Extra Trees, Gradient Boosting, XGBoost, Logistic Regression, Random Forest, and LightGBM. Two preprocessing strategies were applied: (i) removing rows with missing fasting blood sugar (FBs) and HbA1c, and (ii) dropping columns with Null FBs and HbA1c values. Model performance was evaluated using 10-fold cross-validation. Results: Serum vitamin D showed weak correlations with UTI subtypes but modest importance in tree-based models. The highest predictive accuracy was obtained with Extra Trees (0.9510) under the row-removal strategy and Random Forest (0.9525) under the column-dropping strategy. Models excluding vitamin D maintained comparable accuracy, suggesting minimal impact on overall predictive performance. Conclusions: Machine learning models demonstrated high accuracy and robustness in predicting UTI subtypes across preprocessing strategies. While vitamin D contributes as a supportive feature, it is not essential for reliable prediction. These findings highlight the adaptability and clinical utility of both vitamin D-inclusive and vitamin D-exclusive models, supporting deployment in diverse healthcare settings.

1. Introduction

Urinary tract infections (UTIs) represent one of the most prevalent bacterial infections globally, imposing a substantial burden on healthcare systems and significantly impacting patient quality of life [1]. Recent epidemiological data from the Global Burden of Disease study 2021 indicate that the global burden of UTIs has increased by 66.45% from 1990 to 2021, reaching approximately 4.49 billion cases with an age-standardized incidence rate of 5531.88 per 100,000 population [2]. This alarming trend underscores the urgent need for improved preventive strategies and risk prediction models. Concurrently, vitamin D deficiency has emerged as a global health concern, with prevalence rates of 24% in the United States, 37% in Canada, and 40% in Europe [3]. Growing evidence suggests a significant association between vitamin D deficiency and increased susceptibility to various infections, including UTIs [4,5]. Vitamin D plays a crucial role in modulating both innate and adaptive immune responses, and its deficiency may compromise the body’s ability to defend against uropathogenic bacteria [6].
UTIs represent a significant global health burden, affecting individuals across all age groups and geographical regions. The Global Burden of Disease study 2021 revealed that the incidence of UTIs varies considerably by demographic factors and socioeconomic status [2]. The highest burden is observed in women and older adult men, with tropical Latin America and low-middle socio-demographic index (SDI) regions exhibiting the highest age-standardized incidence, prevalence, death, and disability-adjusted life years rates [2]. The clinical impact of UTIs extends beyond acute symptoms. If not treated promptly, UTIs may lead to serious complications, including renal scarring and severe renal disease [7]. Diagnostic imaging studies have revealed renal defects in up to 85% of children with febrile UTI, with permanent renal scarring occurring in 10–40% of cases [7]. These complications can result in long-term morbidity and increased healthcare costs. The microbiological profile of UTIs is dominated by Escherichia coli, which accounts for 70–90% of cases, followed by other pathogens such as Klebsiella, Proteus, Enterococcus, and Enterobacter species [7,8]. The increasing prevalence of antimicrobial resistance among these uropathogens further complicates treatment and underscores the importance of preventive approaches [9]. Vitamin D deficiency represents a global health challenge, with varying prevalence rates across different populations. Severe vitamin D deficiency (serum 25-hydroxyvitamin D [25(OH)D] < 30 nmol/L or 12 ng/mL) affects approximately 5.9% of the US population, 7.4% of Canadians, and 13% of Europeans [3,10]. When considering a broader definition of vitamin D deficiency (<50 nmol/L or 20 ng/mL), the prevalence rates increase to 24%, 37%, and 40%, respectively [3]. Several factors influence vitamin D status, including age, ethnicity, geographical location, and lifestyle factors. Lower vitamin D levels are commonly observed in childhood and elderly populations, and non-white individuals typically show higher rates of deficiency compared to European Caucasians [3,10]. Other high-risk groups include individuals with chronic diseases, gastrointestinal disorders, obesity, and those with limited sun exposure [3]. The health implications of vitamin D deficiency extend beyond its well-established role in bone health. Vitamin D receptors and vitamin D-activating enzymes are present in various immune cells, suggesting a broader physiological role [11]. Upon activation, vitamin D binds to its receptor to regulate DNA transcription, stimulate the expression of antimicrobial peptides, and enhance innate immune responses [11,12]. These mechanisms provide a biological basis for the observed association between vitamin D deficiency and increased susceptibility to infections.
A growing body of evidence supports the association between vitamin D deficiency and increased UTI risk. A recent meta-analysis found that children with UTI had significantly lower serum vitamin D levels compared to healthy controls (weighted mean difference: −7.730, 95% CI: −11.57, −3.89; p < 0.001) [5]. Furthermore, low vitamin D levels were associated with a 2.8-fold increased risk of UTI (OR: 2.80; 95% CI: 1.55, 5.05; p = 0.001), with the risk rising to 5.49-fold when serum vitamin D levels fell below 20 ng/mL (OR: 5.49, 95% CI: 1.12, 27.04; p = 0.036) [5]. Similar findings have been reported in adult populations. A study of women of reproductive age found that those with low vitamin D levels had a significantly higher risk of UTI compared to women with sufficient vitamin D status [13]. The association persisted after adjusting for potential confounding factors, suggesting an independent relationship. The biological mechanisms underlying this association involve vitamin D’s role in immune function. Vitamin D reduces the inflammatory response by decreasing interferon-γ production and upregulating antimicrobial peptides in the bladder during E. coli infections, thereby reducing urethral damage [14,15]. Additionally, vitamin D enhances the production of cathelicidin and β-defensin 2, antimicrobial peptides that play a crucial role in the innate immune response against uropathogens [16]. While some studies suggest that vitamin D supple mentation may prevent UTIs [17], the evidence is not consistent across all studies [18]. This inconsistency highlights the need for a more nuanced understanding of the relationship between vitamin D status and UTI risk, taking into account individual patient characteristics and other clinical factors.
Machine learning (ML) has emerged as a powerful tool for clinical risk prediction, offering advantages over traditional statistical methods in handling complex, multidimensional data and identifying non-linear relationships [19]. Recent advances in ML have enabled the development of sophisticated predictive models for various health conditions, including vitamin D deficiency and infectious diseases [20,21]. In the context of vitamin D deficiency, ML models have demonstrated high accuracy in predicting deficiency risk using data obtained through simple interviews [21]. An XGBoost-based prediction tool achieved excellent performance in identifying individuals at risk of vitamin D deficiency, potentially enabling targeted screening and intervention [21]. For UTI prediction specifically, ensemble ML approaches have achieved prediction accuracies of up to 85.64%, with gender and age identified as important predictive variables [22]. Moreover, ML models have outperformed traditional clinical decision rules in predicting critical out-comes in patients with UTI [23], suggesting their potential utility in clinical practice. Despite these advances, there is limited research on ML-based prediction of UTI risk specifically in the context of vitamin D deficiency. This represents a significant gap in the literature and an opportunity for innovation. By integrating vitamin D status with other clinical parameters in a multidimensional analysis, ML algorithms could potentially identify complex patterns and interactions that influence UTI risk, leading to more ac-curate and personalized risk prediction.
The intersection of these two significant health issues—UTIs and vitamin D deficiency—presents an opportunity for innovative approaches to risk prediction and prevention. Machine learning (ML), with its capacity to analyze complex, multidimensional clinical data and identify non-linear relationships, offers promising potential for developing sophisticated predictive models [24]. By integrating vitamin D status with other clinical parameters, ML algorithms could potentially identify high-risk individuals and guide targeted preventive interventions.

2. Materials and Methods

The Excel file contains multiple sheets including LOWER UTI, UPPER UTI, UTI, NON UTI, and VitD Level. These sheets are read using pandas.read_excel() and unnecessary columns such as underlying disease are removed. The sheets are then combined into a single DataFrame using pd.concat([…], ignore_index = True), ensuring that column names match. After merging, redundant columns such as Height.1, Weight.1, or BMI.1 may appear due to inconsistent naming. These are removed, and df.drop_duplicates() is applied to eliminate duplicate rows, resulting in a clean and consistent dataset.
In medical data analysis, preprocessing is essential to ensure accuracy and efficiency for downstream analytics or machine learning tasks. Using a urinary tract infection dataset as an example, date columns are first converted from strings to proper datetime format using pandas.to_datetime(), allowing extraction of year, month, and day for chronological and seasonal analysis. Missing values in categorical variables, such as Urinalysis Nitrite or Leukocyte Esterase, are imputed with placeholders like “missing” rather than deleted, as the absence of test results may carry clinical meaning. Numeric variables such as fasting blood sugar or HbA1c are also checked for missing values and imputed appropriately to preserve their predictive value.
Through these preprocessing steps, the dataset becomes cleaner, more consistent, and ready for reliable analysis or integration into clinical prediction models.
The dataset comprised 332 de-identified clinical records from the University of Phayao Hospital, initially containing 23 features. The preprocessing and analysis pipeline followed a stepwise workflow (Figure 1) as described below:
1.
All categorical variables were transformed using one-hot encoding, expanding the dataset to 28 features while retaining 332 instances.
2.
Two parallel strategies were employed to address missing values in fasting blood sugar (FBs) and HbA1c:
  • Row-removal strategy: Entire rows with missing FBs or HbA1c were excluded, resulting in 203 instances and 28 features.
  • Column-dropping strategy: Instead of removing patients, the columns FBs and HbA1c were dropped, yielding 332 instances and 26 features.
3.
For each strategy, three analytical steps were conducted:
  • Machine learning model prediction using six algorithms (Extra Trees, Gradient Boosting, XGBoost, Logistic Regression, Random Forest, LightGBM).
  • Feature importance analysis to identify the most influential predictors.
  • Statistical testing of serum vitamin D distribution using the Shapiro–Wilk test for normality and the Kruskal–Wallis test for group comparisons.
4.
Outlier removals were excluded from each strategy:
  • Row-removal strategy: Outliers were reduced to 169 instances with 28 features.
  • Column-dropping strategy: Outliers were reduced to 330 instances with 28 features.
5.
Following outlier removal, the same three analytical steps were repeated (machine learning model prediction, feature importance, and statistical analysis).
6.
Features with low correlation to the target outcome were further excluded:
  • Row-removal strategy: In total, 3 low-correlation features were removed, yielding 169 instances with 25 features.
  • Column-dropping strategy: In total, 13 low-correlation features were removed, yielding 330 instances with 13 features.
7.
The refined datasets were subjected once more to machine learning prediction, feature importance, and statistical analysis to confirm the robustness of the results.

3. Results

The main results are presented based on two preprocessing strategies. Section 3.1 evaluates model performance after removing rows with missing FBs and HbA1c, while Section 3.2 assesses outcomes when dropping these columns to retain more patient instances.

3.1. Removing Rows with Missing FBs and HbA1c

In the dataset, two key variables—FBs and HbA1c—contained missing values. Rather than imputing, the preprocessing step removed all rows with null entries for these fields, prioritizing data quality over dataset size. This reduced the sample count from 406 to 203, a 50% decrease. Such an approach is acceptable when the remaining data still represents the target population and preserves adequate variance for reliable model training.
Table 1 demonstrates that including serum vitamin D slightly improved model performance across metrics. Extra Trees showed the best results (Accuracy = 0.9510, F1 = 0.9503, AUC = 0.9899), while Gradient Boosting and XGBoost followed closely. Logistic Regression, though less accurate (Accuracy = 0.9362, AUC = 0.9783), was retained for its interpretability, complementing Extra Trees’ strong predictive ability.
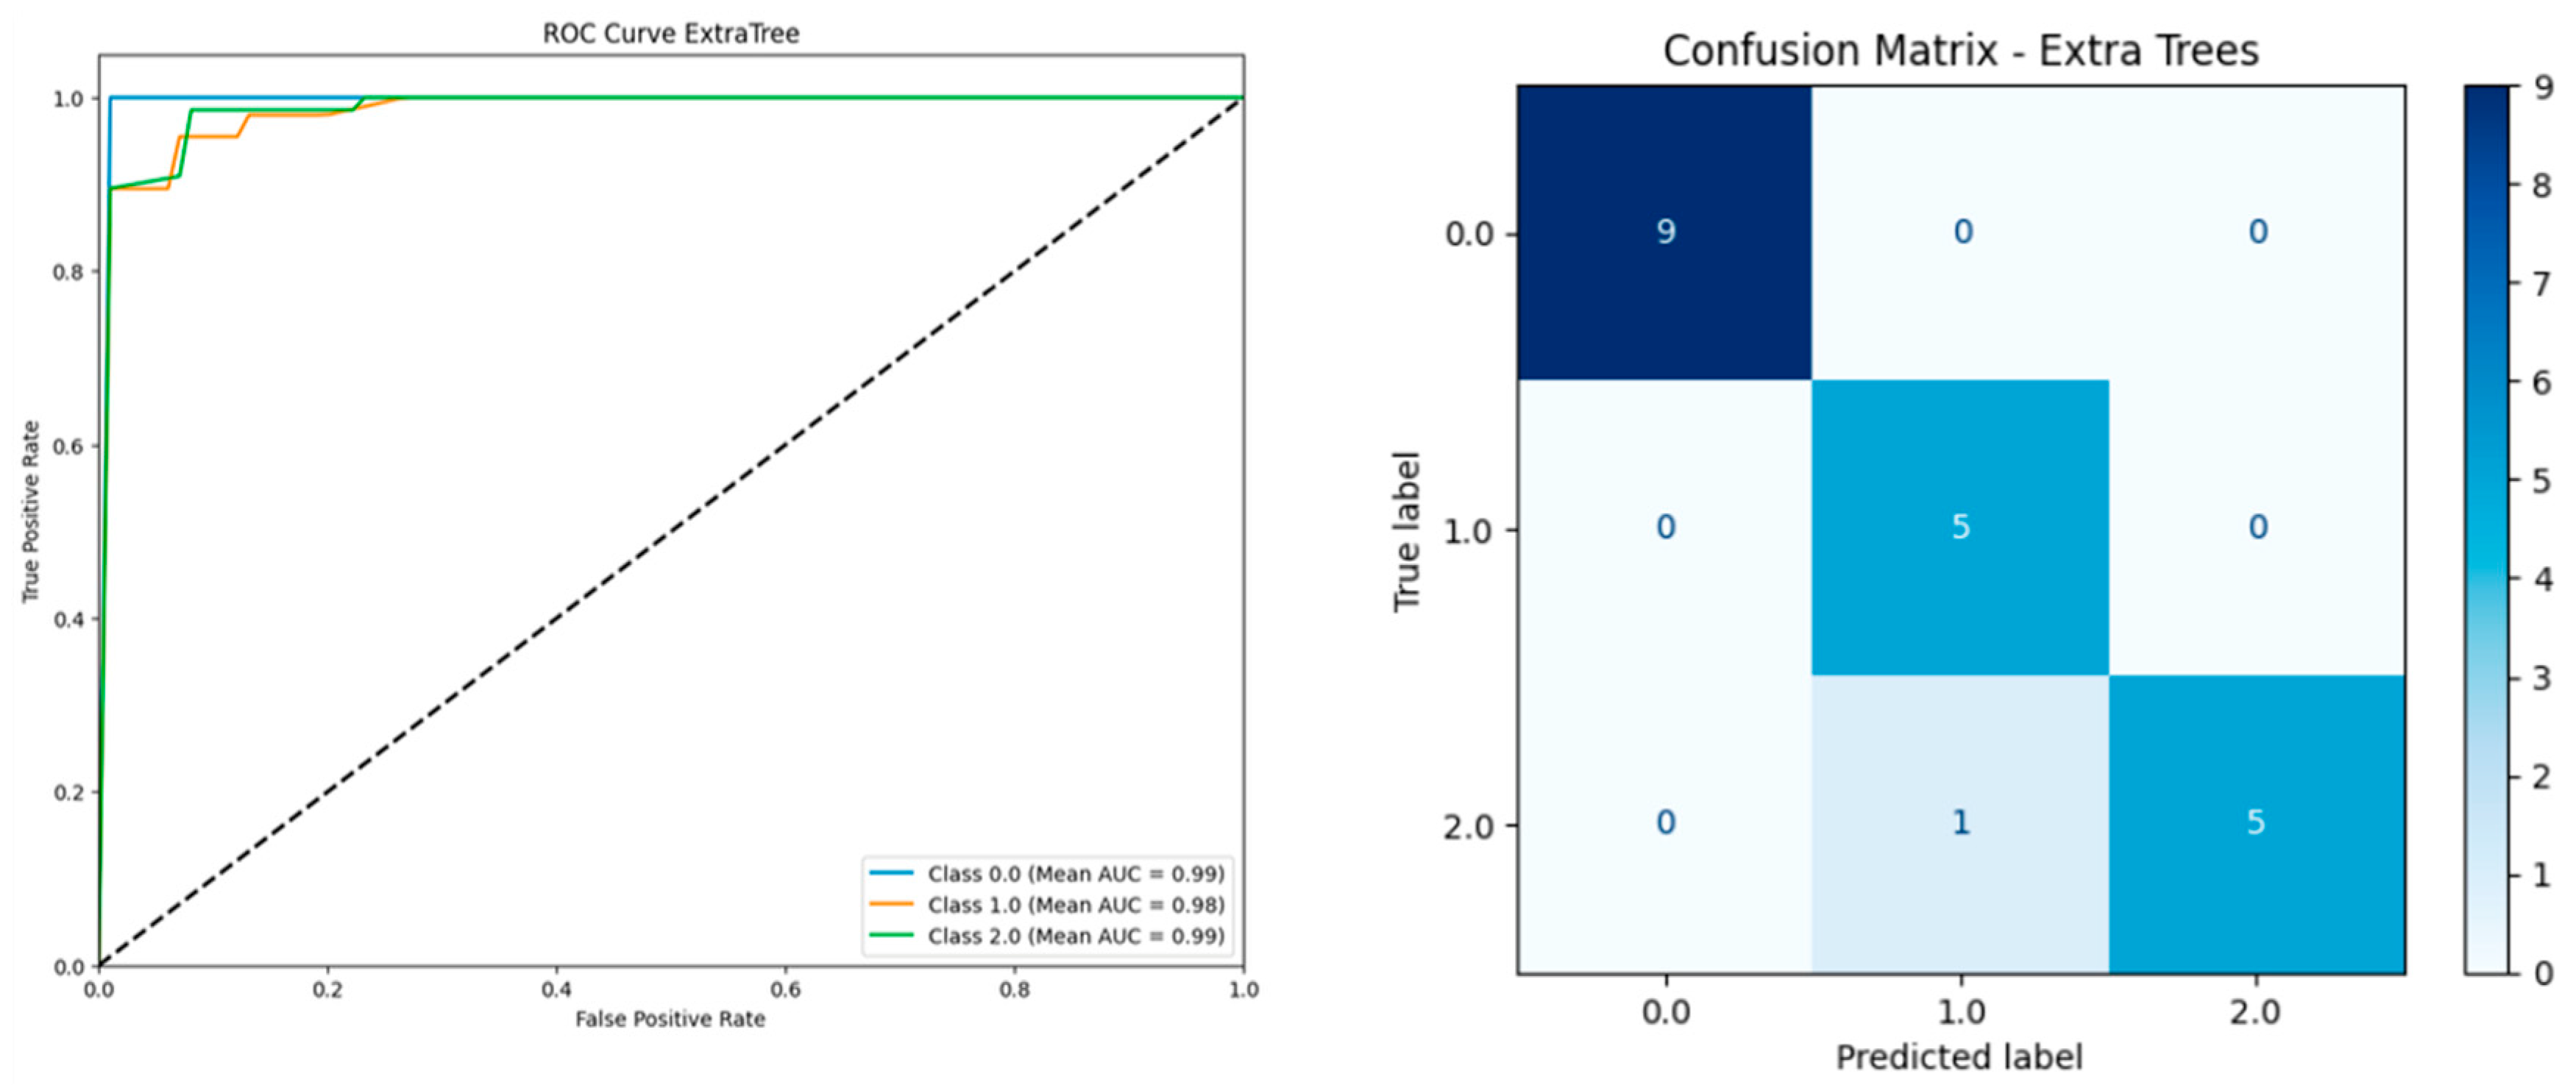
Figure 2, the Extra Trees model showed excellent classification performance, with AUC scores of 0.99 (Class 0), 0.98 (Class 1), and 0.99 (Class 2). The confusion matrix confirms high accuracy: all cases in Class 0 and Class 1 were correctly predicted, while only one Class 2 case was misclassified as Class 1. These results highlight the model’s strong ability to distinguish between non-UTI, lower UTI, and upper UTI cases.
We next performed a feature importance analysis using Extra Trees and Logistic Regression to identify the most influential predictors of UTI type. Particular attention was given to serum vitamin D level to evaluate its relative contribution compared with other clinical variables in this dataset (203 instances, 28 features).
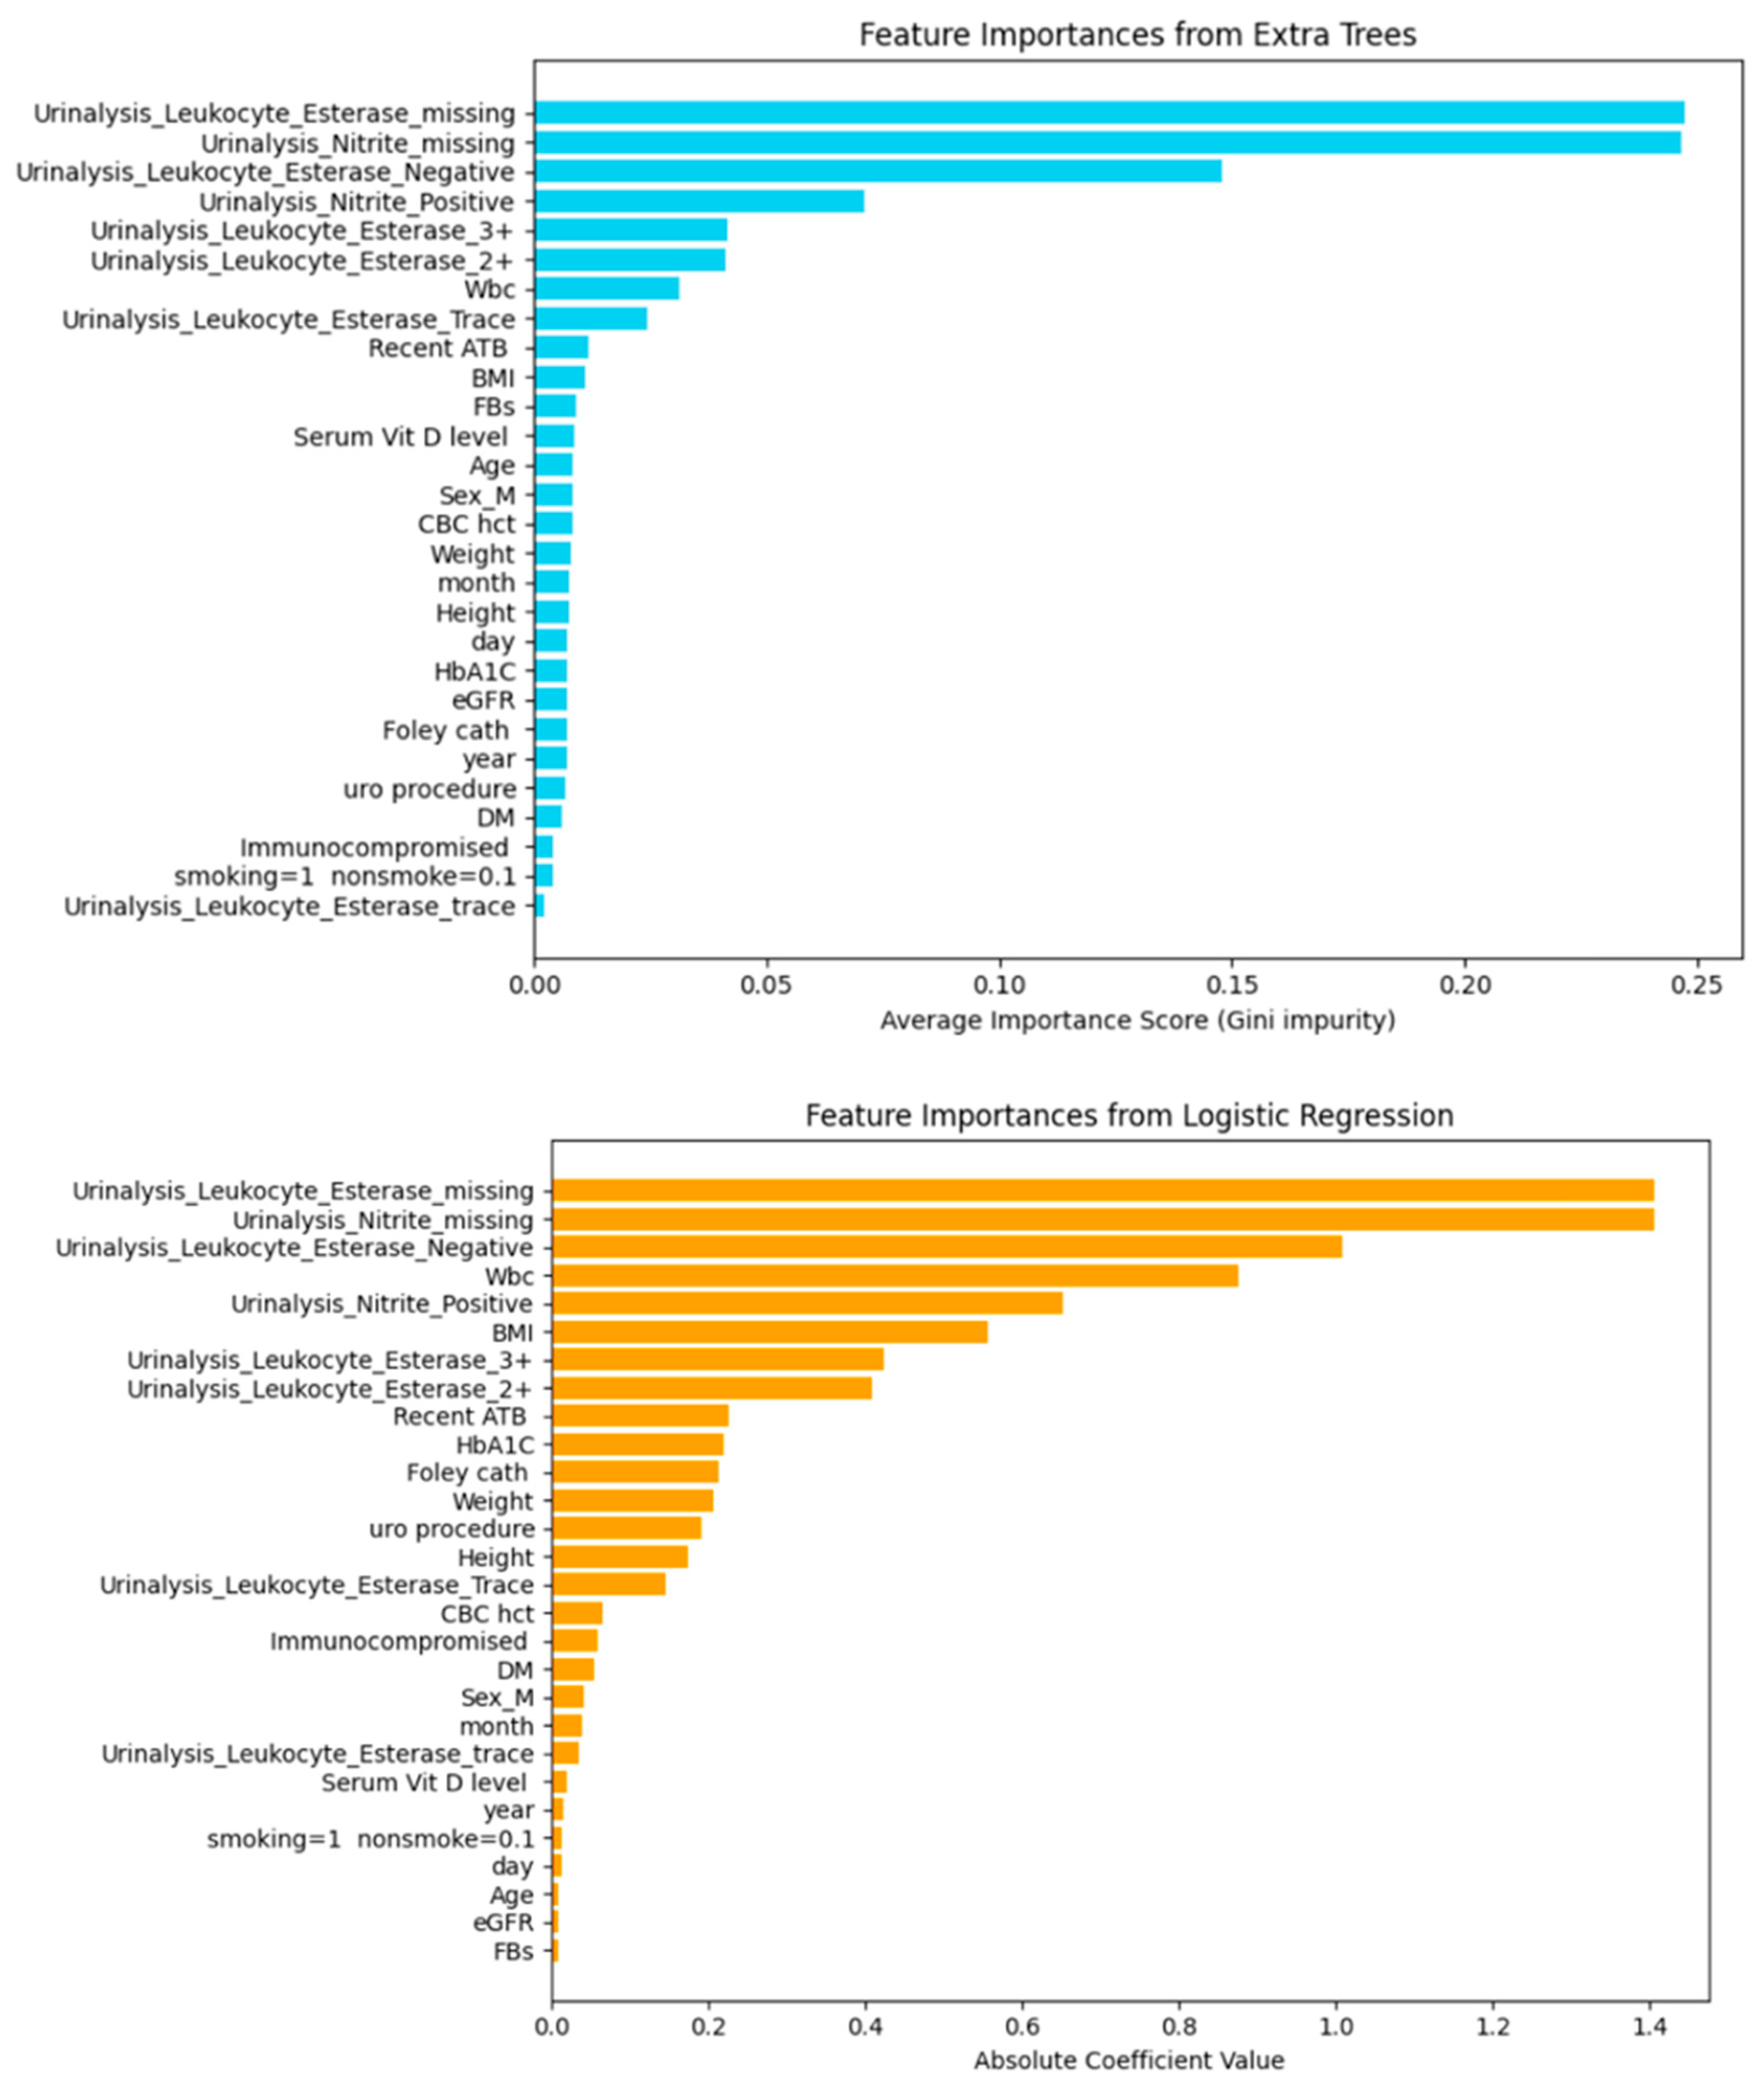
Figure 3, both Extra Trees and Logistic Regression consistently ranked urinalysis-related features (Leukocyte Esterase and Nitrite measures) as the most influential predictors of UTI classification. While variables such as WBC and BMI showed moderate importance, serum vitamin D level demonstrated only a minor contribution across both models, suggesting limited predictive value compared with core urinalysis findings. These patterns highlight the dominant role of urinalysis features while providing evidence that vitamin D is not a strong independent predictor in this dataset.
To enhance model performance and data quality, outliers in numeric variables such as Height, Weight, FBs, and eGFR were detected using the Interquartile Range (IQR) method. A boxplot was used to visualize extreme values prior to applying the filter. After outlier removal, the dataset was reduced to 169 instances and 28 features, and six machine learning models were evaluated using 10-fold cross-validation.
Table 2 shows that Extra Trees achieved the best overall performance when including serum vitamin D (Accuracy = 0.9467, AUC = 0.9924). However, excluding vitamin D slightly improved some metrics, with XGBoost reaching the highest AUC (0.983) and Extra Trees maintaining strong accuracy (0.9479). Logistic Regression consistently showed the lowest results. These findings suggest that vitamin D adds limited predictive value, while tree-based ensemble methods remain the most robust across both settings.
Figure 4, the ROC curve shows that the Extra Trees model achieved excellent discrimination across all classes, with AUC scores of 0.99 for Class 0, 0.98 for Class 1, and 0.99 for Class 2. The confusion matrix demonstrates high classification accuracy: all samples in Class 0 and Class 2 were correctly predicted, while one Class 1 sample was misclassified as Class 2. These results confirm the model’s strong performance in distinguishing UTI subtypes following outlier handling.
After outlier removal, the dataset was reduced to 169 instances and 28 features. We then analyzed feature importance using Extra Trees and Logistic Regression to compare the relative contributions of clinical and laboratory variables. The following figures present the ranking of features from both models.
Figure 5, both Extra Trees and Logistic Regression consistently highlighted urinalysis-related features (Leukocyte Esterase and Nitrite measures) as the dominant predictors for UTI classification. While WBC and BMI showed moderate contributions, serum vitamin D level demonstrated minimal importance in both models, suggesting it is not a strong independent predictor compared with urinalysis features.
To refine the feature set and reduce redundancy, correlation analysis was performed using both Spearman and Pearson coefficients. This step aims to identify features with strong associations to the target variable while excluding those with weak or negligible correlations. Table 3 summarizes the Spearman correlation results for key urinalysis-related features.
Table 3 presents the Spearman correlation coefficients between selected urinalysis-related features and the target outcome. The strongest positive correlation was observed with Urinalysis Leukocyte Esterase Negative (ρ = 0.748), followed by moderate correlations from Trace and 2+ results. In contrast, Urinalysis Leukocyte Esterase missing and Urinalysis Nitrite missing showed very strong negative correlations (ρ = −0.923), indicating that missing values may be systematically associated with specific outcome patterns. Other features, including Sex M and Urinalysis Nitrite Positive, showed negligible correlations. These findings suggest that both observed results and missingness in urinalysis data carry meaningful signals for UTI classification.
Table 4, pearson correlation analysis of clinical and demographic features showed weak correlations with the target variable across all features. The highest correlation was found for eGFR (ρ = 0.1597), followed by BMI, Weight, and day, but all remained below 0.2, indicating limited predictive strength. Several variables such as Age, Recent ATB, and Serum Vitamin D level showed weak negative correlations. Overall, no single clinical or demographic feature demonstrated a strong or dominant association, suggesting their individual impact on UTI classification is minimal.
After removing low-correlation features (smoking, CBC hct, Foley cath), the dataset comprised 169 instances and 25 features. The subsequent table summarizes the predictive performance of the models.
Table 5, model performance remained robust after feature removal. Logistic Regression achieved the highest accuracy (=0.9471), while Extra Trees, XGBoost, and Random Forest maintained strong accuracy (≥0.9408) and high AUC (>0.990). LightGBM showed comparatively lower scores. Including serum vitamin D yielded slightly higher performance across most models (e.g., Extra Trees AUC = 0.9910 vs. 0.9869 without, Logistic Regression AUC = 0.9909 vs. 0.9817 without), indicating a modest but consistent benefit from incorporating vitamin D.
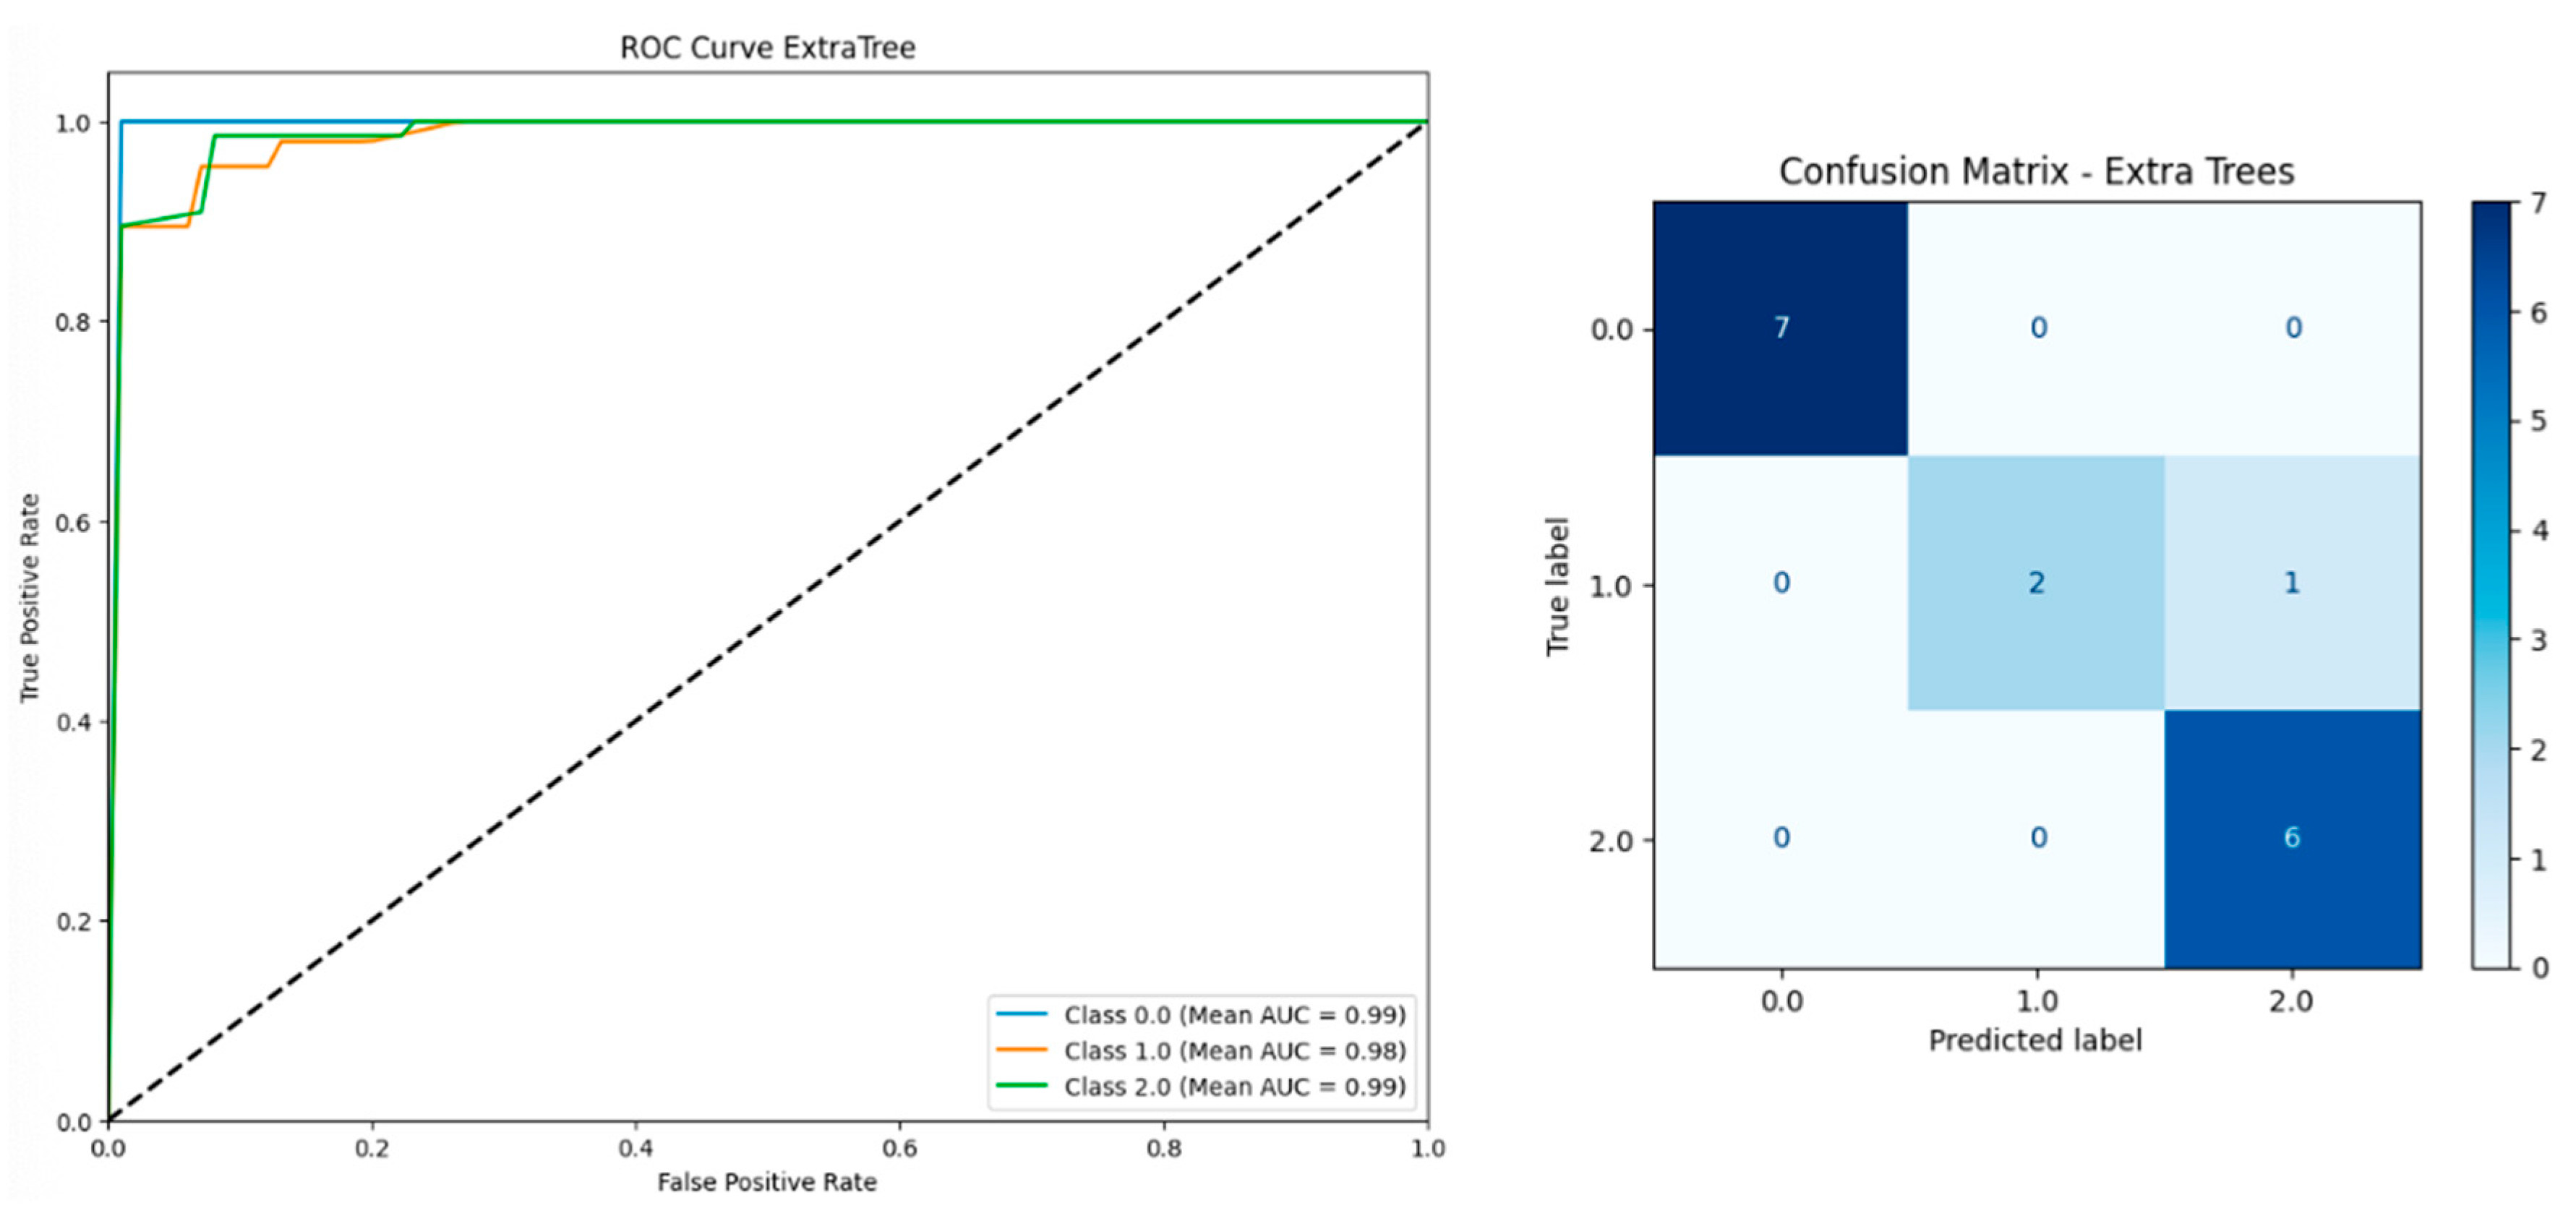
Figure 6, based on the ROC curve and confusion matrix of the Extra Trees model after the removal of low-correlation features, the model maintained high predictive performance. The AUC values for each class ranged between 0.96 and 0.99, indicating excellent discriminative ability. The confusion matrix further demonstrates that the model accurately classified most cases across all groups, with no misclassifications between class 0 and class 2. Notably, class 1 was perfectly predicted with all three instances correctly identified. These results highlight the robustness and reliability of the Extra Trees model following feature selection.
To further evaluate the contribution of the remaining variables, feature importance was analyzed using Extra Trees and Logistic Regression. The following figures illustrate the ranking of features derived from both models.
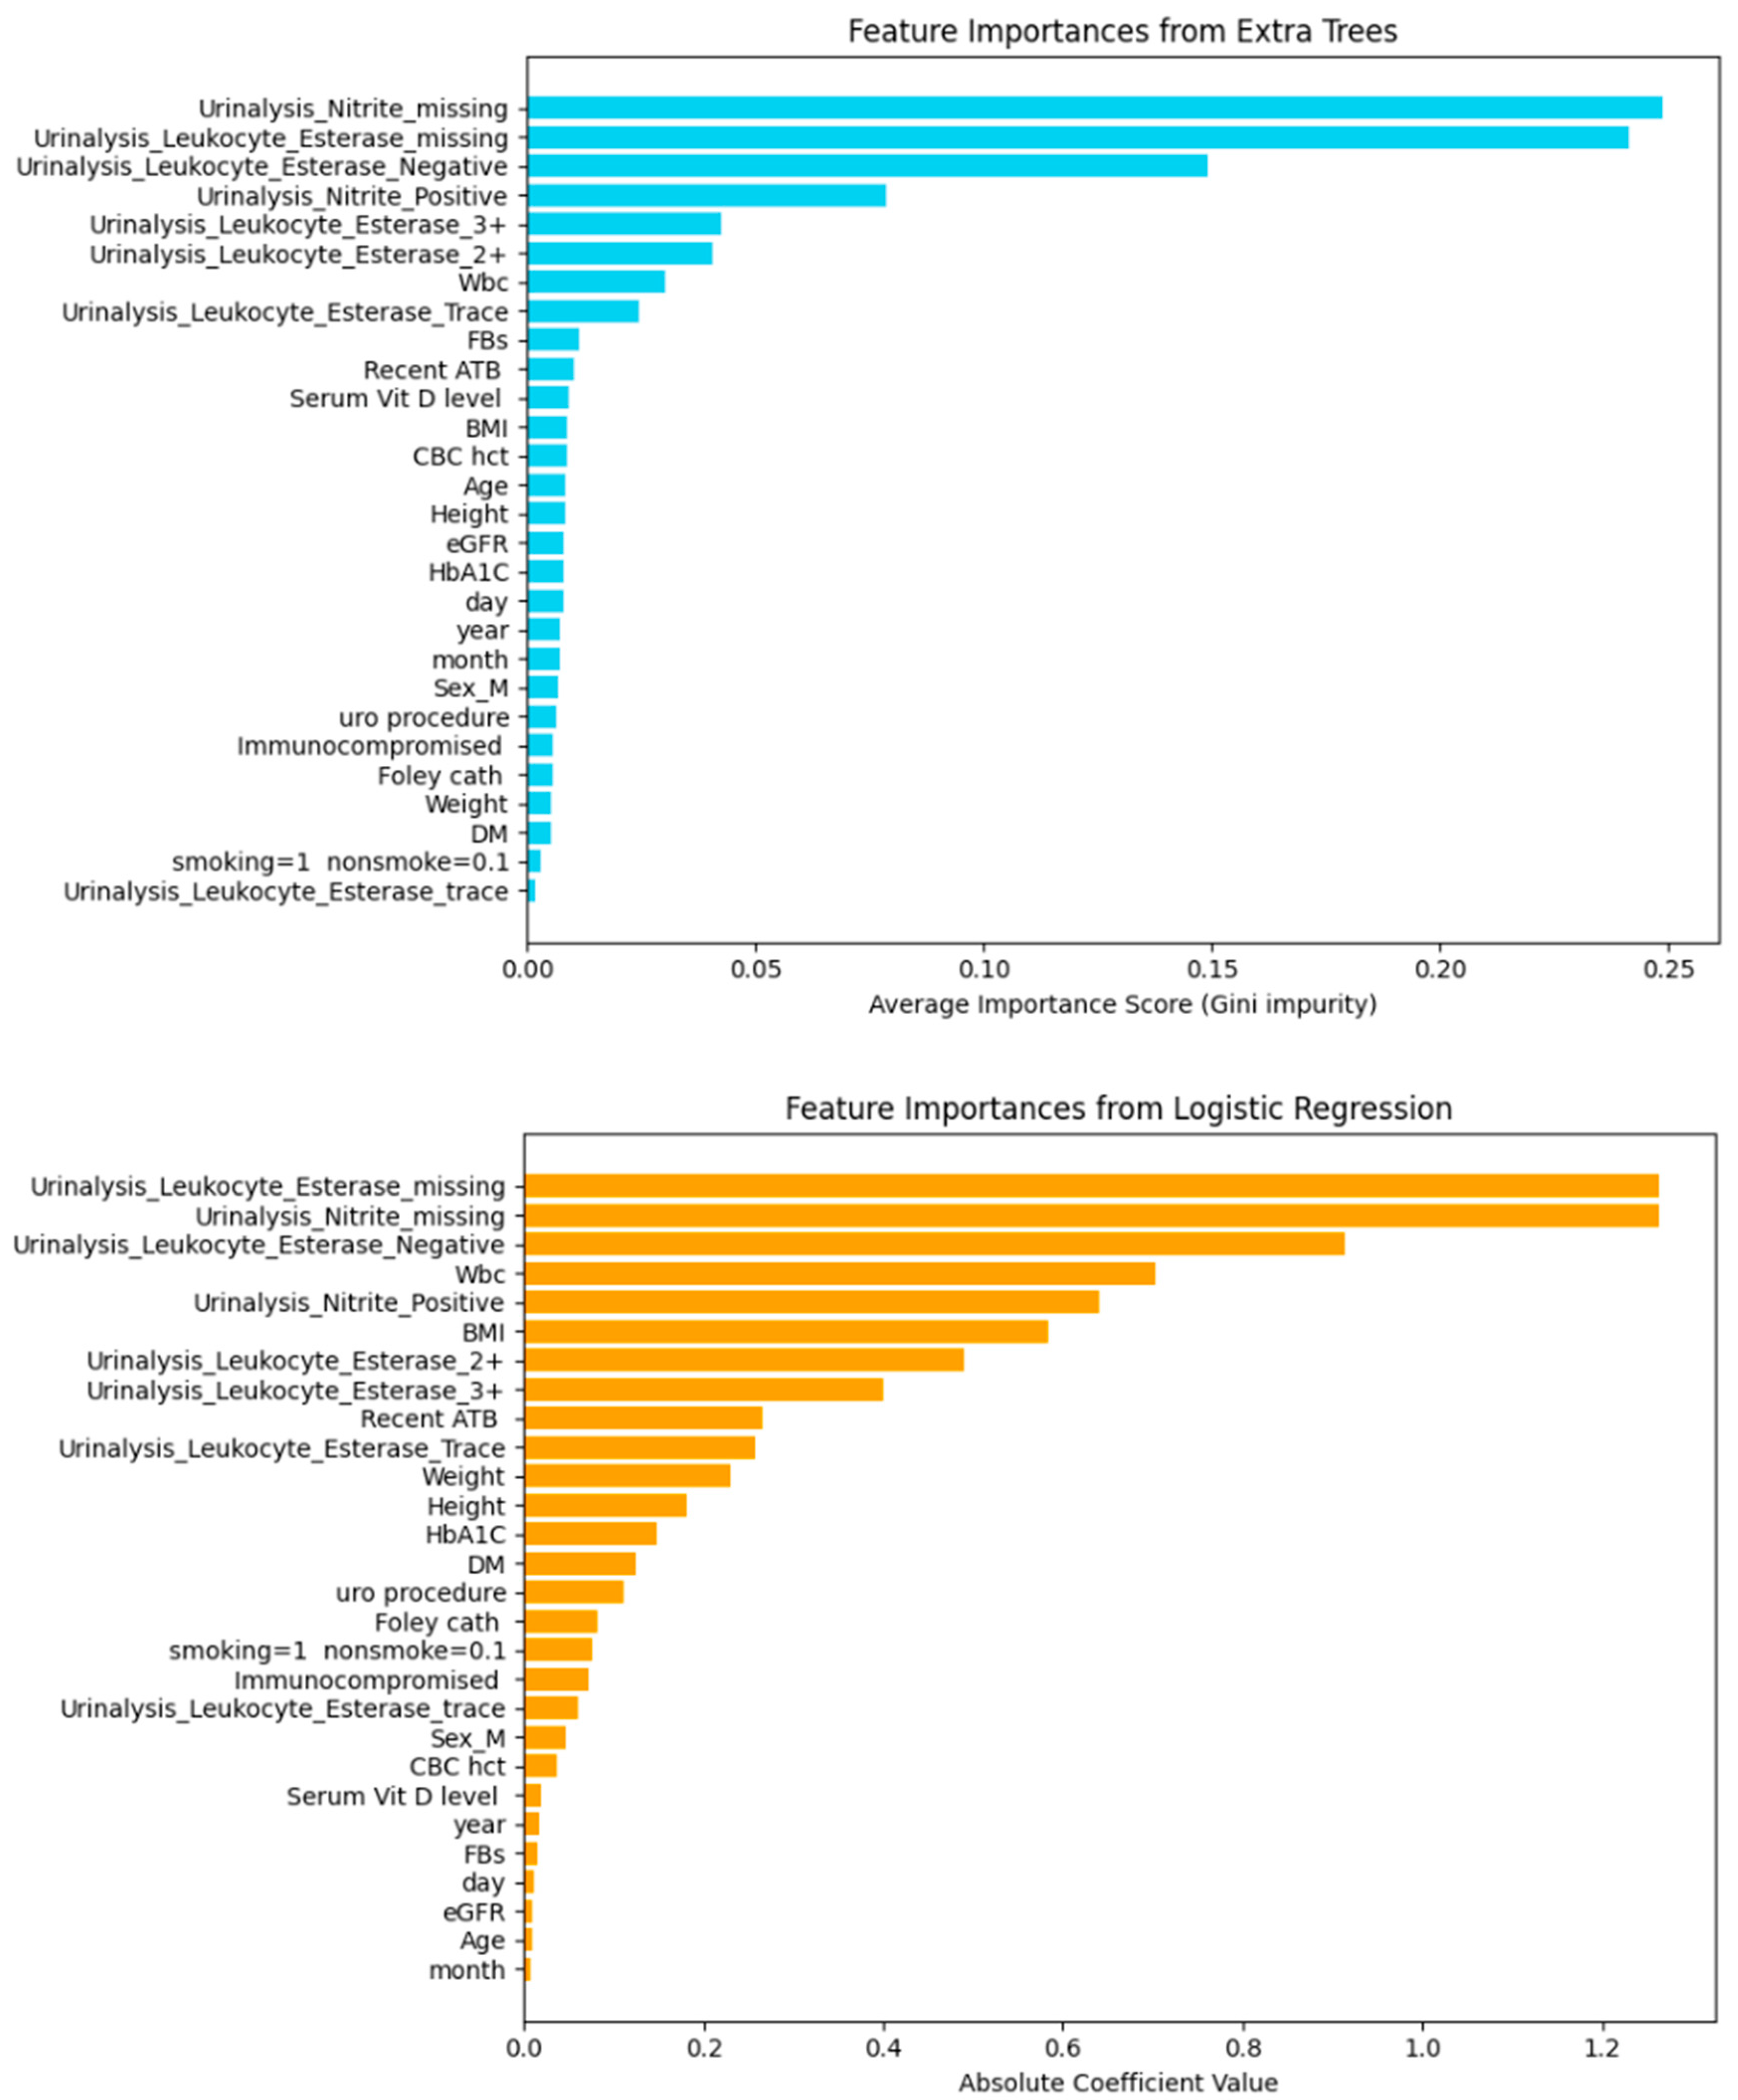
Figure 7, both Extra Trees and Logistic Regression identified urinalysis features—particularly Nitrite missing, Leukocyte Esterase missing, and Leukocyte Esterase Negative—as the strongest predictors for UTI classification. In contrast, serum vitamin D level showed negligible importance across both models, confirming its limited role compared with urinalysis measures.
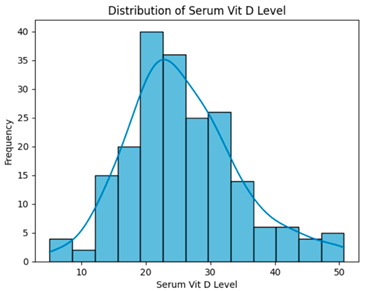
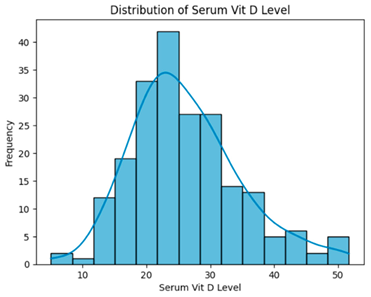
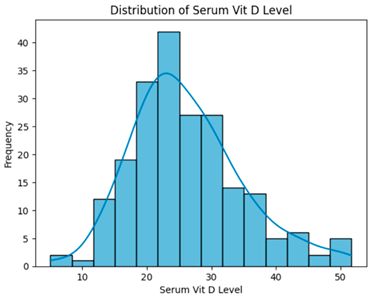
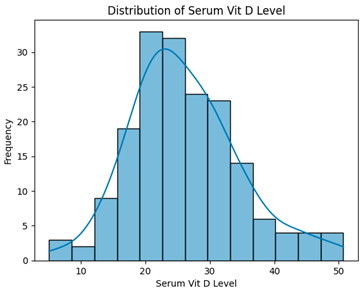
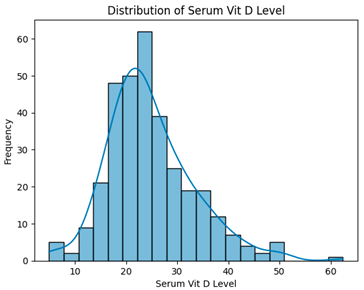
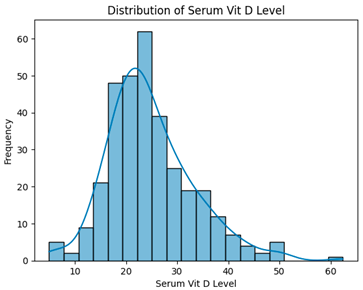
Table 6, across all preprocessing steps, serum vitamin D levels exhibited non-normal distributions, and Kruskal–Wallis tests confirmed no statistically significant differences between groups. This indicates vitamin D did not contribute meaningfully to outcome separation in this dataset.

3.2. Dropping Columns with Null FBs and HbA1c Values

After removing instances with null values in FBs and HbA1C, the dataset was 332 instances. One-hot encoding was then applied to Urinalysis_Leukocyte_Esterase, Urinalysis_Nitrite, and Sex (dropping the last feature), yielding 332 instances and 26 features.
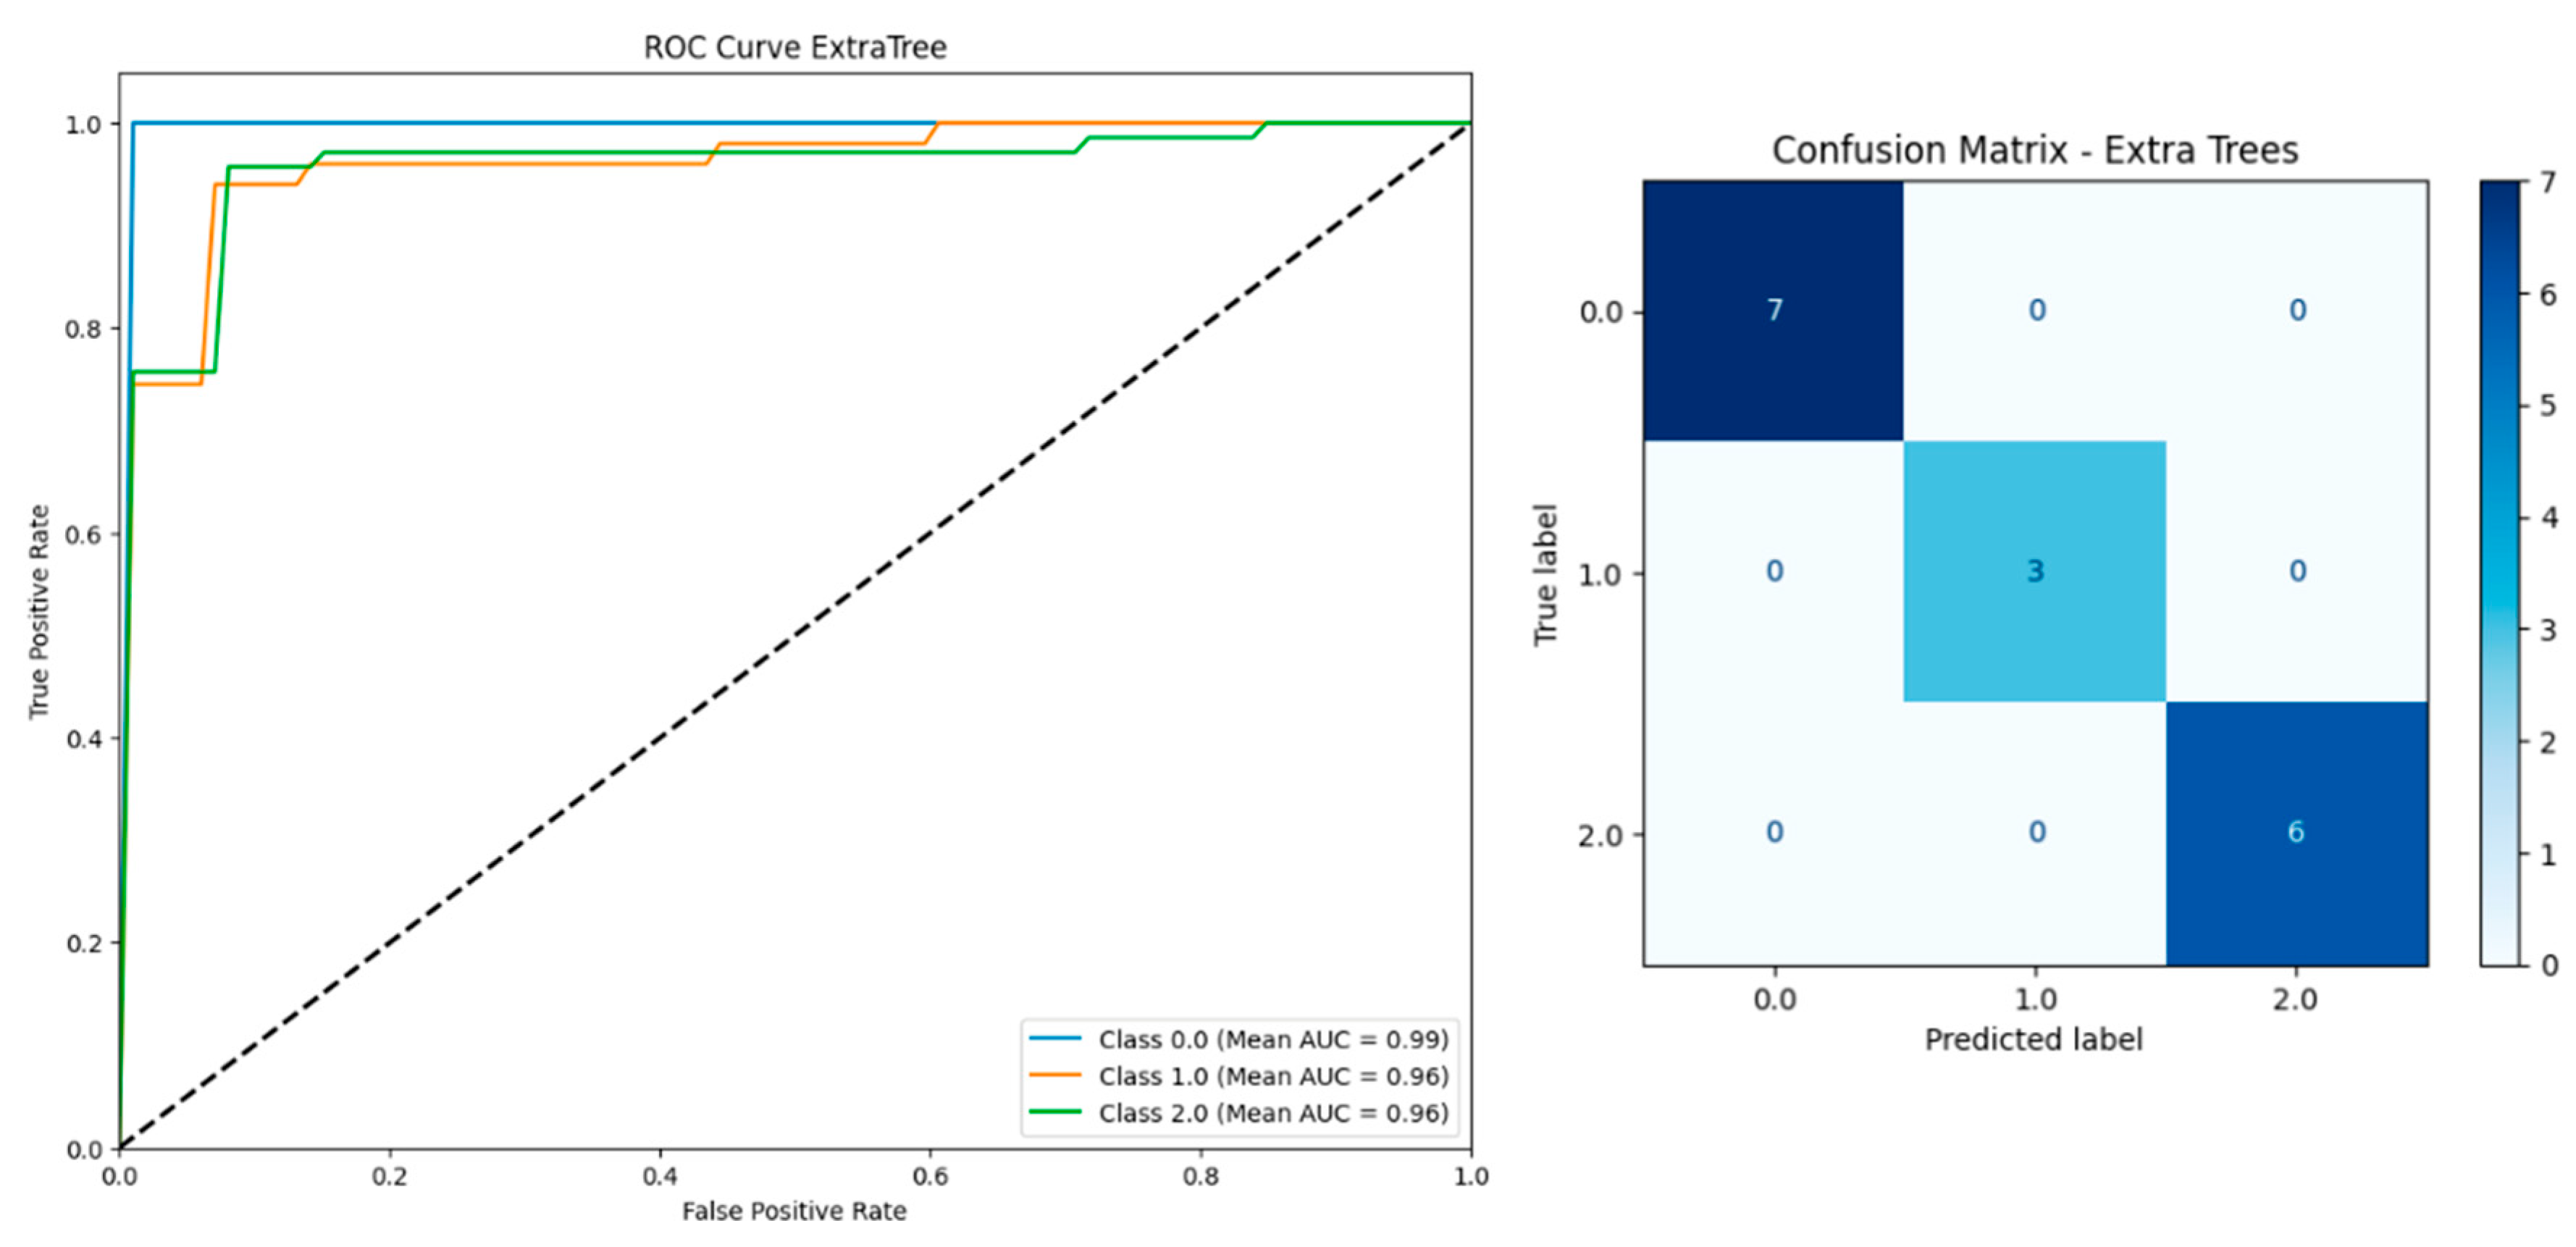
Table 7 shows that Random Forest achieved the highest overall performance (Accuracy = 0.9526, F1 = 0.9517, AUC = 0.9828), followed by Logistic Regression and Extra Trees. Gradient Boosting and LightGBM showed relatively lower scores. Comparing models with and without serum vitamin D inclusion, the performance differences were minimal across all metrics, indicating that vitamin D contributed little to predictive improvement in this dataset.
Figure 8, the ROC curve illustrates strong discriminative performance of the Extra Trees classifier across all classes, with AUC values of 0.99 for Class 0, 0.94 for Class 1, and 0.96 for Class 2. The corresponding confusion matrix shows high classification accuracy, with all instances of Class 0 (14) and Class 2 (12) correctly predicted. Only one misclassification occurred in Class 1, where one sample was incorrectly predicted as Class 2. These results confirm the model’s high precision and robustness following the exclusion of FBs and HbA1c columns.
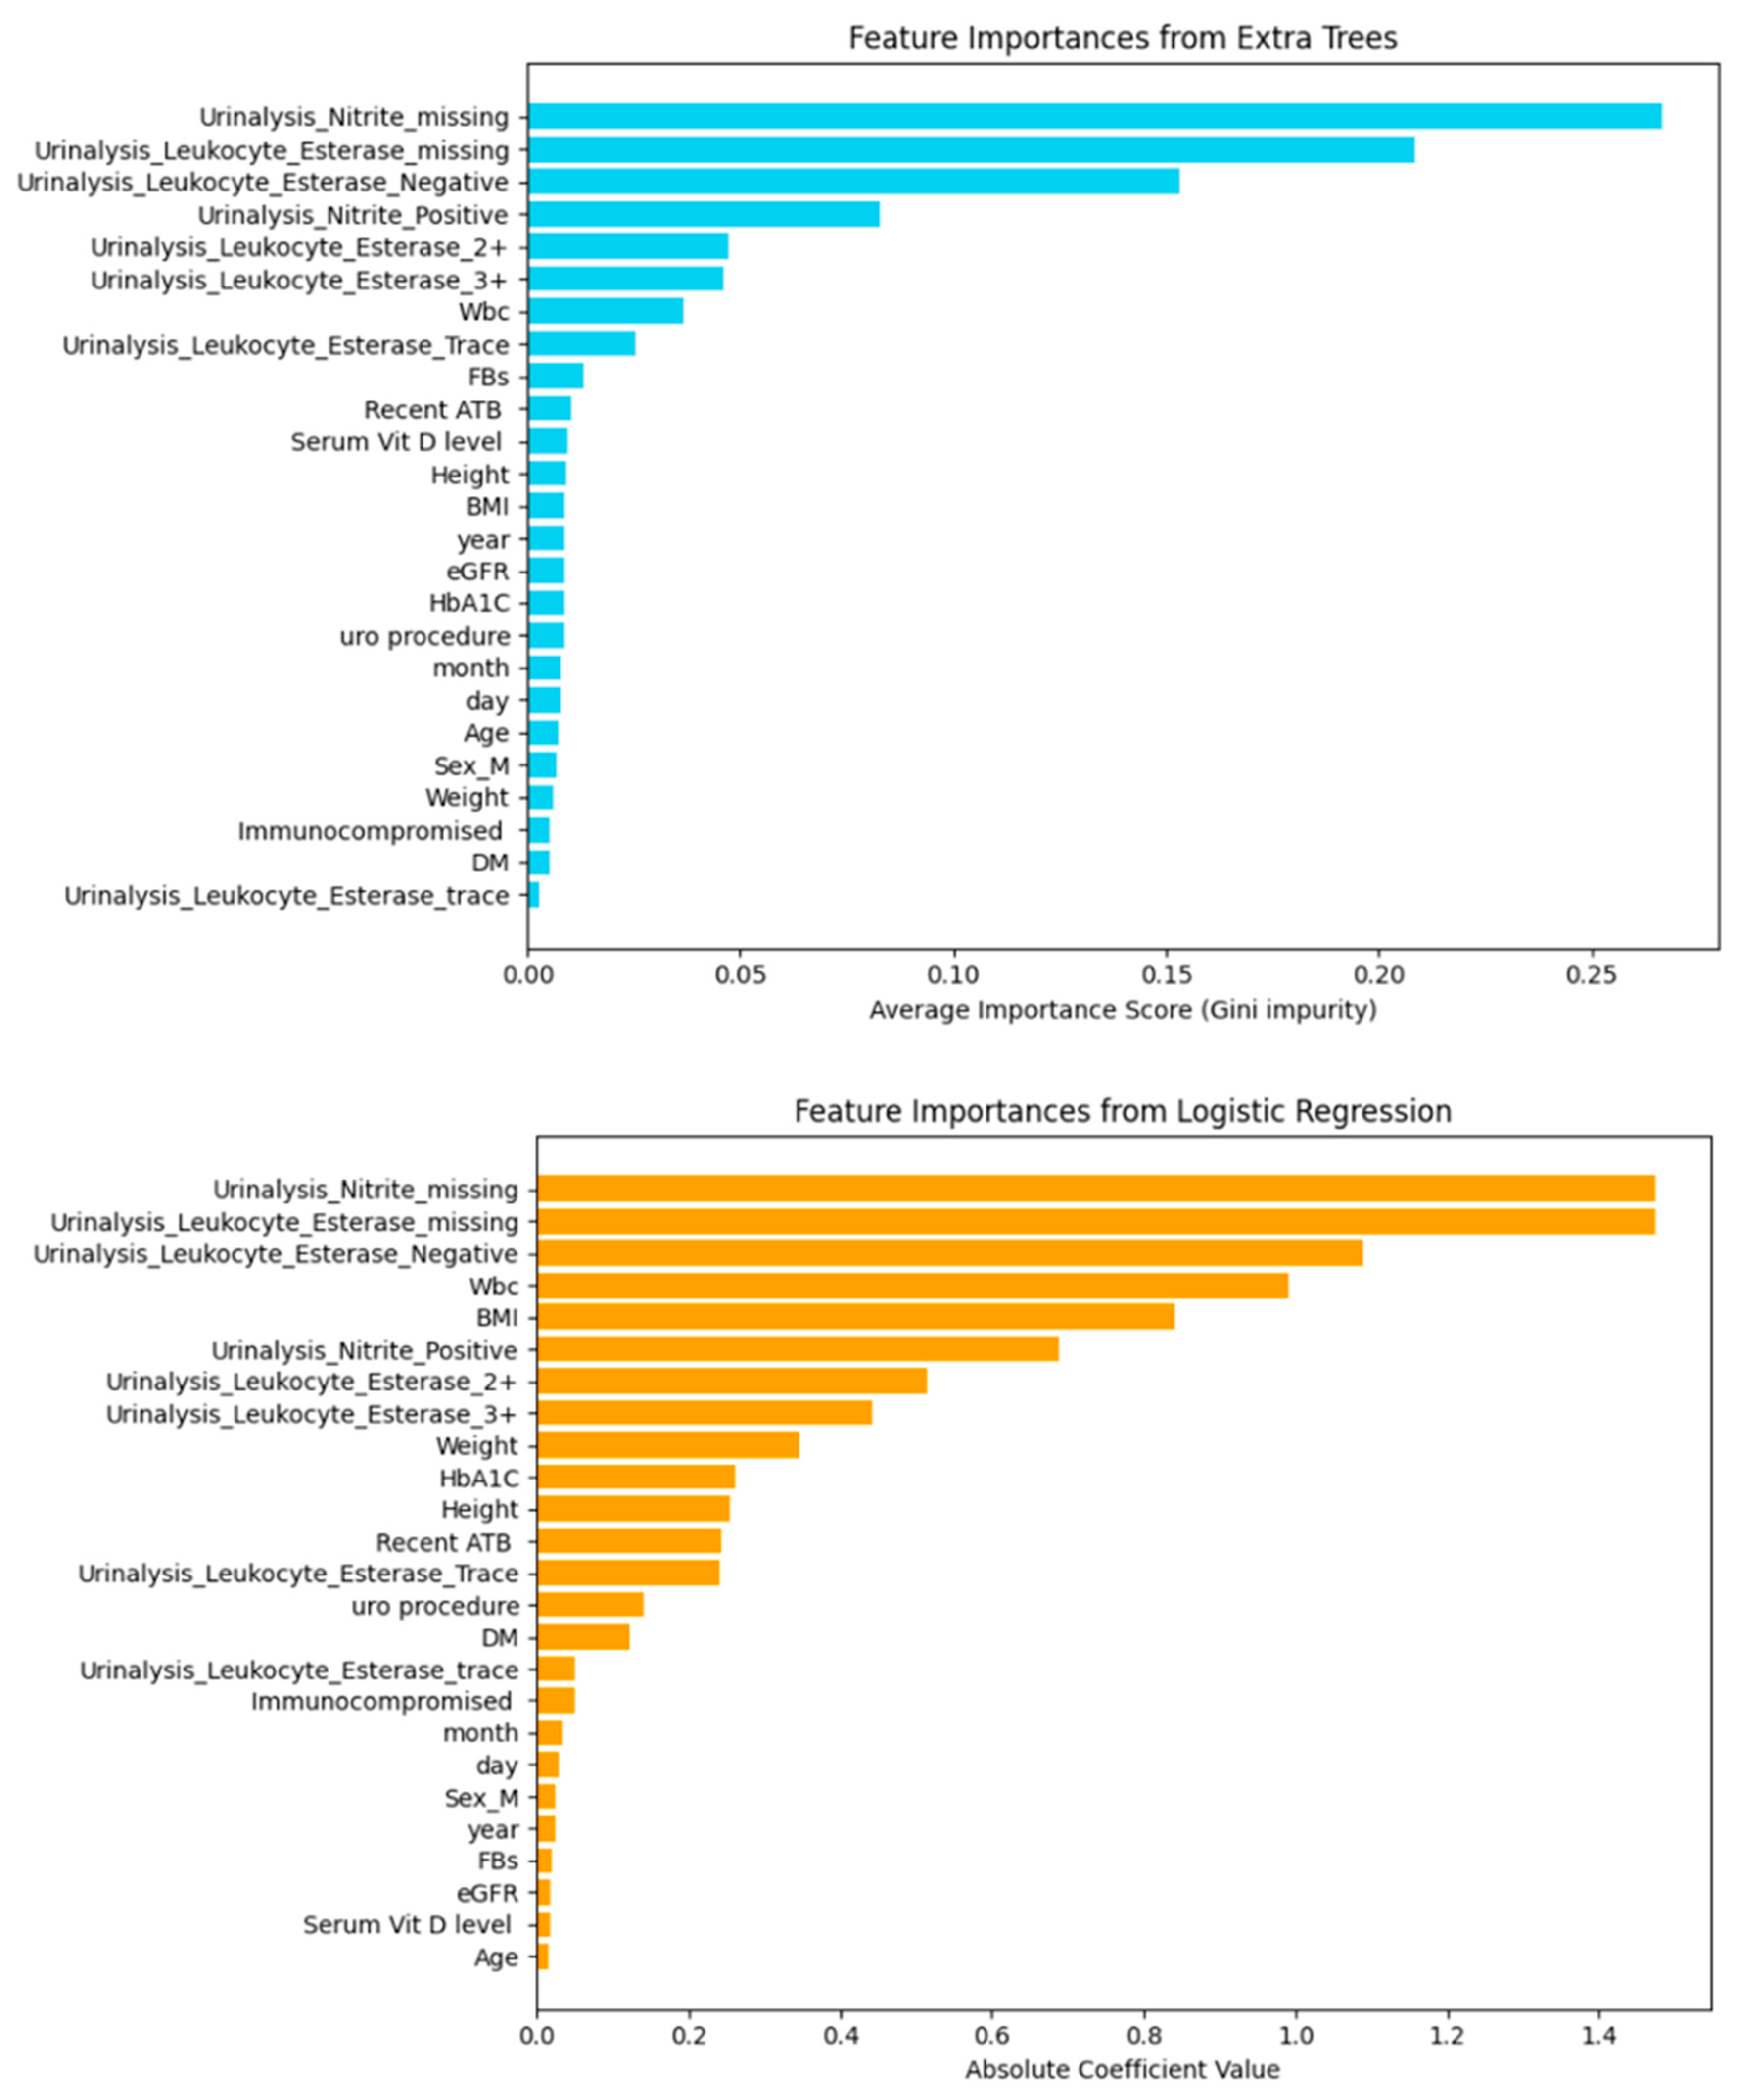
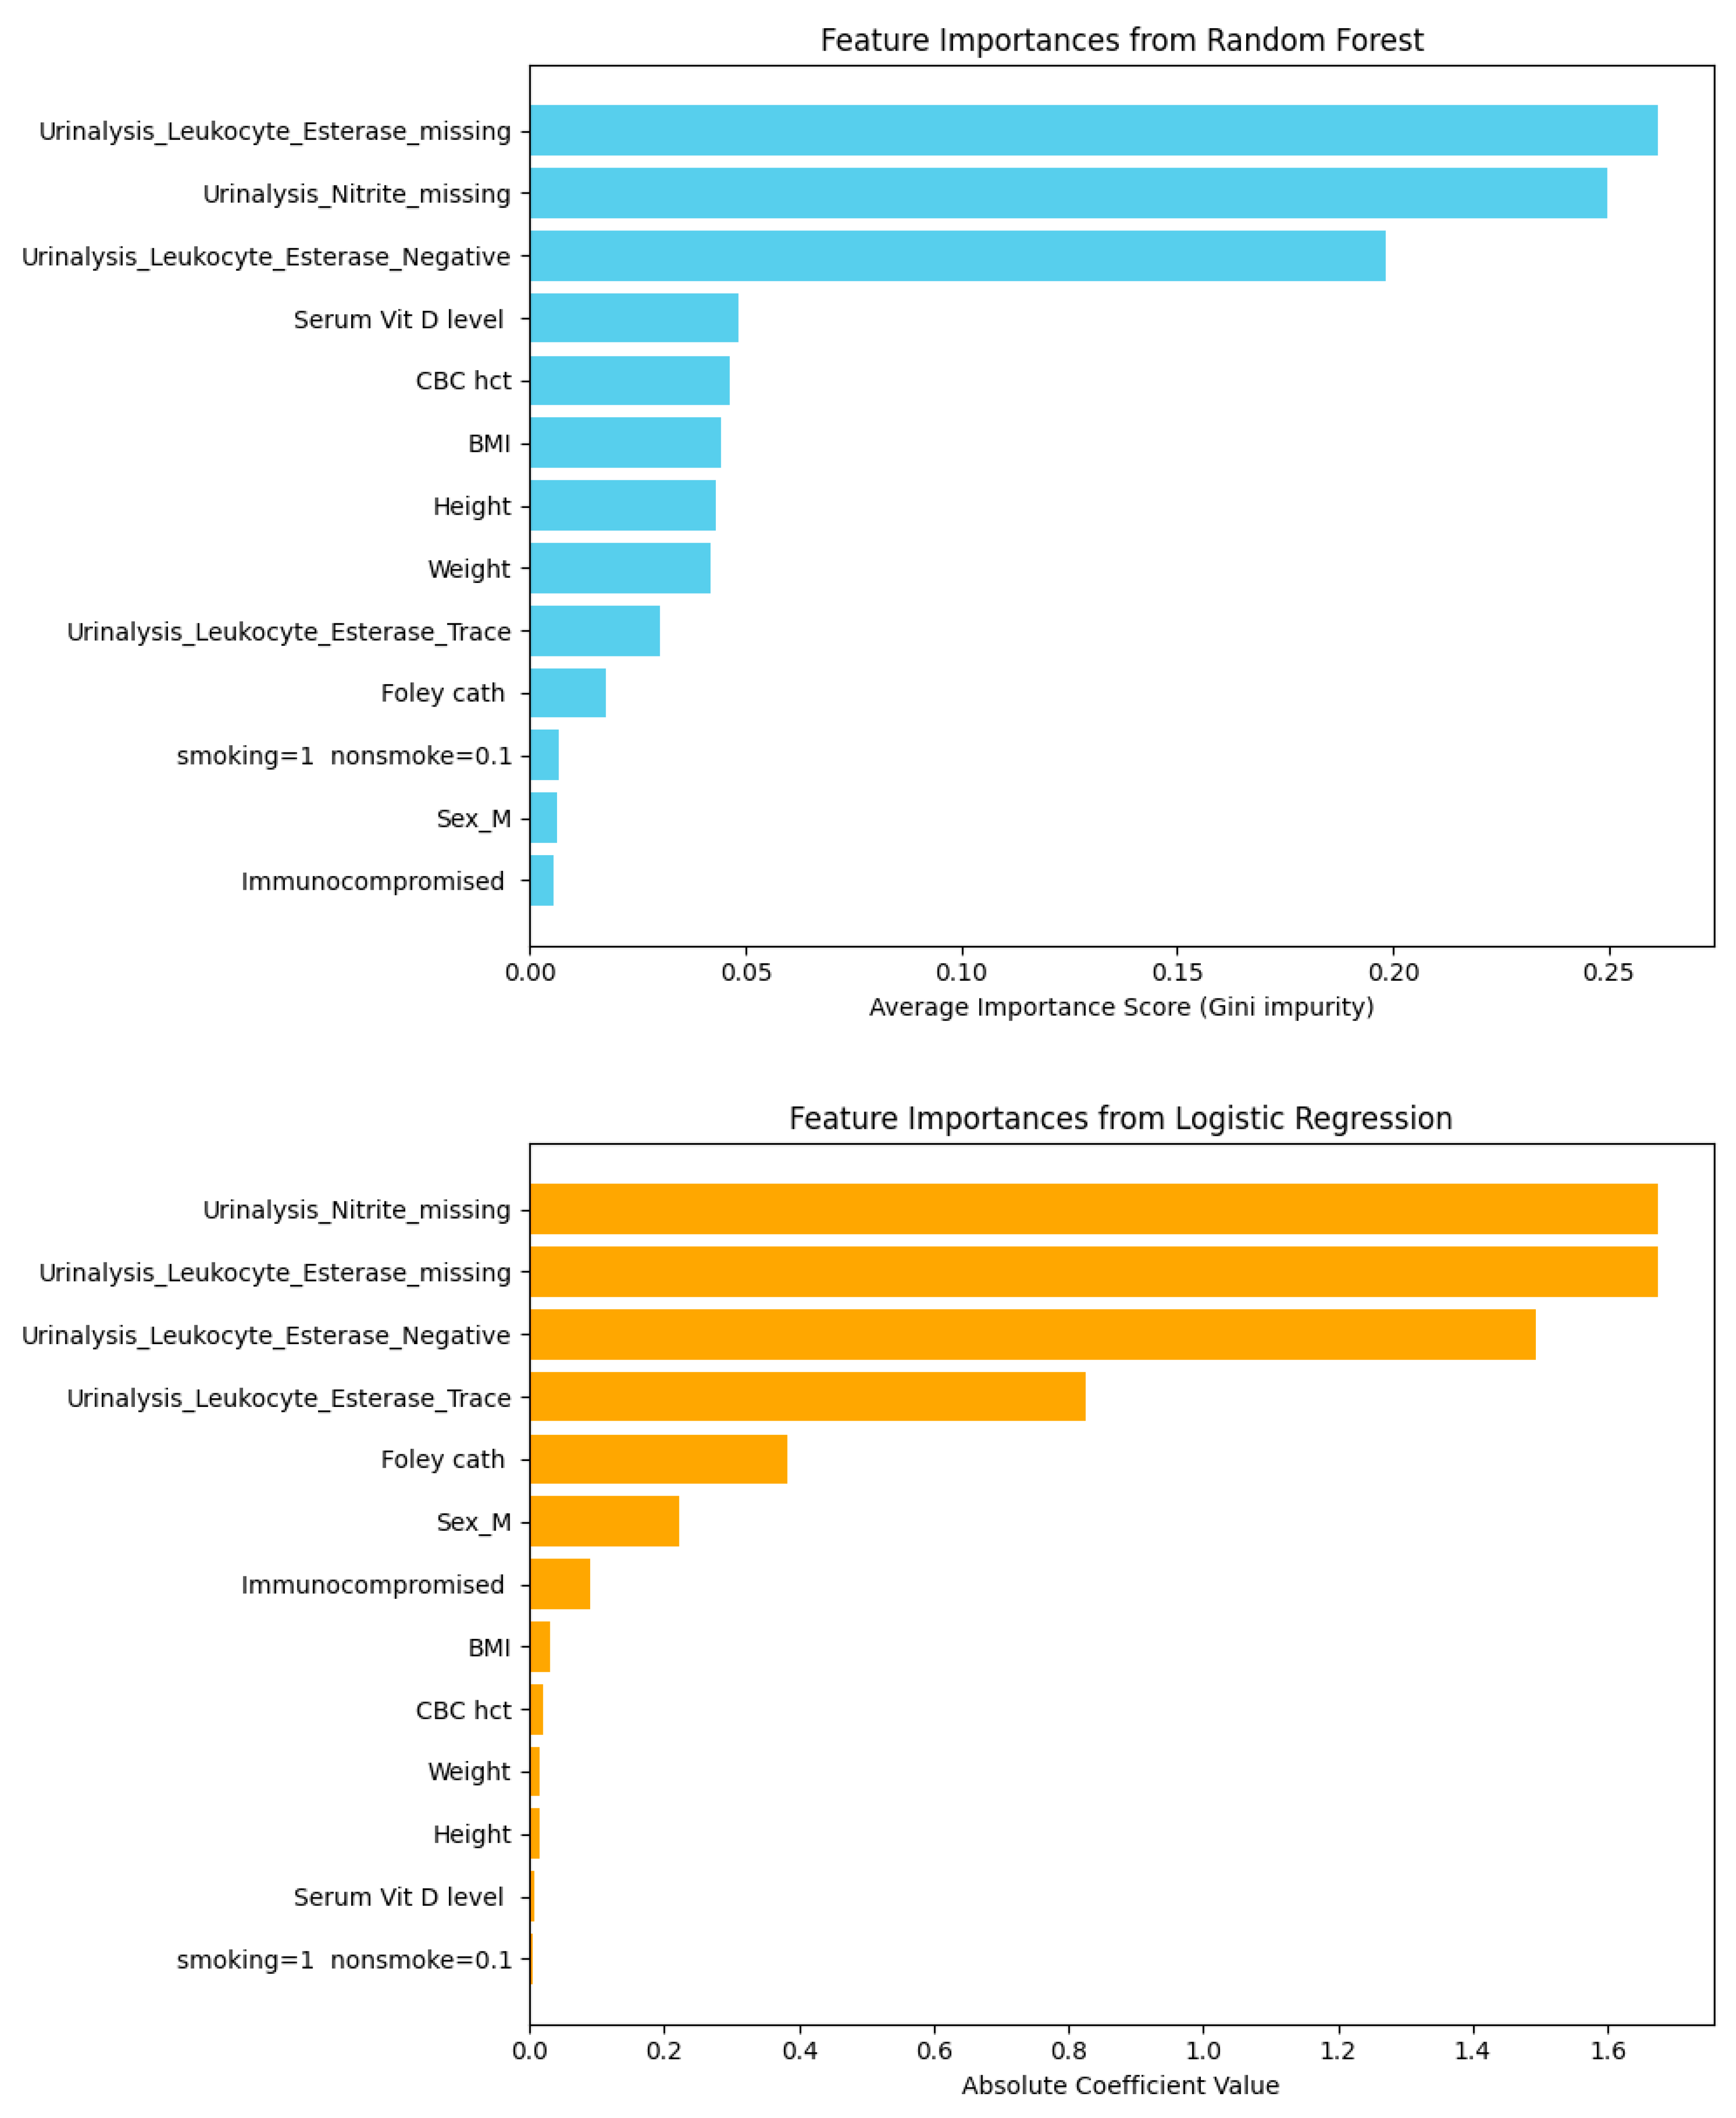
Feature importance was evaluated using Logistic Regression (coefficients) and Extra Trees (Gini impurity). Both methods consistently ranked urinalysis parameters—particularly leukocyte esterase and nitrite, including their missing values—as the strongest predictors. Their consistent prominence across linear and ensemble models highlights the robustness of these features in classifying the target outcome.
Figure 9, both models consistently highlighted Urinalysis Leukocyte Esterase missing and Urinalysis Nitrite missing as the most influential predictors, underscoring the diagnostic value of missing urine dipstick results. In contrast, serum vitamin D level ranked among the least important features, suggesting a limited role in prediction compared with urinalysis parameters.
For preprocessing, the Interquartile Range (IQR) method was applied to the Height, Weight, and eGFR variables to detect and remove outliers, thereby improving model robustness by reducing the influence of extreme values. Following outlier removal, the dataset was reduced to 330 instances and 26 features.
Table 8, after outlier removal, all models maintained strong performance. Random Forest achieved the best metrics (accuracy = 0.9455, F1 = 0.9443, AUC = 0.9833), while Extra Trees and Logistic Regression also performed robustly. LightGBM showed the lowest scores across metrics. Comparing datasets, including serum vitamin D produced nearly identical results to excluding it, indicating minimal impact of vitamin D on overall predictive performance.
Figure 10, the ROC curve demonstrates that the Extra Trees model achieved strong discriminatory ability across all classes, with AUC values of 0.99 for Class 0, 0.93 for Class 1, and 0.95 for Class 2. The confusion matrix further supports this performance, showing perfect classification of all 14 instances in Class 0, 10 out of 12 in Class 2, and 5 out of 7 in Class 1, with only minor misclassifications. These findings underscore the model’s robustness and reliability in handling multi-class prediction tasks.
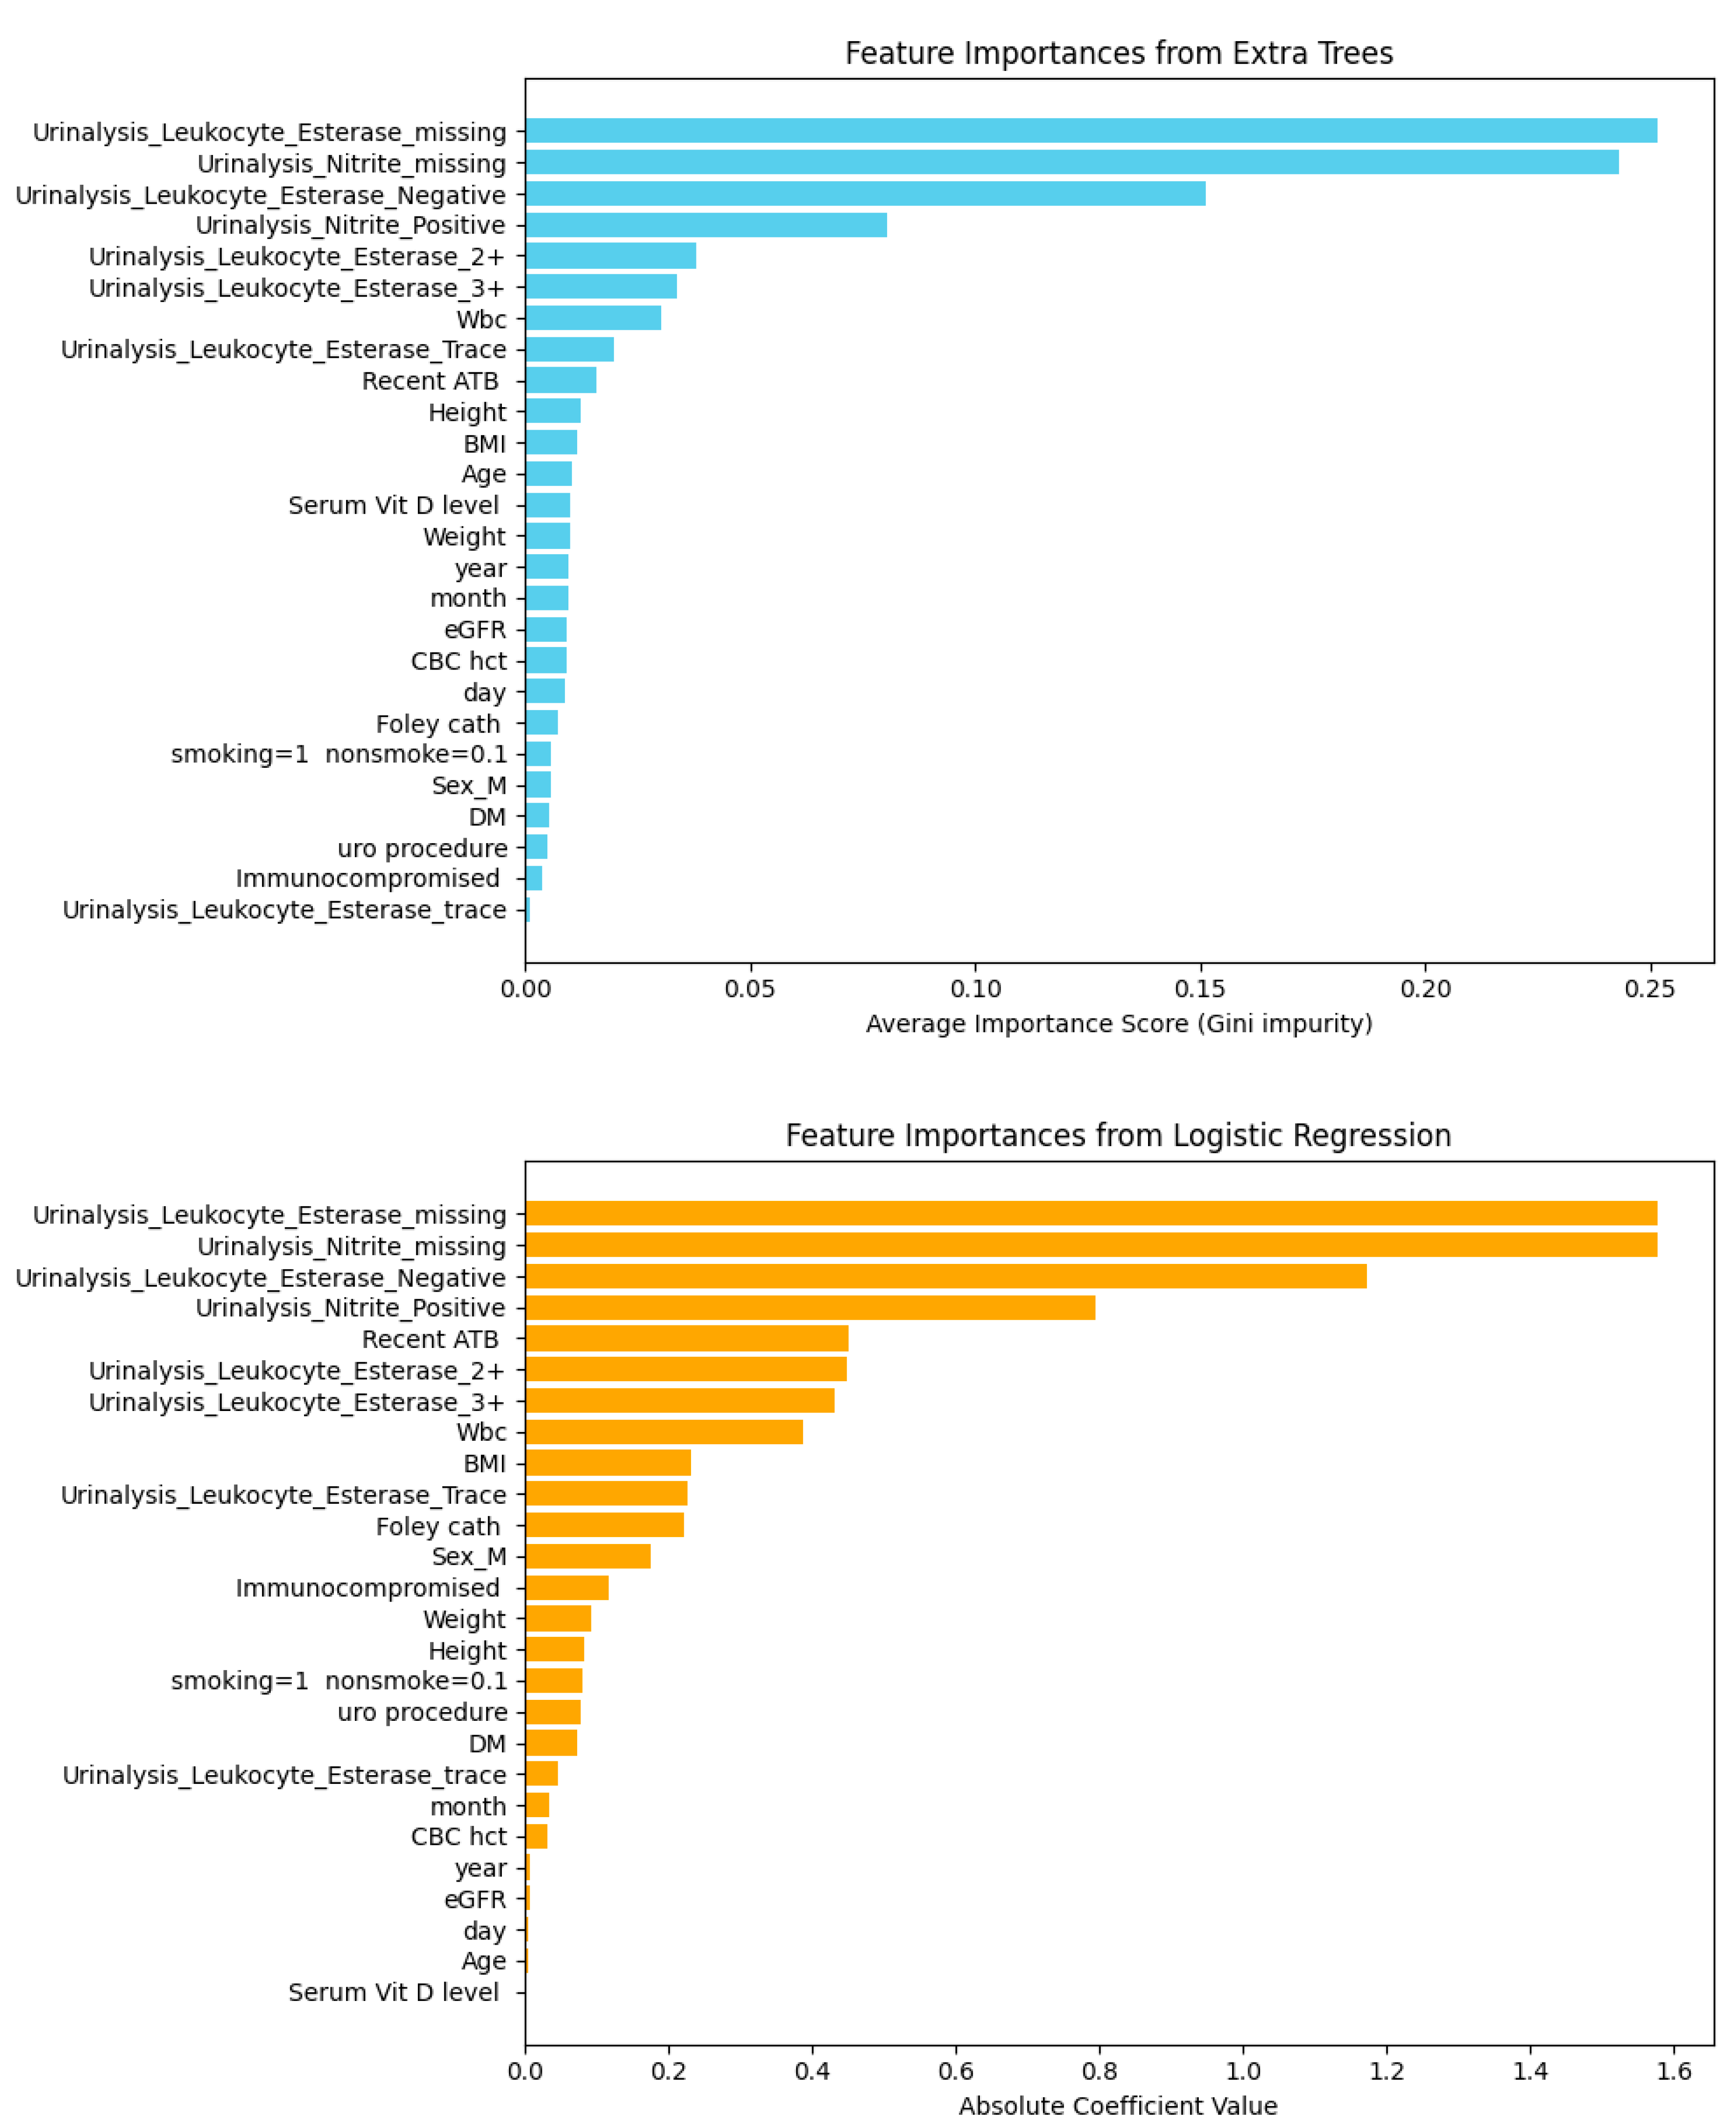
After removing outliers, the refined dataset was used to assess the relative contribution of individual predictors. Feature importance was analyzed with Extra Trees and Logistic Regression, enabling comparison of variable influence across ensemble-based and linear models. The following figures present the ranking of features identified by both approaches.
Figure 11, both Extra Trees and Logistic Regression consistently identified Urinalysis Nitrite missing and Leukocyte Esterase missing as the strongest predictors, with Leukocyte Esterase Negative also ranking highly. Extra Trees captured complex non-linear relationships with higher predictive power, whereas Logistic Regression provided slightly lower performance but greater interpretability. These results underscore the trade-off between accuracy and explainability in model selection.
Table 9 shows the Spearman correlation between selected features and the target variable. Urinalysis Leukocyte Esterase Negative exhibited a strong positive correlation (ρ = 0.74), while Urinalysis Leukocyte Esterase missing and Urinalysis Nitrite missing showed strong negative correlations (ρ = −0.92). Moderate positive correlations were also observed for Urinalysis Leukocyte Esterase Trace and 2+, suggesting that specific urinalysis patterns play a critical role in predicting the outcome.
Table 10 presents the Pearson correlation coefficients between clinical and demographic features and the target variable. All correlations were weak, with the highest positive values observed for Height (ρ = 0.18) and Weight (ρ = 0.16). Most features, including Age, Serum Vitamin D level, and eGFR, showed negligible associations, indicating that no single variable in this group demonstrated a strong linear relationship with the outcome.
Table 11, after removing additional low-contribution features, all models retained strong performance. Random Forest and Logistic Regression achieved the highest metrics (AUC = 0.976), while Extra Trees and XGBoost also performed well (AUC = 0.9783 and 0.9708). Gradient Boosting showed moderate results (AUC = 0.9526), and LightGBM remained the weakest. Notably, performance differences between including and excluding serum vitamin D were minimal across models, suggesting that vitamin D added limited incremental predictive value.
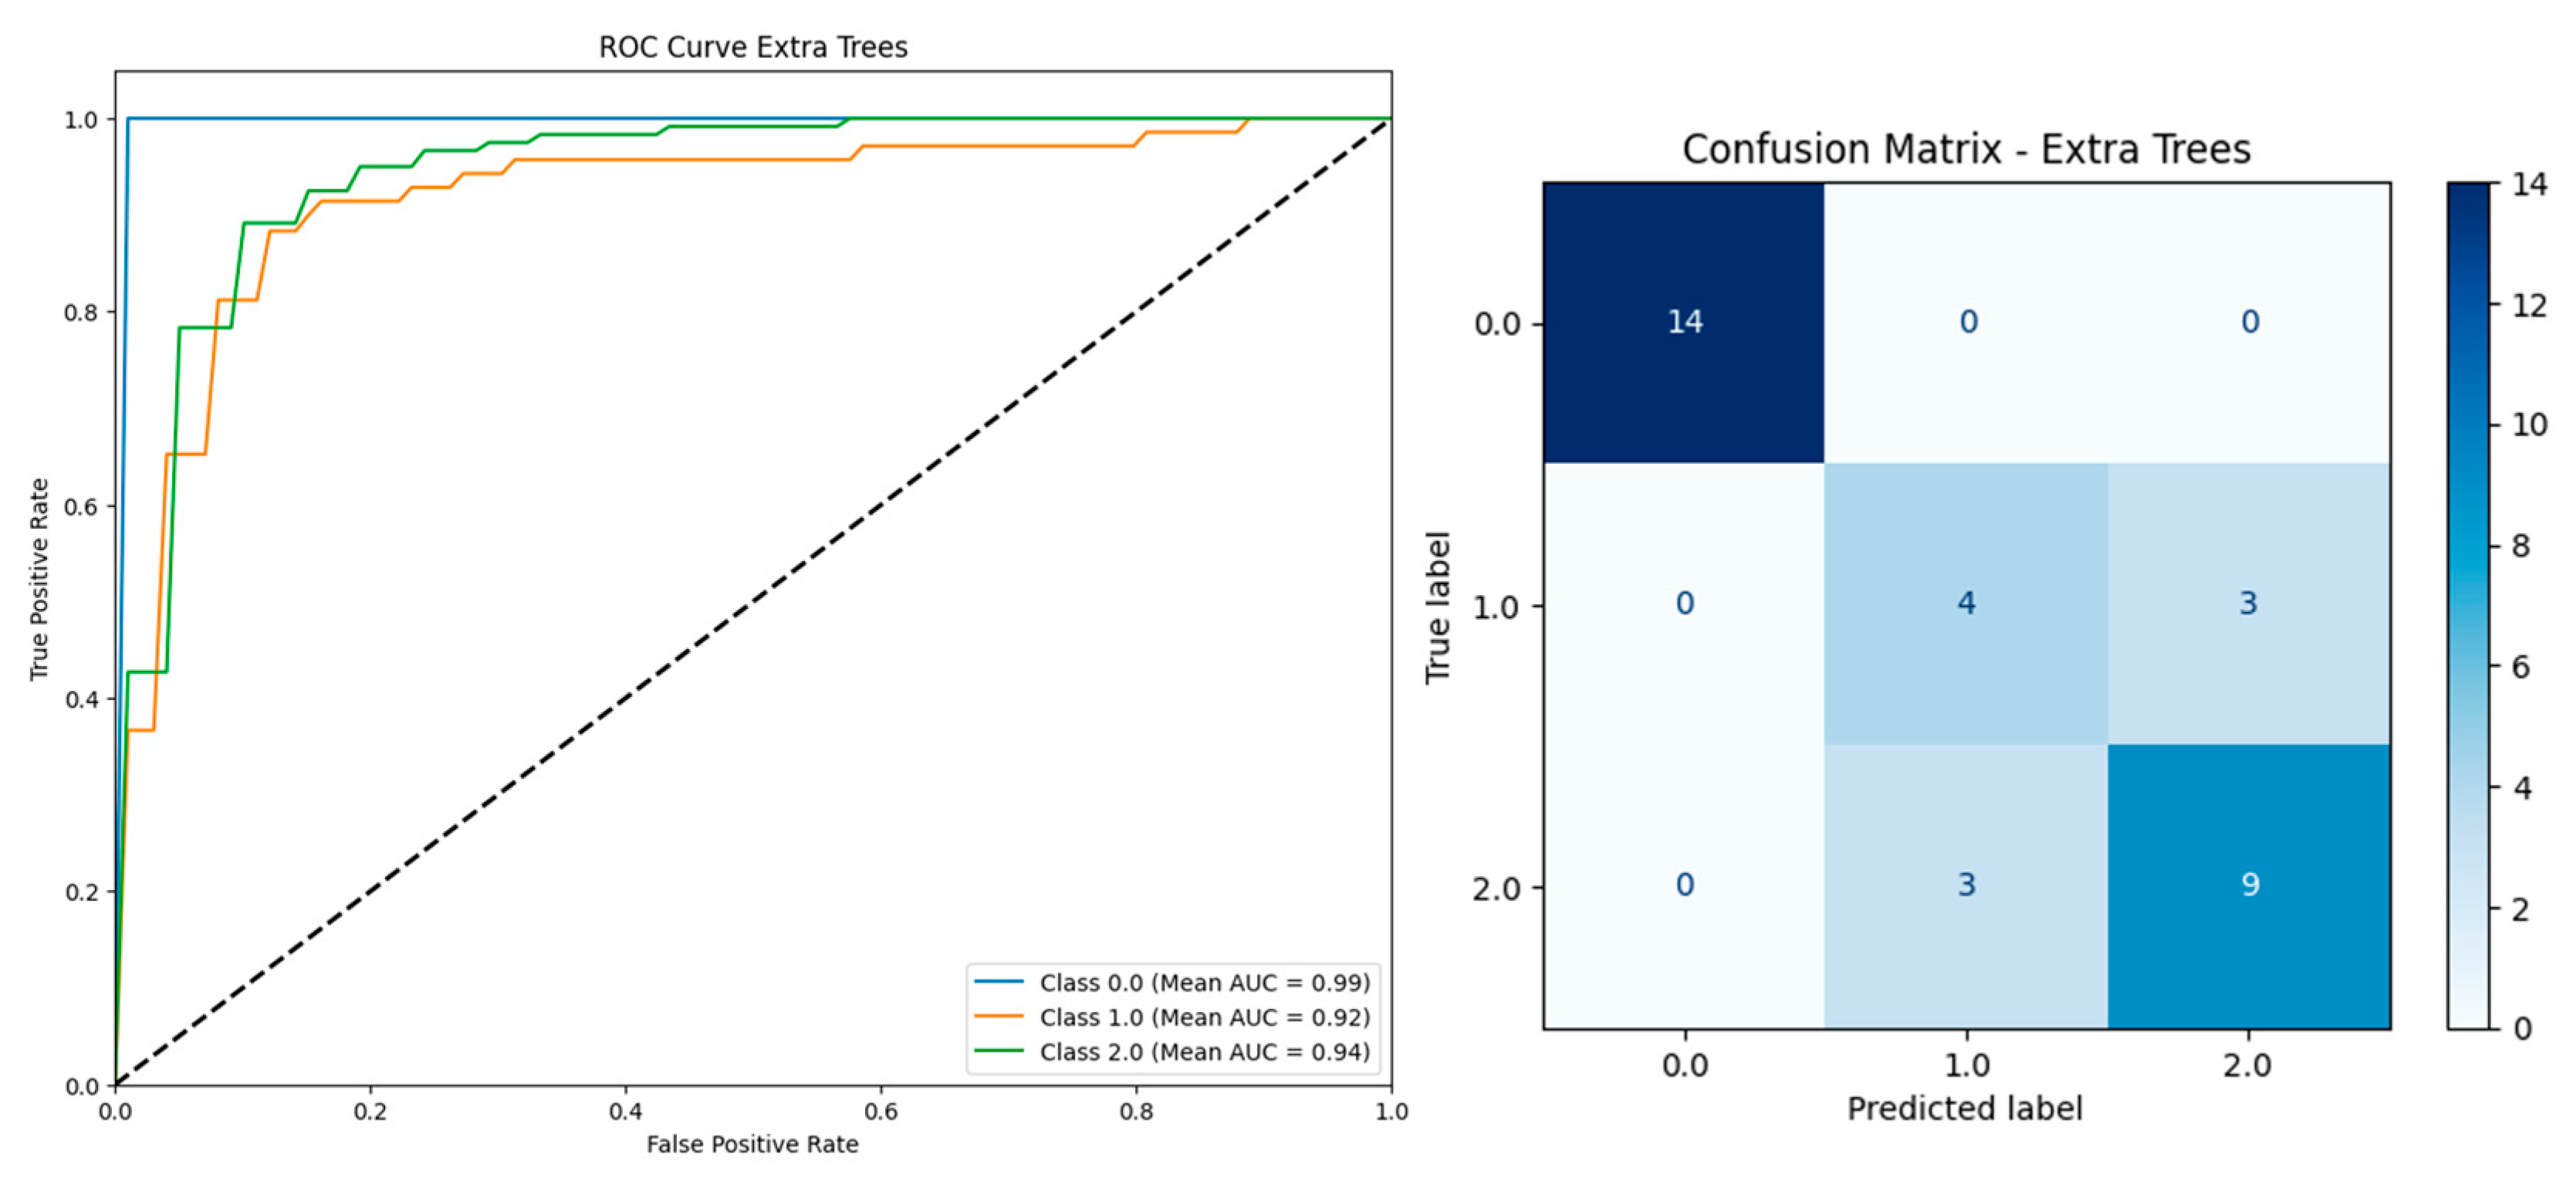
Figure 12, the ROC curve (left) shows that the Extra Trees model achieved strong classification performance, with AUC values of 0.99 for Class 0, 0.92 for Class 1, and 0.94 for Class 2. The confusion matrix (right) confirms high accuracy, correctly classifying most instances, with only a few misclassifications between Classes 1 and 2. These results demonstrate the model’s robustness and reliability after feature reduction.
With 330 instances and 13 features, feature importance was assessed using Random Forest and Logistic Regression to compare ensemble- and coefficient-based perspectives on key predictors.
Figure 13, both Random Forest and Logistic Regression identified missing values of Urinalysis Leukocyte Esterase and Urinalysis Nitrite as the most influential predictors, with Urinalysis Leukocyte Esterase Negative also ranking highly. These consistent results highlight the diagnostic importance of urinalysis features in outcome prediction.
From Table 12, serum vitamin D levels showed no statistically significant differences across groups (all p > 0.05), regardless of dataset preprocessing strategy.

4. Discussion

This study evaluated the predictive role of clinical and laboratory variables, including serum vitamin D, for urinary tract infection (UTI) subtype classification using machine learning. Urinalysis-derived features—particularly leukocyte esterase, nitrite positivity, and their missingness—consistently emerged as the strongest predictors across models, underscoring their central role in clinical diagnostics.
Serum vitamin D showed weak correlations with UTI subtypes and no significant group differences, yet tree-based models such as Extra Trees and Random Forest assigned it modest importance, with minor gains observed in lower UTI classification. While biologically plausible given its immunomodulatory functions, vitamin D contributed more as a supplementary feature than as a primary determinant. Importantly, models relying solely on urinalysis maintained high accuracy, supporting applicability in settings where vitamin D testing is unavailable, costly, or delayed. Conversely, its inclusion may provide added nuance for high-risk groups such as elderly or immunocompromised patients.
This work highlights the balance between predictive performance, interpretability, and resource availability. Ensemble methods demonstrated superior accuracy and parsimony, making them suitable for deployment in decision support systems, electronic health records, and IoMT-based screening platforms.
Key limitations include the single-center retrospective design, reduced sample size after preprocessing, and lack of external validation. Another important limitation is the potential risk of overfitting, as the models were trained and evaluated on the same dataset. Although cross-validation was applied, it cannot fully substitute for independent testing, and thus the reported performance metrics may be overestimated. While similar modeling approaches have been employed in the previous literature, these results should be interpreted with caution. Future directions should prioritize multi-institutional studies, longitudinal evaluation of vitamin D dynamics, federated learning to ensure scalability, privacy, and fairness across populations, and the incorporation of external validation cohorts with more rigorous data partitioning strategies to enhance generalizability and robustness.

5. Conclusions

This study demonstrates the effectiveness of machine learning in classifying urinary tract infection (UTI) subtypes using multidimensional clinical data. Urinalysis features—particularly leukocyte esterase, nitrite, and their missingness—consistently emerged as the most influential predictors across all models, reaffirming their diagnostic value. Serum vitamin D showed no statistically significant group differences and only weak linear correlations with UTI subtypes, yet tree-based models assigned it modest importance, with small gains observed in certain subtypes such as lower UTIs. These findings suggest that vitamin D serves as a supplementary, context-dependent feature rather than a primary determinant, offering potential added value in high-risk populations. The dual-model approach—incorporating or omitting vitamin D—ensures adaptability across both resource-rich and resource-limited clinical settings. Moreover, the predictive contribution of missing data highlights the potential of context-aware AI in healthcare. Overall, the proposed models provide a scalable, interpretable, and clinically relevant framework for personalized UTI risk stratification, with strong potential for integration into EHRs, CDSS, and mobile health platforms.

Author Contributions

Writing—original draft, K.N.; methodology, W.C.; software, W.Y. and J.I.; writing—review and editing, W.W. All authors have read and agreed to the published version of the manuscript.

Funding

This study was supported by University of Phayao and Thailand Science Research and Innovation Fund (Fundamental Fund 2026, Grant No. 2253/2568). K. Naravejsakul would like to thank the revenue budget in 2025, School of Medicine, University of Phayao (Grant No. MD68-16).

Institutional Review Board Statement

This study was conducted in accordance with the Declaration of Helsinki, the Belmont report, the CIOMS Guidelines, and the International Conference on Harmonization in Good Clinical Practice or ICH-GCP and with approval from the Ethics Committee and Institutional Review Board of University of Phayao (Institutional Review Board (IRB) approval, IRB Number: HREC-UP-HSST 1.1/044/68, approval date 22 July 2025.).

Informed Consent Statement

The requirement for patient consent was waived because the study involved a retrospective analysis of fully de-identified medical imaging data, which poses no more than minimal risk to the participants. No direct patient contact or re-identification was performed. Written informed consent for publication was not applicable, as no identifiable patient information or images are included in this article.

Data Availability Statement

The data presented in this study are available on request from the corresponding author.

Conflicts of Interest

The authors declare no conflicts of interest.

References

  1. Foxman, B. Urinary tract infection syndromes: Occurrence, recurrence, bacteriology, risk factors, and disease burden. Infect. Dis. Clin. North Am. 2014, 28, 1–13. [Google Scholar] [CrossRef]
  2. He, Y.; Zhao, J.; Wang, L.; Han, C.; Yan, R.; Zhu, P.; Qian, T.; Yu, S.; Zhu, X.; He, W. Epidemiological trends and predictions of urinary tract infections in the Global Burden of Disease Study 2021. Sci. Rep. 2025, 15, 4702. [Google Scholar] [CrossRef]
  3. Amrein, K.; Scherkl, M.; Hoffmann, M.; Neuwersch-Sommeregger, S.; Köstenberger, M.; Tmava Berisha, A.; Martucci, G.; Pilz, S.; Malle, O. Vitamin D deficiency 2.0: An update on the current status worldwide. Eur. J. Clin. Nutr. 2020, 74, 1498–1513. [Google Scholar] [CrossRef]
  4. Martineau, A.R.; Jolliffe, D.A.; Hooper, R.L.; Greenberg, L.; Aloia, J.F.; Bergman, P.; Dubnov-Raz, G.; Esposito, S.; Ganmaa, D.; Ginde, A.A.; et al. Vitamin D supplementation to prevent acute respiratory tract infections: Systematic review and meta-analysis of individual participant data. BMJ 2017, 356, i6583. [Google Scholar] [CrossRef]
  5. Gan, Y.; You, S.; Ying, J.; Mu, D. The association between serum vitamin D levels and urinary tract infection risk in children: A systematic review and meta-analysis. Nutrients 2023, 15, 2690. [Google Scholar] [CrossRef]
  6. Hewison, M. Vitamin D and immune function: An overview. Proc. Nutr. Soc. 2012, 71, 50–61. [Google Scholar] [CrossRef] [PubMed]
  7. Shaikh, N.; Morone, N.E.; Bost, J.E.; Farrell, M.H. Prevalence of urinary tract infection in childhood: A meta-analysis. Pediatr. Infect. Dis. J. 2008, 27, 302–308. [Google Scholar] [CrossRef]
  8. Flores-Mireles, A.L.; Walker, J.N.; Caparon, M.; Hultgren, S.J. Urinary tract infections: Epidemiology, mechanisms of infection and treatment options. Nat. Rev. Microbiol. 2015, 13, 269–284. [Google Scholar] [CrossRef]
  9. Tandogdu, Z.; Wagenlehner, F.M. Global epidemiology of urinary tract infections. Curr. Opin. Infect. Dis. 2016, 29, 73–79. [Google Scholar] [CrossRef] [PubMed]
  10. Cashman, K.D.; Dowling, K.G.; Škrabáková, Z.; Gonzalez-Gross, M.; Valtueña, J.; De Henauw, S.; Moreno, L.; Damsgaard, C.T.; Michaelsen, K.F.; Mølgaard, C.; et al. Vitamin D deficiency in Europe: Pandemic. Am. J. Clin. Nutr. 2016, 103, 1033–1044. [Google Scholar] [CrossRef] [PubMed]
  11. Aranow, C. Vitamin D and the immune system. J. Investig. Med. 2011, 59, 881–886. [Google Scholar] [CrossRef]
  12. Bikle, D.D. Vitamin D metabolism, mechanism of action, and clinical applications. Chem. Biol. 2014, 21, 319–329. [Google Scholar] [CrossRef]
  13. Nseir, W.; Taha, M.; Nemarny, H.; Mograbi, J. The association between serum levels of vitamin D and recurrent urinary tract infections in premenopausal women. Int. J. Infect. Dis. 2013, 17, e1121–e1124. [Google Scholar] [CrossRef] [PubMed]
  14. Hertting, O.; Holm, Å.; Lüthje, P.; Brauner, H.; Dyrdak, R.; Jonasson, A.F.; Wiklund, P.; Chromek, M.; Brauner, A. Vitamin D induction of the human antimicrobial peptide cathelicidin in the urinary bladder. PLoS ONE 2010, 5, e15580. [Google Scholar] [CrossRef]
  15. Lagishetty, V.; Misharin, A.V.; Liu, N.Q.; Lisse, T.S.; Chun, R.F.; Ouyang, Y.; McLachlan, S.M.; Adams, J.S.; Hewison, M. Vitamin D deficiency in mice impairs colonic antibacterial activity and predisposes to colitis. Endocrinology 2010, 151, 2423–2432. [Google Scholar] [CrossRef] [PubMed]
  16. Wang, T.T.; Nestel, F.P.; Bourdeau, V.; Nagai, Y.; Wang, Q.; Liao, J.; Tavera-Mendoza, L.; Lin, R.; Hanrahan, J.W.; Mader, S.; et al. Cutting edge: 1,25-dihydroxyvitamin D3 is a direct inducer of antimicrobial peptide gene expression. J. Immunol. 2004, 173, 2909–2912. [Google Scholar] [CrossRef] [PubMed]
  17. Tekin, M.; Konca, C.; Celik, V.; Almis, H.; Kahramaner, Z.; Erdemir, A.; Gulyuz, A.; Uckardes, F.; Turgut, M. The association between vitamin D levels and urinary tract infection in children. Horm. Res. Paediatr. 2015, 83, 198–203. [Google Scholar] [CrossRef]
  18. Jorde, R.; Sollid, S.T.; Svartberg, J.; Joakimsen, R.M.; Grimnes, G.; Hutchinson, M.Y. Prevention of urinary tract infections with vitamin D supplementation 20,000 IU per week for five years: Results from an RCT including 511 subjects. Infect. Dis. 2016, 48, 823–828. [Google Scholar] [CrossRef]
  19. Beam, A.L.; Kohane, I.S. Big data and machine learning in health care. JAMA 2018, 319, 1317–1318. [Google Scholar] [CrossRef]
  20. Lee, S.; Choe, E.K.; Park, B. Exploration of machine learning for hyperuricemia prediction models based on basic health checkup tests. J. Clin. Med. 2019, 8, 172. [Google Scholar] [CrossRef]
  21. Guo, J.; He, Q.; Li, Y. Machine learning-based prediction of vitamin D deficiency: NHANES 2001-2018. Front. Endocrinol. 2024, 15, 1327058. [Google Scholar] [CrossRef]
  22. Tadesse, B.T.; Ashley, E.A.; Ongarello, S.; Havumaki, J.; Wijegoonewardena, M.; González, I.J.; Dittrich, S. Antimicrobial resistance in Africa: A systematic review. BMC Infect. Dis. 2017, 17, 616. [Google Scholar] [CrossRef]
  23. Taylor, R.A.; Moore, C.L.; Cheung, K.H.; Brandt, C. Predicting urinary tract infections in the emergency department with machine learning. PLoS ONE 2018, 13, e0194085. [Google Scholar] [CrossRef] [PubMed]
  24. Rajkomar, A.; Dean, J.; Kohane, I. Machine learning in medicine. N. Engl. J. Med. 2019, 380, 1347–1358. [Google Scholar] [CrossRef] [PubMed]
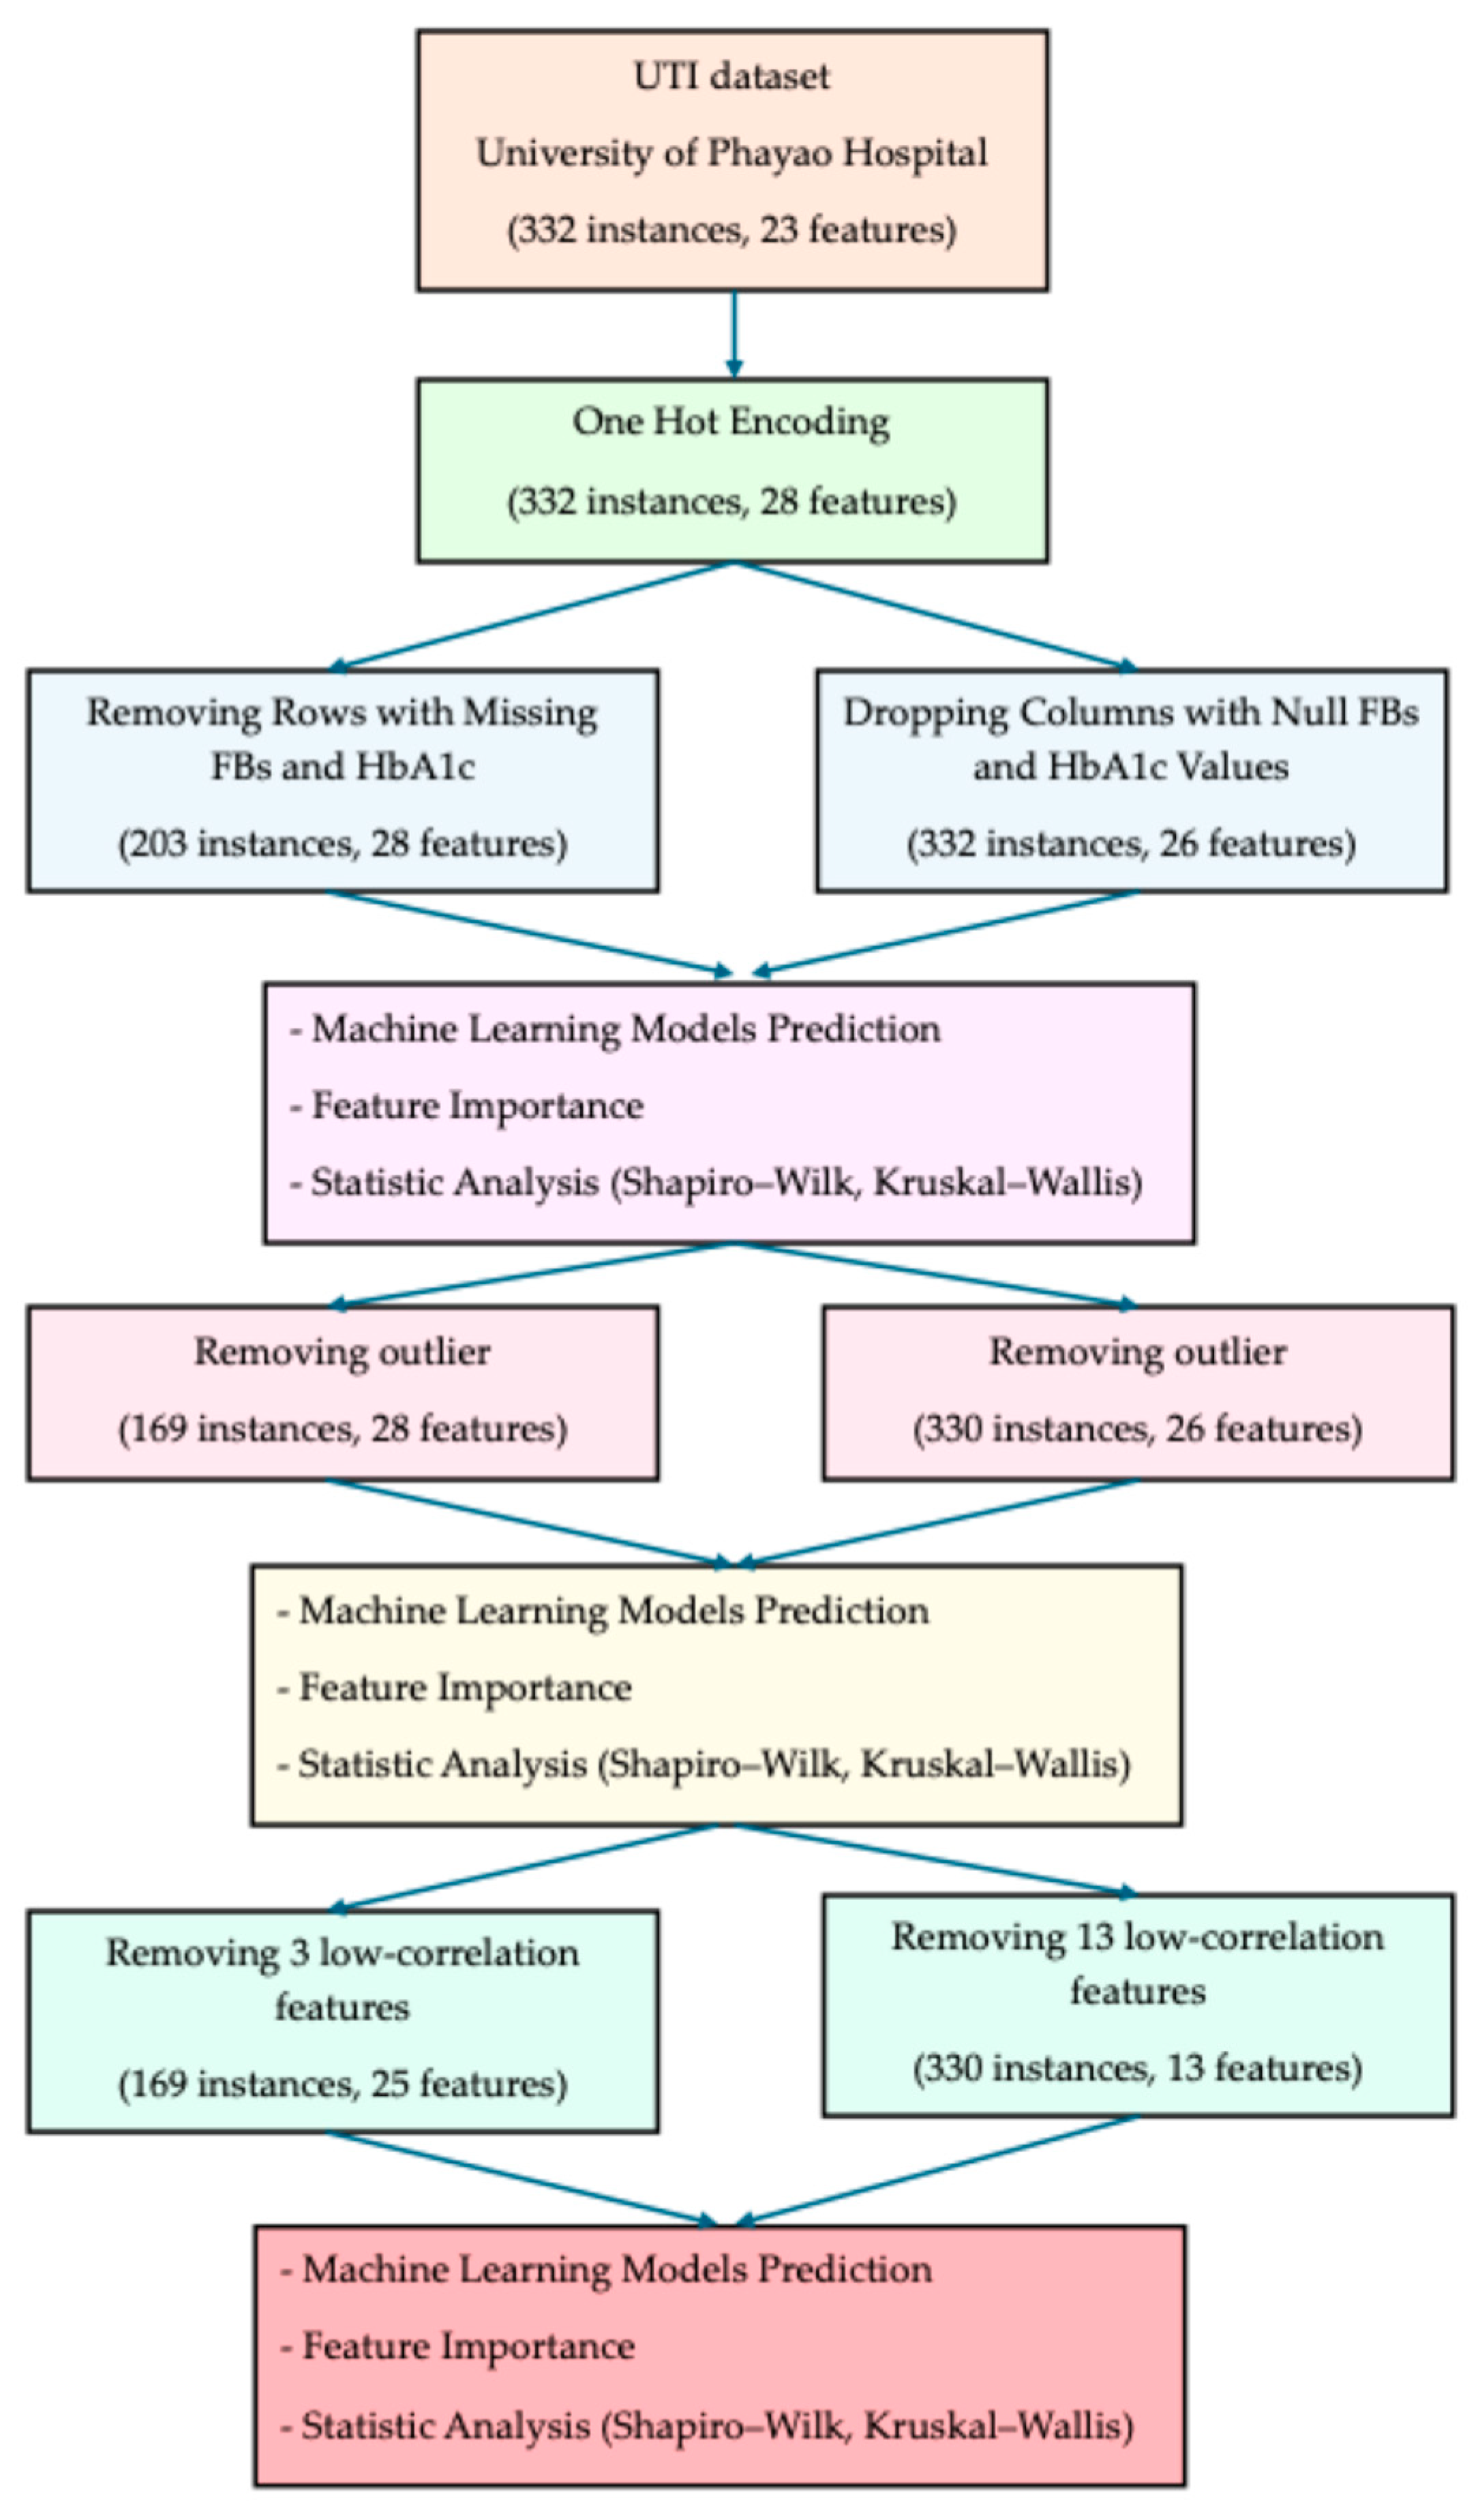
Figure 1. Workflow of dataset preprocessing and analysis pipeline.
Biomedinformatics 05 00057 g001
Figure 2. ROC curve and confusion matrix for extra trees classifier based on 203 instances and 28 features including serum vitamin D.
Biomedinformatics 05 00057 g002
Figure 3. Feature importances from extra trees and logistic regression models based on 203 instances and 28 features.
Biomedinformatics 05 00057 g003
Figure 4. ROC curve and confusion matrix for extra trees classifier after outlier removal based on 169 instances and 28 features including serum vitamin D.
Biomedinformatics 05 00057 g004
Figure 5. Feature importance comparison between logistic regression and extra trees models based on 169 instances and 28 features.
Biomedinformatics 05 00057 g005
Figure 6. ROC curve and confusion matrix of the extra trees model after feature selection based on 169 instances and 25 features including serum vitamin D.
Biomedinformatics 05 00057 g006
Figure 7. Feature importances from extra trees and logistic regression models based on 169 instances and 25 features.
Biomedinformatics 05 00057 g007
Figure 8. ROC curve and confusion matrix of extra trees classifier after dropping FBs and HbA1c columns based on 337 instances and 26 features including serum vitamin D.
Biomedinformatics 05 00057 g008
Figure 9. Top feature importances identified by logistic regression (top) and extra trees (bottom) based on 337 instances and 26 features including serum vitamin D.
Biomedinformatics 05 00057 g009
Figure 10. ROC curve and confusion matrix of gradient boosting model based on 330 instances and 26 features including serum vitamin D.
Biomedinformatics 05 00057 g010
Figure 11. Feature importance comparison between extra trees and logistic regression based on 330 instances and 26 features.
Biomedinformatics 05 00057 g011
Figure 12. Performance comparison of machine learning models after removing features based on 330 instances and 13 features.
Biomedinformatics 05 00057 g012
Figure 13. Feature importances from logistic regression and extra trees models based on 330 instances and 13 features.
Biomedinformatics 05 00057 g013
Table 1. Average performance metrics across six machine learning models with the inclusion of serum vitamin D as a feature using 10-fold cross-validation (203 instances, 28 features).
ModelIncluding Serum Vitamin DWithout Serum Vitamin D
AccuracyF1-ScorePrecisionRecallAUCAccuracyF1-ScorePrecisionRecallAUC
Extra Trees0.95100.95030.95910.95100.98990.94600.94530.95500.94600.9910
Gradient Boosting0.94570.94530.95690.94570.98770.94100.94050.95110.94100.9929
XGBoost0.94100.94050.94820.94100.98250.94070.94050.95130.94070.9876
Logistic Regression0.93620.93590.94100.93620.97830.93600.93540.94520.9360.9866
Random Forest0.94100.94050.95110.94100.99210.92640.92620.93350.92640.9772
LightGBM0.92620.92450.93490.92620.98350.92620.92460.93530.92620.9843
Table 2. Model performance after outlier removal with 10-fold cross-validation (169 instances, 28 features).
ModelIncluding Serum Vitamin DWithout Serum Vitamin D
AccuracyF1-ScorePrecisionRecallAUCAccuracyF1-ScorePrecisionRecallAUC
Extra Trees0.94670.94460.95610.94670.99240.94790.94620.95240.94790.9890
Gradient Boosting0.93490.93380.94030.93490.99010.93740.93560.94790.93740.9767
XGBoost0.94080.93870.94440.94080.99220.95320.95230.96020.95320.983
Logistic Regression0.91730.91800.92600.91730.98060.93740.93620.94310.93740.988
Random Forest0.94080.93890.94940.94080.99010.91110.91010.91880.91110.9733
LightGBM0.93490.93400.93670.93490.97840.93760.93690.94160.93760.9837
Table 3. Spearman correlation between selected features and target variable.
FeatureScore Corr Spearman
Urinalysis_Leukocyte_Esterase_2+0.06871976629978133
Urinalysis_Leukocyte_Esterase_3+0.06576329960128459
Urinalysis_Leukocyte_Esterase_Negative0.7487478543213254
Urinalysis_Leukocyte_Esterase_Trace0.2746986268964347
Urinalysis_Leukocyte_Esterase_missing−0.9224985939982852
Urinalysis_Leukocyte_Esterase_trace0.09267029028118784
Urinalysis_Nitrite_Positive0.053962344266818764
Urinalysis_Nitrite_missing−0.9224985939982852
Sex_M−0.0065972980013197504
Table 4. Pearson correlation results: clinical and demographic features.
FeatureScore Corr Pearson
Age−0.129088606
Height−0.045594458
Weight0.102508819
BMI0.120294279
Wbc−0.004173642
Immunocompromised−0.071001376
Recent ATB−0.081696011
DM0.014477774
Foley cath0.002105744
uro procedure0.023142569
CBC hct−0.006954641
eGFR0.159680643
Smoking = 1 nonsmoke = 0.1−0.002005269
Serum Vit D level−0.081335186
Year0.080705383
month−0.06605901
Day0.060379042
Table 5. Model performance after removing low-correlation features with smoking, CBC hct, Foley cath (169 instances and 25 features).
ModelIncluding Serum Vitamin DWithout Serum Vitamin D
AccuracyF1-ScorePrecisionRecallAUCAccuracyF1-ScorePrecisionRecallAUC
Extra Trees0.94670.94460.95610.94670.99100.93740.93560.94350.93740.9869
Gradient Boosting0.93490.93380.94030.93490.99060.92680.92470.93190.92680.9538
XGBoost0.94080.93870.94440.94080.99200.93210.93020.9390.93210.9648
Logistic Regression0.94710.94630.95380.94710.99090.94260.94080.94780.94260.9817
Random Forest0.94080.93890.94940.94080.99190.92680.92550.9370.92680.9645
LightGBM0.92900.92760.93060.92900.97480.90050.89860.90690.90050.9449
Table 6. Distribution of serum vitamin D levels across datasets after different preprocessing steps.
DatasetDistribution of Serum Vitamin D Level by the Shapiro–WilkKruskal–Wallis
Removing Rows with Missing FBs and HbA1c
(203 instances, 28 features).
Biomedinformatics 05 00057 i001H = 0.8483,
p = 0.6543
Serum vitamin D levels did not differ significantly across groups.
Removing outlier (169 instances, 28 features).Biomedinformatics 05 00057 i002H = 0.8035,
p = 0.6691,
Serum vitamin D levels did not differ significantly across groups.
Removing low-correlation features (smoking, CBC hct, Foley cath)
(169 instances, 25 features).
Biomedinformatics 05 00057 i003H = 0.8035,
p = 0.6691,
Serum vitamin D levels did not differ significantly across groups.
Table 7. Model performance after dropping FBs and HbA1c columns based on 332 instances and 26 features.
ModelIncluding Serum Vitamin DWithout Serum Vitamin D
AccuracyF1-ScorePrecisionRecallAUCAccuracyF1-ScorePrecisionRecallAUC
Extra Trees0.94060.93970.94410.94060.98550.93760.93630.94210.93760.9851
Gradient Boosting0.92580.92530.92980.92580.96210.92880.92850.93390.92880.9686
XGBoost0.93170.93120.93560.93170.97750.92580.92510.9290.92580.9806
Logistic Regression0.94060.93940.94380.94060.98440.94060.93940.94380.94060.9839
Random Forest0.95260.95170.9540.95260.98280.94660.94540.9490.94660.9835
LightGBM0.92280.9210.92650.92280.98150.92290.9220.92550.92290.9782
Table 8. Model performance after outlier removal using IQR based on 330 instances and 26 features.
ModelIncluding Serum Vitamin DWithout Serum Vitamin D
AccuracyF1-ScorePrecisionRecallAUCAccuracyF1-ScorePrecisionRecallAUC
Extra Trees0.93940.93750.94520.93940.98670.93640.93450.94190.93640.9869
Gradient Boosting0.92120.92030.9270.92120.96160.91820.91740.92310.91820.9628
XGBoost0.92120.91960.92660.92120.97840.91520.91340.91940.91520.979
Logistic Regression0.93640.93520.94240.93640.98860.93330.93150.94030.93330.987
Random Forest0.94550.94430.94780.94550.98330.94550.94360.94750.94550.9849
LightGBM0.91210.91060.9170.91210.9730.90910.90660.9130.90910.974
Table 9. Spearman correlation between selected features and target variable.
FeatureScore Corr Spearman
Urinalysis_Leukocyte_Esterase_2+0.05384808248284584
Urinalysis_Leukocyte_Esterase_3+0.06591310096367214
Urinalysis_Leukocyte_Esterase_Negative0.7375196223456809
Urinalysis_Leukocyte_Esterase_Trace0.23910641565796778
Urinalysis_Leukocyte_Esterase_missing−0.9207435275744111
Urinalysis_Leukocyte_Esterase_trace0.06473859089883398
Urinalysis_Nitrite_Positive0.04769910761148201
Urinalysis_Nitrite_missing−0.9207435275744111
Sex_M−0.04386365833988913
Table 10. Pearson correlation results: clinical and demographic features.
FeatureScore Corr Spearman
Age−0.05853161001375016
Height0.18227749330017073
Weight0.16244022779755593
BMI0.10343395458190982
Wbc−0.093081839913421
Immunocompromised−0.1411028142482889
Recent ATB−0.02968019759761633
DM−0.025770879732438978
uro procedure0.04809317469941063
eGFR0.05520181492066498
Serum Vit D level−0.04437762002432005
year−0.051789898770276996
month0.06287313934574602
day0.05532694108956496
Table 11. Performance comparison of machine learning models after removing Urinalysis_Leukocyte_Esterase_2+, Urinalysis_Leukocyte_Esterase_3+, Urinalysis_Leukocyte_Esterase_trace, Urinalysis_Nitrite_Positive, Age, Wbc, Recent ATB, DM, uro procedure, eGFR, year, month and day (330 instances, 13 features).
ModelIncluding Serum Vitamin DWithout Serum Vitamin D
AccuracyF1-ScorePrecisionRecallAUCAccuracyF1-ScorePrecisionRecallAUC
Extra Trees0.92120.9210.92480.92120.97830.93640.93540.9410.93640.9801
Gradient Boosting0.90910.90960.91500.90910.95260.92420.92340.93060.92420.9495
XGBoost0.91520.9150.91850.91520.97080.91520.91450.91970.91520.9632
Logistic Regression0.92730.92750.93280.92730.9760.93330.93230.93920.93330.9795
Random Forest0.93330.93360.93790.93330.97060.93330.93240.93650.93330.9715
LightGBM0.90000.89960.90430.90000.96180.89390.89260.89630.89390.9585
Table 12. Distribution and Kruskal–Wallis test results for serum vitamin D levels across different preprocessing strategies.
DatasetDistribution of Serum Vitamin D Level by the Shapiro–WilkKruskal–Wallis
Dropping Columns with Null FBs and HbA1c Values
(337 instances, 26 features)
Biomedinformatics 05 00057 i004H = 3.3194,
p = 0.1902,
Serum vitamin D levels did not differ significantly across groups.
Removing Outlier Using IQR (330 instances, 26 features)Biomedinformatics 05 00057 i005H = 3.4995,
p = 0.1738,
Serum vitamin D levels did not differ significantly across groups.
Removing 13 low-correlation features (330 instances, 13 features)Biomedinformatics 05 00057 i006H = 3.4995,
p = 0.1738,
Serum vitamin D levels did not differ significantly across groups.
Disclaimer/Publisher’s Note: The statements, opinions and data contained in all publications are solely those of the individual author(s) and contributor(s) and not of MDPI and/or the editor(s). MDPI and/or the editor(s) disclaim responsibility for any injury to people or property resulting from any ideas, methods, instructions or products referred to in the content.