Article

High-Precision, Automatic, and Fast Segmentation Method of Hepatic Vessels and Liver Tumors from CT Images Using a Fusion Decision-Based Stacking Deep Learning Model

by
Mamoun Qjidaa
1,*,
Anass Benfares
2,
Mohammed Amine El Azami El Hassani
3,
Amine Benkabbou
3,
Amine Souadka
3,
Anass Majbar
3,
Zakaria El Moatassim
3,
Maroua Oumlaz
4,
Oumayma Lahnaoui
3,
Raouf Mouhcine
3,
Ahmed Lakhssassi
4,* and
Abdeljabbar Cherkaoui
1,*
1
Department of Computer Science, National School of Applied Sciences of Tangier, Abdelmalek Essaadi University, Tetouan 93000, Morocco
2
Department of Computer Science, Faculty of Science, Sidi Mohammed Ben Abdellah University, Fez 30000, Morocco
3
Digestive Oncological Surgery Department, National Institute of Oncology, Rabat, Mohammed V University, Rabat 10120, Morocco
4
Laboratoire d’Ingénierie des Microsystèmes Avancés, Département d’Informatique et d’Ingénierie, Université du Québec en Outaouais, Gatineau, QC J8Y 3G5, Canada
*
Authors to whom correspondence should be addressed.
BioMedInformatics 2025, 5(3), 53; https://doi.org/10.3390/biomedinformatics5030053
Submission received: 30 July 2025 / Revised: 28 August 2025 / Accepted: 2 September 2025 / Published: 9 September 2025
(This article belongs to the Section Methods in Biomedical Informatics)

Abstract

Background: To propose an automatic liver and hepatic vessel segmentation solution based on a stacking model and decision fusion. This model combines the decisions of multiple models to achieve increased accuracy. It exhibits improved robustness due to the reduction of individual errors. Flexibility is also a key asset, with combination methods such as majority voting or weighted averaging. The model enables managing the uncertainty associated with individual decisions to obtain a more reliable final decision. The combination of decisions improves the overall accuracy of the system. Methods: This research introduces a new deep learning-based architecture for automatically segmenting hepatic vessels and tumors from CT scans, utilizing stacking, decision fusion, and deep transfer learning to achieve high-accuracy and rapid segmentation. This study employed two distinct datasets: the external “Medical Segmentation Decathlon (MSD) task 08” dataset and an internal dataset procured from Ibn Sina University Hospital encompassing a cohort of 112 patients with chronic liver disease who underwent contrast-enhanced abdominal CT scans. Results: The proposed segmentation model reached a DSC of 83.21 and an IoU of 72.76 for hepatic vasculature and tumor segmentation, thereby exceeding the performance benchmarks established by the majority of antecedent studies. Conclusions: This study introduces an automated method for liver vessels and liver tumor segmentation, combining precision and stability to bridge the clinical gap. Furthermore, decision fusion-based stacking models have a significant impact on clinical applications by enhancing diagnostic accuracy, enabling personalized care through the integration of genetic, environmental, and clinical data, optimizing clinical trials, and facilitating the development of personalized medicines and therapies.

1. Introduction

Hepatic vessel segmentation is of critical significance for clinicians undertaking liver surgery and interventional radiology procedures, especially ablation interventions [1,2,3,4,5]. The intricate anatomy of the liver can be subdivided via various methodologies, with the Couinaud model being the most prevalently utilized paradigm. This model demarcates the liver into eight distinct segments, predicated upon the principal portal vein plane and the three hepatic veins [6,7]. The precise delineation of liver lesions and their attendant vascular milieu is indispensable for the planning and execution of interventions such as liver resections, transplantation, ablation, and embolization [8,9,10]. Accurate vessel identification facilitates the diagnostic assessment of liver pathologies, including cirrhosis and hepatocellular carcinoma [11], by furnishing critical information pertaining to blood flow and perfusion dynamics. Advancements in artificial intelligence, particularly within the radiological domain, have catalyzed substantial progress and hold considerable potential to augment clinical productivity in the forthcoming years [12]. Nonetheless, the automated segmentation of hepatic vessels persists as a formidable challenge [13] owing to two primary radiological impediments: firstly, the vascular anatomy of the liver is exceedingly complex and exhibits pronounced intrinsic variability, often resulting in spatially disseminated hepatic vessels across the majority of image slices. This complexity poses significant difficulties for AI-driven segmentation algorithms, which generally exhibit a predilection for spatially coherent and voluminous targets. Secondly, variable image quality constitutes a major obstacle.
Indeed, the hepatic parenchymal appearance exhibits considerable variability that is contingent upon multiple factors, including the specific scanner modality employed, the volume of contrast agent administered, patient-specific attributes (e.g., cardiac output), and the technical proficiency of the imaging technician. This inherent variability poses significant challenges for both computational algorithms and clinical practitioners. According to the extant literature, Jenssen H.B. et al. [14] devised a hybrid model leveraging residual U-Net and dense U-Net architectures synergistically combined with smoothing and vesselness filters, utilizing both open-source and proprietary datasets for training. This model attained a mean Dice score of 0.7859 on the public test dataset. Zhao Z. et al. [15] proposed a dual-level U-Net network incorporating two graph attention streams specifically designed for hepatic vessel segmentation. This model operates via a two-stage paradigm: the initial stage network employs a Transformer-based CNN architecture to preliminarily localize vessel positions, followed by an enhanced superpixel segmentation methodology to generate graph structures based on the localization results. The second-stage network extracts nodal features via two parallel branches: a graph spatial attention network and a graph channel attention network. These two branches utilize self-attention mechanisms to balance feature representations. When evaluated on the 3D IRCADB dataset, their model achieved a mean Dice score of 66.03 ± 2.20. Affane A. et al. [16] reported within the context of their R-Vessel-X project, which encompasses various topics pertaining to 3D angiographic image analysis and specifically liver vessel segmentation, that the average Dice coefficient sans pre-filtering operations did not exceed 0.69. Yang et al. [17] employed a V-Net architecture incorporating dilated convolution for hepatic vessel segmentation, yielding a Dice score of 0.716 utilizing the 3Dircadb dataset. In a study conducted by Alirr et al. [18], a U-Net-based network featuring a customized residual block and concatenation skip connection was proposed for liver vessel segmentation, resulting in a maximum Dice coefficient of 0.79.
Moreover, hepatic vessel and tumor segmentation presents several challenges that can be categorized into data-related, technical, and clinical issues. Regarding data, the scarcity of high-quality and large-volume vessel masks, the imbalanced distribution of vessels and hepatic tissues, and the variability in image quality pose significant problems. To address these issues, we utilized two databases: a reference database consisting of 130 CT images and their masks, as well as an internal database of 15 computed tomography (CT) images annotated by three experts with over 10 years of experience each using three segmentation methods each, where only the region of interest (ROI) validated by all three experts and methods was taken as the reference mask. To address the issue of image quality variability, we employed recently published image processing methods to enhance vessel contrast relative to hepatic tissues. From a technical standpoint, capturing vessel-specific features, managing uncertainty, and utilizing multi-scale contextual information are crucial for accurate segmentation. To address this challenge, we used a stacking model based on decision fusion. Indeed, this model presents several unique aspects, including decision combination for increased accuracy, improved robustness through the reduction of individual errors, flexibility in combination methods (majority voting, weighted averaging, etc.), uncertainty management for more reliable decisions, and global accuracy improvement by leveraging the strengths of each model. From a clinical perspective, the accurate segmentation of hepatic vessels and tumors is essential for precise diagnosis and effective treatment planning, but the complexity of hepatic anatomy and the low contrast between vessels and surrounding tissues complicate this task. To address this challenge, we leveraged the high performance of our stacking model based on decision fusion to overcome the clinical validation stage. Indeed, the proposed model will have a significant impact on clinical applications by improving diagnostic accuracy, enabling personalized care through the integration of genetic, environmental, and clinical data, optimizing clinical trials, and facilitating the development of personalized medicines and therapies.
As previously expounded, the preponderance of existing methodologies extant in the literature are impeded by subpar performance indices, consequently delimiting their clinical applicability and resultant efficacy in oncological management [19,20].
Recent studies have made significant advancements in solving relevant problems in computer vision. Notably, a novel approach to rethinking the hierarchy of multi-scale features in object detection transformers (DETR) has been proposed, introducing the Fusion Detection Transformer (F-DETR) that leverages decision fusion to enhance model performance [21]. Additionally, researchers have developed a deep learning-based method for ocular structure segmentation from facial images to aid in the diagnosis of myasthenia gravis [22]. This approach utilizes conventional segmentation models to automatically segment ocular structures, enabling a quantitative assessment of the condition. Furthermore, to address the challenge of manual annotation errors in medical databases, a zero-shot multimodal medical image segmentation algorithm, Text-Visual-Prompt Segment Anything Model (TV-SAM) has been introduced [23]. TV-SAM generates descriptive prompts using GPT-4 without requiring human annotation, thereby improving segmentation performance on multimodal medical images.

2. Materials and Methods

2.1. Patient Cohort and Data Collection

This research employed two distinct datasets for analysis. An internal dataset was sourced from Ibn Sina University Hospital in Rabat, Morocco. An external dataset was obtained from publicly available online resources: namely, the Medical Segmentation Decathlon (MSD) task 08 dataset [24].

2.1.1. External Dataset

The external dataset originates from the publicly available Hepatic Vessel dataset: more specifically, the MSD task 08, which is designed to facilitate the segmentation of hepatic vessels and tumors from liver scans. This dataset comprises 443 three-dimensional CT cases, for which the corresponding masks have been annotated by expert personnel, and is partitioned into a training subset consisting of 303 cases and a test subset encompassing 140 cases.
A CT scan slice example with its corresponding original mask from the MSD dataset is presented in Figure 1. Within the mask image, tumor regions are demarcated in yellow, whilst vascular structures are delineated in blue.

2.1.2. Internal Dataset

The internal dataset was generated via an exploratory prospective investigation conducted within a university-affiliated department of digestive oncological surgery: specifically, the Digestive Oncological Surgery Department (SCOD) at the National Institute of Oncology (INO) in Rabat, Morocco. A cohort of patients underwent conventional planning CT images slices followed by employing three-dimensional reconstructions of the liver and intrahepatic structures with the objective of assessing the technical feasibility of hepatic reconstructions and their subsequent clinical validation. The Consolidated Criteria for Reporting Qualitative Research (COREQ) guidelines were employed to structure the composition of this work.
The present research study obtained approval from the Ethics Committee of the Faculty of Medicine and Pharmacy in Rabat under protocol number 38/20.
A dataset of 112 chronic liver disease patients who underwent contrast-enhanced abdominal CT scans from January 2020 to July 2021 was reviewed. To ensure patient confidentiality, full anonymization of the dataset was performed. Data collection was carried out by a multidisciplinary team comprising three specialist doctors and two computer scientists in adherence with international ethical standards and the principles of the Declaration of Helsinki. As per the ethics committee’s recommendations, personal identifiers were removed to maintain dataset anonymity.
The work’s supervisor, who is also the coordinating surgeon of the liver surgery program at SCOD, performed patient selection criteria for this study, as shown in Figure 2. The goal was to ensure a diverse range of anatomo-clinical situations. Inclusion criteria included patients over 18 years old scheduled for hepatectomy at SCOD, National Institute of Oncology, for liver or biliary tumors (benign or malignant, primary or secondary, single or multiple). Patients also needed preoperative CT liver imaging with vascular contrast in Digital Imaging and Communications in Medicine (DICOM) format and consent to participate. Exclusion criteria were missing clinical data, preoperative treatment, image artifacts, neoadjuvant chemotherapy, and cases where clinicians considered reconstruction unnecessary for complete patient evaluation. Out of 112 cases reviewed, 15 patients were ultimately selected for the study.

2.2. Acquisition, Processing, and Segmentation of Ground-Truth CT Images

2.2.1. CT Image Acquisition

The ‘Pydicom’ Python library (release: 3.0.1, date: 22 September 2024) was utilized to extract CT images stored in the DICOM format. All CT images were obtained using the SOMATOM definition by ‘Siemens Healthcare GmbH’. This was achieved using the Elastix module (version 5.0.1, Linux Foundation, San Francisco, CA, USA, accessed 20 July 2021) within 3D-Slicer.

2.2.2. CT Image Processing

Medical image processing is crucial for producing clear, high-quality images that aid doctors in making accurate diagnoses and advancing medical research. Numerous studies have proposed methods to enhance CT image sharpness, resolution, invariance, and acceptability. In this work, images were processed and resized using ‘SciPy ndimage’ packages, which offer various image processing and analysis functions designed for 226 × 226 arrays.
All CT images were subjected to a standardized preprocessing pipeline [25,26,27] which includes a sequence of steps: denoising, interpolation, registration, organ windowing, normalization, and zero-padding. This preprocessing protocol enhances image quality and optimizes the performance of deep learning algorithms.

2.2.3. Ground Truth Region of Interest Segmentation

For the segmentation of tumor regions of interest (ROIs), the experts utilized three distinct methodologies: manual annotation, semi-automatic segmentation employing ITK-SNAP [28,29], and semi-automatic segmentation utilizing 3D Slicer [30,31]. Only those segmentations that were concordantly confirmed by all three methods were selected, thereby yielding a precisely annotated benchmark dataset. Following rigorous validation, a cohort of 15 patients out of 112 exhibited confirmed ROI segmentations that were concordant across all three methodologies. Experts first segmented the liver, then the tumor, and finally the hepatic vessels to generate a ground-truth 3D image, as illustrated in Figure 3 for patient 3 available at https://p3d.in/WOG6P (accessed on 22 May 2021). The 3D mask uses a specific color-coding scheme: tumors (yellow), gallbladder (green), hepatic portal veins (blue), and abdominal aorta (red).

2.3. Segmentation Based on Precision Fusion, Model Stacking, and Deep Transfer Learning

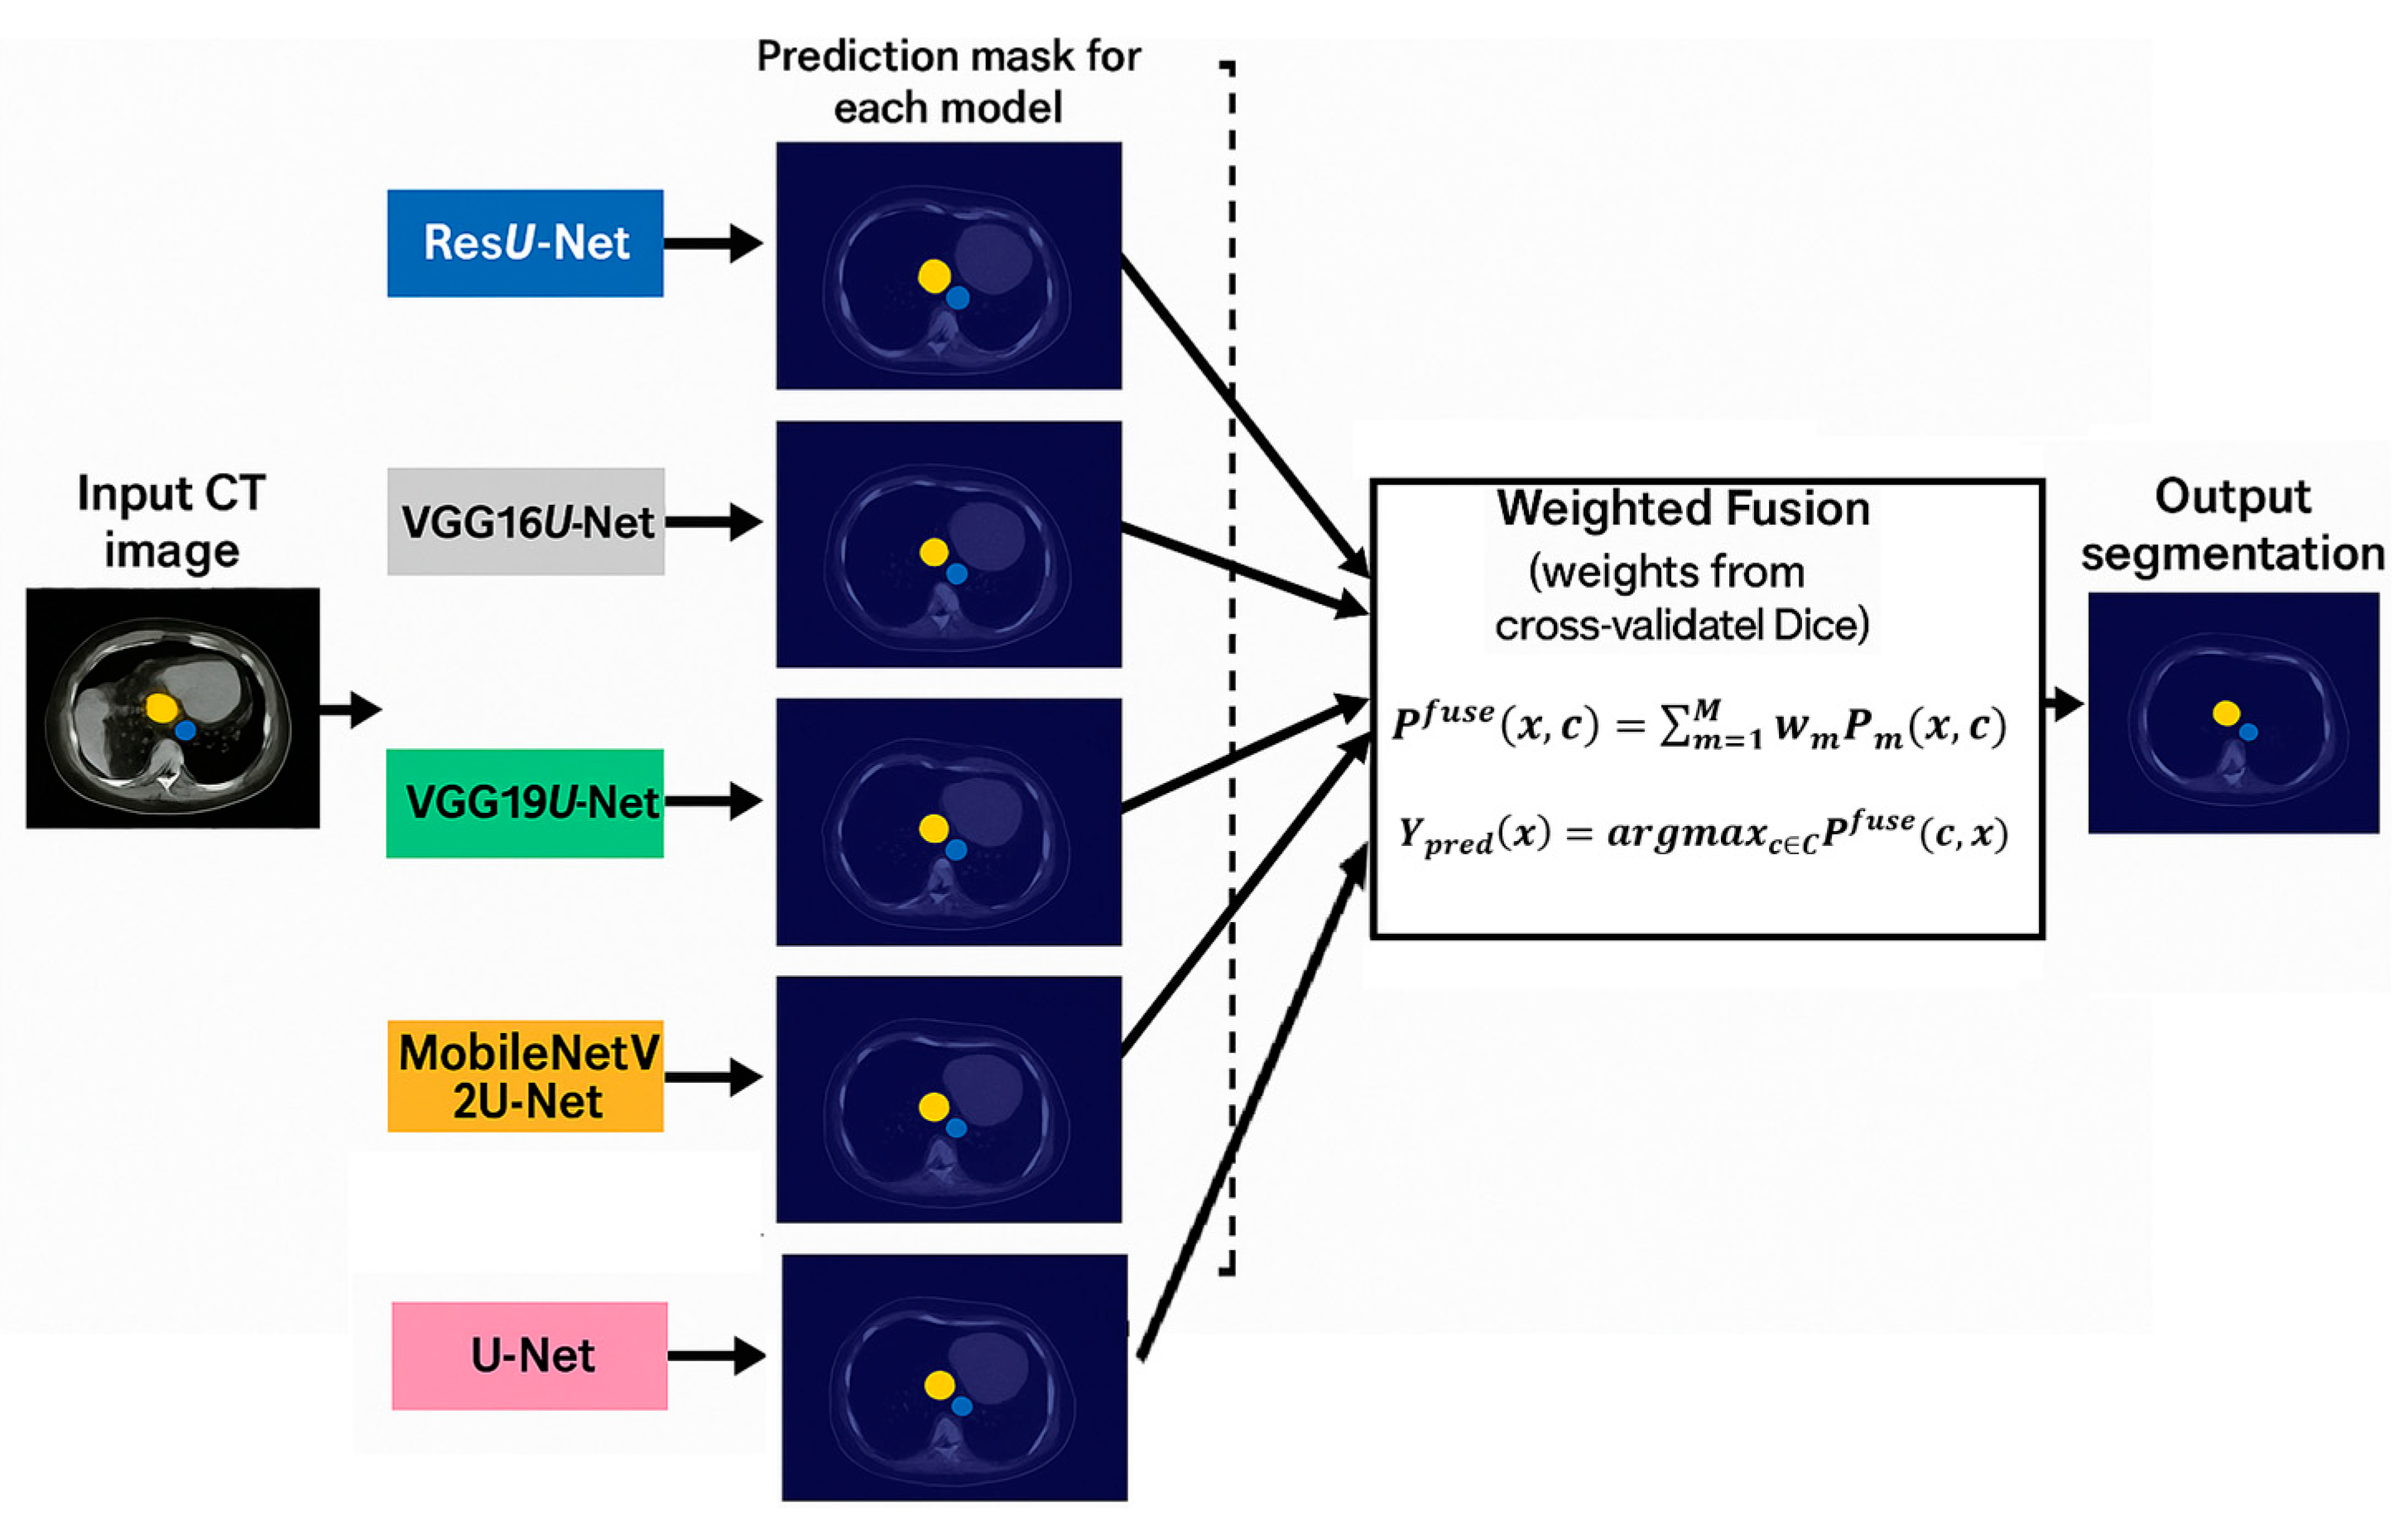
To enhance the model’s output precision, a decision fusion deep-stacking model was developed. This model comprises five pre-trained U-Net architectures: U-Net [32], ResU-Net [33], VGG16U-Net [34], VGG19U-Net, and MobileNetV2U-Net [35], illustrated in Figure 4. The final output results from selecting the prediction with the highest score following decision fusion principles, detailed in the subsequent paragraph.

2.4. Decision Fusion

To improve our stacking model’s accuracy, we employed decision fusion. Literature shows that authors in [36,37,38] have established theoretical decision fusion forms, including sum, product, maximum, minimum, median, and majority voting. Through numerical simulations, we chose majority voting to combine decisions from our stacking model’s networks. Let’s consider an input model Z that belongs to one of the j possible class labels (C1, C2, …, Cj, …, Cn), where j is in the range [1, n]. Consider the ith classifier, which receives a feature vector from the input model Z, where i is in the range [1, R]. The ith classifier’s output is the decision ω n * . The decisions from the classifiers are combined using the posterior probability (ωj/xi).
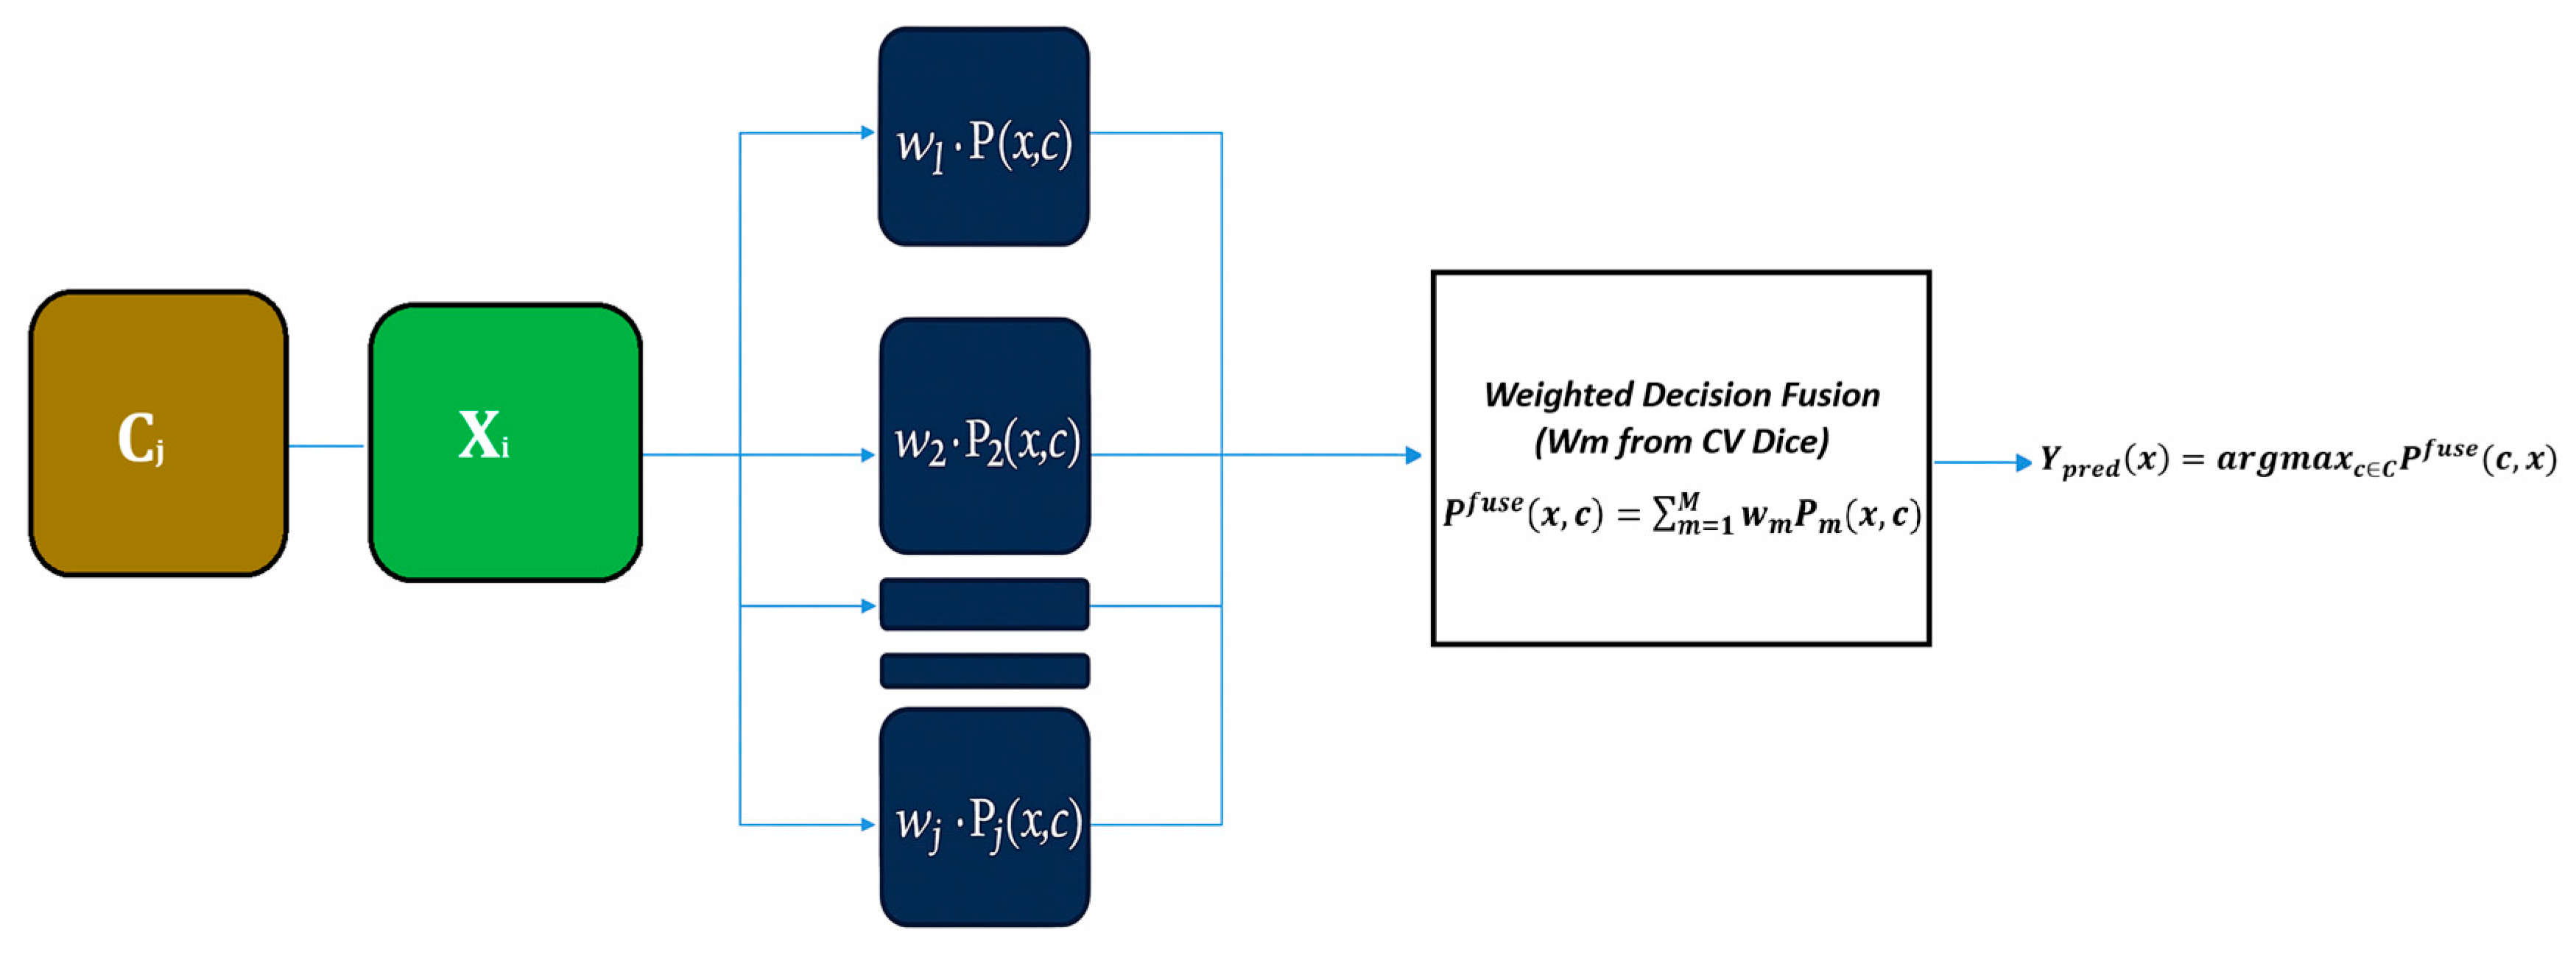
To further improve robustness, we implemented a weighted majority voting scheme where each U-Net variant contributes with a weight proportional to its cross-validation Dice performance. Stronger models (e.g., ResU-Net, MobileNetV2U-Net) thus influence the final decision more heavily, reducing the effect of weaker models. This adaptive weighting, illustrated in Figure 5, improved overall segmentation precision compared to simple majority voting.
The final fusion rule was majority voting across the five backbone networks. For each voxel, the predicted class was selected according to the maximum number of votes. In the rare event of ties (<0.5% of voxels), the decision was resolved by choosing the class with the highest mean softmax probability across the tied models.
Using the majority voting method, the output decision Di,j is
D i , j = 1   i f   p ω n * x i = max j = 1 n p ( ω j x i ) 0     o t h e r w i s e
In this case, the weight ω j   will be associated with the form Z if
i = 1 R D i , j = m a x n = 1 j i = 1 R D i , n
Equation (2)’s right-hand side sums up the votes for each network in the stacking model, enabling the model to make a final decision based on majority voting.

2.5. Workflow of the Proposed Deep Transfer Stacking Precision Diffusion Segmentation Model

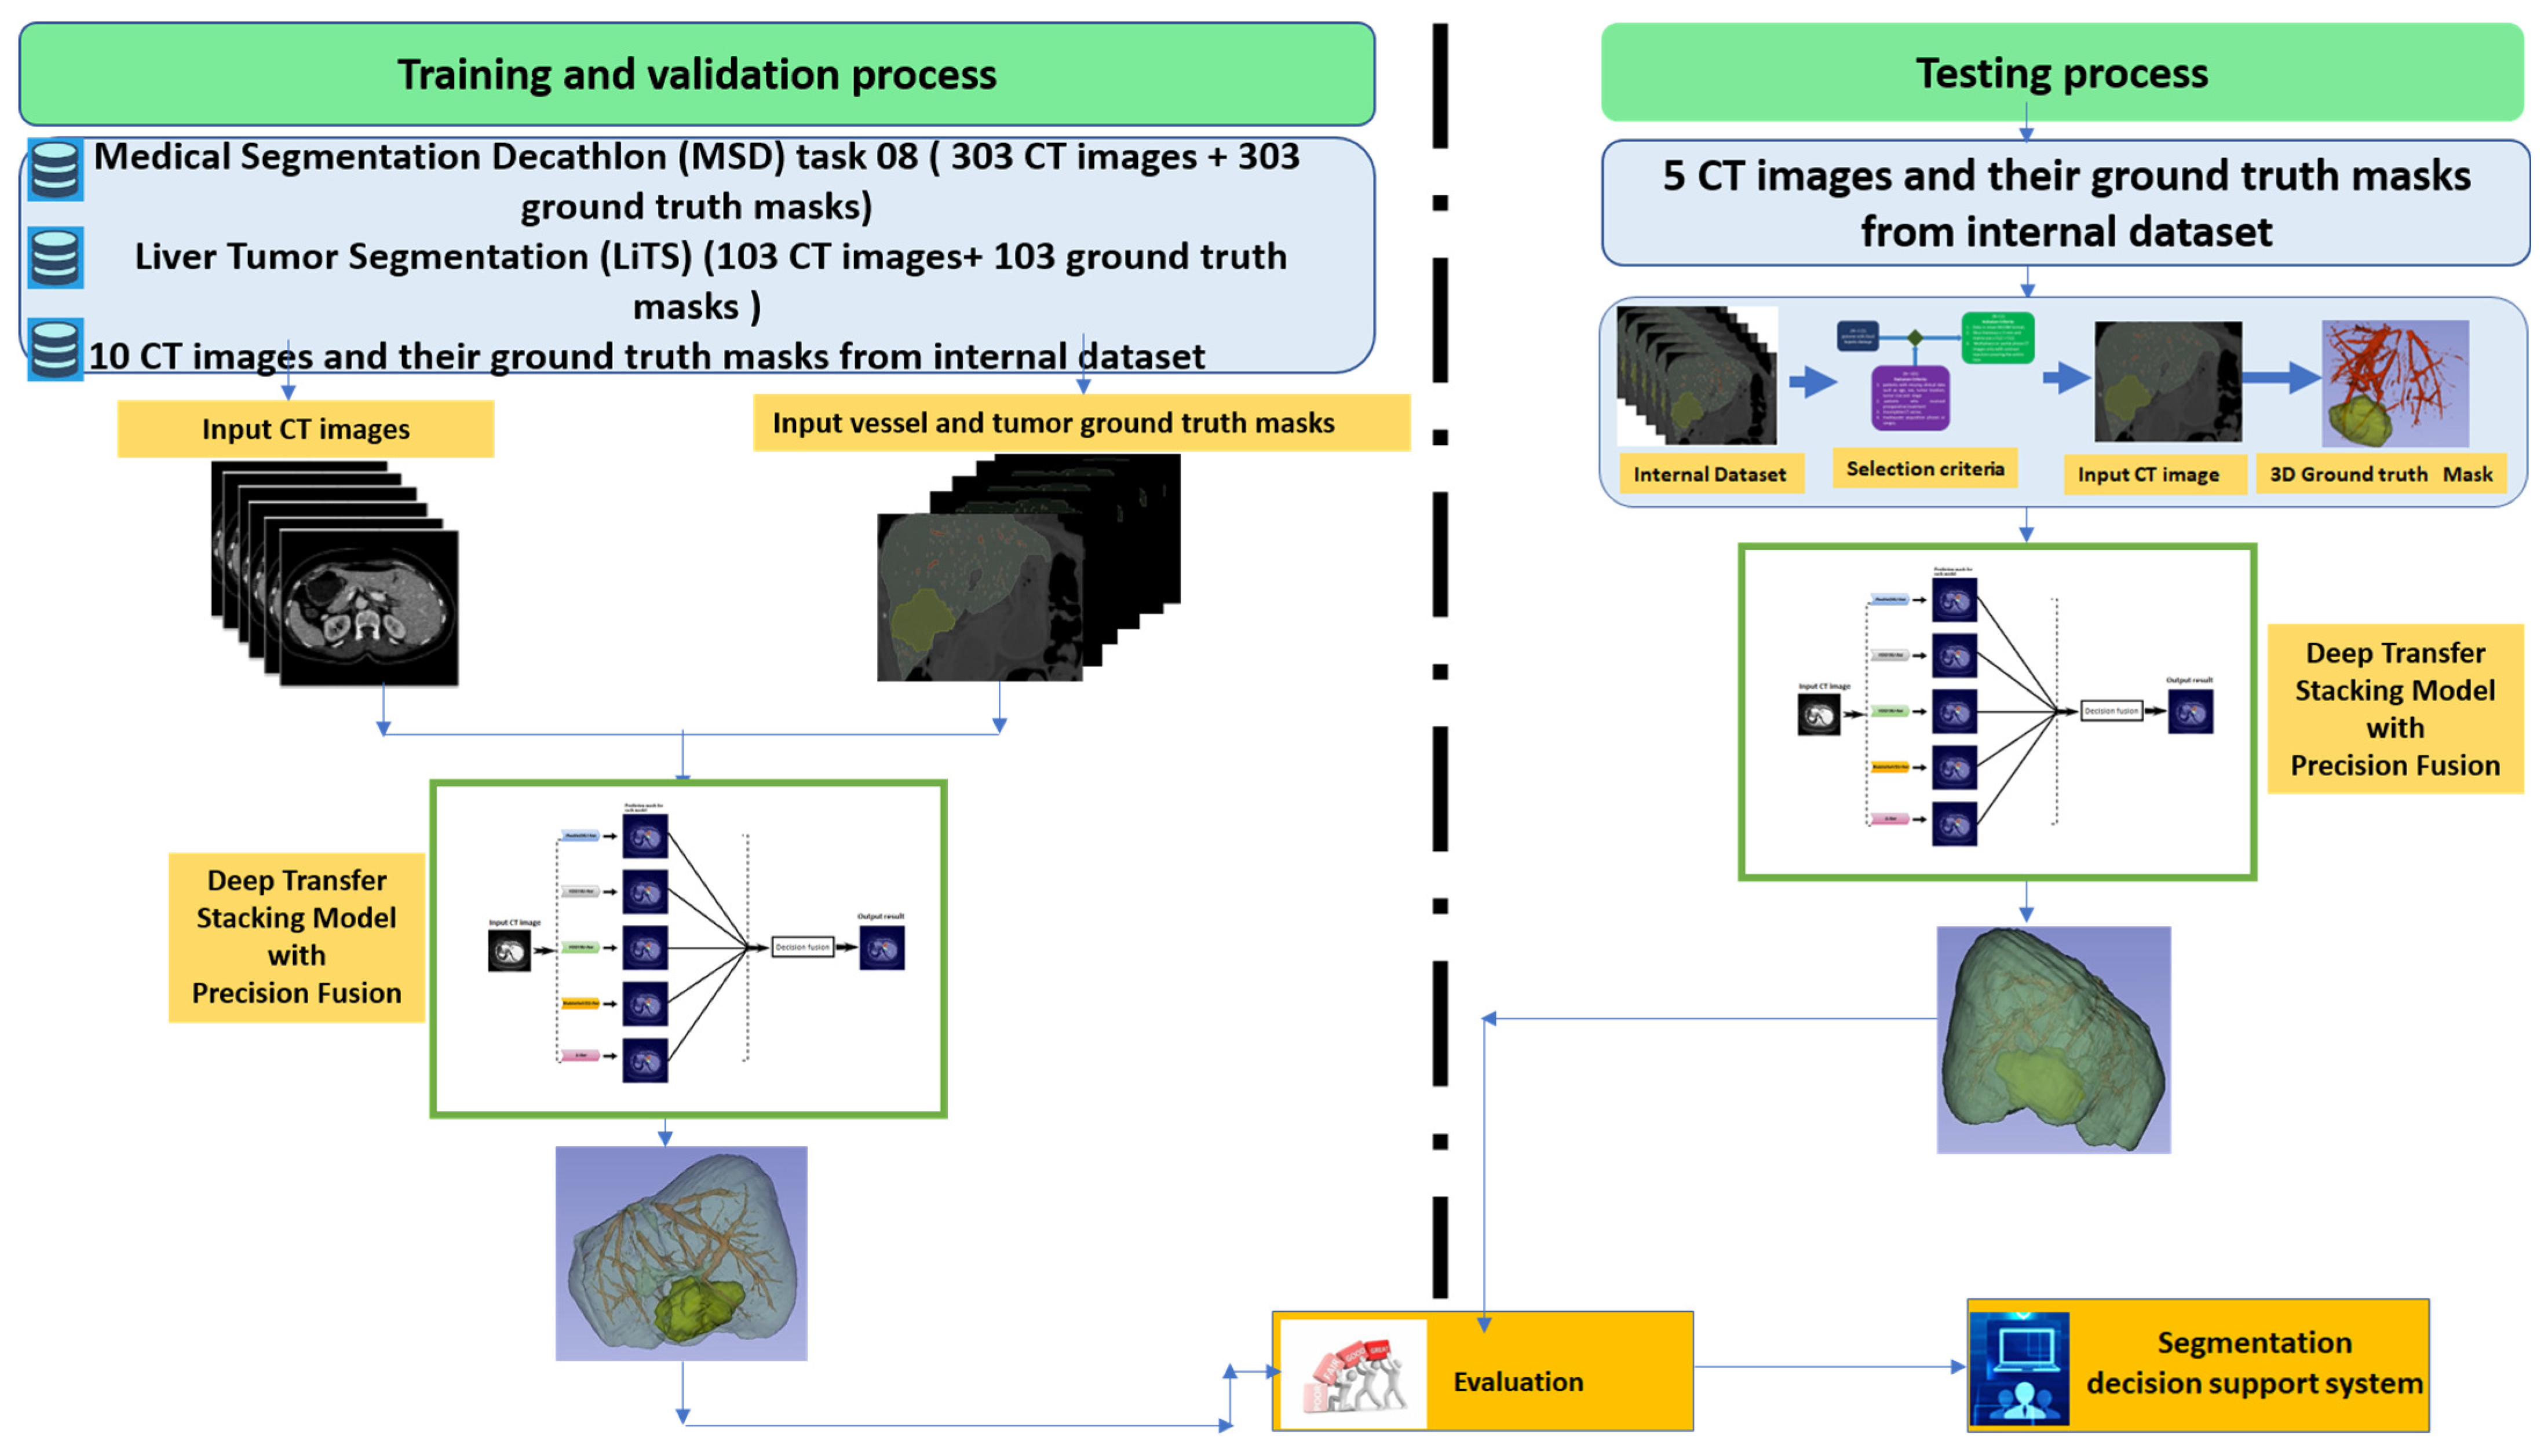
We enhanced our model’s segmentation performance by combining model stacking, deep transfer learning, and precision fusion. To reduce false positives and increase output accuracy, we used model stacking with precision fusion via maximum voting. This approach selects the prediction with the most votes from the five model ensemble predictions as the final output. To save computational costs and training time, we applied deep transfer learning using pre-trained ImageNet CNN architectures, fine-tuning them on our dataset. Our model’s workflow, shown in Figure 6, involved two key processes: training and testing. In training, we used 5-fold cross-validation on a set of 303 CT images with ground truth masks from the Medical Segmentation Decathlon (MSD) task 08 and a set of 10 CT images with masks from our internal dataset. In testing, we evaluated the model on the remaining 5 CT images and their ground truth masks from the internal dataset.

2.6. Stacking Model Architecture

Our stacking model is based on the U-Net architecture, utilizing five variants customized for medical image segmentation. The down-sampling component was modified to include image convolution, ReLU activation, and 2D normalization. Preprocessing steps for images included uniform resizing, signal intensity standardization, and normalization. The segmentation process consisted of down-sampling and up-sampling, allowing the network to extract visual features for tumor detection. The CNNs employed multiple layers to capture features at different resolutions, which is particularly useful for identifying small tumors. We used the Adam optimizer for loss computation and weight updates and avoided max pooling to preserve gradient flow.
Furthermore, we adapted U-Net variants for hepatic vessel and tumor segmentation by introducing specific modifications. These customizations enabled us to leverage the strengths of each architecture for our task. The modifications included the following:
  • VGG16/19U-Net: We replaced the classical U-Net encoder with the convolutional blocks of VGG16 and VGG19, which were pretrained on ImageNet. This allowed for the extraction of detailed vascular features while preserving tumor boundaries.
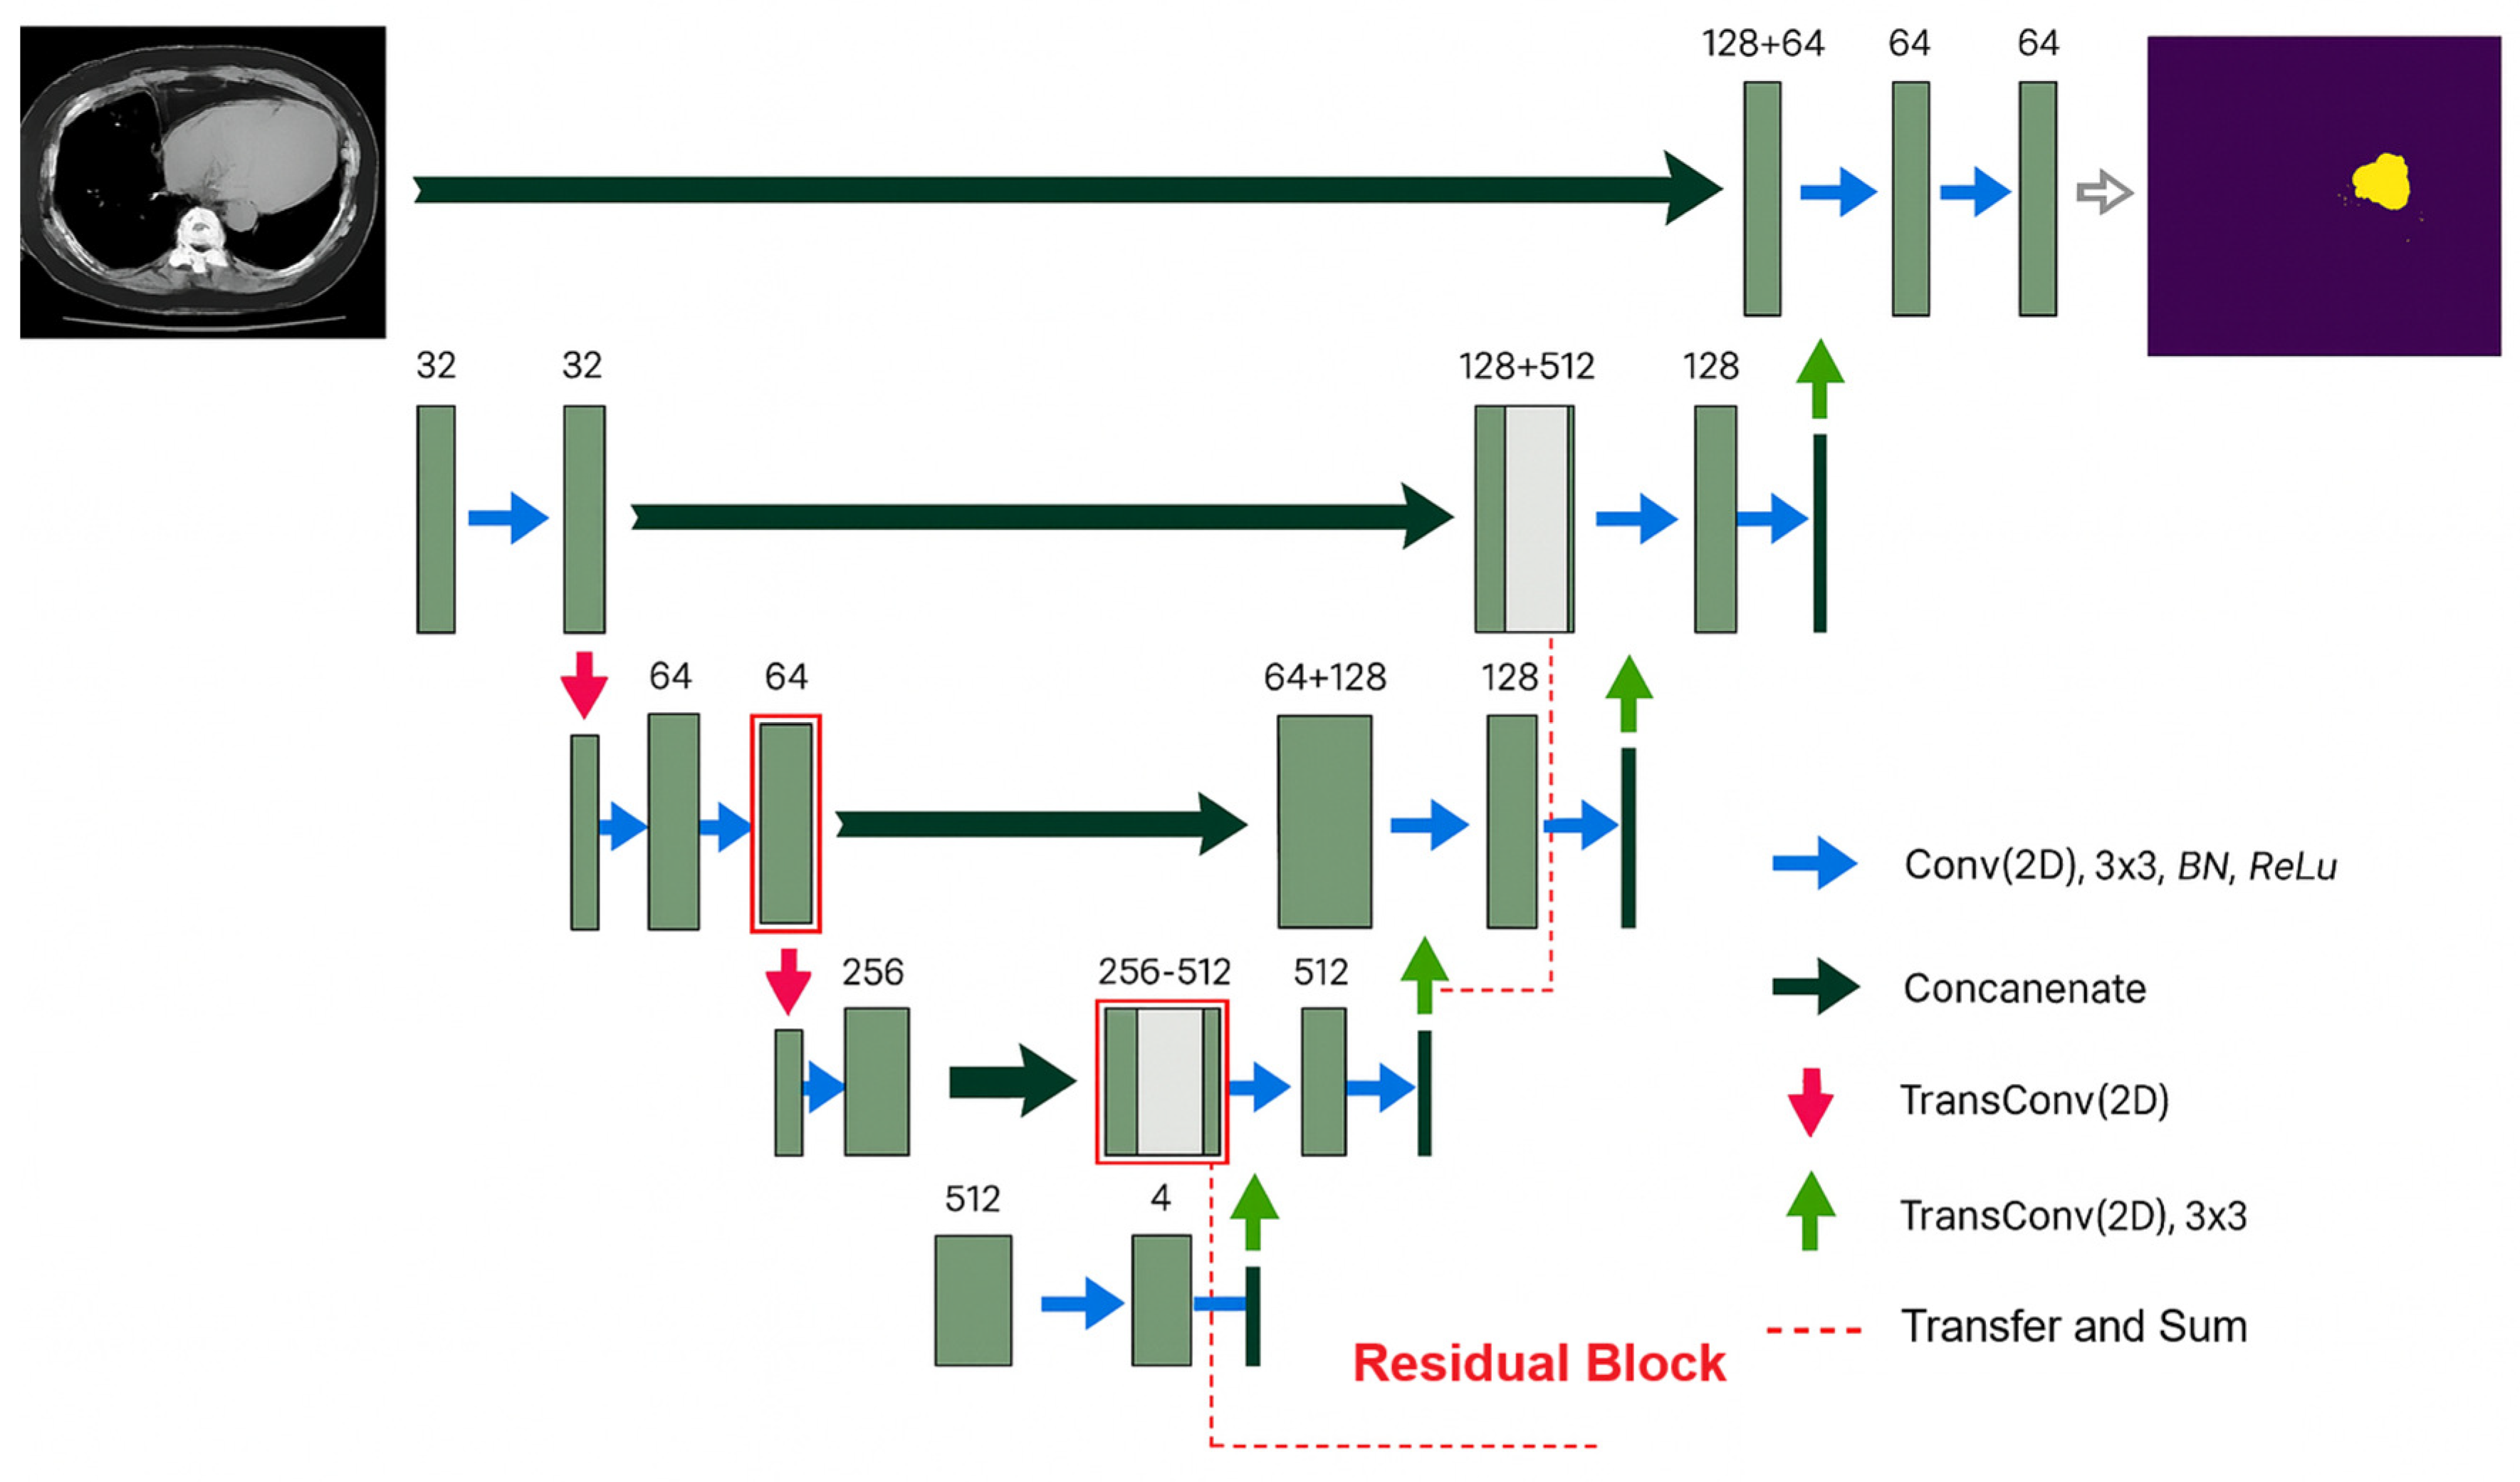
  • ResU-Net: We integrated residual blocks into the contracting path to improve gradient flow and mitigate vanishing gradients. This enhancement improved the detection of vessel connectivity.
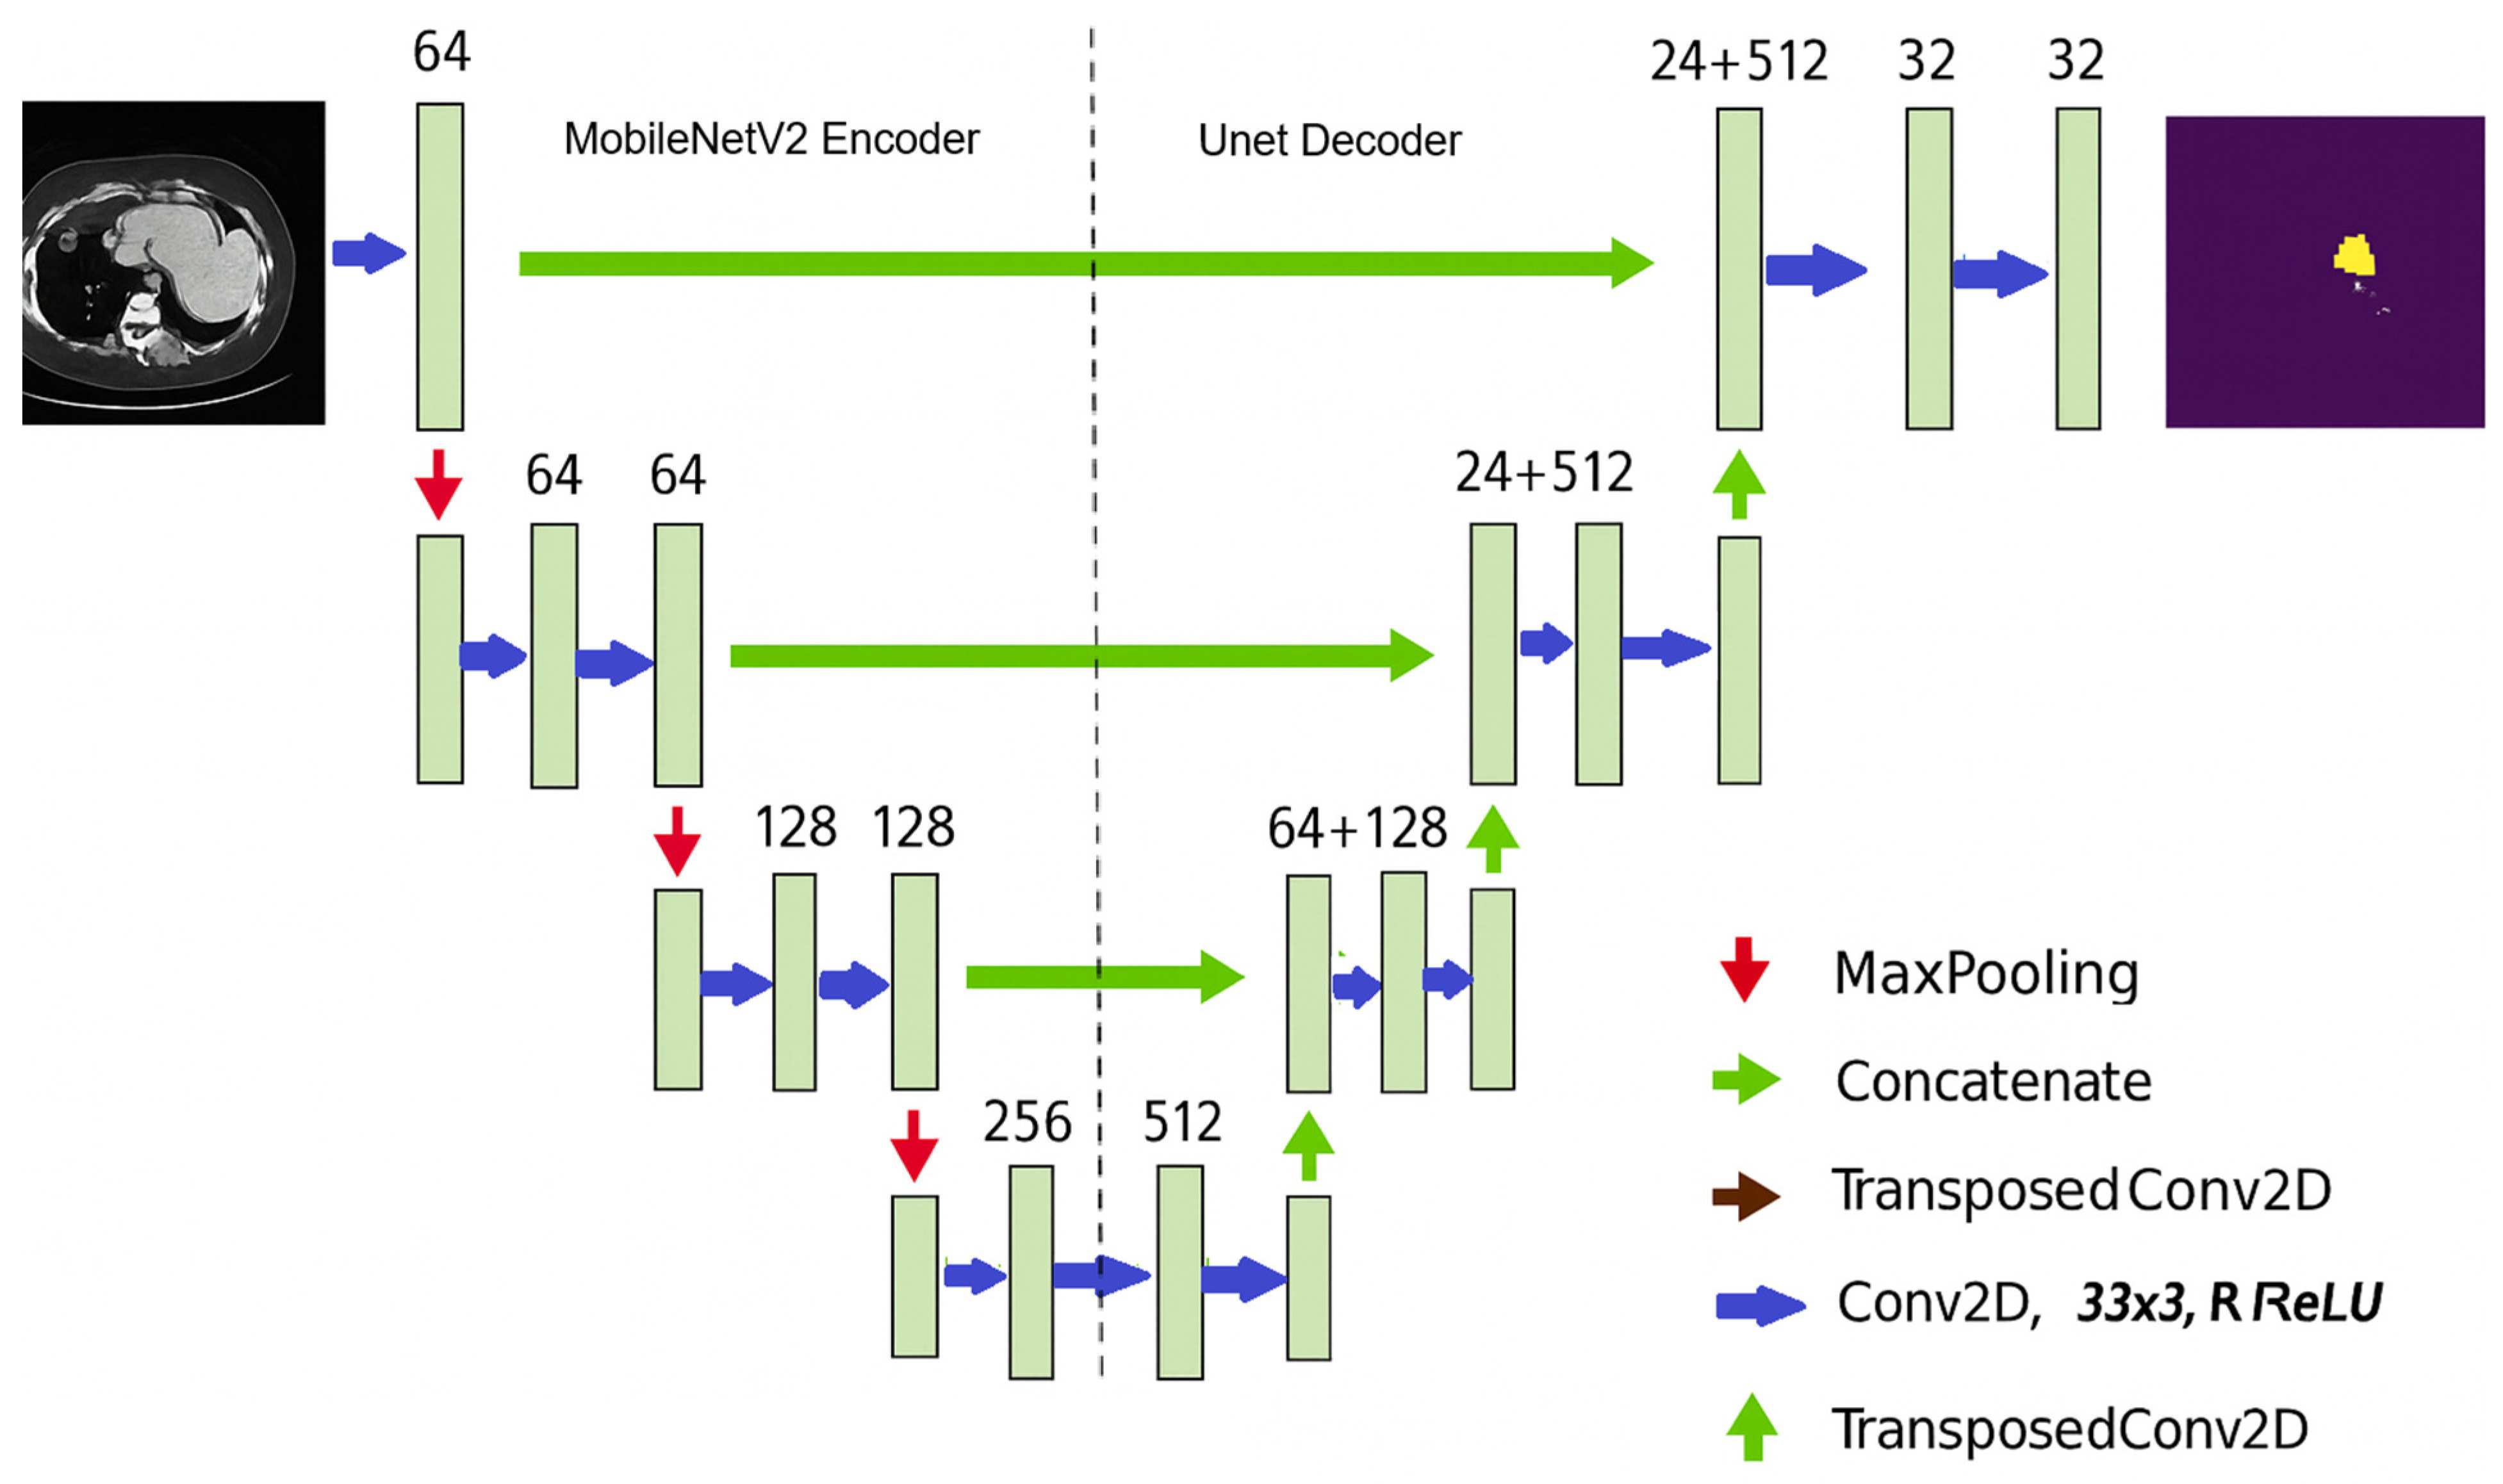
  • MobileNetV2U-Net: We utilized depthwise separable convolutions to reduce computational costs and accelerate inference while maintaining segmentation accuracy. By fine-tuning the pretrained MobileNetV2 encoder on our dataset, we made the model suitable for real-time clinical applications.
  • Transfer Learning: For all variants, we initialized encoder layers with pretrained ImageNet weights and fine-tuned them on hepatic CT images. This approach significantly reduced training time and improved convergence.
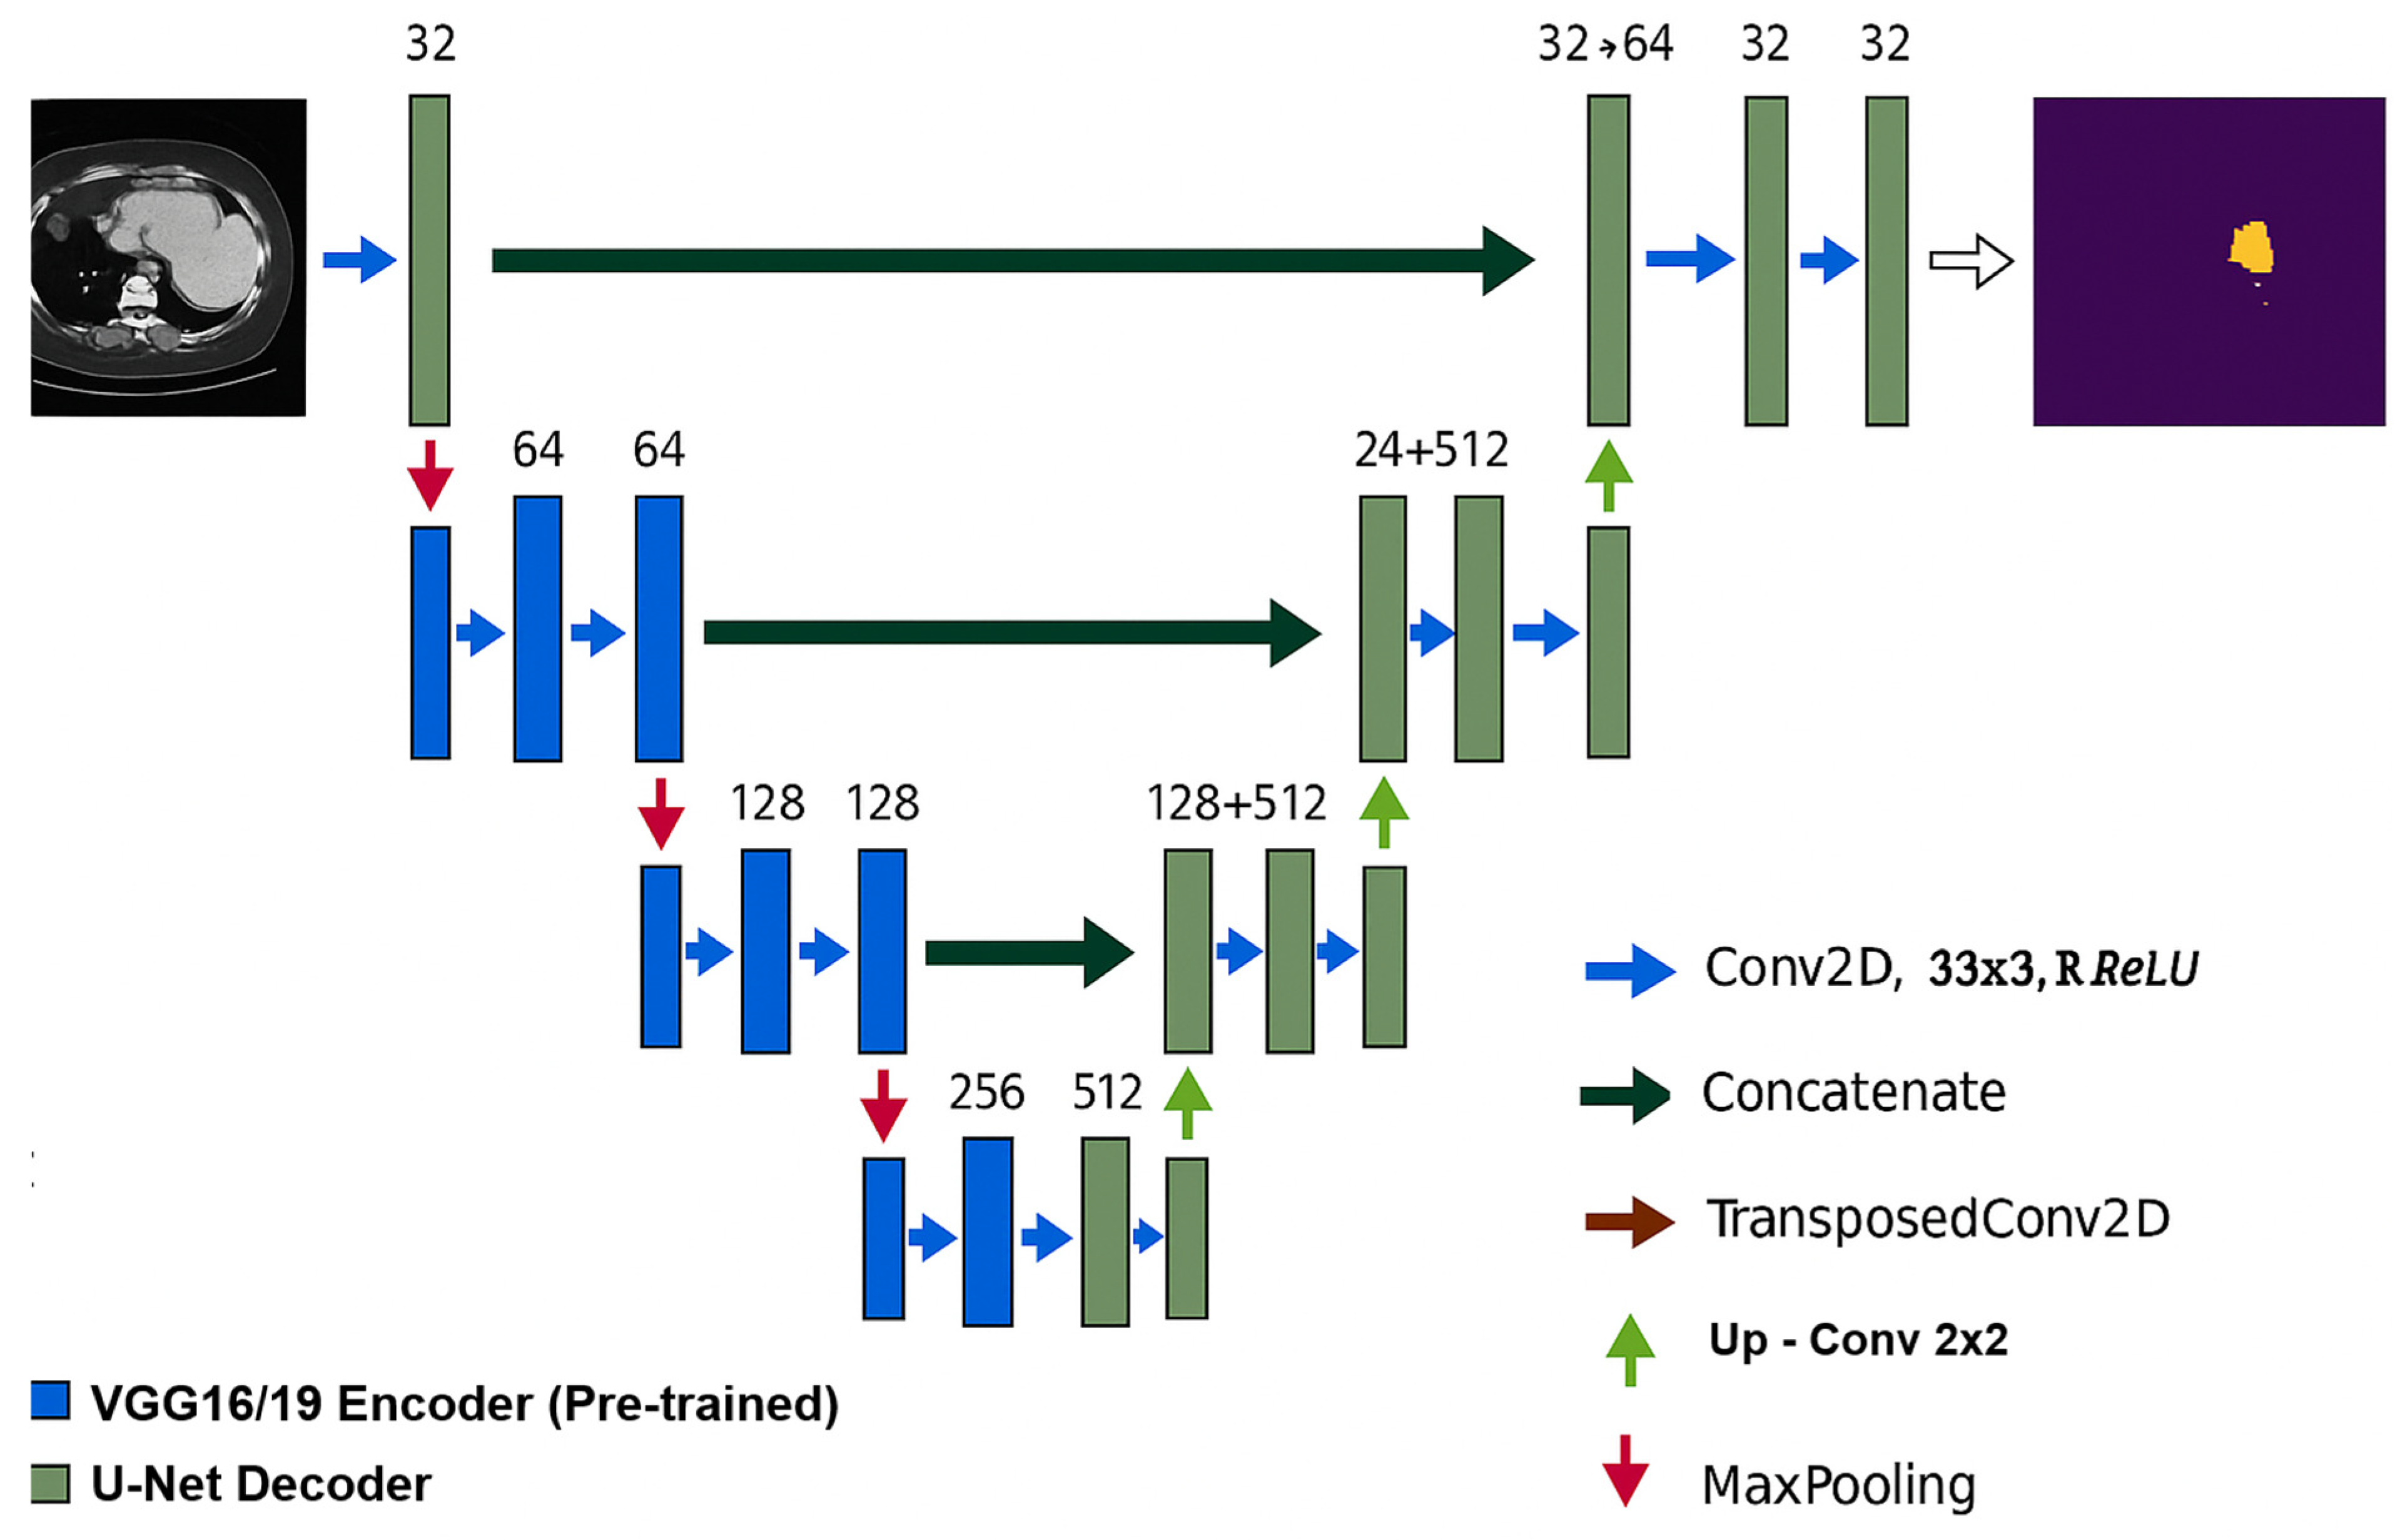
For clarity, the U-Net architecture is illustrated in Figure 7, and the three U-Net variants employed in our stacking model are depicted with updated architectural diagrams in Figure 8, Figure 9 and Figure 10. Specifically, Figure 8 showcases the encoder replaced with pre-trained VGG16/19 convolutional blocks, highlighted in blue. Figure 9 highlights residual blocks in red to illustrate the ResU-Net’s skip residual connections. Figure 10 features the MobileNetV2-based encoder in green, emphasizing the use of depthwise separable convolutions. These color-coded diagrams provide a clear visual representation of how each variant diverges from the original U-Net baseline.
The execution process of our model is detailed in Table 1, which includes the following steps:
In our custom U-Net, ResU-Net, and MobileNetV2-U-Net variants, max pooling operations were replaced by strided convolutions to preserve gradient flow and enhance the detection of small lesions. For the VGG16 and VGG19 encoders, however, MaxPooling layers were preserved to remain consistent with the pretrained ImageNet initialization.

2.6.1. U-Net Architecture Description

U-Net is a convolutional neural network (CNN) developed by the University of Freiburg’s Computer Science Department that is specifically designed for biomedical image segmentation. The U-Net architecture has a symmetrical design, comprising a contracting path (left side) for down-sampling and an expansive path (right side) for up-sampling. Its fully convolutional architecture, shown in Figure 7, enables accurate segmentation even with limited training data.
Although the U-Net is a standard architecture, we retained its schematic (Figure 7) to provide a baseline reference and ensure consistent comparison with the other modified architectures (VGGU-Net, ResU-Net, MobileNetU-Net). This helps readers understand how modifications were derived from the original U-Net design.

2.6.2. VGGU-Net Architecture

This design combines the U-Net’s encoder–decoder structure with the VGG-16 and VGG-19 networks. The encoder consists of 5 blocks containing convolutional layers and MaxPooling operations (indicated in Figure 8 by the pink arrow), whereas the decoder employs up-sampling operations (green arrow) to recover the original image dimensions. Skip connections (black arrows) enable feature map concatenation, which improves the restoration of image details.

2.6.3. ResU-Net Architecture

ResU-Net is a deep residual U-Net architecture tailored for semantic segmentation. Originally developed by Zhengxin Zhang et al. [39] for extracting roads from aerial images, it has been effectively applied to tasks like polyp segmentation, brain tumor segmentation, and human segmentation. By merging U-Net with deep residual learning, ResU-Net delivers high performance using fewer parameters. Its design innovatively substitutes traditional convolutional layers with pre-activated residual blocks, as illustrated in Figure 9, resulting in improved performance and a reduced parameter count.

2.6.4. MobileNetU-Net Architecture

As shown in Figure 10, the model’s architecture features a symmetrical contracting and expanding path. It employs a two-stage method, beginning with pre-training MobileNetV2 for defect classification, followed by semantic segmentation. The encoder utilizes the pre-trained layers, and the decoder is formed by adding de-convolutional layers, allowing for pixel-level segmentation.

2.7. Evaluating Model Performance

To assess our model’s segmentation performance, we use three primary metrics: the dice similarity coefficient (DSC), Jaccard coefficient (JC), and intersection over union (IoU). DSC quantifies the spatial overlap between manual and network-generated segmentations, with values between 0 and 1. The Jaccard coefficient and IoU gauge the similarity between two sets by evaluating the intersection over union. These metrics offer a thorough evaluation of our model’s performance, with DSC being particularly prevalent in medical imaging.
D S C X , Y = 2 × X Y X + Y ,
X represents the set of voxels in the model’s segmented volume, while Y represents the set of voxels in the ground truth. |X| signifies the number of elements in the set. The symbols ∩ and ∪ denote the intersection and union, respectively. The Jaccard coefficient, which assesses the similarity between two finite sample sets X and Y, is defined as
J C ( X , Y ) = X Y X Y
Our third metric, the IoU coefficient, computes the ratio of the intersection of the ground truth and predicted areas to their union:
I o U ( X , Y ) = X Y X Y
There is no difference between IoU (intersection over union) and JSC (Jaccard similarity coefficient). Both terms refer to the same measure of similarity between two sets.
IoU and JSC are similarity measures that evaluate the proportion of common elements between two sets relative to the set of elements that belong to either one or both of the sets. An IoU/JSC value close to 1 indicates a high similarity between the two sets, while a value close to 0 indicates a low similarity.

3. Results

Our code was written in Python 3.6 using TensorFlow r1.9. Training was performed on a workstation equipped with 4 GeForce GTX 1080 Ti GPUs. Inference speed statistics were computed on a single GPU.

3.1. Training and Testing Data

Patients were randomly split into training and testing sets. The training set comprised 313 patients: 303 from the public “Decathlon (MSD) task 08” dataset with CT images and ground truth masks, and 10 patients from our internal dataset with CT images and masks. This totaled 50,080 CT image slices with corresponding masks, a sufficient size to prevent model overfitting. We used five-fold cross-validation during training, with 80% of the data for training and 20% for validation. The test set consisted of 1600 CT image slices with ground truth masks from five patients in our internal dataset.

3.2. Training Process

3.2.1. Simulation Parameters

The training process included several key components to optimize performance. The model used the Adam optimizer and the Dice loss function, with an initial learning rate of 0.001 that was dynamically reduced based on validation performance. To boost robustness and prevent overfitting, we applied dropout (50% rate), batch normalization, and early stopping after 10 consecutive epochs without improvement. Data augmentation techniques like random rotation, zooming, translation, and flipping were also used to enhance the model’s ability to detect tumors under varying conditions and improve its robustness.
The hyperparameters employed during training are summarized in Table 2. These values were empirically determined to balance convergence speed, robustness to overfitting, and GPU memory limitations. The rationale for each choice is provided to ensure the reproducibility and transparency of the experimental setup.

3.2.2. Loss Function

The model was trained with a combined loss function, given by Equation (6), which integrates Dice loss (LDICE) from Equation (7) and cross-entropy loss from Equation (8) [40], expressed as
L F U N C T I O N = L D I C E + L c r o o s e n t r o p y
where the Dice loss function is given by [41]:
L D I C E = 2 K K ϵ K i ϵ I U i K V i K i ϵ I U i K + i ϵ I V i K
Here, U is the network’s softmax output, and V is the one-hot encoding of the ground truth segmentation map. U and V both have dimensions i × k, where i represents the number of pixels in the training patch and k represents the number of classes.
The cross-entropy loss function is given by:
L C R O S S E N T R O P I Y   =   1 N i = 1 N c = 1 C Y i , c l o g ( y ^ i , c )
Yi,c represents the true probability of class c, usually 1 for the correct class and 0 for others. Y ^ i , c is the predicted probability of class k.
The MobileNetV2U-Net’s average performance metrics are presented in Figure 11, which depicts the Dice coefficient and loss function curves during training and validation, averaged over five-fold cross-validation. The loss curves include both Dice loss and cross-entropy loss.

3.2.3. Segmentation Performance

Segmentation performances, evaluated using Dice, Jaccard, and IoU coefficients, are presented in Table 3. The MobileNetV2U-Net model demonstrated robust performance, while the stacking approach outperformed individual models. The fusion precision stacking model showed strong performance, achieving a Dice coefficient of 82.67 and an IoU of 73.41 for vessel and tumor segmentation, surpassing individual networks like MobileNetV2U-Net and ResU-Net.

3.3. Testing Process Performances

The model was tested on five CT images from an internal database that weren’t used during training. The results are shown in Table 4. The fusion decision-stacking model showed a strong performance, achieving a DSC of 83.21 and IoU of 72.76, outperforming individual networks like MobileNetV2U-Net and ResU-Net.
Furthermore, the average inference time was 0.47 s per slice (226 × 226 pixels) and 78 s per 3D CT volume (≈160 slices) on a single GTX 1080 Ti GPU, confirming that the proposed approach provides fast segmentation suitable for clinical workflows.

3.4. Visual Representation of the Segmentation

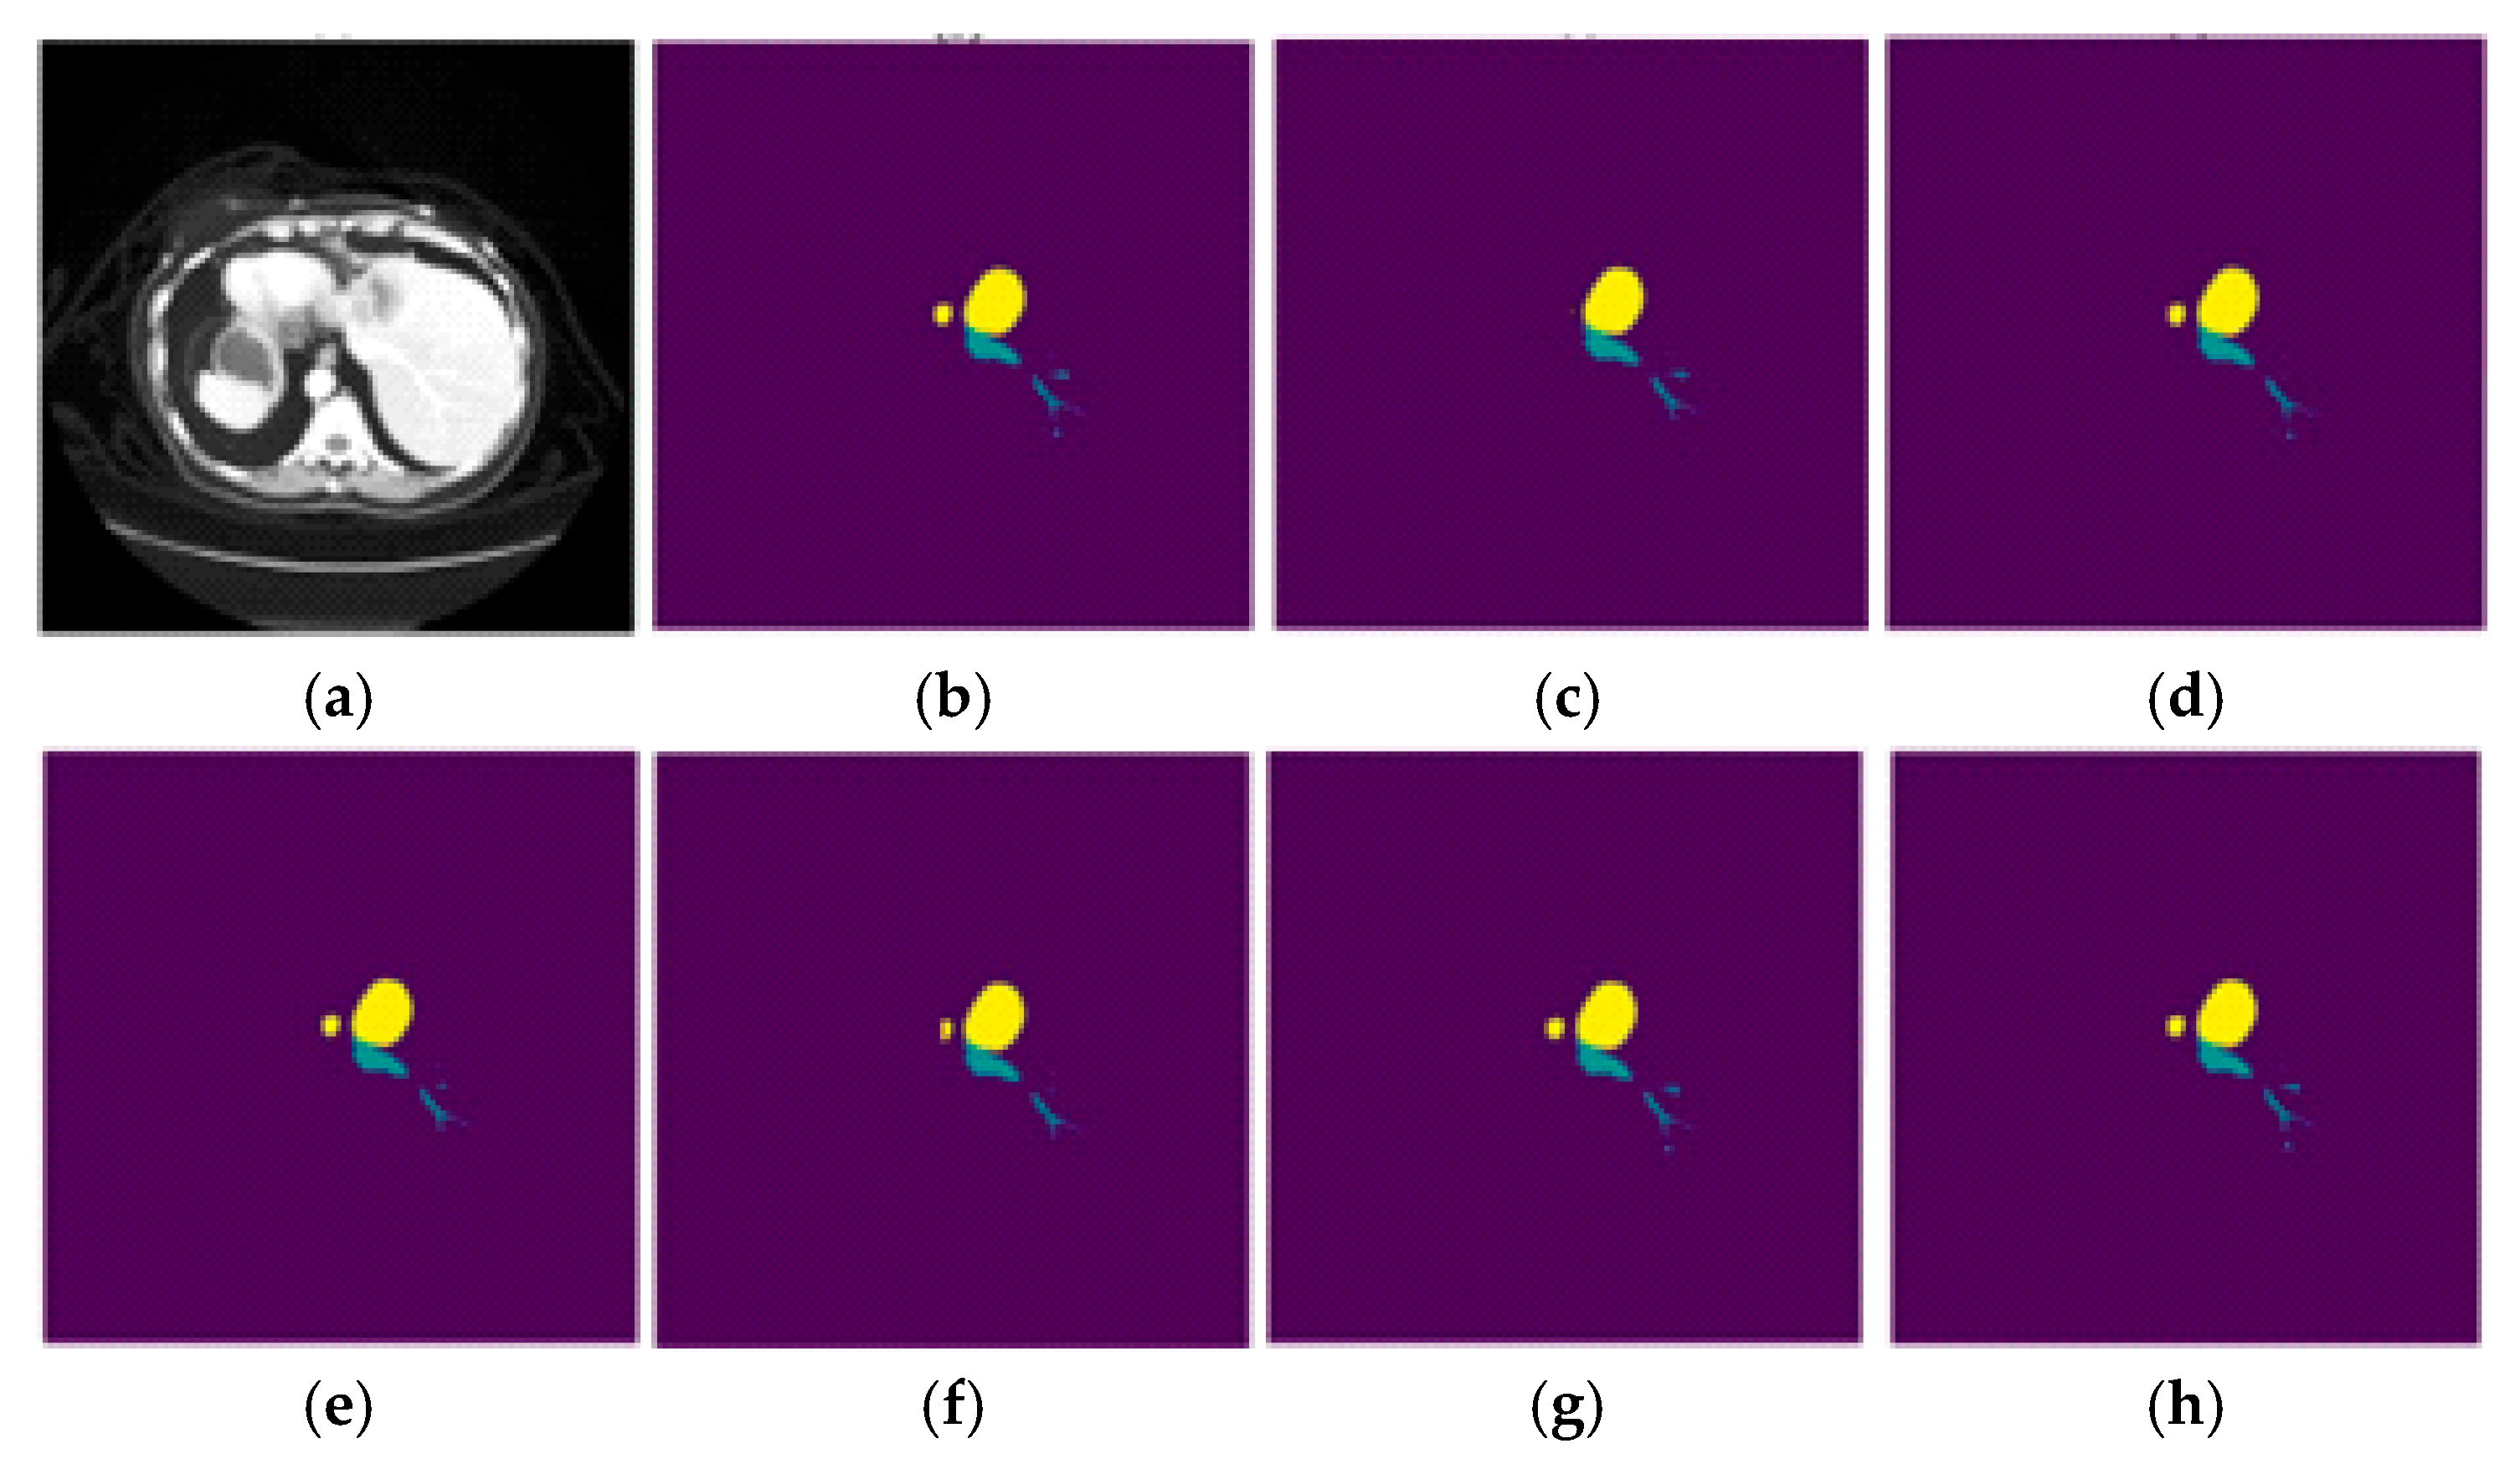
Figure 12 shows the segmentation results for each model, displaying original images, ground truth masks, and predicted liver vessel and tumor segmentations. The visualizations highlight the models’ capability to precisely identify liver vessel and liver tumor segmentations.
To compare the accuracy of tumor and liver vessel extraction, we overlaid the ground truth mask and the predicted mask on the same original image, allowing for a visual assessment of our model’s performance relative to expert annotation. Indeed, Figure 13 illustrates the results of superimposing the original mask and the mask predicted by our model onto four original images extracted from the public MSD Task 08 database. This visual comparison enables us to assess the accuracy of our model’s extraction of liver tumors and vessels compared to the manual annotations performed by experts. The results presented in Figure 13 demonstrate a strong coincidence between the tumors and vessels in the original images and the tumors and vessels in the predicted masks, as well as a high similarity between the predicted masks and the ground truth masks.

3.5. Benchmarking Vessel and Tumor Liver Segmentation

To showcase the robustness of our model for liver vessel and tumor segmentation, we conducted a comparison with other recently published models from the literature. Specifically, our model’s performance was benchmarked against previous studies, with Dice values for liver tumor and vessel segmentation gathered from various papers and presented in Table 5.
A review of datasets used in recent studies [19,24,42,43,44,45,46,47,48] revealed that only three articles employed the 3DIRCADb dataset [49] to assess their models. We leveraged this public dataset to curate a new dataset from multiple institutions consisting of 20 CT images with vessel masks. Our model achieved a DSC of 82.81 for vessel segmentation, surpassing the performance reported in [43,44,47] (Table 6). These results demonstrate the model’s generalizability across various imaging protocols and patient populations.

4. Discussion

This paper introduces an end-to-end architecture integrating stacking models, decision fusion, and transfer learning for the high-precision automatic segmentation of hepatic vessels and liver tumors from CT images.
This methodology seeks to improve and expedite transplantation, surgical procedures, radiotherapy, thermotherapy planning, and the monitoring of tumor responses.
By combining the strengths of each CNN sub-model, our proposed model effectively learned edge information and extracted true tumor cells while eliminating false positives through voting. This led to significant improvements in vessels and liver tumor segmentation accuracy. Additionally, leveraging deep transfer learning enabled rapid model convergence and reduced training time by bypassing complex parameter tuning and lengthy validation processes.
The methodology employed 2D networks with dense connections, promoting feature map reuse and enhancing tumor edge feature extraction. The results show that stacking models outperformed individual sub-networks in terms of accuracy, with the combined model better capturing tumor edges. In contrast, individual sub-networks exhibited limitations in edge detection. 3D networks were avoided due to their computational intensity and propensity for false positives, instead leveraging the strengths of 2D networks for more precise tumor segmentation.
The proposed model demonstrated a strong performance in test processing, achieving a DSC of 83.21 and an IoU of 72.76 for vessel and tumor liver segmentation.
With its strong performance, our method is well-suited to bridge the clinical validation gap, a challenge many AI-based methods face due to insufficient accuracy. Our results suggest a promising path forward for clinical integration.
Compared to recent works, our model shows substantial improvements. For instance, Lim et al. [2] (2025), achieved DSC = 75.4% with TransRAUNet, while Svobodova et al. [5] (2023) reported DSC = 72.3% using 3D V-Net. Our method outperformed these with DSC = 83.21%, demonstrating a better balance between precision and generalization. Furthermore, unlike transformer-based methods that require high computational resources, our 2D stacking approach remains computationally efficient. Nevertheless, our internal dataset is limited to a single center, which may affect generalizability. Multi-institution validation will be an important direction for future work.
Our results demonstrate that the fusion model outperformed each individual model, achieving an average improvement of 18% in Dice coefficients (DSC). Notably, our model surpassed U-Net by 22%, VGG16U-Net by 21%, VGG19U-Net by 20%, ResU-Net by 15%, and MobileNetV2U-Net by 13%. Furthermore, when compared to three other reference methods published in [45,46,48], our model showed a 15% improvement in DSC on an external test set of 20 patient CT images from the 3DIRCADb dataset.
This study contributes to the growing body of research on deep learning for liver cancer analysis, with a distinct approach and high accuracy. Nevertheless, the single-region focus may introduce biases. Expanding multi-source data could enhance the model’s applicability and fairness across diverse populations.

5. Conclusions

This study introduces an automated method for liver vessels and liver tumor segmentation, combining precision and stability to bridge the clinical gap. Through meticulous dataset annotation, a stacking model with a precision fusion method, deep transfer learning, and a stacking model, high segmentation accuracy was achieved. These results promise to improve clinical workflows, including surgery, radiotherapy, and treatment monitoring.

Author Contributions

Conceptualization: A.B. (Amine Benkabbou), M.Q., and A.C.; methodology, A.B. (Amine Benkabbou), M.Q., and A.C.; software, A.B. (Anass Benfares), M.O., and A.C.; validation: A.B. (Amine Benkabbou), M.Q., M.A.E.A.E.H., A.B. (Amine Benkabbou), A.S., A.M., Z.E.M., O.L., and R.M.; formal analysis, A.B. (Amine Benkabbou), M.Q., M.O., and A.L.; investigation, A.B. (Amine Benkabbou) and M.Q.; writing—review and editing: M.Q., M.O., A.L., A.C., and A.S.; supervision: A.B. (Amine Benkabbou), A.S., and A.C. All authors have read and agreed to the published version of the manuscript.

Funding

This research received no external funding.

Informed Consent Statement

Informed consent was obtained from all subjects involved in the study.

Data Availability Statement

The data of this study are available on request from the corresponding author.

Acknowledgments

The authors thank all the members of the National Institute of Oncology (INO) in Rabat who participated directly or indirectly in the collection of patient data used in this study and all individuals included in this section have consented to the acknowledgement.

Conflicts of Interest

All individuals included in this section declare no conflicts of interest.

Abbreviations

The following abbreviations are used in this manuscript:
CTComputed Tomography
DSCDice Similarity Coefficient
JCJaccard Coefficient
IoUIntersection and Union
INONational Institute of Oncology
MSDMedical Segmentation Decathlon
CNNConvolutional Neural Network

References

  1. Chi, Y.; Liu, J.; Venkatesh, S.K.; Huang, S.; Zhou, J.; Tian, Q.; Nowinski, W.L. Segmentation of liver vasculature from contrast enhanced CT images using context-based voting. IEEE Trans. Biomed. Eng. 2011, 58, 2144–2153. [Google Scholar]
  2. Lim, K.Y.; Ko, J.E.; Hwang, Y.N.; Lee, S.G.; Kim, S.M. TransRAUNet: A Deep Neural Network with Reverse Attention Module Using HU Windowing Augmentation for Robust Liver Vessel Segmentation in Full Resolution of CT Images. Diagnostics 2025, 15, 118. [Google Scholar] [CrossRef] [PubMed]
  3. Awais, M.; Al Taie, M.; O’Connor, C.S.; Castelo, A.H.; Acidi, B.; Tran Cao, H.S.; Brock, K.K. Enhancing Surgical Guidance: Deep Learning-Based Liver Vessel Segmentation in Real-Time Ultrasound Video Frames. Cancers 2024, 16, 3674. [Google Scholar] [CrossRef]
  4. Katagiri, H.; Nitta, H.; Kanno, S.; Umemura, A.; Takeda, D.; Ando, T.; Amano, S.; Sasaki, A. Safety and Feasibility of Laparoscopic Parenchymal-Sparing Hepatectomy for Lesions with Proximity to Major Vessels in Posterosuperior Liver Segments 7 and 8. Cancers 2023, 15, 2078. [Google Scholar] [CrossRef]
  5. Svobodova, P.; Sethia, K.; Strakos, P.; Varysova, A. Automatic Hepatic Vessels Segmentation Using RORPO Vessel Enhancement Filter and 3D V-Net with Variant Dice Loss Function. Appl. Sci. 2023, 13, 548. [Google Scholar] [CrossRef]
  6. Brunese, M.C.; Rocca, A.; Santone, A.; Cesarelli, M.; Brunese, L.; Mercaldo, F. Explainable and Robust Deep Learning for Liver Segmentation Through U-Net Network. Diagnostics 2025, 15, 878. [Google Scholar] [CrossRef]
  7. Prencipe, B.; Altini, N.; Cascarano, G.D.; Brunetti, A.; Guerriero, A.; Bevilacqua, V. Focal Dice Loss-Based V-Net for Liver Segments Classification. Appl. Sci. 2022, 12, 3247. [Google Scholar] [CrossRef]
  8. Deshpande, R.R.; Heaton, N.D.; Rela, M. Surgical anatomy of segmental liver transplantation. Br. J. Surg. 2002, 89, 1078–1088. [Google Scholar] [CrossRef]
  9. Montgomery, A.E.; Rana, A. Current state of artificial intelligence in liver transplantation. Transplant. Rep. 2025, 10, 100173. [Google Scholar] [CrossRef]
  10. Zimmermann, C.; Michelmann, A.; Daniel, Y.; Enderle, M.D.; Salkic, N.; Linzenbold, W. Application of Deep Learning for Real-Time Ablation Zone Measurement in Ultrasound Imaging. Cancers 2024, 16, 1700. [Google Scholar] [CrossRef]
  11. Ahn, J.C.; Qureshi, T.A.; Singal, A.G.; Li, D.; Yang, J.D. Deep learning in hepatocellular carcinoma: Current status and future perspectives. World J. Hepatol. 2021, 13, 2039–2051. [Google Scholar] [CrossRef] [PubMed] [PubMed Central]
  12. Aravazhi, P.S.; Gunasekaran, P.; Benjamin, N.Z.Y.; Thai, A.; Chandrasekar, K.K.; Kolanu, N.D.; Prajjwal, P.; Tekuru, Y.; Brito, L.V.; Inban, P. The integration of artificial intelligence into clinical medicine: Trends, challenges, and future directions. Disease-a-Month 2025, 71, 101882. [Google Scholar] [CrossRef] [PubMed]
  13. Ciecholewski, M.; Kassjański, M. Computational Methods for Liver Vessel Segmentation in Medical Imaging: A Review. Sensors 2021, 21, 2027. [Google Scholar] [CrossRef] [PubMed]
  14. Jenssen, H.B.; Nainamalai, V.; Pelanis, E.; Kumar, R.P.; Abildgaard, A.; Kolrud, F.K.; Edwin, B.; Jiang, J.; Vettukattil, J.; Elle, O.J.; et al. Challenges and artificial intelligence solutions for clinically optimal hepatic venous vessel segmentation. Biomed. Signal Process. Contro. 2025, 106, 107822. [Google Scholar] [CrossRef]
  15. Zhao, Z.; Li, W.; Ding, X.; Sun, J.; Xu, L.X. TTGA U-Net: Two-stage two-stream graph attention U-Net for hepatic vessel connectivity enhancement. Comput. Med Imaging Graph. 2025, 122, 102514. [Google Scholar] [CrossRef]
  16. Affane, A.; Chetoui, M.A.; Lamy, J.; Lienemann, G.; Peron, R.; Beaurepaire, P.; Dollé, G.; Lebre, M.-A.; Magnin, B.; Merveille, O.; et al. The R-Vessel-X Project. IRBM 2025, 46, 100876. [Google Scholar] [CrossRef]
  17. Yang, J.; Fu, M.; Hu, Y. Liver vessel segmentation based on inter-scale V-Net. Math. Biosci. Eng. 2021, 18, 4327–4340. [Google Scholar] [CrossRef]
  18. Alirr, O.I.; Rahni, A.A.A. Hepatic vessels segmentation using deep learning and preprocessing enhancement. J. Appl. Clin. Med Phys. 2023, 24, e13966. [Google Scholar] [CrossRef]
  19. Yu, W.; Fang, B.; Liu, Y.; Gao, M.; Zheng, S.; Wang, Y. Liver vessels segmentation based on 3D Residual U-Net in ICIP. In Proceedings of the 2019 IEEE International Conference on Image Processing (ICIP), Taipei, Taiwan, 22–25 September 2019; IEEE: Piscataway, NJ, USA, 2019. [Google Scholar]
  20. Thomson, B.R.; Nijkamp, J.; Ivashchenko, O.; van der Heijden, F.; Smit, J.N.; Kok, N.F.; Kuhlmann, K.F.D.; Ruers, T.J.M.; Fusaglia, M. Hepatic vessel segmentation using a reduced filter 3D U-Net in Ultrasound imaging in MIDL 2019 Medical Imaging with Deep Learning. arXiv 2019, arXiv:1907.12109. [Google Scholar]
  21. Liu, F.; Zheng, Q.; Tian, X.; Shu, F.; Jiang, W.; Wang, M.; Elhanashi, A.; Saponara, S. Rethinking the multi-scale feature hierarchy in object detection transformer (DETR). Appl. Soft Comput. 2025, 175, 113081. [Google Scholar] [CrossRef]
  22. Zhao, L.; Li, J.; Xu, X.; Zhu, C.; Cheng, W.; Liu, S.; Zhao, M.; Zhang, L.; Zhang, J.; Yin, J.; et al. A Deep Learning-Based Ocular Structure Segmentation for Assisted Myasthenia Gravis Diagnosis from Facial Images. Tsinghua Sci. Technol. 2025, 30, 2592–2605. [Google Scholar] [CrossRef]
  23. Jiang, Z.; Cheng, D.; Qin, Z.; Gao, J.; Lao, Q.; Ismoilovich, A.B.; Gayrat, U.; Elyorbek, Y.; Habibullo, B.; Tang, D.; et al. TV-SAM: Increasing Zero-Shot Segmentation Performance on Multimodal Medical Images Using GPT-4 Generated Descriptive Prompts Without Human Annotation. Big Data Min. Anal. 2024, 7, 1199–1211. [Google Scholar] [CrossRef]
  24. Antonelli, M.; Reinke, A.; Bakas, S.; Farahani, K.; Kopp-Schneider, A.; Landman, B.A.; Litjens, G.; Menze, B.; Ronneberger, O.; Summers, R.M.; et al. The Medical Segmentation Decathlon. Nat. Commun. 2022, 13, 4128. [Google Scholar] [CrossRef]
  25. Roy, S.; Carass, A.; Bazin, P.-L.; Prince, J.L.; Dawant, B.M.; Haynor, D.R. Intensity Inhomogeneity Correction of Magnetic Resonance Images using Patches. In Proceedings of the 2011 SPIE Medical Imaging, Lake Buena Vista, FL, USA, 14–16 February 2011; Volume 7962, p. 79621F. [Google Scholar] [CrossRef] [PubMed] [PubMed Central]
  26. Masoudi, S.; Harmon, S.A.; Mehralivand, S.; Walker, S.M.; Raviprakash, H.; Bagci, U.; Choyke, P.L.; Turkbey, B. Quick guide on radiology image pre-processing for deep learning applications in prostate cancer research. J. Med. Imaging 2021, 8, 010901. [Google Scholar] [CrossRef]
  27. Benfares, A.; Mourabiti, A.Y.; Alami, B.; Boukansa, S.; El Bouardi, N.; Lamrani, M.Y.A.; El Fatimi, H.; Amara, B.; Serraj, M.; Mohammed, S.; et al. Non-invasive, fast, and high-performance EGFR gene mutation prediction method based on deep transfer learning and model stacking for patients with Non-Small Cell Lung Cancer. Eur. J. Radiol. Open 2024, 13, 100601. [Google Scholar] [CrossRef]
  28. Yushkevich, P.A.; Gao, Y.; Gerig, G. ITK-SNAP: An interactive tool for semi-automatic segmentation of multi-modality biomedical images. In Proceedings of the 2016 38th Annual International Conference of the IEEE Engineering in Medicine and Biology Society (EMBC), Orlando, FL, USA, 16–20 August 2016; pp. 3342–3345. [Google Scholar] [CrossRef]
  29. Egger, J.; Kapur, T.; Fedorov, A.; Pieper, S.; Miller, J.V.; Veeraraghavan, H.; Freisleben, B.; Golby, A.J.; Nimsky, C.; Kikinis, R. GBM volumetry using the 3D slicer-medical image computing platform. Sci. Rep. 2013, 3, 1364. [Google Scholar] [CrossRef]
  30. Velazquez, E.R.; Parmar, C.; Jermoumi, M.; Mak, R.H.; van Baardwijk, A.; Fennessy, F.M.; Lewis, J.H.; De Ruysscher, D.; Kikinis, R.; Lambin, P.; et al. Volumetric CT-based segmentation of NSCLC using 3D-Slicer. Sci. Rep. 2013, 3, 3529. [Google Scholar] [CrossRef]
  31. Benfares, A.; Mourabiti, A.y.; Alami, B.; Boukansa, S.; Benomar, I.; El Bouardi, N.; Alaoui Lamrani, M.Y.; El Fatimi, H.; Amara, B.; Serraj, M.; et al. Nomogram Based on the Most Relevant Clinical, CT, and Radiomic Features, and a Machine Learning Model to Predict EGFR Mutation Status in Non-Small Cell Lung Cancer. J. Respir. 2025, 5, 11. [Google Scholar] [CrossRef]
  32. Ronneberger, O.; Fischer, P.; Brox, T. U-Net: Convolutional Networks for Biomedical Image Segmentation. In Proceedings of the International Conference on Medical Image Computing and Computer-Assisted Intervention, Munich, Germany, 5–9 October 2015; pp. 234–241. [Google Scholar]
  33. Yang, L.; Zhang, Z.; Cai, X.; Dai, T. Attention-Based Personalized Encoder-Decoder Model for Local Citation Recommendation. Comput. Intell. Neurosci. 2019, 2019, 1232581. [Google Scholar] [CrossRef]
  34. Simonyan, K.; Zisserman, A. Very Deep Convolutional Networks for Large-Scale Image Recognition. In Proceedings of the 3rd International Conference on Learning Representations (ICLR 2015), San Diego, CA, USA, 7–9 May 2015; Computational and Biological Learning Society: Leesburg, Virginia, 2015; pp. 1–14. [Google Scholar]
  35. Sandler, M.; Howard, A.; Zhu, M.; Zhmoginov, A.; Chen, L.-C. MobileNetV2: Inverted Residuals and Linear Bottlenecks. In Proceedings of the 2018 IEEE/CVF Conference on Computer Vision and Pattern Recognition, Salt Lake City, UT, USA, 18–23 June 2018; pp. 4510–4520. [Google Scholar]
  36. Mangai, U.; Samanta, S.; Das, S.; Chowdhury, P.; Ug, M. A survey of decision fusion and feature fusion strategies for pattern classification. IETE Tech. Rev. 2010, 27, 293–307. [Google Scholar] [CrossRef]
  37. Giannakakis, G.; Pediaditis, M.; Manousos, D.; Kazantzaki, E.; Chiarugi, F.; Simos, P.; Marias, K.; Tsiknakis, M. Stress and anxiety detection using facial cues from videos. Biomed. Signal Process. Control 2017, 31, 89–101. [Google Scholar] [CrossRef]
  38. Zhou, H.; Geng, Z.; Sun, M.; Wu, L.; Yan, H. Context-Guided SAR Ship Detection with Prototype-Based Model Pretraining and Check–Balance-Based Decision Fusion. Sensor 2025, 25, 4938. [Google Scholar] [CrossRef] [PubMed]
  39. Zhang, Z.; Liu, Q.; Wang, Y. Road Extraction by Deep Residual U-Net. IEEE Geosci. Remote Sens. Lett. 2017, 15, 749–753. [Google Scholar] [CrossRef]
  40. Kittler, J.; Hatef, M.; Duin, R.P.; Matas, J. On combining classifiers. IEEE Trans. Pattern Anal. Mach. Intell. 1998, 20, 226–239. [Google Scholar] [CrossRef]
  41. Yang, J.; Lu, Y.; Zhang, Z.; Wei, J.; Shang, J.; Wei, C.; Tang, W.; Chen, J. A Deep Learning Method Coupling a Channel Attention Mechanism and Weighted Dice Loss Function for Water Extraction in the Yellow River Basin. Water 2025, 17, 478. [Google Scholar] [CrossRef]
  42. Ibragimov, B.; Toesca, D.; Chang, D.; Koong, A.; Xing, L. Combining deep learning with anatomical analysis for segmentation of the portal vein for liver SBRT planning. Phys. Med. Biol. 2017, 62, 8943. [Google Scholar] [CrossRef]
  43. Zhang, R.; Zhou, Z.; Wu, W.; Lin, C.C.; Tsui, P.H.; Wu, S. An improved fuzzy connectedness method for automatic three-dimensional liver vessel segmentation in CT images. J. Healthc. Eng. 2018, 2018, 2376317. [Google Scholar] [CrossRef]
  44. Huang, Q.; Sun, J.; Ding, H.; Wang, X.; Wang, G. Robust liver vessel extraction using 3D U-Net with variant dice loss function. Comput. Biol. Med. 2018, 101, 153–162. [Google Scholar] [CrossRef]
  45. Thomson, B.R.; Smit, J.N.; Ivashchenko, O.V.; Kok, N.F.; Kuhlmann, K.F.; Ruers, T.J.; Fusaglia, M. MR-to-US Registration Using Multiclass Segmentation of Hepatic Vasculature with a Reduced 3D U-Net. In Proceedings of the International Conference on Medical Image Computing and Computer-Assisted Intervention, Lima, Peru, 4–8 October 2020; pp. 275–284. [Google Scholar]
  46. Yan, Q.; Wang, B.; Zhang, W.; Luo, C.; Xu, W.; Xu, Z.; Zhang, Y.; Shi, Q.; Zhang, L.; You, Z. An Attention-guided Deep Neural Network with Multi-scale Feature Fusion for Liver Vessel Segmentation. IEEE J. Biomed. Health Inf. 2020, 25, 2629–2642. [Google Scholar] [CrossRef]
  47. Xu, M.; Wang, Y.; Chi, Y.; Hua, X. Training liver vessel segmentation deep neural networks on noisy labels from contrast CT imaging. In Proceedings of the 2020 IEEE 17th International Symposium on Biomedical Imaging (ISBI), Iowa City, IA, USA, 3–7 April 2020; pp. 1552–1555. [Google Scholar]
  48. Su, J.; Liu, Z.; Zhang, J.; Sheng, V.S.; Song, Y.; Zhu, Y.; Liu, Y. DV-Net: Accurate liver vessel segmentation via dense connection model with D-BCE loss function. Knowl.-Based Syst. 2021, 232, 107471. [Google Scholar] [CrossRef]
  49. Soler, L.; Hostettler, A.; Agnus, V.; Charnoz, A.; Fasquel, J.; Moreau, J.; Osswald, A.; Bouhadjar, M.; Marescaux, J. 3D Image Reconstruction for Comparison of Algorithm Database: A Patient Specific Anatomical and Medical Image Database. 2010. Available online: https://www-sop.inria.fr/geometrica/events/wam/abstract-ircad.pdf (accessed on 20 October 2024).
Figure 1. Example of a CT scan slice with the corresponding original mask extracted from MSD dataset: (ac) CT scan slice and (df) corresponding mask, respectively.
Biomedinformatics 05 00053 g001
Figure 2. Patient selection criteria for this study.
Biomedinformatics 05 00053 g002
Figure 3. Patient 3’s CT image from our internal dataset alongside its corresponding ground truth mask: (a,c) represent slices of the CT image, while (b,d) depict the corresponding 3D ground truth mask.
Biomedinformatics 05 00053 g003
Figure 4. Majority voting decision fusion stacking model utilizing five CNNs.
Biomedinformatics 05 00053 g004
Figure 5. Weighted decision fusion workflow.
Biomedinformatics 05 00053 g005
Figure 6. Proposed workflow for the deep transfer learning stacking model with fusion decision.
Biomedinformatics 05 00053 g006
Figure 7. U-Net architecture.
Biomedinformatics 05 00053 g007
Figure 8. VGGU-Net architecture: The encoder path is replaced with pretrained VGG16/19 convolutional blocks (highlighted in blue), while the decoder follows the U-Net structure.
Biomedinformatics 05 00053 g008
Figure 9. ResU-Net architecture: Residual blocks and transfer paths are highlighted in red to emphasize residual learning integrated into the U-Net framework.
Biomedinformatics 05 00053 g009
Figure 10. MobileNetV2-U-Net architecture. The encoder is constructed using MobileNetV2 depthwise separable convolutional layers (highlighted in green), connected to a U-Net decoder.
Biomedinformatics 05 00053 g010
Figure 11. Performance metrics of the MobileNetV2U-Net network with five-fold cross-validation: (a) and (c) display the Dice coefficient and loss function during training, while (b) and (d) show the corresponding metrics during validation. Dice coefficient and Loss function with five-fold cross-validation of the MobileNetV2U-Net network: (a) and (c) during the training process and (b) and (d) during the validation process.
Biomedinformatics 05 00053 g011
Figure 12. Visual comparison of liver vessel and tumor segmentation results on the internal dataset, emphasizing the performance of various models: (a) Input image, (b) ground truth mask, and segmentation results from (c) ResNet-U-Net, (d) VGG16U-Net, (e) VGG19U-Net, (f) MobileNetV2U-Net, (g) U-Net, and (h) the proposed model.
Biomedinformatics 05 00053 g012
Figure 13. Visual comparison of the results of superimposing the original mask and the mask predicted by our model onto four original CT image slices extracted from the public MSD Task 08 database.
Biomedinformatics 05 00053 g013aBiomedinformatics 05 00053 g013b
Table 1. Weighted stacking with decision fusion for hepatic vessel & tumor segmentation.
StepDescription
InputsTraining dataset 𝒟train = {( X i , Y i )}
Base learners = {U-Net, VGG16U-Net, VGG19U-Net, ResU-Net, MobileNetV2U-Net}
Classes = {background, vessel, tumor}
1. PreprocessingConvert CT (DICOM) → Hounsfield Units
Normalize intensities, inhomogeneity correction
Alignment (Elastix), resize to 226 × 226
z-score normalization, optional CLAHE
2. Cross-Validated Training (K = 5)For each model m:
  • Initialize encoder (ImageNet), decoder random
  • Data augmentation (rotation, zoom, shift, flip)
  • Train with Adam (LR = 0.001, Reduce-on-Plateau)
  • Loss = Dice + Cross-Entropy, dropout = 0.5, BN
  • Early stopping (patience = 10 epochs)
  • Record Dice score for each fold → DICEr
3. Weight EstimationCompute weights: w m = D I C E m + ϵ j = 1 M D I C E j + ϵ with ϵ = 10 6
Ensure m = 1 M w m = 1   and   w m 0 .
4. Inference (Per New CT)Preprocess input (Step 1) Run each model m → probability map P m ( x , c )
5. Weighted FusionFor each pixel x and class c: P f u s e x , c = m = 1 M w m P m ( x , c )
Final label: Y p r e d x = a r g m a x c C P f u s e ( c , x )
6. Postprocessing3D connected-component filtering (min size) Morphological closing of vessel gaps Topology-aware pruning to preserve thin vessels
Table 2. Training hyperparameters used in this study.
ParameterValue/StrategyRationale
OptimizerAdamWidely used for medical image segmentation; balances convergence and stability
Initial Learning Rate0.001Standard starting point for fine-tuning CNNs
Learning Rate ScheduleReduce by factor of 0.1 after 5 epochs without improvementPrevents stagnation and supports stable convergence
Batch Size8Compromise between GPU memory (4× GTX 1080 Ti) and stable gradients
Dropout Rate0.5 (decoder layers)Prevents overfitting and improve generalization
NormalizationBatch normalization (all conv. blocks)Stabilizes training and accelerates convergence
Early StoppingPatience of 10 epochsPrevents overfitting and unnecessary computation
Epochs (Maximum)200Ensures convergence with safeguard by early stopping
Loss FunctionDice + cross-entropy (Equations (6)–(8))Balances overlap accuracy (Dice) and voxel-wise classification (CE)
Data AugmentationRandom rotation, zoom, translation, flippingImproves robustness to acquisition variability
Table 3. Assessment of liver segmentation performance for vessels and tumors using five-fold cross-validation.
ModelVessel and Tumor Liver Segmentation
DSC   [ % ]   ± S D IoU   [ % ]   ± S D
U-Net65.82 ± 0.0849.05 ± 0.09
VGG16U-Net66.66 ± 0.0450.00 ± 0.05
VGG19U-Net67.53 ± 0.0350.98 ± 0.03
ResU-Net71.58 ± 0.0755.73 ± 0.08
MobileNetV2U-Net73.64 ± 0.0358.28 ± 0.04
Proposed Model84.67 ± 0.0573.41 ± 0.07
Table 4. Average segmentation performance metrics for liver vessel and tumor segmentation during the test process.
ModelVessel and Tumor Liver Segmentation
DSC   [ % ]   ± S D IoU   [ % ]   ± S D
U-Net60.87 ± 0.0743.74 ± 0.07
VGG16U-Net61.95 ± 0.0264.38 ± 0.09
VGG19U-Net65.72 ± 0.0444.87 ± 0.02
ResU-Net69.85 ± 0.0653.68 ± 0.07
MobileNetV2U-Net71.91 ± 0.0456.14 ± 0.05
Proposed Model83.21 ± 0.0372.76 ± 0.04
Table 5. Hepatic vessels and tumor segmentation dice score comparison: our model versus previous studies.
AuthorDSC (%)
Ibragimov et al. [42]83.01
Zhang et al. [43]67.12
Huang et al. [44]75.45
Thomson et al. [45]66.25
Yan et al. [46]80.19
Xu et al. [47]68.08
Yu et al. 2019 [19]74.56
Best DSC in DSM Decathlon [24]71.42
V-net (Su et al.) [48]75.46
Proposed Model83.21
Table 6. Hepatic vessel segmentation performance comparison: our model and previous studies on a 20-image subset of 3DIRCADb.
AuthorDSC (%)
Zhang et al. [43]67.12
Huang et al. [44]75.45
Xu et al. [47]68.08
Proposed Model82.81
Disclaimer/Publisher’s Note: The statements, opinions and data contained in all publications are solely those of the individual author(s) and contributor(s) and not of MDPI and/or the editor(s). MDPI and/or the editor(s) disclaim responsibility for any injury to people or property resulting from any ideas, methods, instructions or products referred to in the content.