Article

Supervised Machine Learning for PICU Outcome Prediction: A Comparative Analysis Using the TOPICC Study Dataset

1
Division of Pediatric Cardiac Critical Care, West Viginia University Children’s, Morgantown, WV 26506, USA
2
Division of Pediatric Critical Care, Cleveland Clinic Children’s, Cleveland, OH 44195, USA
*
Author to whom correspondence should be addressed.
BioMedInformatics 2025, 5(3), 52; https://doi.org/10.3390/biomedinformatics5030052 (registering DOI)
Submission received: 26 July 2025 / Revised: 20 August 2025 / Accepted: 2 September 2025 / Published: 5 September 2025

Abstract

Background: Pediatric Intensive Care Unit (PICU) outcome prediction is challenging, and machine learning (ML) can enhance it by leveraging large datasets. Methods: We built an ML model to predict PICU outcomes (“Death vs. Survival”, “Death or Morbidity vs. Survival without morbidity”, and “New Morbidity vs. Survival without new morbidity”) using the Trichotomous Outcome Prediction in Critical Care (TOPICC) study dataset. The model used the Light Gradient-Boosting Machine (LightGBM) algorithm, which was trained on 85% of the dataset and tested on 15% utilizing 10-fold cross validation. Results: The model demonstrated high accuracy across all dichotomies, with 0.98 for “Death vs. Survival”, 0.92 for “Death or New Morbidity vs. Survival without New Morbidity”, and 0.93 for “New Morbidity vs. Survival without New Morbidity.” The AUC-ROC values were also strong, at 0.89, 0.79, and 0.74, respectively. The precision was highest for “Death vs. Survival” (0.92), followed by 0.45 and 0.30 for the other dichotomies. The recalls were low, at 0.26, 0.31, and 0.34, reflecting the model’s difficulty in identifying all positive cases. The AUC-PR values (0.43, 0.37, and 0.20) highlight this trade-off. Conclusions: The LightGBM model demonstrated a predictive performance comparable to previously reported logistic regression models in predicting PICU outcomes. Future work should focus on enhancing the model’s performance and further validation across larger datasets to assess the model’s generalizability and real-world applicability.

1. Introduction

Mortality and functional assessment are some of the major outcomes in the Pediatric Intensive Care Unit (PICU), as they are associated with the quality of life post discharge. The accurate prediction of PICU outcomes is inherently difficult because the target events are infrequent (mortality ~2–4%) [1,2] and the Functional Status Score (FSS)-defined new morbidity ~5% [3] reported in large multicenter cohorts creates a pronounced class imbalance that biases models toward the majority class and reduces the detection of true positives. The Pediatric Risk of Mortality (PRISM) III score [4] is one of the most used in predicting PICU mortality. This score does not provide full insight into the evolving risk of mortality in the long term, but it can provide valuable early insight into the patient’s condition peri-admission through looking into physiological parameters and laboratory values.
PRISM is one of the most commonly used scores for predicting PICU mortality. Identifying and classifying patients into risk categories allows intensivists to allocate resources to high-risk patients for better outcomes [5]. Studies have shown that PRISM III is an excellent tool for predicting mortality [6], which was a factor in our choice of the TOPICC study dataset for building our model and using the TOPICC study model to compare ourselves to.
In the PICU, there are vast amounts of information generated every day, and those data could be leveraged in conjunction with machine learning (ML) to improve predictions of important outcomes in the PICU such as mortality and the development of new morbidity.
Conventional statistical methods, especially logistic regression, have been the standard method for building prediction models. However, the literature comparing traditional logistic regression to ML has shown that ML can have better accuracy across a wide range of subject areas [7,8]. For example, some studies that used ML algorithms, such as Random Forests and neural networks, have been able to predict clinical deterioration and escalation of care, death, or acute kidney injury in hospitalized patients with a higher accuracy than traditional logistic regression [9,10].
The rapid development of ML, coupled with the richness of data from extensive patient monitoring in the Intensive Care Unit (ICU), provides unprecedented opportunities for the development of new prediction scores in the field of critical care [11,12].
We selected the Light Gradient-Boosting Machine (LightGBM) algorithm, a gradient-boosted decision tree algorithm designed for tabular data, because it efficiently models nonlinearities and feature interactions, handles missing data, and is well suited to class-imbalanced problems via class weighting. Its computational efficiency facilitates robust cross-validation and its tree-based structure integrates naturally with SHAP for model explanation which is important for clinical interpretability [13].
The aim of this study is to compare ML models to conventional statistical methods in predicting PICU outcomes including mortality and functional status. We hypothesized that a LightGBM-based supervised ML model trained on PRISM variables would achieve a comparable or superior performance to traditional risk stratification tools in predicting PICU outcomes.

2. Materials and Methods

2.1. Study Design and Dataset

This study was a retrospective observational study. Data was obtained from the National Institute of Health Eunice Kennedy Shriver National Institute of Child Health and Human Development (NICHD) data and specimen hub (DASH) in the form of CSV file. The dataset included patients that were enrolled in the Trichotomous Outcome Prediction in Critical Care (TOPICC) study, which was performed in the Collaborative Pediatric Critical Care Research Network (CPCCRN), CPCCRN Protocol Number 034.
This study was deemed IRB-exempt by the Cleveland Clinic Foundation, as it did not meet the criteria requiring formal review.

2.2. Patient Population

The subjects included in this study met the following inclusion criteria: age from birth to under 18 years of age who are admitted to general/medical and cardiac/cardiovascular PICUs. Exclusion criteria specified that patients were not eligible if their vital signs were incompatible with life for at least the first two hours after admission or they had been previously admitted to the PICU during the same hospitalization; only the first PICU admission during a single hospitalization was included in the study, although patients could be re-enrolled if admitted during separate hospitalizations. The study timeline was between 4 December 2011 and 7 April 2013, with a total of 10,078 patients enrolled. Patients were enrolled from seven hospitals: University of Virginia Children’s Hospital (Charlottesville, VA, USA), University of Utah School of Medicine (Salt Lake City, UT, USA), Children’s Hospital of Michigan (Detroit, MI, USA), Children’s Hospital Los Angeles (Los Angeles, CA, USA), Arkansas Children’s Hospital (Little Rock, AR, USA), Children’s National Medical Center (Charlottesville, VA, USA), and Seattle Children’s Hospital (Seattle, WA, USA).

2.3. Model Variables

The ML model’s input variables were the PRISM III score components including heart rate (HR), systolic blood pressure (SBP), temperature, pupillary reactivity, mental status, arterial PaO2, pH, PaCO2, bicarbonate, glucose, potassium, blood urea nitrogen (BUN), creatinine, white blood cell count, platelet count, prothrombin time (PT), and partial thromboplastin time (PTT). Those variables were collected within the interval from two hours prior to four hours post admission for laboratory data and within the first four hours for other variables.
The outcome variables were mortality, new morbidity, survival without morbidity, and survival without new morbidity. Morbidity was assessed using the Functional Status Scale (FSS), a reliable and age-independent assessment developed by the CPCCRN project for large pediatric outcome studies [14]. The FSS assesses six domains, mental status, sensory, communication, motor function, feeding, and respiratory function, scoring from 1 (normal) to 5 (severe dysfunction). Baseline FSS scores were categorized as 6–7 (good), 8–9 (mildly abnormal), 10–15 (moderately abnormal), 16–21 (severely abnormal), and greater than 21 (very severely abnormal). A significant new morbidity was defined by an increase of three or more points in the FSS from baseline to discharge.

2.4. Data Preprocessing and Feature Engineering

Since LightGBM can handle missing values, no imputations were performed for missing data. Utilizing the Label Encoder functionality from the “sklearn.preprocessing” toolkit within the “scikit-learn” library, we transformed categorical data into numerical labels to enable the algorithms to process categorical data efficiently. No new features were engineered as input variables for the models.
Jupyter Notebook version 7.0.8 was utilized as our computational environment for data analysis and modeling and Pandas version 2.2.2 for data handling and preprocessing.

2.5. ML Model Building

The ML model’s algorithm was LightGBM, a gradient-boosting framework that uses tree-based learning algorithms which are capable of handling large-scale binary data with high efficiency and accuracy. The goal was to train our ML model to predict 3 binary outcomes: “Death vs. Survival”, “Death or Morbidity vs. Survival without morbidity”, and “New Morbidity vs. Survival without new morbidity”.
The ML model was trained on 85% of the dataset and tested on 15% of the dataset utilizing 10-fold cross validation, a robust method that provides insights into model stability by partitioning data into 10 subsets. The LightGBM model was fine-tuned by experimenting with iterations of various parameters to optimize the model performance and obtaining better results, as well as preventing overfitting.

2.6. ML Model’s Predictive Performance Evaluation and Feature Importance Analysis

The ML model’s predictive performance was evaluated according to accuracy, area under the receiver operating characteristic curve (AUC-ROC), precision (positive predictive value, PPV), recall (sensitivity), and F1 score (harmonic mean of precision and recall), each providing different insights into the model’s classification performance. We also used the area under the precision–recall curve (AUC-PR) and the Brier score, which are particularly informative for binary classification with imbalanced datasets to assess the reliability and calibration of probabilistic predictions. To further quantify robustness, we calculated 95% confidence intervals (CIs) for each metric via bootstrap resampling over 1000 samples, which allowed us to assess the reliability of performance estimates.
For a better understanding of the results, input variable importance was evaluated using the SHapley Additive exPlanations (SHAP) method [15], allowing us to break down how individual features influenced each predicted outcome. A SHAP summary plot was created to demonstrate the influence of each feature across all test samples, highlighting the features with the highest prediction probability for each of the outcomes predicted.

2.7. Statistical Analysis

Descriptive statistics were used to summarize patient characteristics and model input variables. Continuous variables were reported as means (±standard deviation) or medians (interquartile range, IQR), depending on the data distribution. Categorical variables were expressed as percentages.

3. Results

3.1. Patient Characteristics

The data from the 10,078 patients from the TOPICC study analyzed and patients’ characteristics are outlined in Supplementary Table S1.

3.2. ML Model’s Predictive Performance and SHAP Analysis

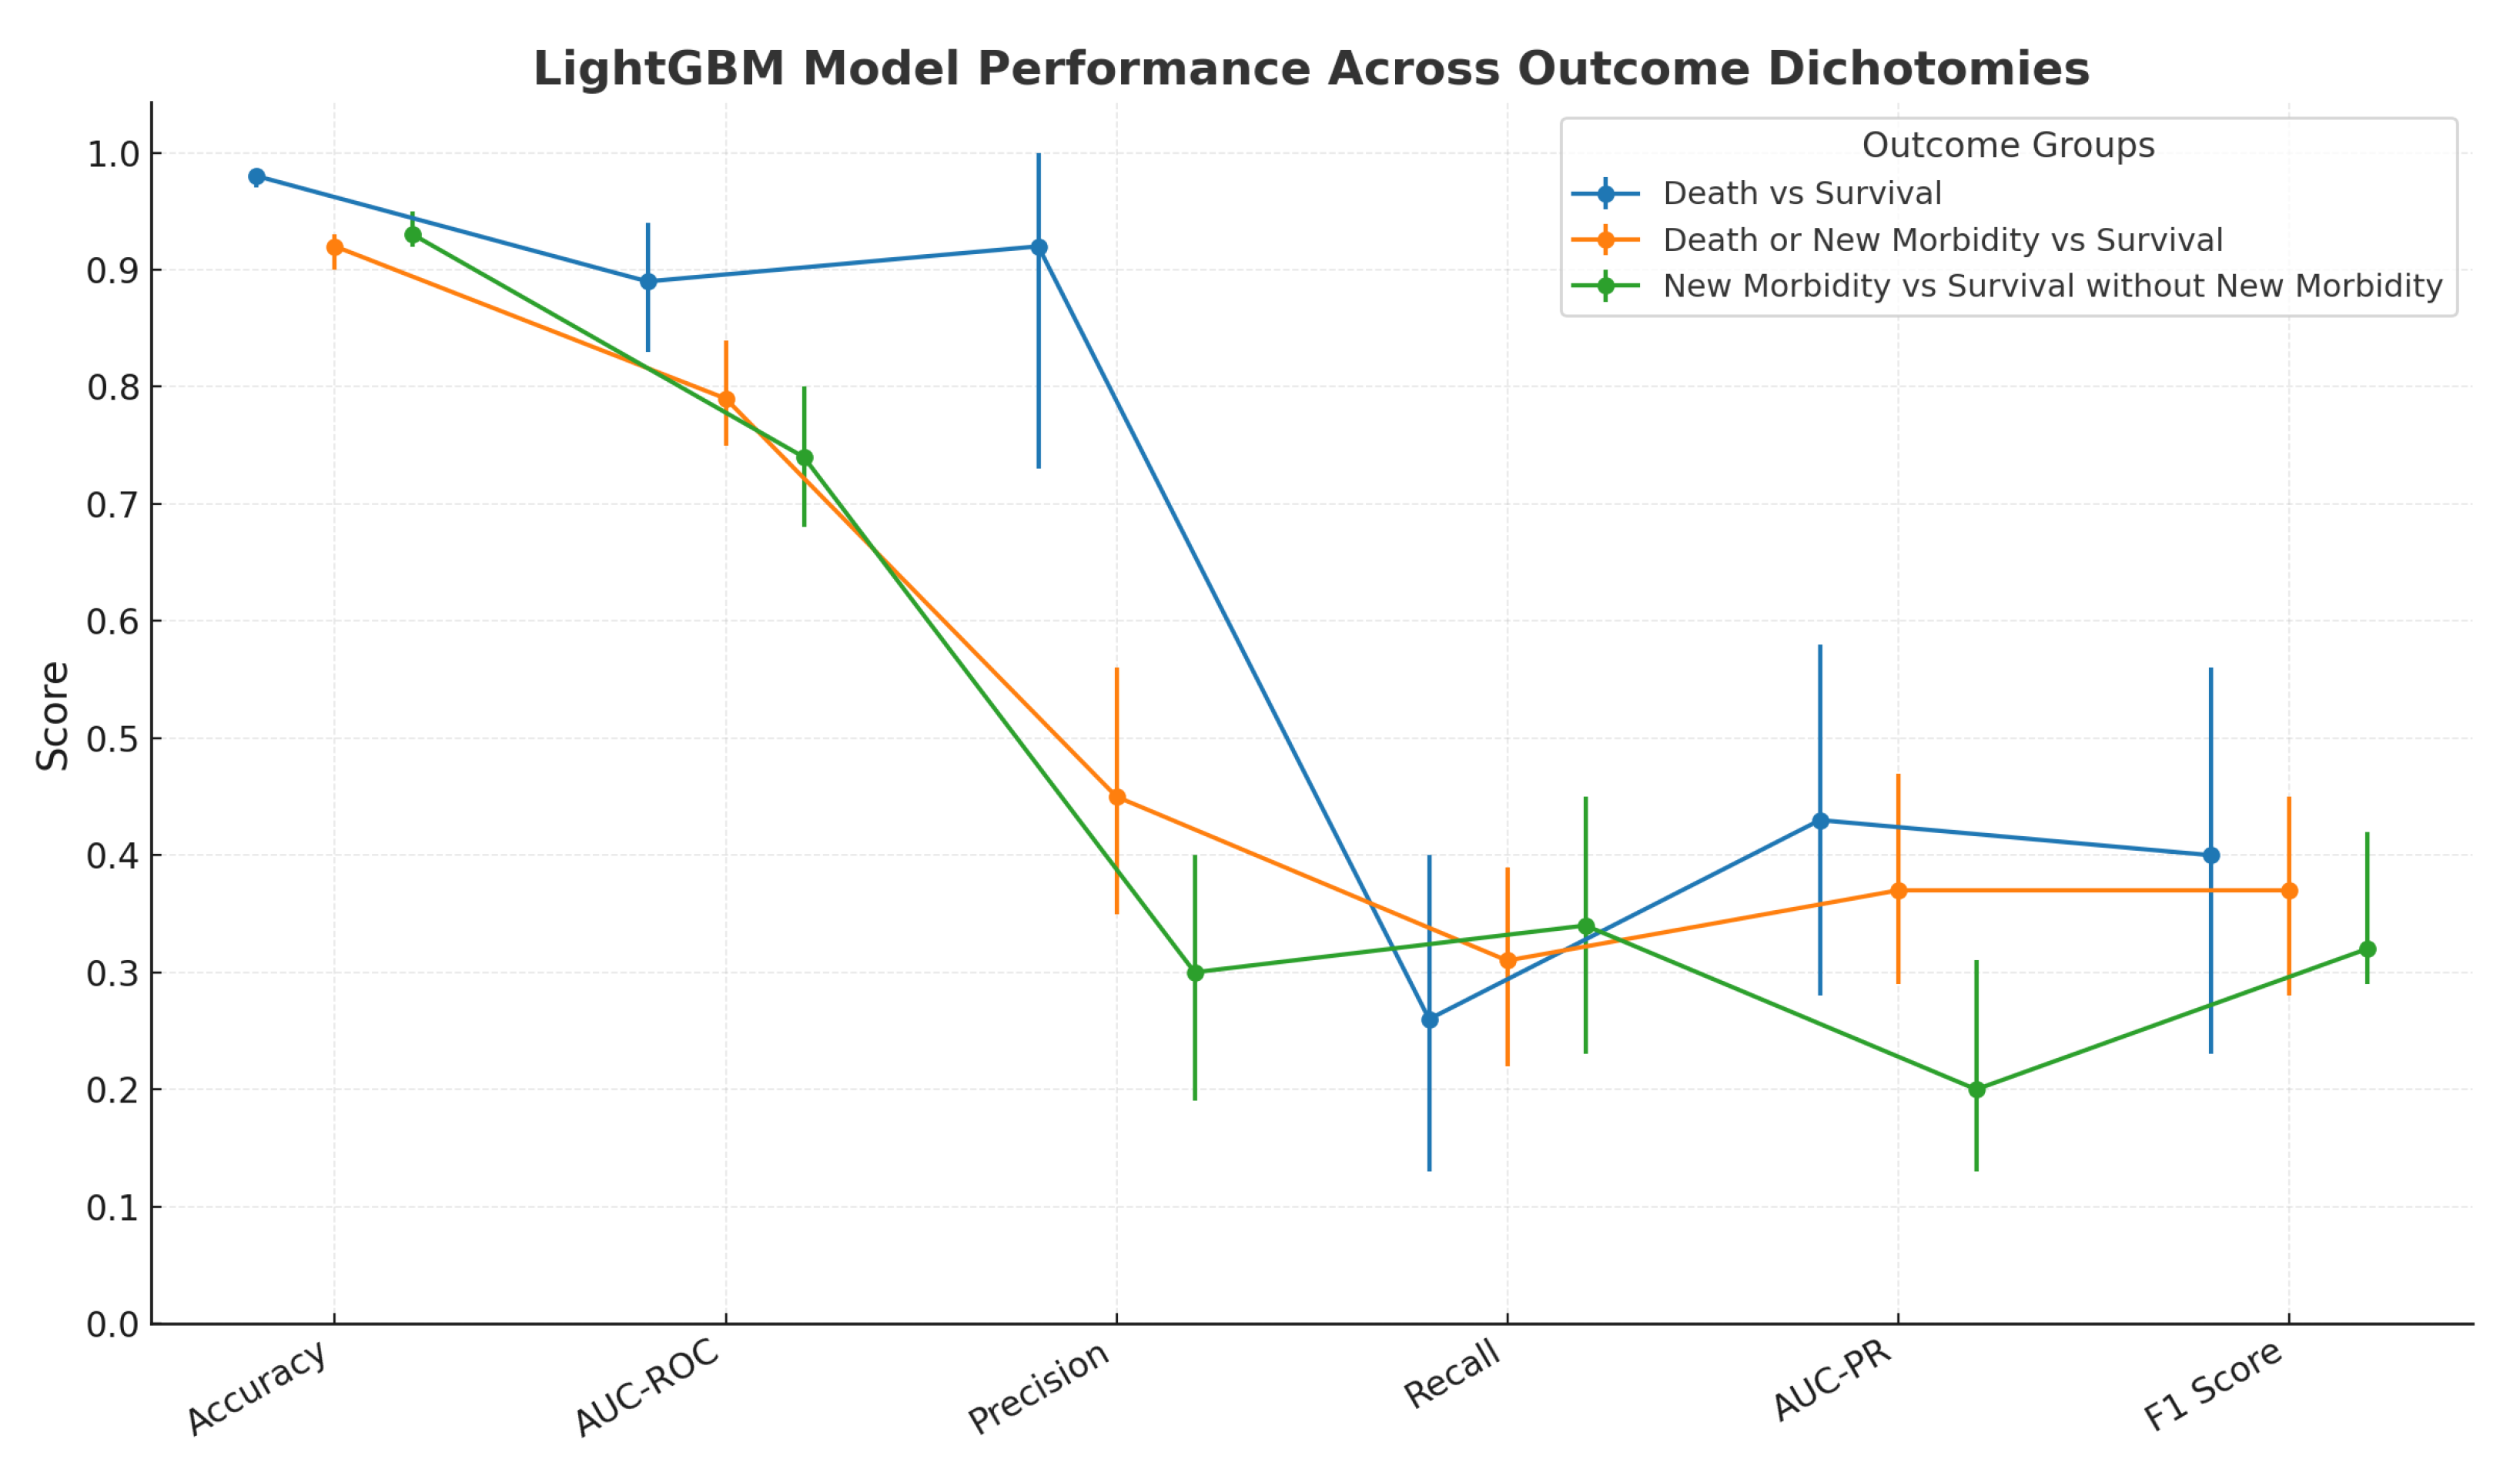
For the “Death vs. Survival” dichotomy, the ML model achieved an accuracy of 0.98 (95% Confidence Interval (CI): 0.97, 0.98), AUC-ROC of 0.89(95% CI: 0.83, 0.94), precision of 0.92 (95% CI: 0.73, 1.00), recall of 0.26 (95% CI: 0.13, 0.40), AUC-PR of 0.43 (95% CI: 0.28, 0.58), F1 score of 0.4 (95% CI: 0.23, 0.56), and Brier score of 0.02 (95% CI: 0.014, 0.028). For a comprehensive overview of the distribution of features, we created summary tables representing each of the mean (Supplementary Table S2), median with IQR (Supplementary Table S3), and value ranges (Supplementary Table S4).
The SHAP summary plot of the “Death vs. Survival” dichotomy (Figure 1) illustrates the weight of each feature in the ML model’s predictions, with LowHeartRate, HighBUN, Low sBP, and LowPlatelets being the topmost important features from the highest to lowest in rank.
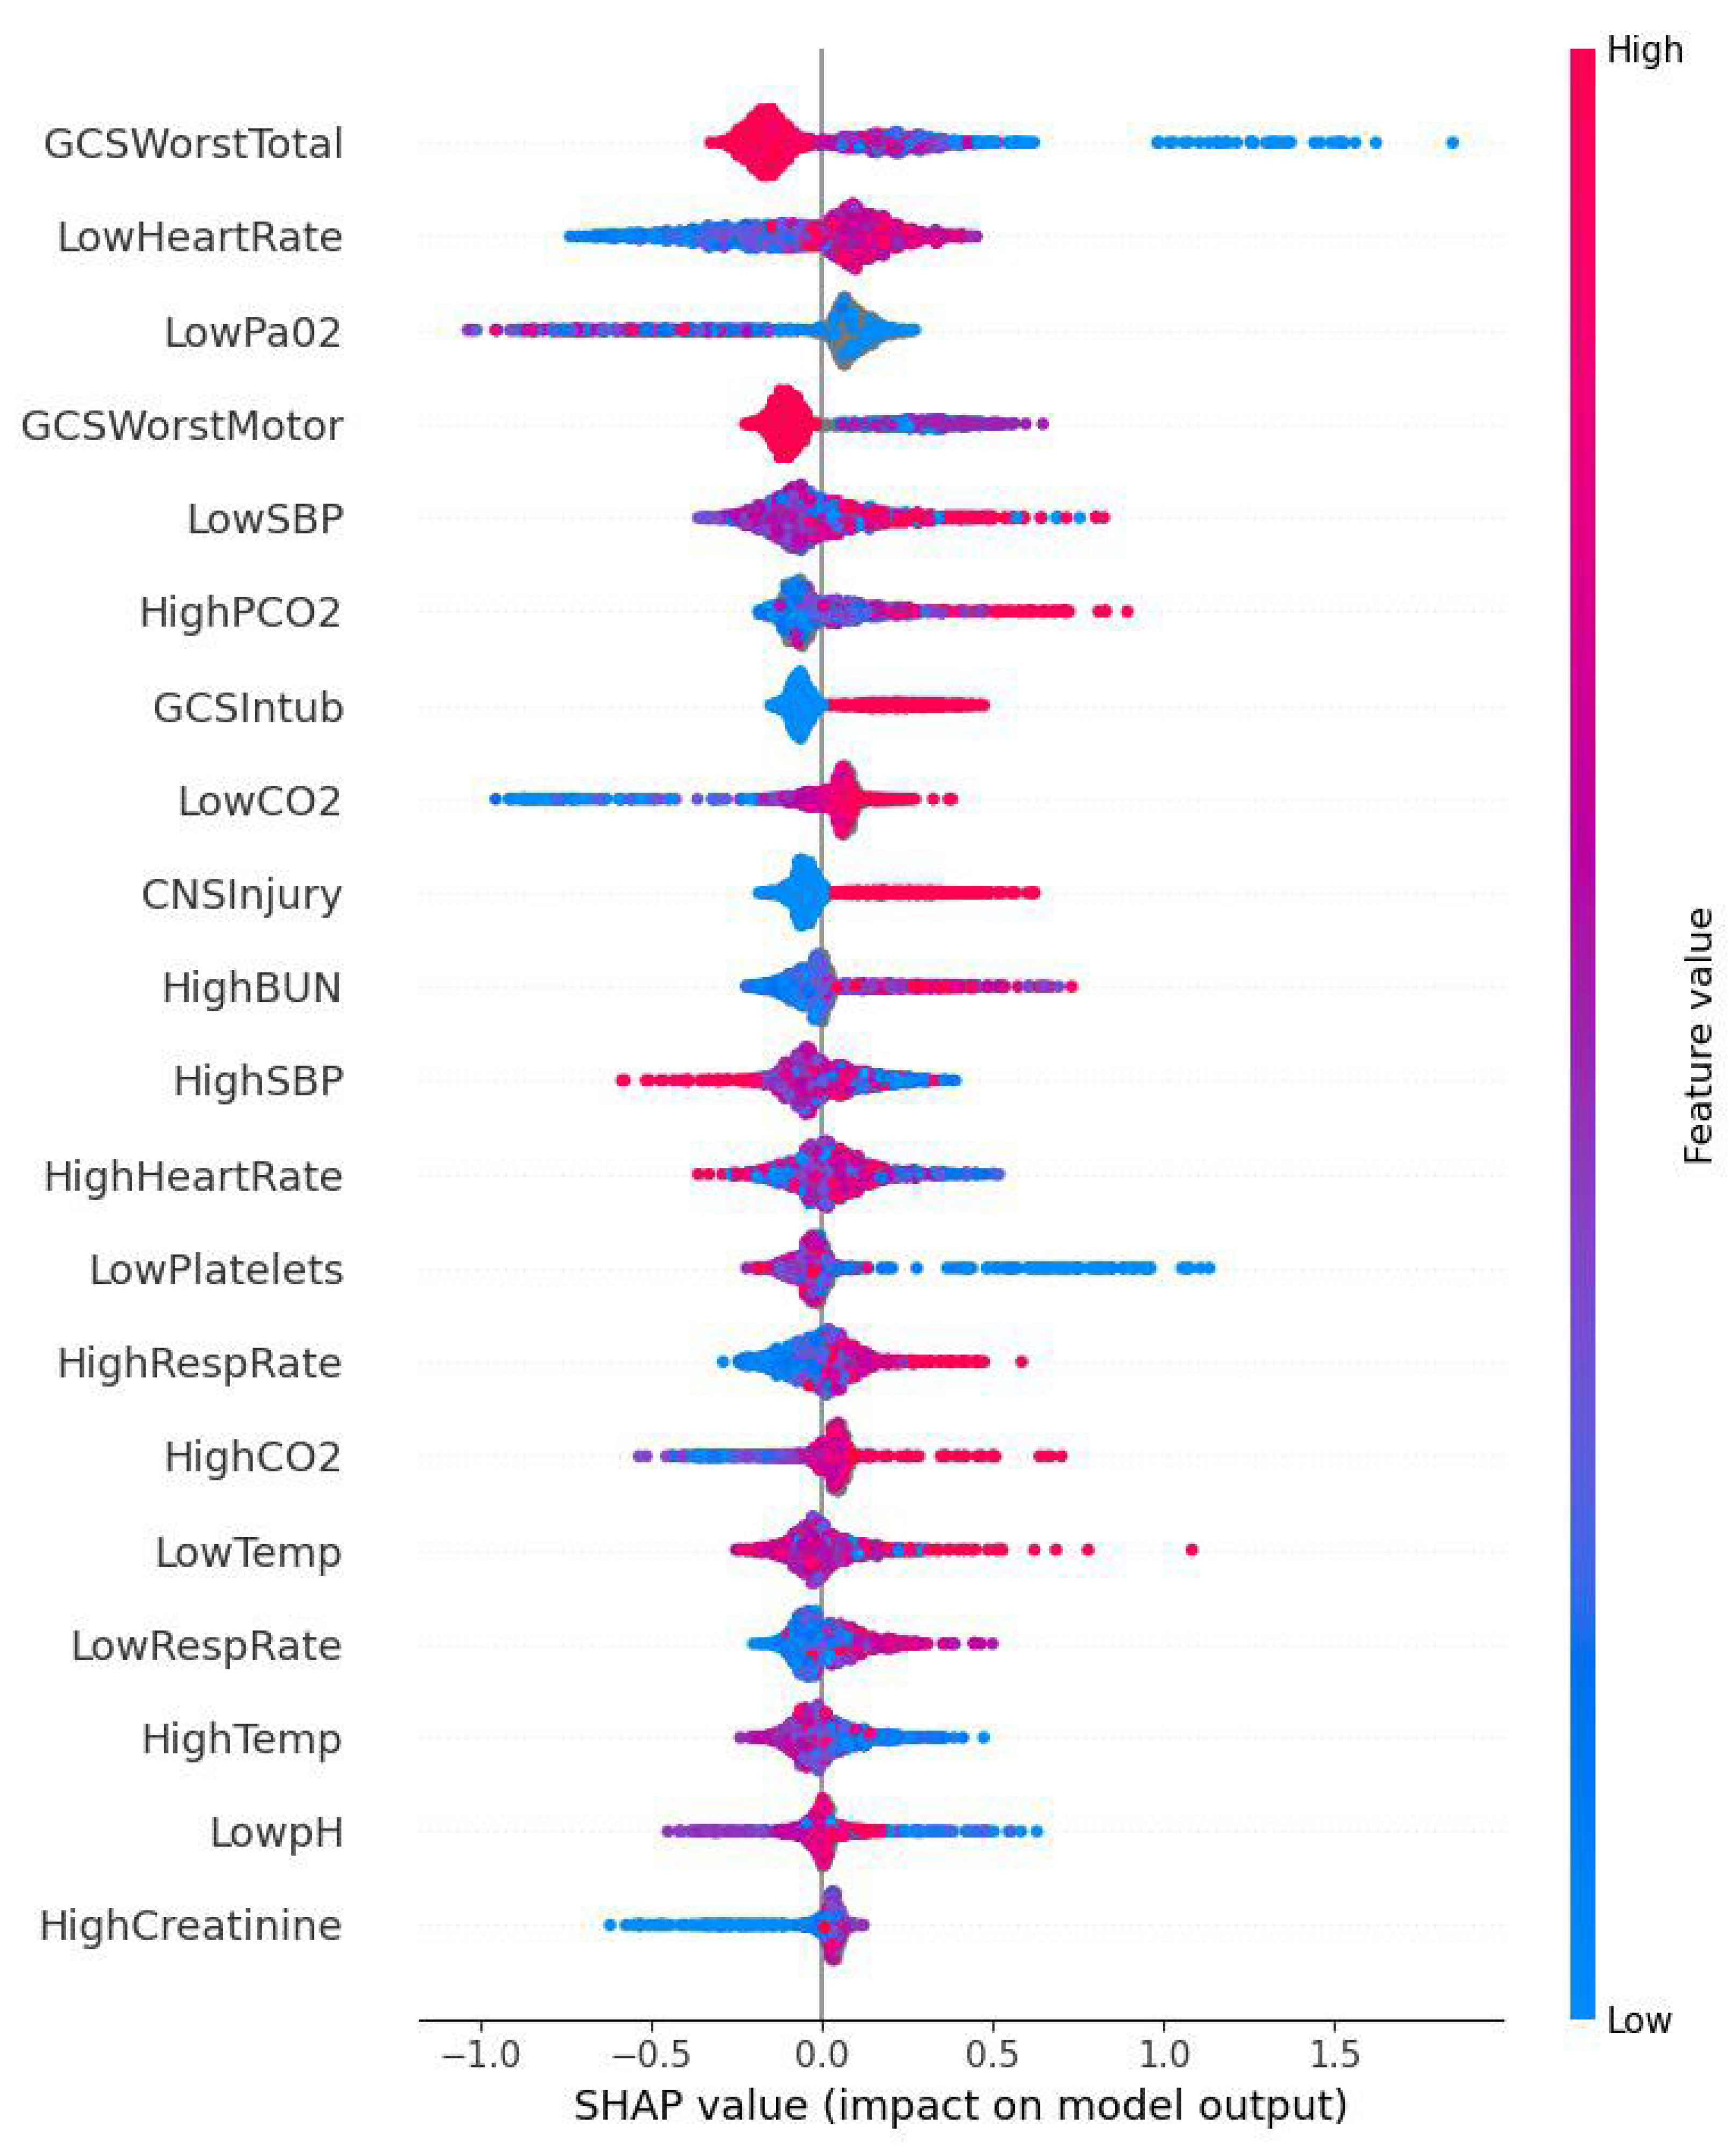
For the “Death or New Morbidity vs. Survival” dichotomy, the ML model achieved an accuracy of 0.92 (95% Confidence Interval (CI): 0.90, 0.93), AUC-ROC of 0.79 (95% CI: 0.75, 0.84), precision of 0.45 (95% CI: 0.35, 0.56), recall of 0.31 (95% CI: 0.22, 0.39) AUC-PR of 0.37 (95% CI: 0.29, 0.47), F1 score of 0.37 (95% CI: 0.28, 0.45), and Brier score of 0.096 (95% CI: 0.09, 0.1). The feature distributions for the mean, value ranges, and median with IQR are represented in Supplementary Tables S5, S6, and S7, respectively. The SHAP summary plot (Figure 2) illustrates the weight of each feature in model predictability, with GCSWorstTotal, LowHeartRate, LowPaO2, and GCSWorstMotor being the topmost important features from the highest to lowest in rank.
For the dichotomy “New Morbidity vs. Survival without new morbidity”, the ML model achieved an accuracy of 0.93 (95% Confidence Interval (CI): 0.92, 0.95), AUC-ROC of 0.74 (95% CI: 0.68, 0.80), precision of 0.30 (95% CI: 0.19, 0.40), recall of 0.34 (95% CI: 0.23, 0.45) AUC-PR of 0.20 (95% CI: 0.13, 0.31), F1 score of 0.32 (95% CI: 0.29, 0.42), and Brier score of 0.066 (95% CI: 0.060, 0.074). The feature distributions for the mean, value ranges, and median with IQR are represented in Supplementary Tables S8, S9, and S10, respectively.
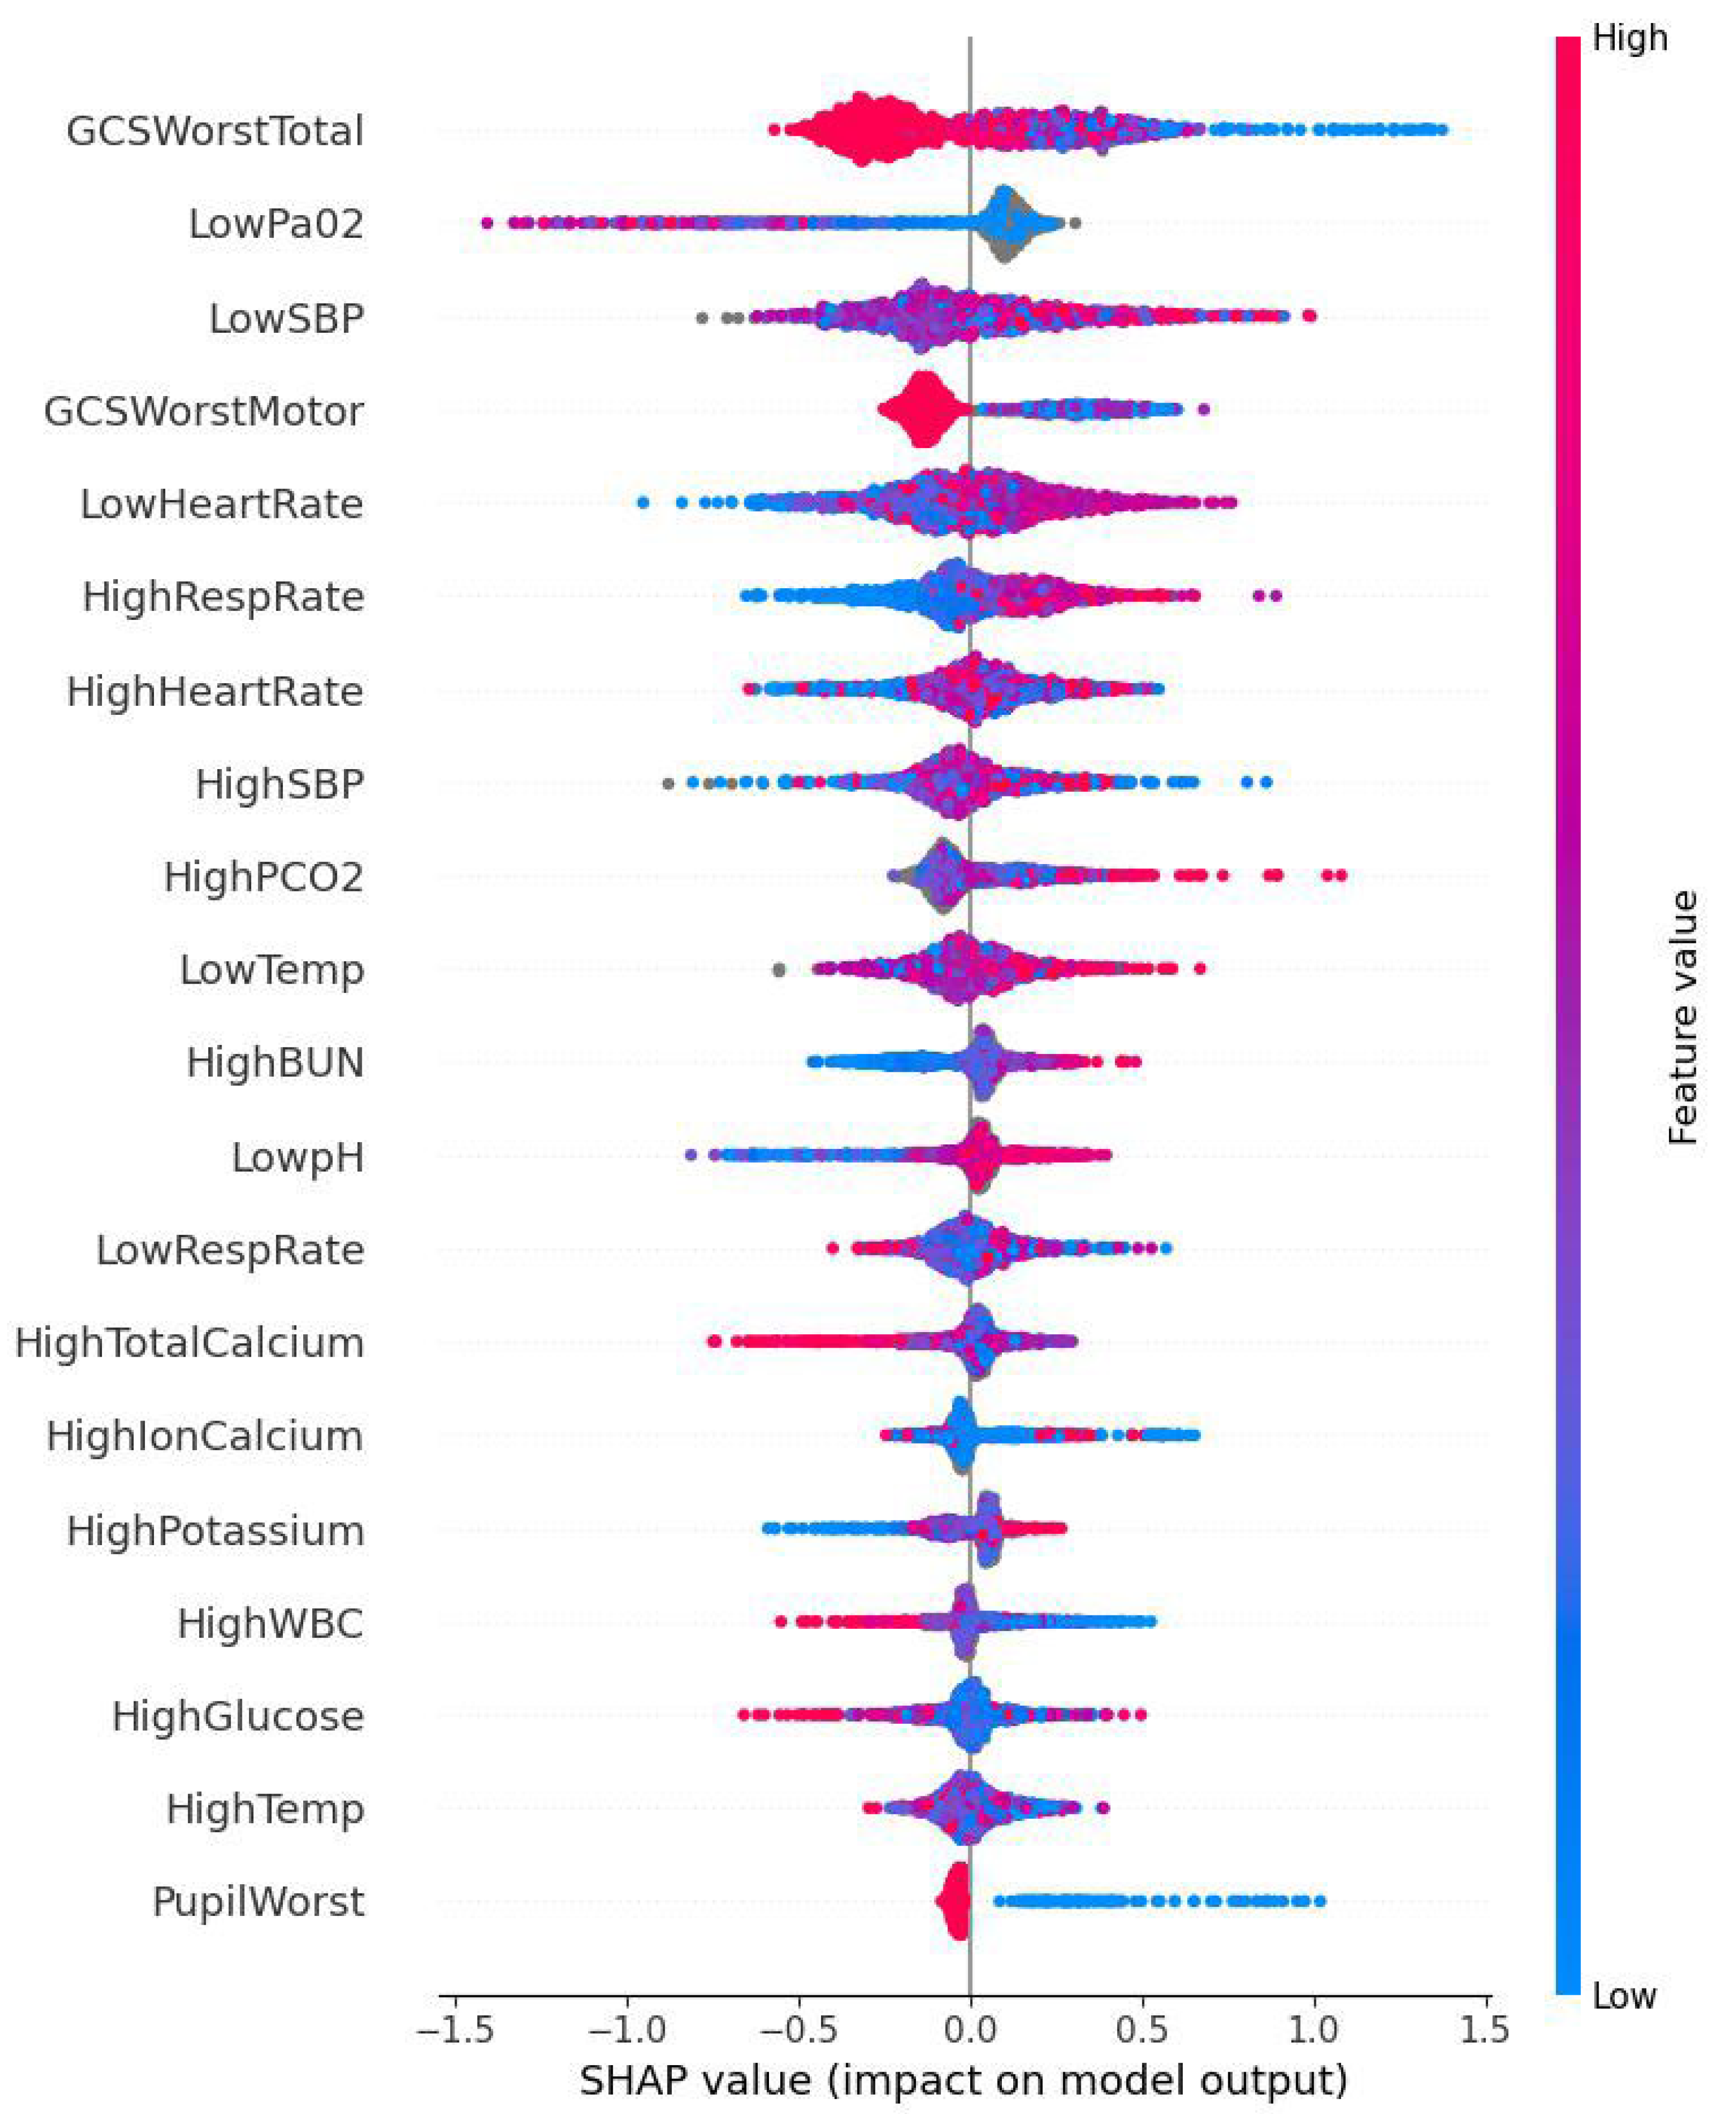
The SHAP summary plot (Figure 3) illustrates the weight of each feature in model predictability, with GCSWorstTotal, LowPaO2, LowSBP, GCSWorstMotor, and LowHeartRate being the topmost important features from the highest to lowest in rank.
To provide a clearer overview, the model performance across all three dichotomies is summarized graphically in Figure 4, illustrating the distribution of key evaluation metrics with their 95% confidence intervals.
The discriminative performance of the ML models was evaluated using the area under the ROC curve (AUC-ROC), which reflects their ability to distinguish between outcomes. Table 1 compares the AUC-ROC values of the LightGBM algorithm and logistic regression model used in the TOPICC study.

4. Discussion

In this study, we built and validated a LightGBM ML model to predict outcomes in the PICU using physiologic variables from the PRISM III score, derived from the TOPICC dataset. The model’s performance varied across three clinically distinct outcome dichotomies. For “Death vs. Survival”, the model demonstrated high discriminative ability with an AUC-ROC of 0.89, excellent precision of 0.92, and very high accuracy of 0.98, though recall was limited at 0.26, reflecting challenges in detecting the minority class. For the other two dichotomies, “Death or New Morbidity vs. Survival” and “New Morbidity vs. Survival without New Morbidity”, the AUC-ROC values remained moderate at 0.79 and 0.74, respectively, with lower recall and precision, consistent with increased complexity and class imbalance in these outcomes. Brier scores across all comparisons were low, suggesting good calibration and probabilistic accuracy. The variation in SHAP-identified features across the three outcome dichotomies is not unexpected, as each dichotomy represents a distinct clinical endpoint with a different underlying pathophysiology. For example, predictions of mortality “Death vs. Survival” relied more heavily on features indicative of acute physiologic compromise, such as LowHeartRate and HighBUN. In contrast, predictions of new morbidity among survivors for “New Morbidity vs. Survival without New Morbidity” were more influenced by features reflecting evolving neurologic dysfunction, such as GCSWorstTotal and GCSWorstMotor. The combined outcome of “Death or New Morbidity vs. Survival” incorporated elements of both, with features such as GCSWorstTotal and LowPlatelets contributing to a more heterogeneous pattern of feature importance. These differences underscore how the clinical nature of each outcome influences how the model assigns importance to specific physiologic variables.
The original TOPICC study implemented a trichotomous logistic regression model incorporating a broad set of predictors, including age, admission source, cardiac arrest, trauma, diagnoses of acute or chronic cancer, primary system of dysfunction, baseline Functional Status Scale (FSS), and PRISM III physiologic variables, which were divided into neurologic and non-neurologic components. In contrast, our model was intentionally designed to be more focused, relying exclusively on the individual physiologic variables that constitute the PRISM III score. We acknowledge this divergence, understanding that our model’s scope is more concentrated, which may influence the comparative performance metrics. The decision for this focused approach was driven by the clinical relevance and frequent utilization of these variables in PICU settings for critical decision-making. Physiologic variables are often the focus of clinicians during acute management and have been extensively employed in both scientific research and the academic literature to assess patient conditions and predict outcomes effectively. Despite excluding demographic, diagnostic, and functional status covariates, our LightGBM model achieved AUC-ROC values that were comparable to those reported in the validation cohort of the TOPICC study across all three outcome dichotomies. This performance underscores the potential utility of a simpler, streamlined model that leverages routinely collected physiologic data alone. Such a model may be easier to implement in real-world clinical workflows, require less data collection, and generalize more effectively to diverse PICU populations.
Although the TOPICC study also reported additional evaluation metrics, such as the Volume Under the ROC Surface (VUS), the Hosmer–Lemeshow goodness of fit test, and standardized morbidity and mortality ratios by subgroup, these measures are not valid for direct comparison due to differences in model structure and evaluation design. VUS applies specifically to multiclass models and is not applicable to our binary classification framework. The Hosmer–Lemeshow test is intended for use with logistic regression models and is not suitable for assessing calibration in non-parametric, tree-based machine learning models such as LightGBM. Similarly, standardized morbidity and mortality ratios require predefined subgroup-level analyses, which were beyond the scope of this study. Additionally, performance metrics commonly used in machine learning, such as precision, recall, and Brier score, are valuable for evaluating imbalanced classification tasks but were not reported in the TOPICC analysis. For these reasons, AUC-ROC was the only shared, robust, and methodologically appropriate metric available for direct comparison between models.
In a comprehensive comparison of predictive performances, our study and the TOPICC study both demonstrated substantial capability in assessing PICU outcomes across various dichotomies, using AUC-ROC as the principal metric. In evaluating predictive models, particularly in healthcare settings, the AUC-ROC is an essential metric due to its ability to measure a model’s discrimination threshold independently. This characteristic is crucial in medical settings where the outcomes are typically binary (e.g., survival vs. death), and the datasets may exhibit class imbalance. The AUC-ROC allows us to assess how well our model can distinguish between these outcomes across all possible classification thresholds, providing a reliable measure of model performance that is comparable across different studies and datasets. Furthermore, the AUC-ROC is invaluable for comparing models as it summarizes the model’s effectiveness in ranking predictions correctly into a single measure, enabling clear and direct model comparisons. This metric’s robustness against varying class distributions and its threshold-independent nature make it particularly suited for our study where predictive accuracy in identifying critical outcomes can directly influence clinical decision-making
The TOPICC study used odds ratios to report the association between PRISM III category groups (cardiovascular, chemistry, hematological, metabolic, and neurological) and the outcomes they predicted. We used SHAP values to investigate feature importance to the model prediction. We think that SHAP values present a more granular interpretation of the feature importance, regardless of their categorical grouping, providing a nuanced explanation of features’ influence on the model’s prediction and giving us an insight into the direction and magnitude of each feature impact on the model output. SHAP values can reveal complex patterns that may have been masked by grouping features in categories, which can aid in tuning the model towards better performance. On the clinical side, SHAP values, through providing detailed analysis, allow clinicians to monitor specific features rather than broader categories as reported by the TOPICC study, which can be better in the context of clinical decision-making.
A major limitation was the nature of our dataset and the imbalance that exists in terms of the positive outcomes being very low compared with the negative outcome; we expected to have a low recall. ML models used for classification are typically built with the assumption of existing balance within the dataset for each class. If class imbalance exists, model outcomes will be biased towards the majority class, generating an improper classification and poor performance [16]. With situations where class imbalance exists, using typical metrics are not ideal, and specialized metrics such as the precision and recall curve [17] and the F1 score [18] may better evaluate model performance.
In our efforts to overcome the issue of class imbalance we used the [is_unbalance: True] function within our LightGBM framework, which automatically adjusts the weights of the classes to mitigate the effects of class imbalance. It works by assigning more weight to the minority class during the training process, increasing the sensitivity of the model to the minority class. Even though this approach partially mitigated the skewed distribution, the rarity of mortality events still constrained recall.
Several recently published machine learning models have been used to predict outcomes in the PICU, and comparison with our study highlights key differences in machine learning model architecture, types of input features, timing of prediction, and potential for clinical integration. Aczon et al. [19] built a recurrent neural network (RNN) model capable of continuously assessing the mortality risk for pediatric patients throughout their PICU stay. Their model used 430 different physiological, demographic, laboratory, and therapeutic variables extracted from the electronic medical record. Their model was trained and evaluated on 12,516 PICU episodes from 9070 unique patients admitted to a single center (Children’s Hospital Los Angeles) over a nine-year period. An important distinction lies in the timing of prediction. At the time of ICU admission, when their model had access to only a single time point of data, it achieved an AUC-ROC of 0.74 (95% CI: 0.71–0.78), which is notably lower than our algorithm, which achieved an AUC-ROC of 0.89 using physiologic data available within the first few hours of admission (from two hours before to four hours after ICU entry). While the RNN’s performance improved significantly over time, reaching an AUC-ROC of 0.94 by hour 12, our model demonstrated stronger discriminative ability at the earliest stage of care, which is often the most critical window for triage and intervention. While Aczon’s approach showcases the potential of high-dimensional, time-sensitive modeling, its reliance on dense, longitudinal EMR integration and extensive variable collection may limit its practical adoption in many PICU settings. In contrast, our model offers strong early predictive value using a focused set of physiologic inputs, with a lower implementation burden and greater feasibility for integration into standard clinical workflows.
Munjal et al. [20] built a stacked ensemble model using data from 1860 PICU patients with suspected acute neurologic injury, a defined subset of the 10,078 patients included in the TOPICC study. Although their study modeled the same three outcome dichotomies as ours, their focus was on a more specific clinical subgroup, rather than the broader and heterogeneous PICU population analyzed in our study. Their model incorporated a wider range of input variables beyond physiologic data, including demographics, neurologic diagnoses, intubation status, and baseline functional status scores. These additional features, along with the use of a stacked ensemble of three machine learning classifiers (Random Forest, Gradient-Boosting, and Support Vector Machine), likely contributed to their higher AUC-ROC of 0.91 for mortality and 0.83 for the composite outcome of mortality and morbidity vs. survival. In contrast, our model was trained on the full PICU cohort and relied solely on PRISM III physiologic variables captured around the time of admission, data that are routinely collected and broadly applicable regardless of patient diagnosis. Despite its simplicity and use of only one algorithm (LightGBM), our model achieved a comparable AUC-ROC of 0.89 for mortality and 0.79 for the composite outcome. This demonstrates the utility of a streamlined, diagnosis-independent model for early outcome prediction across diverse patient populations, with fewer input requirements. While Munjal et al.’s model illustrates the value of tailored ensemble learning within a focused domain, our approach prioritizes generalizability, early applicability, and efficiency.
Patel et al. [21] introduced the Criticality Index-Mortality (CI-M), a neural network model designed to dynamically update mortality risk every 3 h during PICU admission. The aim of their study was to assess the performance of this dynamic method using retrospective data from 8399 admissions at a single center, Children’s National Hospital. The model utilized a wide array of inputs including laboratory tests, vital signs, medication classes, and mechanical ventilation parameters, and recalculated risk in structured 3 h intervals throughout the ICU stay. The composite AUC-ROC across all time periods was 0.851 (95% CI: 0.841–0.862), with time-specific AUC-ROC values ranging from 0.778 at hour 3 to 0.885 at hour 81. In contrast, our model was designed for early risk stratification using physiological variables available within the first four hours of admission and achieved a higher AUC-ROC of 0.89. While CI-M is suited for continuous risk monitoring, its architecture was built with the intent of real-time integration into clinical environments, relying on repeated data capture. Our model, though static, may be more feasible for widespread implementation and valuable for early decision-making before extensive clinical deterioration.
This study has several important strengths. Our model was trained using only physiologic variables collected within the first hours of PICU admission, making it practical for early risk stratification and feasible for deployment in a wide range of clinical settings. Additionally, LightGBM’s native handling of missing data eliminated the need for imputation, simplifying the preprocessing of data and minimizing potential bias.
We think that there is room for improvement in our model, as we believe it is crucial from a clinical perspective to balance precision and recall, as high precision will lower the false positive rate which is important to avoid unnecessary interventions. However, on the other hand, improving recall is equally important to ensure that most of the patients at risk would be identified and intervened with early, which is one of the fundamentals of critical care medicine.
Future studies should aim to externally validate the model across diverse PICU settings to assess generalizability. Integrating the model into clinical workflows and evaluating its impact on decision-making and outcomes will also be important next steps.

5. Conclusions

ML models demonstrate a comparable predictive performance to logistic regression models in predicting PICU outcomes.
In our study, the LightGBM model using PRISM III physiologic variables from around admission time achieved a predictive performance comparable to the logistic regression model of the TOPICC study. While the model shows promise, we acknowledge that improvements in recall and precision are necessary to enhance its clinical applicability. By demonstrating the feasibility of a streamlined, physiologic-only approach, our work provides a foundation for the future development of automated algorithms that can be integrated into electronic medical record (EMR) systems to deliver real-time risk assessment at the bedside. Such tools could support earlier and more timely interventions, with the ultimate goal of reducing mortality and morbidity in critically ill children.

Supplementary Materials

The following supporting information can be downloaded at: https://www.mdpi.com/article/10.3390/biomedinformatics5030052/s1. The source code and extended results are included within the Supplementary Data file.

Author Contributions

A.M.A. and O.B. participated in the conceptualization, methodology, and building of the machine learning model. A.M.A. wrote the first draft of the manuscript, and O.B. provided critical review and revisions. All authors have read and agreed to the published version of the manuscript.

Funding

This research received no external funding, and the APC was funded by the Cleveland Clinic Foundation.

Institutional Review Board Statement

This study was conducted in accordance with the Declaration of Helsinki and deemed to be exempt from formal review by the Cleveland Clinic Institutional Review Board.

Informed Consent Statement

This study was conducted using an anonymized database and did not recruit individual human subjects; therefore, consent was not applicable.

Data Availability Statement

The database can be obtained through the NICHD Data and Specimen Hub (DASH). The machine learning source code is included in the Supplementary Data.

Conflicts of Interest

The authors declare no conflicts of interest. The funders had no role in the design of the study; in the collection, analyses, or interpretation of data; in the writing of the manuscript; or in the decision to publish the results.

References

  1. Markovitz, B.P.; Kukuyeva, I.; Soto-Campos, G.; Khemani, R.G. PICU Volume and Outcome: A Severity-Adjusted Analysis. Pediatr. Crit. Care Med. 2016, 17, 483–489. [Google Scholar] [CrossRef] [PubMed]
  2. Typpo, K.V.; Petersen, N.J.; Hallman, D.M.; Markovitz, B.P.; Mariscalco, M.M. Day 1 multiple organ dysfunction syndrome is associated with poor functional outcome and mortality in the pediatric intensive care unit. Pediatr. Crit. Care Med. 2009, 10, 562–570. [Google Scholar] [CrossRef] [PubMed]
  3. Pollack, M.M.; Holubkov, R.; Funai, T.; Clark, A.; Berger, J.T.; Meert, K.; Newth, C.J.L.; Shanley, T.; Moler, F.; Carcillo, J.; et al. Pediatric intensive care outcomes: Development of new morbidities during pediatric critical care. Pediatr. Crit. Care Med. 2014, 15, 821–827. [Google Scholar] [CrossRef] [PubMed]
  4. Pollack, M.M.; Patel, K.M.; Ruttimann, U.E. PRISM III: An updated Pediatric Risk of Mortality score. Crit. Care Med. 1996, 24, 743–752. [Google Scholar] [CrossRef] [PubMed]
  5. Mirza, S.; Malik, L.; Ahmed, J.; Malik, F.; Sadiq, H.; Ali, S.; Aziz, S. Accuracy of Pediatric Risk of Mortality (PRISM) III Score in Predicting Mortality Outcomes in a Pediatric Intensive Care Unit in Karachi. Cureus 2020, 12, e7489. [Google Scholar] [CrossRef] [PubMed]
  6. Anjali, M.M.; Unnikrishnan, D.T. Effectiveness of PRISM III score in predicting the severity of illness and mortality of children admitted to pediatric intensive care unit: A cross-sectional study. Egypt. Pediatr. Assoc. Gaz. 2023, 71, 25. [Google Scholar] [CrossRef]
  7. Knaus, W.A.; Wagner, D.P.; Draper, E.A.; Zimmerman, J.E.; Bergner, M.; Bastos, P.G.; Sirio, C.A.; Murphy, D.J.; Lotring, T.; Damiano, A. The APACHE III prognostic system. Risk prediction of hospital mortality for critically ill hospitalized adults. Chest 1991, 100, 1619–1636. [Google Scholar] [CrossRef] [PubMed]
  8. Le Gall, J.R.; Lemeshow, S.; Saulnier, F. A new Simplified Acute Physiology Score (SAPS II) based on a European/North American multicenter study. JAMA 1993, 270, 2957–2963. [Google Scholar] [CrossRef] [PubMed]
  9. Churpek, M.M.; Yuen, T.C.; Winslow, C.; Meltzer, D.O.; Kattan, M.W.; Edelson, D.P. Multicenter Comparison of Machine Learning Methods and Conventional Regression for Predicting Clinical Deterioration on the Wards. Crit. Care Med. 2016, 44, 368–374. [Google Scholar] [CrossRef] [PubMed]
  10. Tomašev, N.; Glorot, X.; Rae, J.W.; Zielinski, M.; Askham, H.; Saraiva, A.; Mottram, A.; Meyer, C.; Ravuri, S.; Protsyuk, I.; et al. A clinically applicable approach to continuous prediction of future acute kidney injury. Nature 2019, 572, 116–119. [Google Scholar] [CrossRef] [PubMed]
  11. Johnson, A.E.W.; Mark, R.G. Real-time mortality prediction in the Intensive Care Unit. AMIA Annu. Symp. Proc. 2018, 2017, 994–1003. [Google Scholar] [PubMed]
  12. Bailly, S.; Meyfroidt, G.; Timsit, J.-F. What’s new in ICU in 2050: Big data and machine learning. Intensive Care Med. 2018, 44, 1524–1527. [Google Scholar] [CrossRef] [PubMed]
  13. Ke, G.; Meng, Q.; Finley, T.; Wang, T.; Chen, W.; Ma, W.; Ye, Q.; Liu, T.-Y. LightGBM: A Highly Efficient Gradient Boosting Decision Tree. In Advances in Neural Information Processing Systems 30 (NIPS 2017); [Internet]; Curran Associates, Inc.: New York, NY, USA, 2017; Available online: https://proceedings.neurips.cc/paper_files/paper/2017/hash/6449f44a102fde848669bdd9eb6b76fa-Abstract.html (accessed on 18 August 2025).
  14. Pollack, M.M.; Holubkov, R.; Glass, P.; Dean, J.M.; Meert, K.L.; Zimmerman, J.; Anand, K.J.S.; Carcillo, J.; Newth, C.J.L.; Harrison, R.; et al. Functional Status Scale: New pediatric outcome measure. Pediatrics 2009, 124, e18–e28. [Google Scholar] [CrossRef] [PubMed]
  15. Lundberg, S.; Lee, S.-I. A Unified Approach to Interpreting Model Predictions. arXiv 2017. [Google Scholar] [CrossRef]
  16. Wei, Q.; Dunbrack, R.L., Jr. The Role of Balanced Training and Testing Data Sets for Binary Classifiers in Bioinformatics. PLoS ONE 2013, 8, e67863. [Google Scholar] [CrossRef] [PubMed]
  17. Buckland, M.; Gey, F. The relationship between Recall and Precision. J. Am. Soc. Inf. Sci. 1994, 45, 12–19. [Google Scholar] [CrossRef]
  18. Goutte, C.; Gaussier, E. A Probabilistic Interpretation of Precision, Recall and F-Score, with Implication for Evaluation. In Advances in Information Retrieval; Losada, D.E., Fernández-Luna, J.M., Eds.; Springer: Berlin/Heidelberg, Germany, 2005; pp. 345–359. [Google Scholar]
  19. Aczon, M.D.; Ledbetter, D.R.; Laksana, E.; Ho, L.V.; Wetzel, R.C. Continuous Prediction of Mortality in the PICU: A Recurrent Neural Network Model in a Single-Center Dataset. Pediatr. Crit. Care Med. 2021, 22, 519–529. [Google Scholar] [CrossRef] [PubMed]
  20. Munjal, N.K.; Clark, R.S.B.; Simon, D.W.; Kochanek, P.M.; Horvat, C.M. Interoperable and explainable machine learning models to predict morbidity and mortality in acute neurological injury in the pediatric intensive care unit: Secondary analysis of the TOPICC study. Front. Pediatr. 2023, 11, 1177470. [Google Scholar] [CrossRef] [PubMed]
  21. Patel, A.K.; Trujillo-Rivera, E.; Morizono, H.; Pollack, M.M. The criticality Index-mortality: A dynamic machine learning prediction algorithm for mortality prediction in children cared for in an ICU. Front. Pediatr. 2022, 10, 1023539. [Google Scholar] [CrossRef] [PubMed]
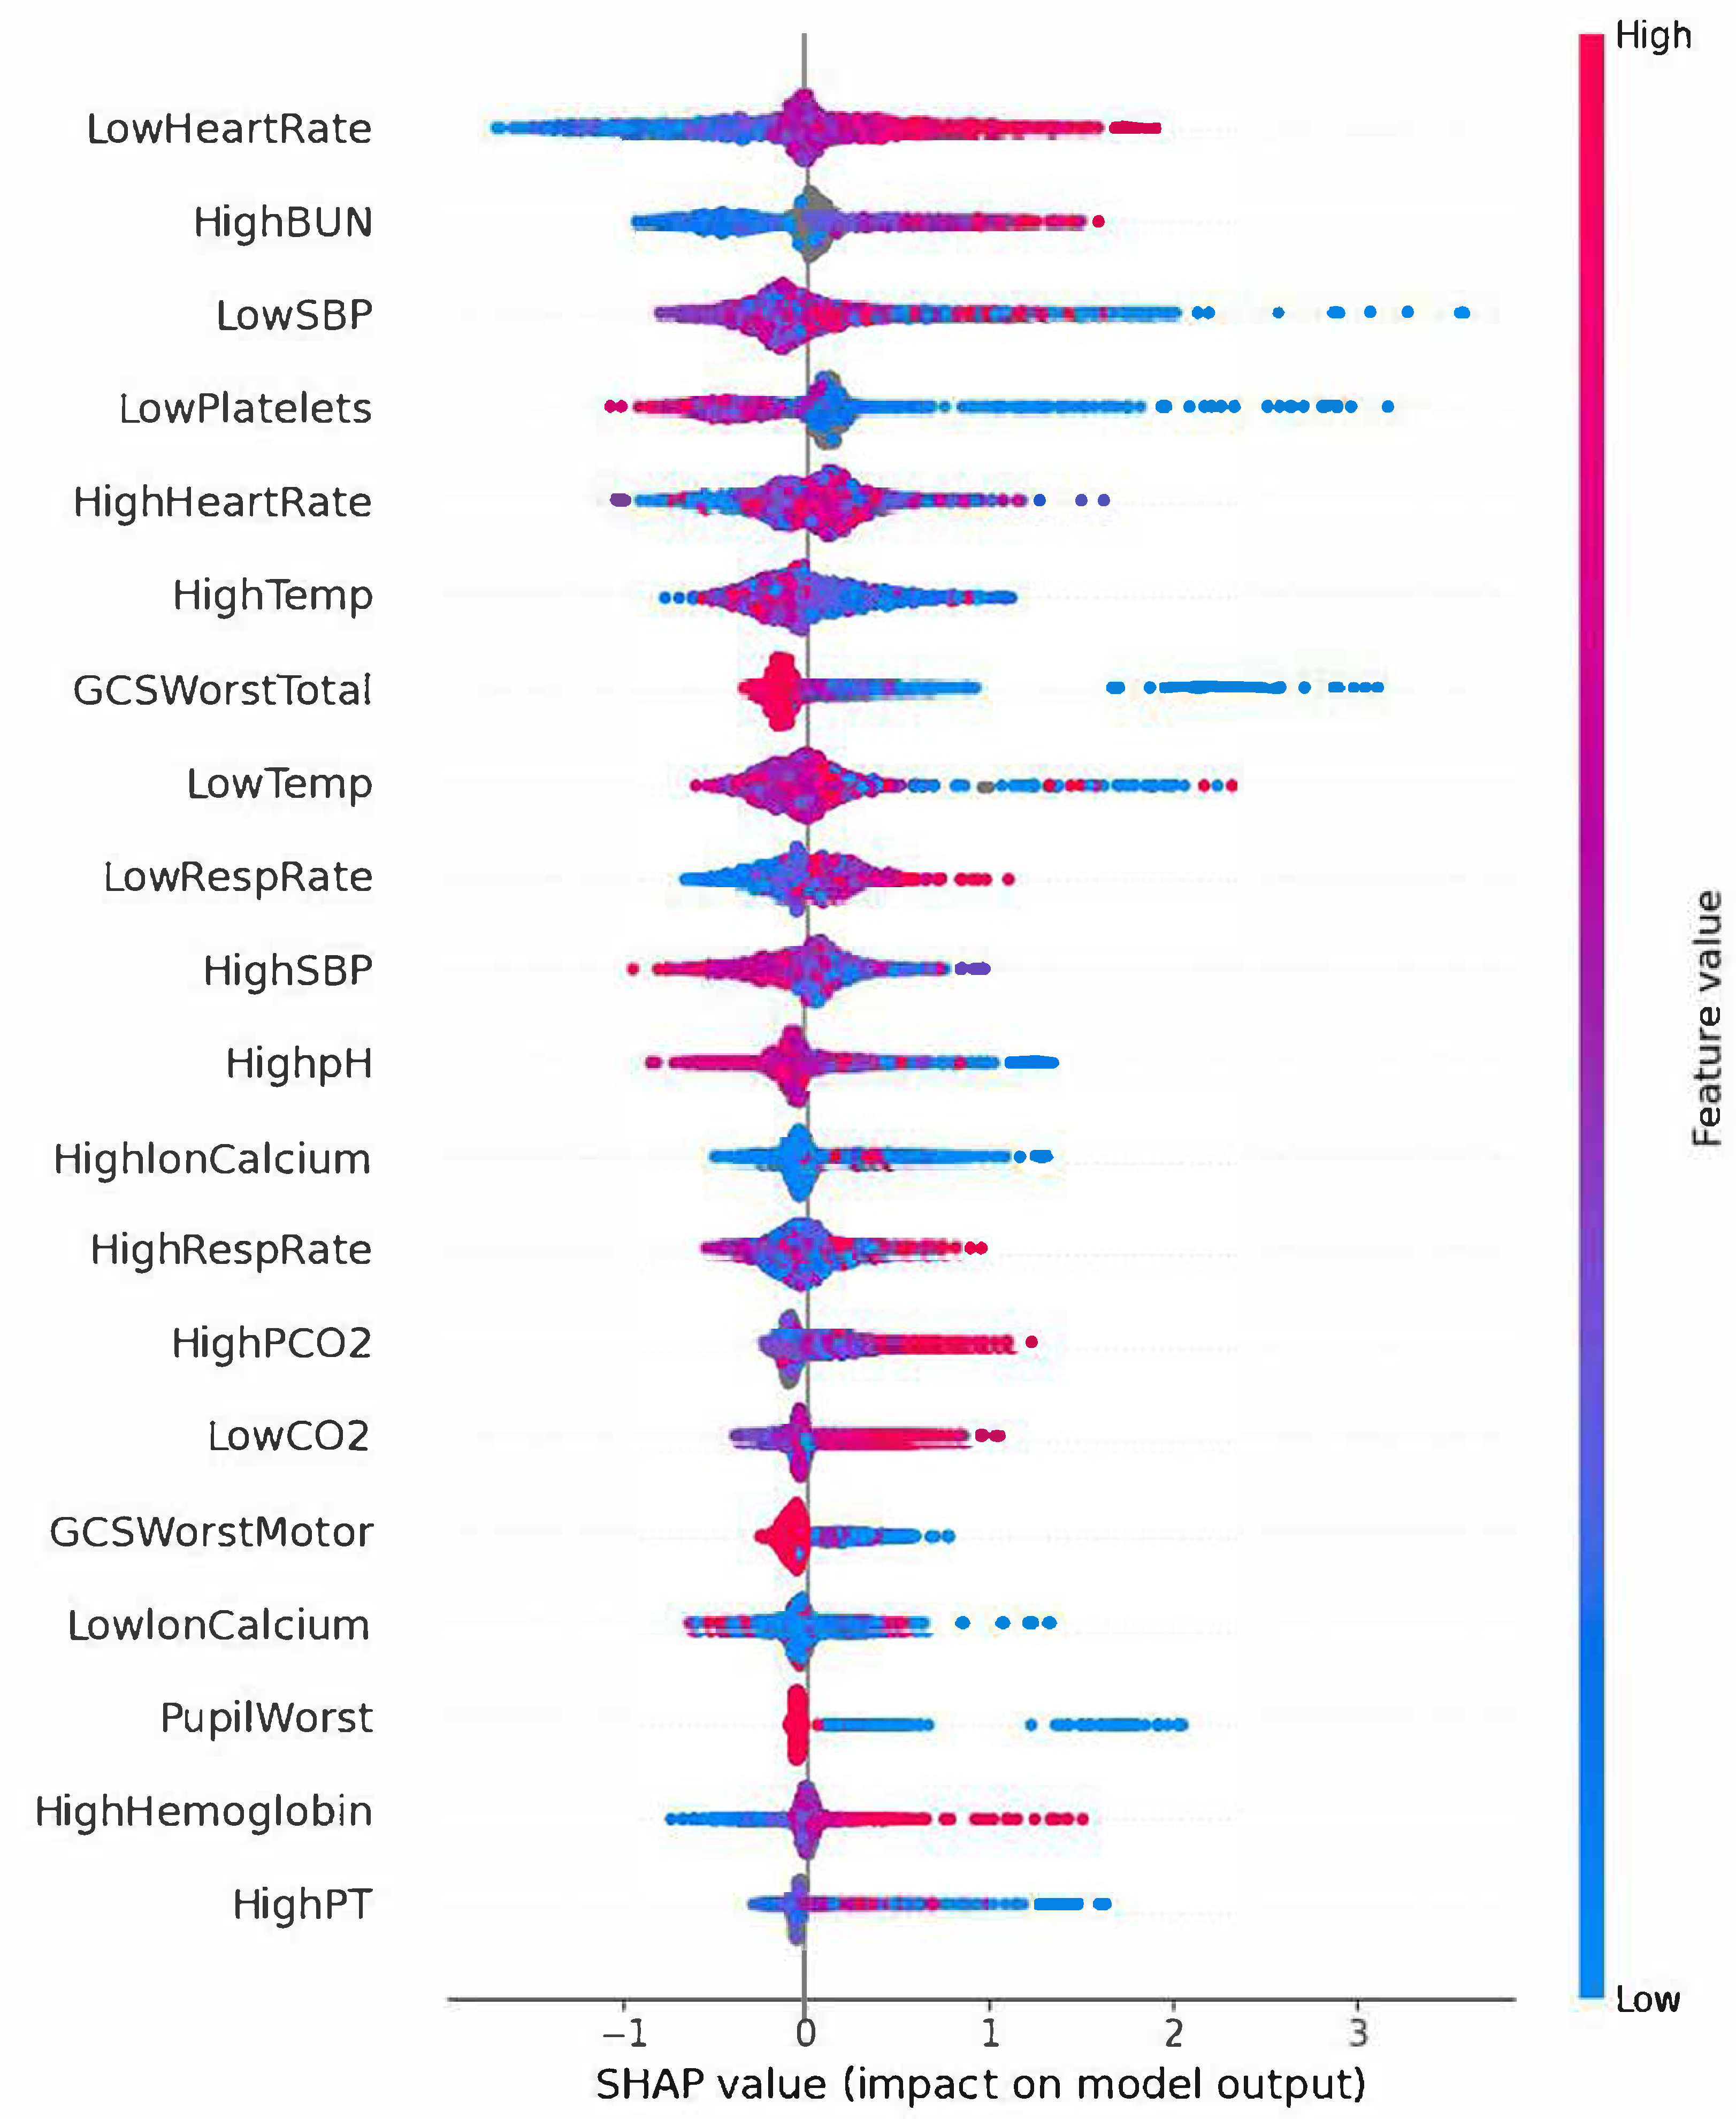
Figure 1. SHAP summary plot for “Death vs. Survival” dichotomy. For “Death vs. Survival” dichotomy, LowHeartRate was the feature with highest weight for the ML model’s predictions. Heart rate values above Q3 (75th centile, 132 bpm) increased the risk for mortality as indicated by the clustering of the red dots on the right side of the SHAP summary plot figure, suggesting that tachycardia with heart rate around 132 bpm is a significant predictor of poor outcome. Conversely, heart rate values below Q1 (25th centile, 90 bpm) shift the model’s predictability towards lower risk for mortality, as indicated by the clustering of the blue dots on the left side of the SHAP summary plot figure.
Biomedinformatics 05 00052 g001
Figure 2. SHAP summary plot for “Death or New Morbidity vs. Survival” dichotomy. For this dichotomy, GCSWorstTotal has been the feature of most importance with respect to the models’ predictability. GCS score below Q1 (25th centile, <11) significantly increased the risk for developing either mortality or morbidity as indicated by the clustering of the blue dots on the extreme right side of the SHAP summary plot figure, suggesting that a GCS score below 11 is a significant predictor of poor outcome. Having a GCS score around the median (15) did not exclude the risk of developing mortality or morbidity for some patients, as shown by the clustering of the purple-colored dots on the right side of the SHAP summary plot figure. However, for some patients, having a GCS score of 15 shifted the model’s prediction towards less risk for developing mortality or morbidity, as shown by the clustering of the red dots on the left side of the SHAP summary plot figure.
Biomedinformatics 05 00052 g002
Figure 3. SHAP summary plot for “New Morbidity vs. Survival without new morbidity” dichotomy. For this dichotomy, GCSWorstTotal has been the feature of most importance with respect to the models’ predictability. GCS score below Q1 (25th centile, <11) significantly increased the risk for developing new morbidity, as indicated by the clustering of the blue dots on the extreme right side of the SHAP summary plot figure, suggesting that a GCS score below 11 is a significant predictor of poor outcome in terms of developing new morbidity. Having a GCS score around the median (15) did not exclude the risk of developing new morbidity for some patients, as shown by the clustering of the purple-colored dots on the right side of the SHAP summary plot figure. However, for some patients, having a GCS score of 15 shifted the model’s prediction towards less risk for developing new morbidity as shown by the clustering of the red dots on the left side of the SHAP summary plot figure.
Biomedinformatics 05 00052 g003
Figure 4. Performance metrics of the LightGBM model across the three outcome dichotomies. Each point represents the mean value for a given metric, with vertical lines denoting 95% confidence intervals. The plot highlights consistently high accuracy across all tasks, stronger precision than recall, and moderate discrimination by AUC-ROC and AUC-PR. This visualization facilitates direct comparison of the relative strengths and weaknesses of the model across different outcomes.
Biomedinformatics 05 00052 g004
Table 1. Logistic regression vs. LightGBM.
Logistic Regression vs. LightGBM
TOPICC Study AUC-ROC (SD)LightGBM model AUC-ROC (95% CI)
Survival vs. Death0.89 ± 0.0200.89 (0.83, 0.94)
Death or New Morbidity vs. Survival without New Morbidity0.80 ± 0.0180.79 (0.75, 0.84)
New Morbidity vs. Survival without New Morbidity0.74 ± 0.0240.74 (0.68, 0.80)
Disclaimer/Publisher’s Note: The statements, opinions and data contained in all publications are solely those of the individual author(s) and contributor(s) and not of MDPI and/or the editor(s). MDPI and/or the editor(s) disclaim responsibility for any injury to people or property resulting from any ideas, methods, instructions or products referred to in the content.