
Evaluating ChatGPT for Disease Prediction: A Comparative Study on Heart Disease and Diabetes


Abstract
1. Introduction
- The main contributions of this work include:
- Utilize ChatGPT for chronic disease diagnosis, particularly heart disease and diabetes prediction.
- Explore the impact of prompt engineering and feature selection methods on predictive performance.
- Investigate the influence of different learning strategies on model outcomes, including zero-shot, few-shot, and chain-of-thought reasoning.
- Evaluate ChatGPT’s results against models from the literature.
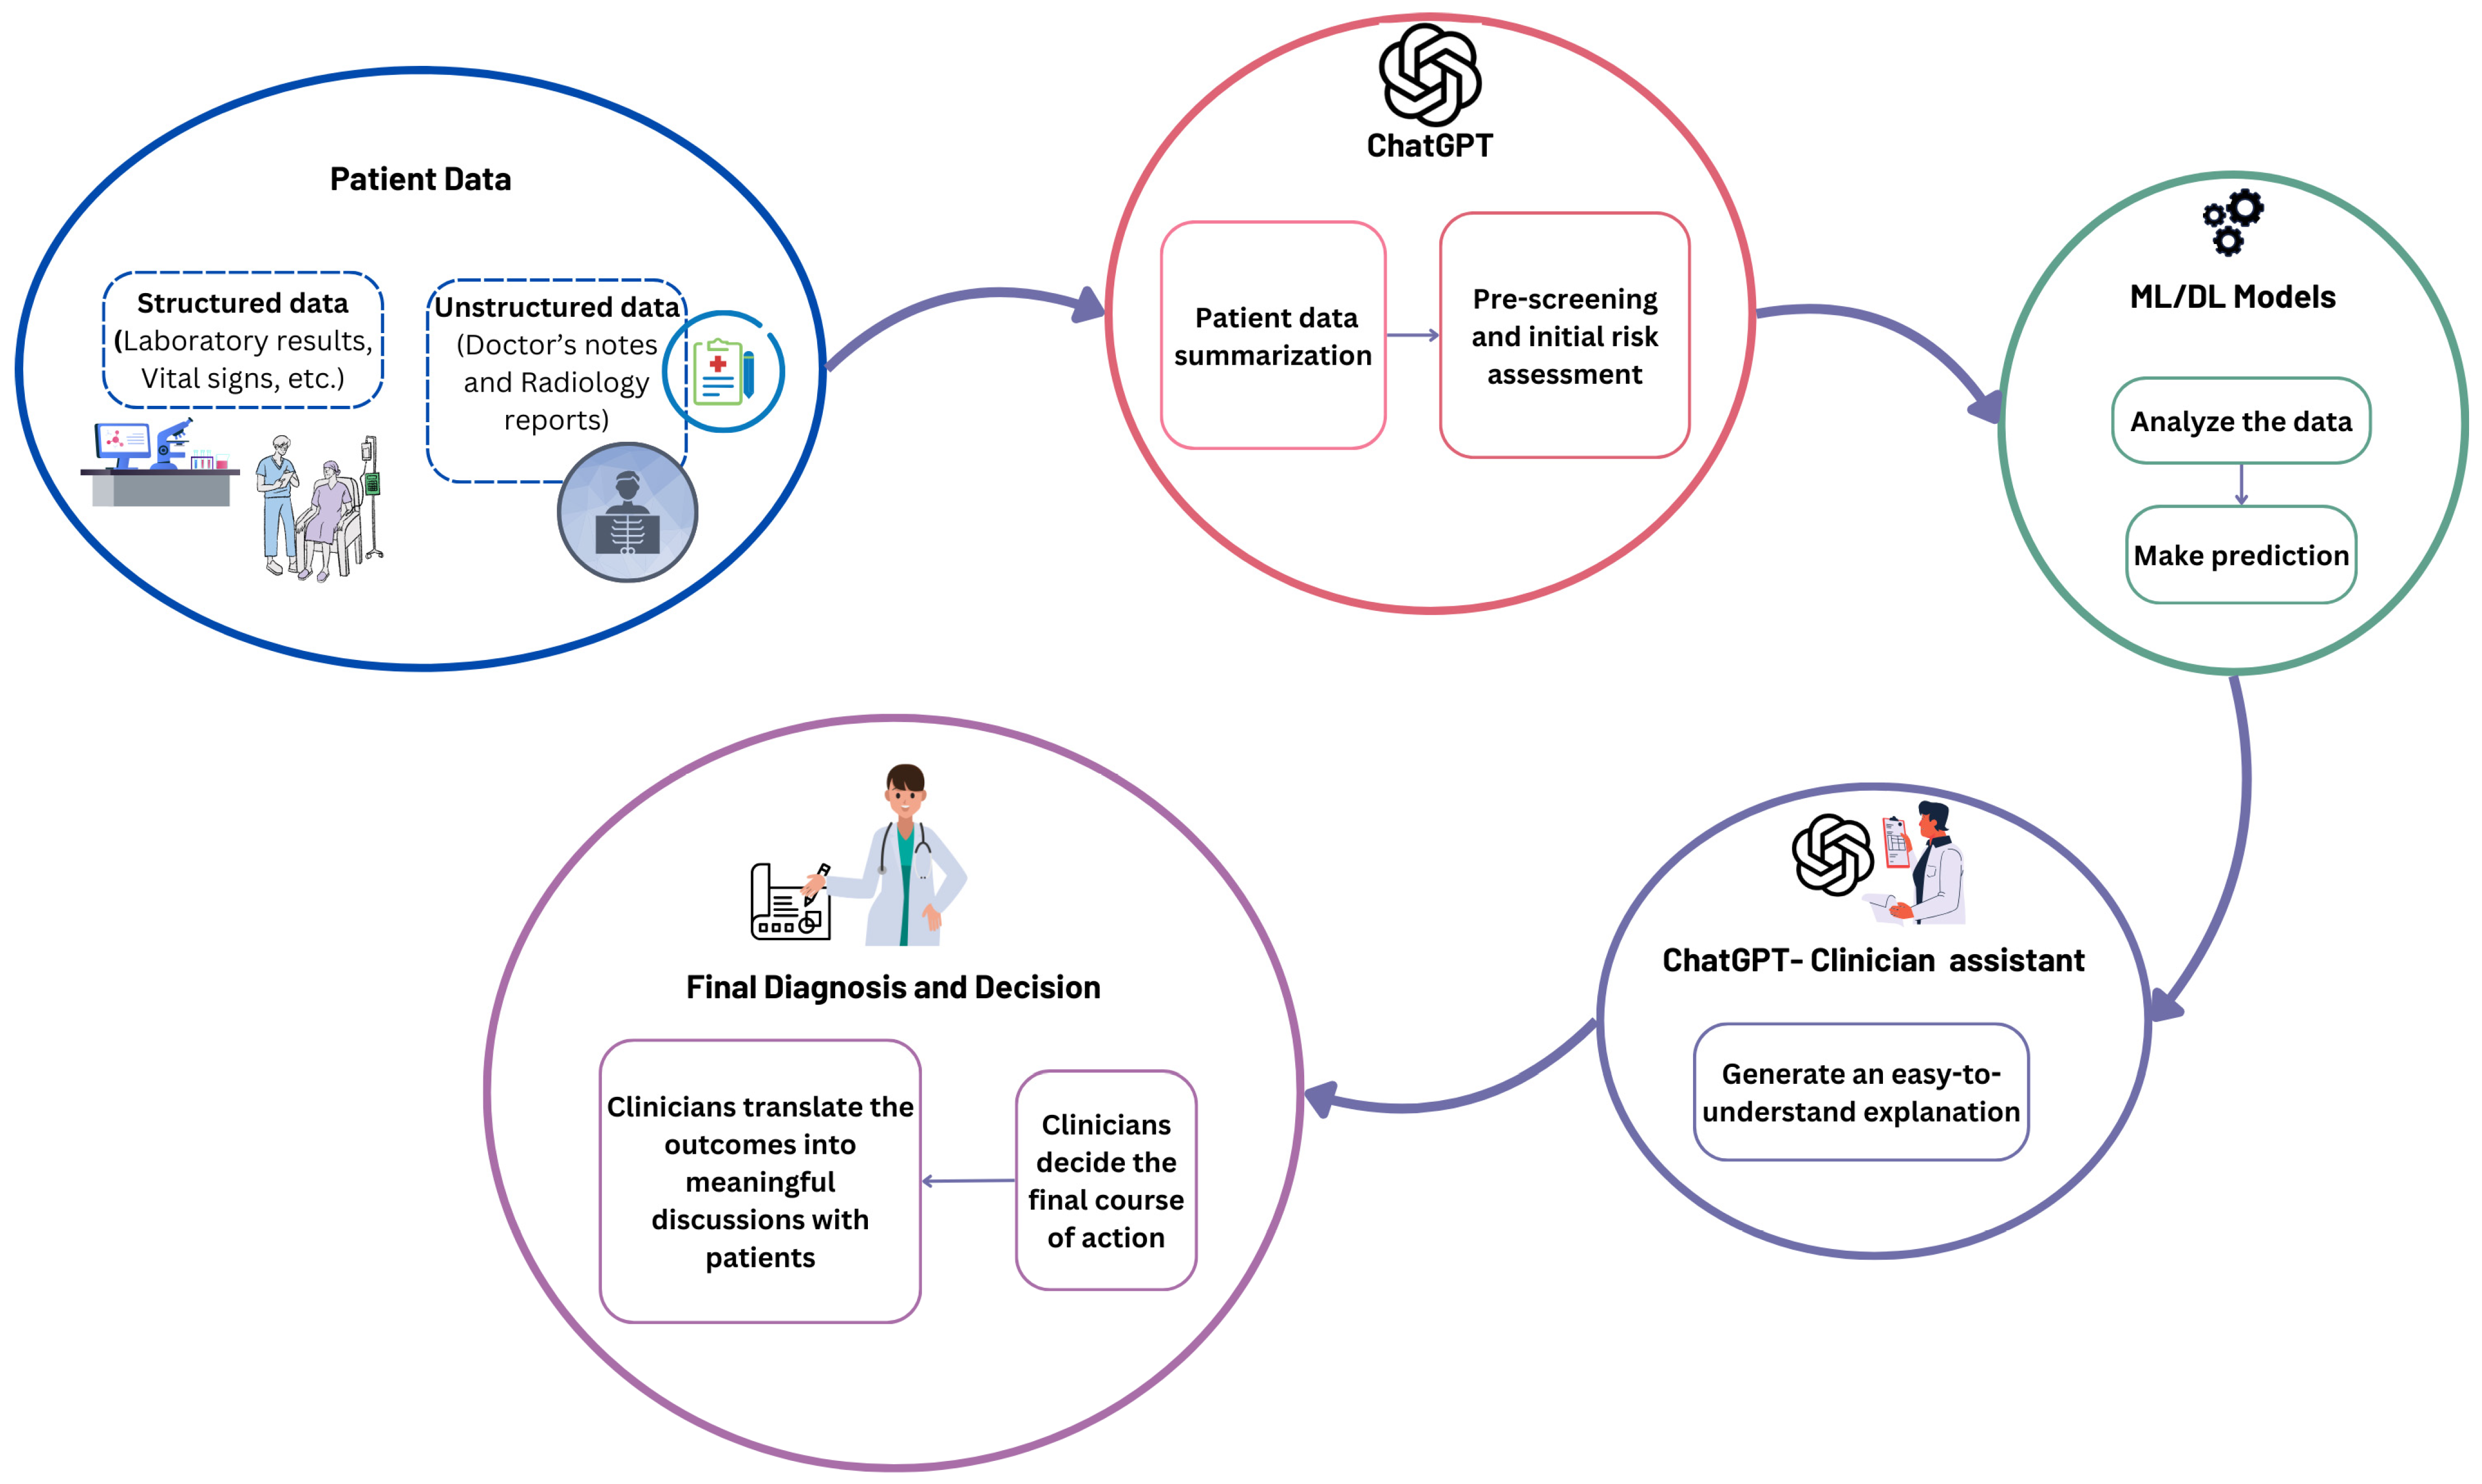
- Suggest a workflow for ChatGPT as an assistant for ML/DL models to enhance clinical decision-making.
2. Related Works
2.1. Diabetes Disease Prediction
2.2. Heart Disease Prediction
2.3. Research Gap
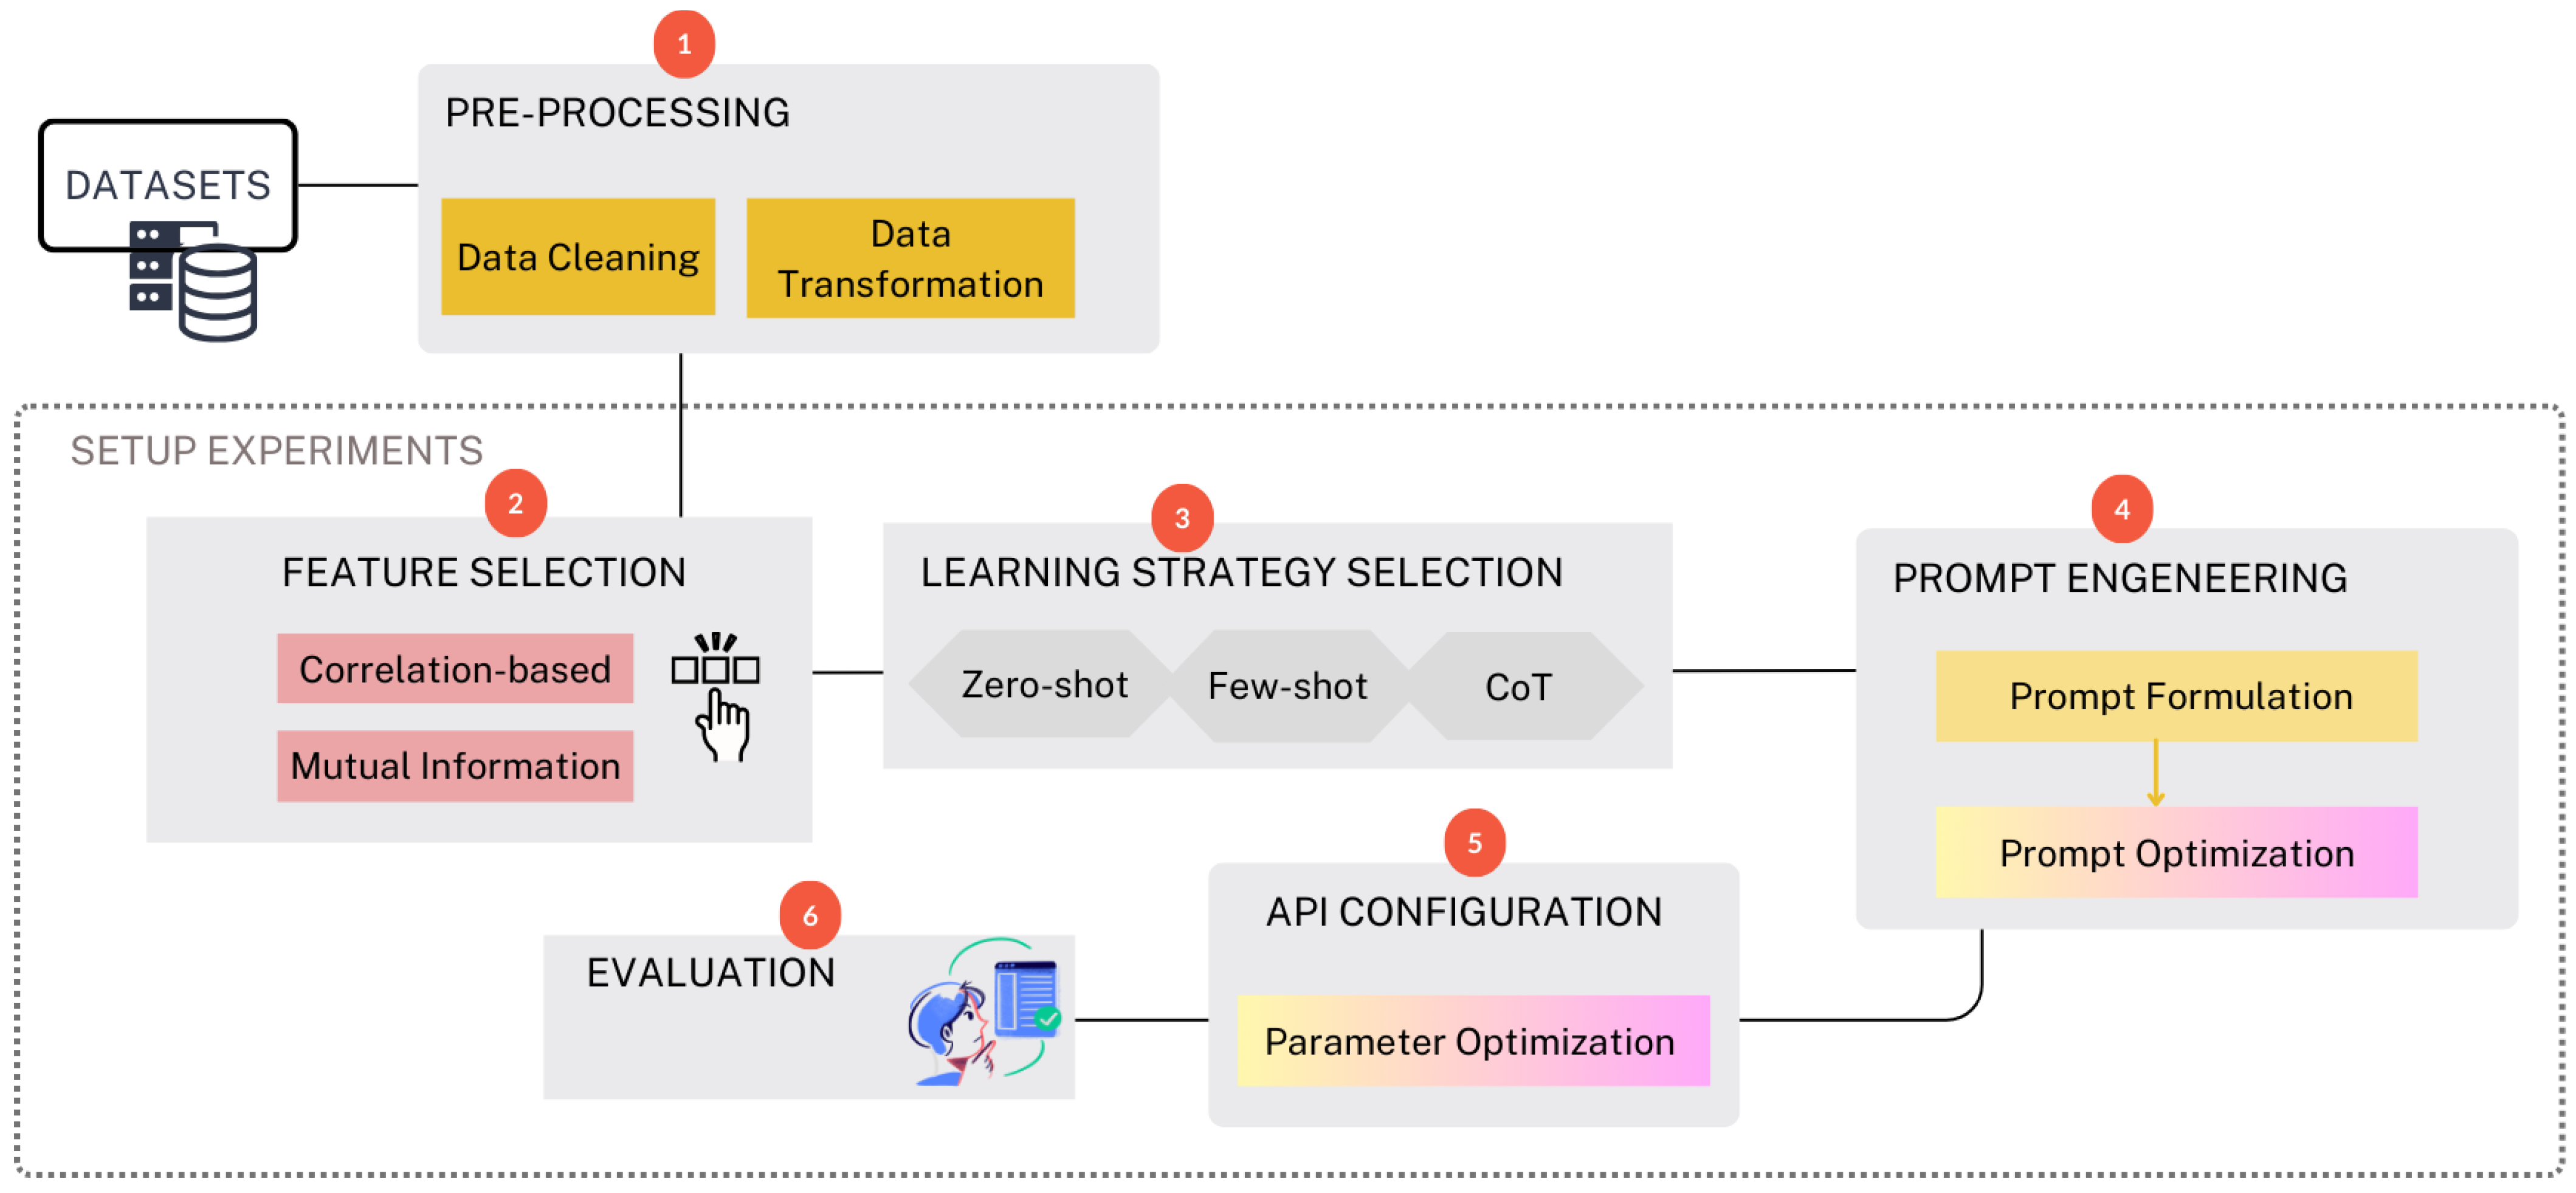
3. Methodology
3.1. Dataset
3.1.1. Diabetes Dataset
3.1.2. Heart Disease Dataset
3.2. Data Pre-Processing
3.3. Experiments
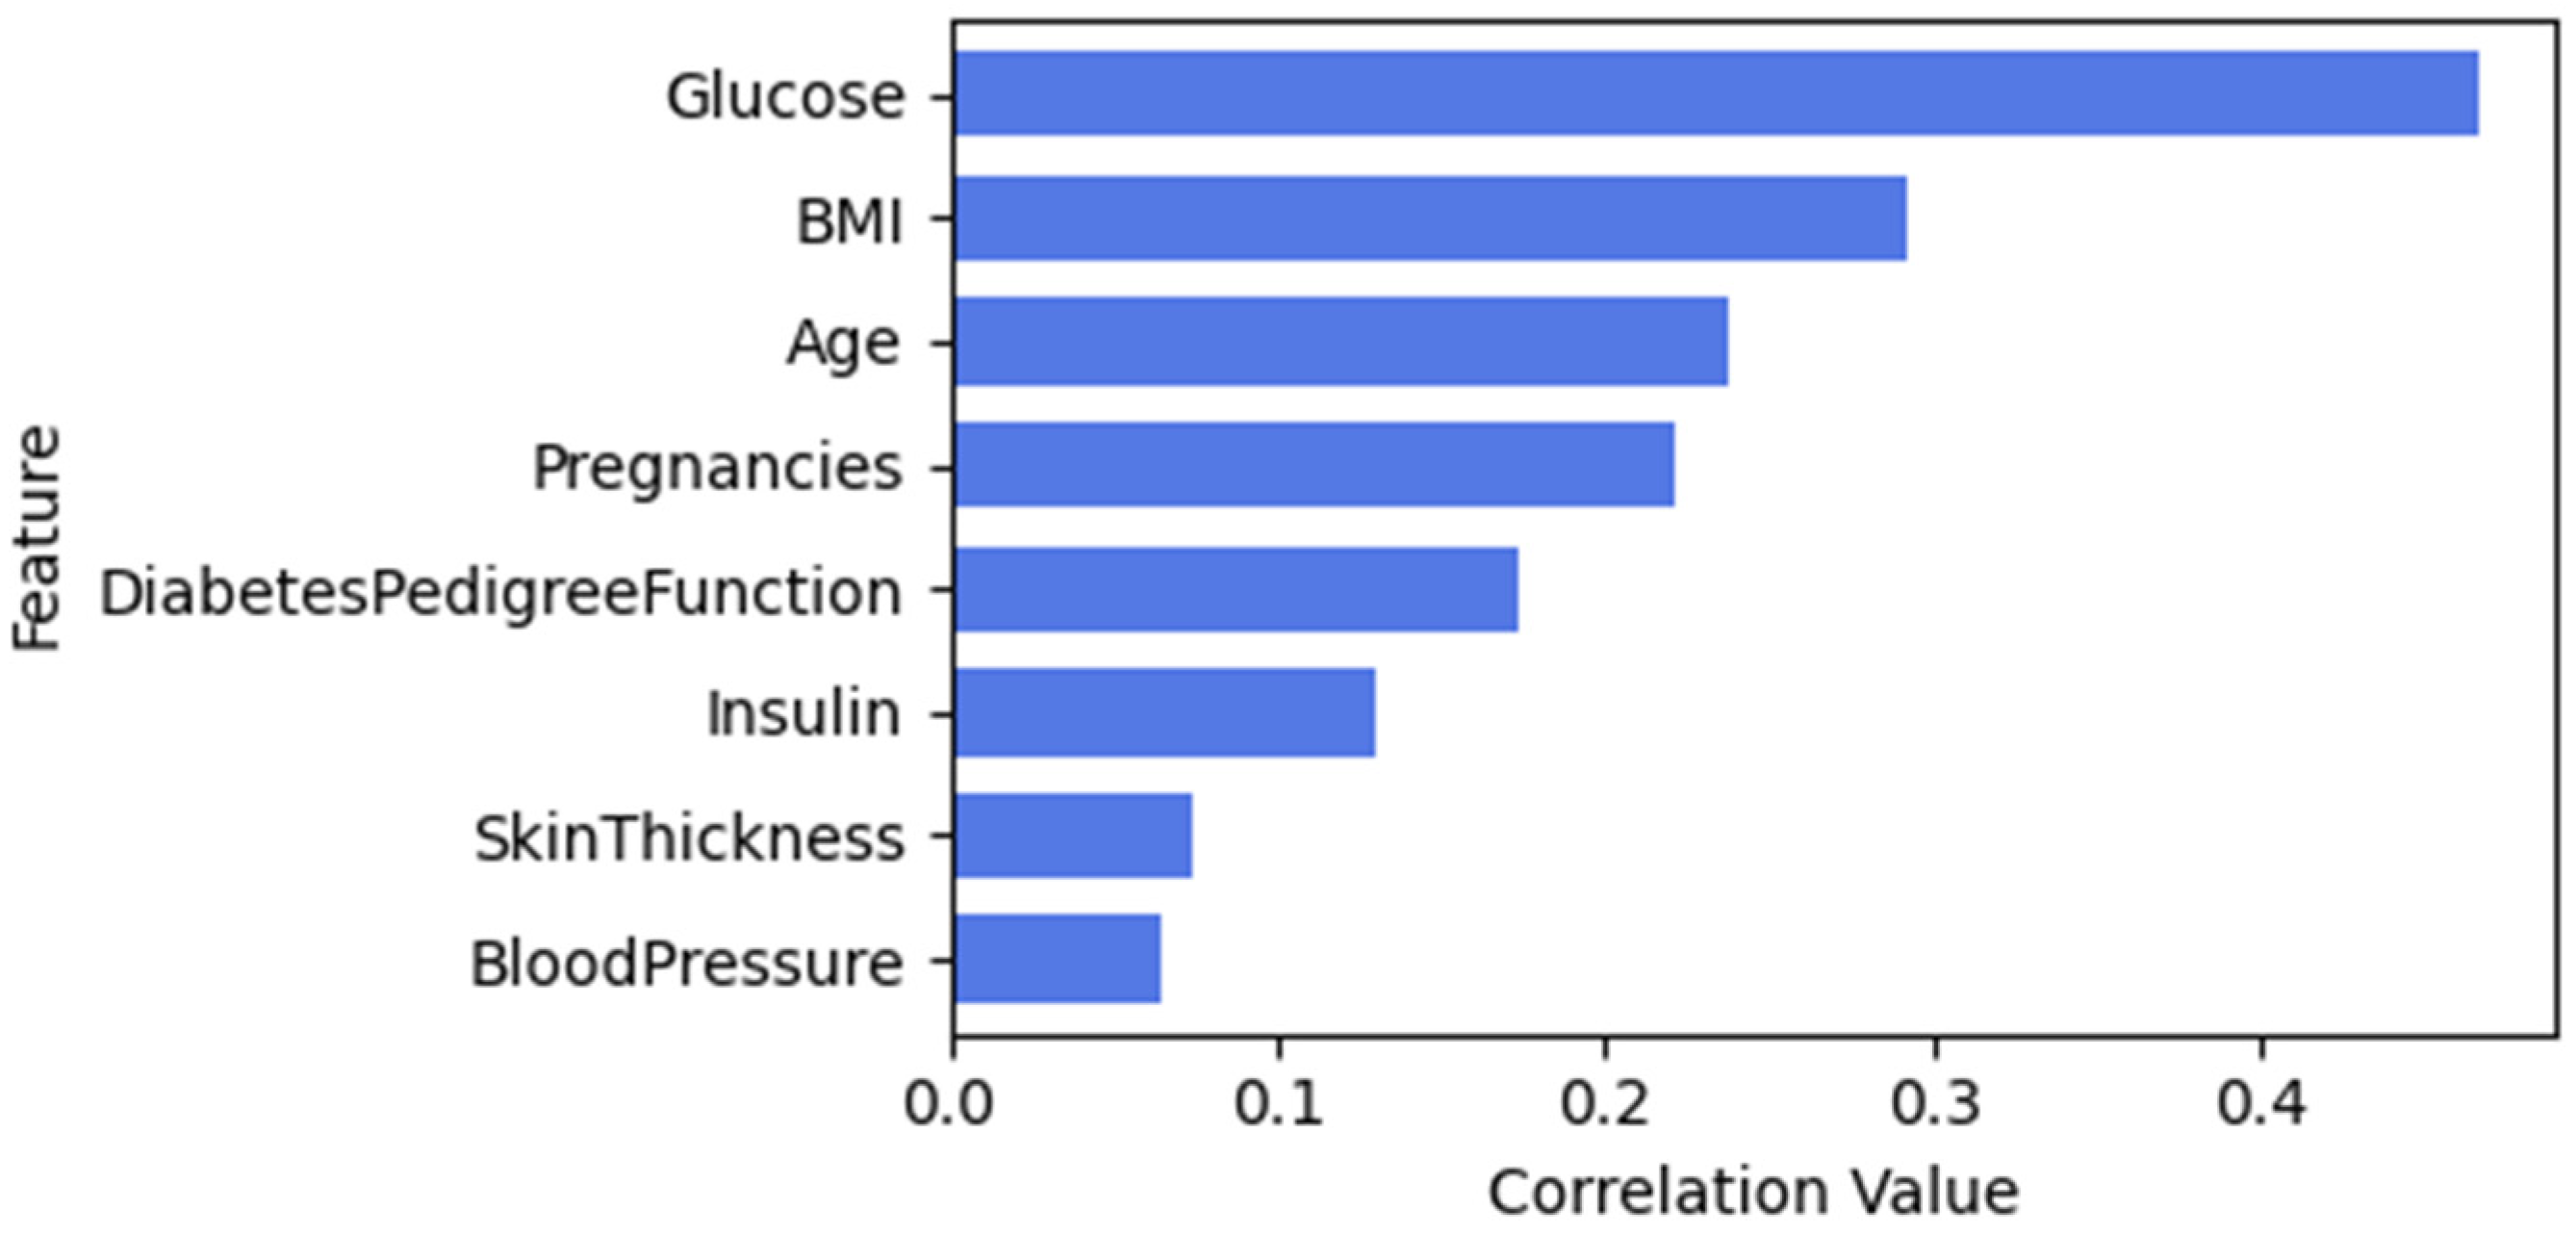
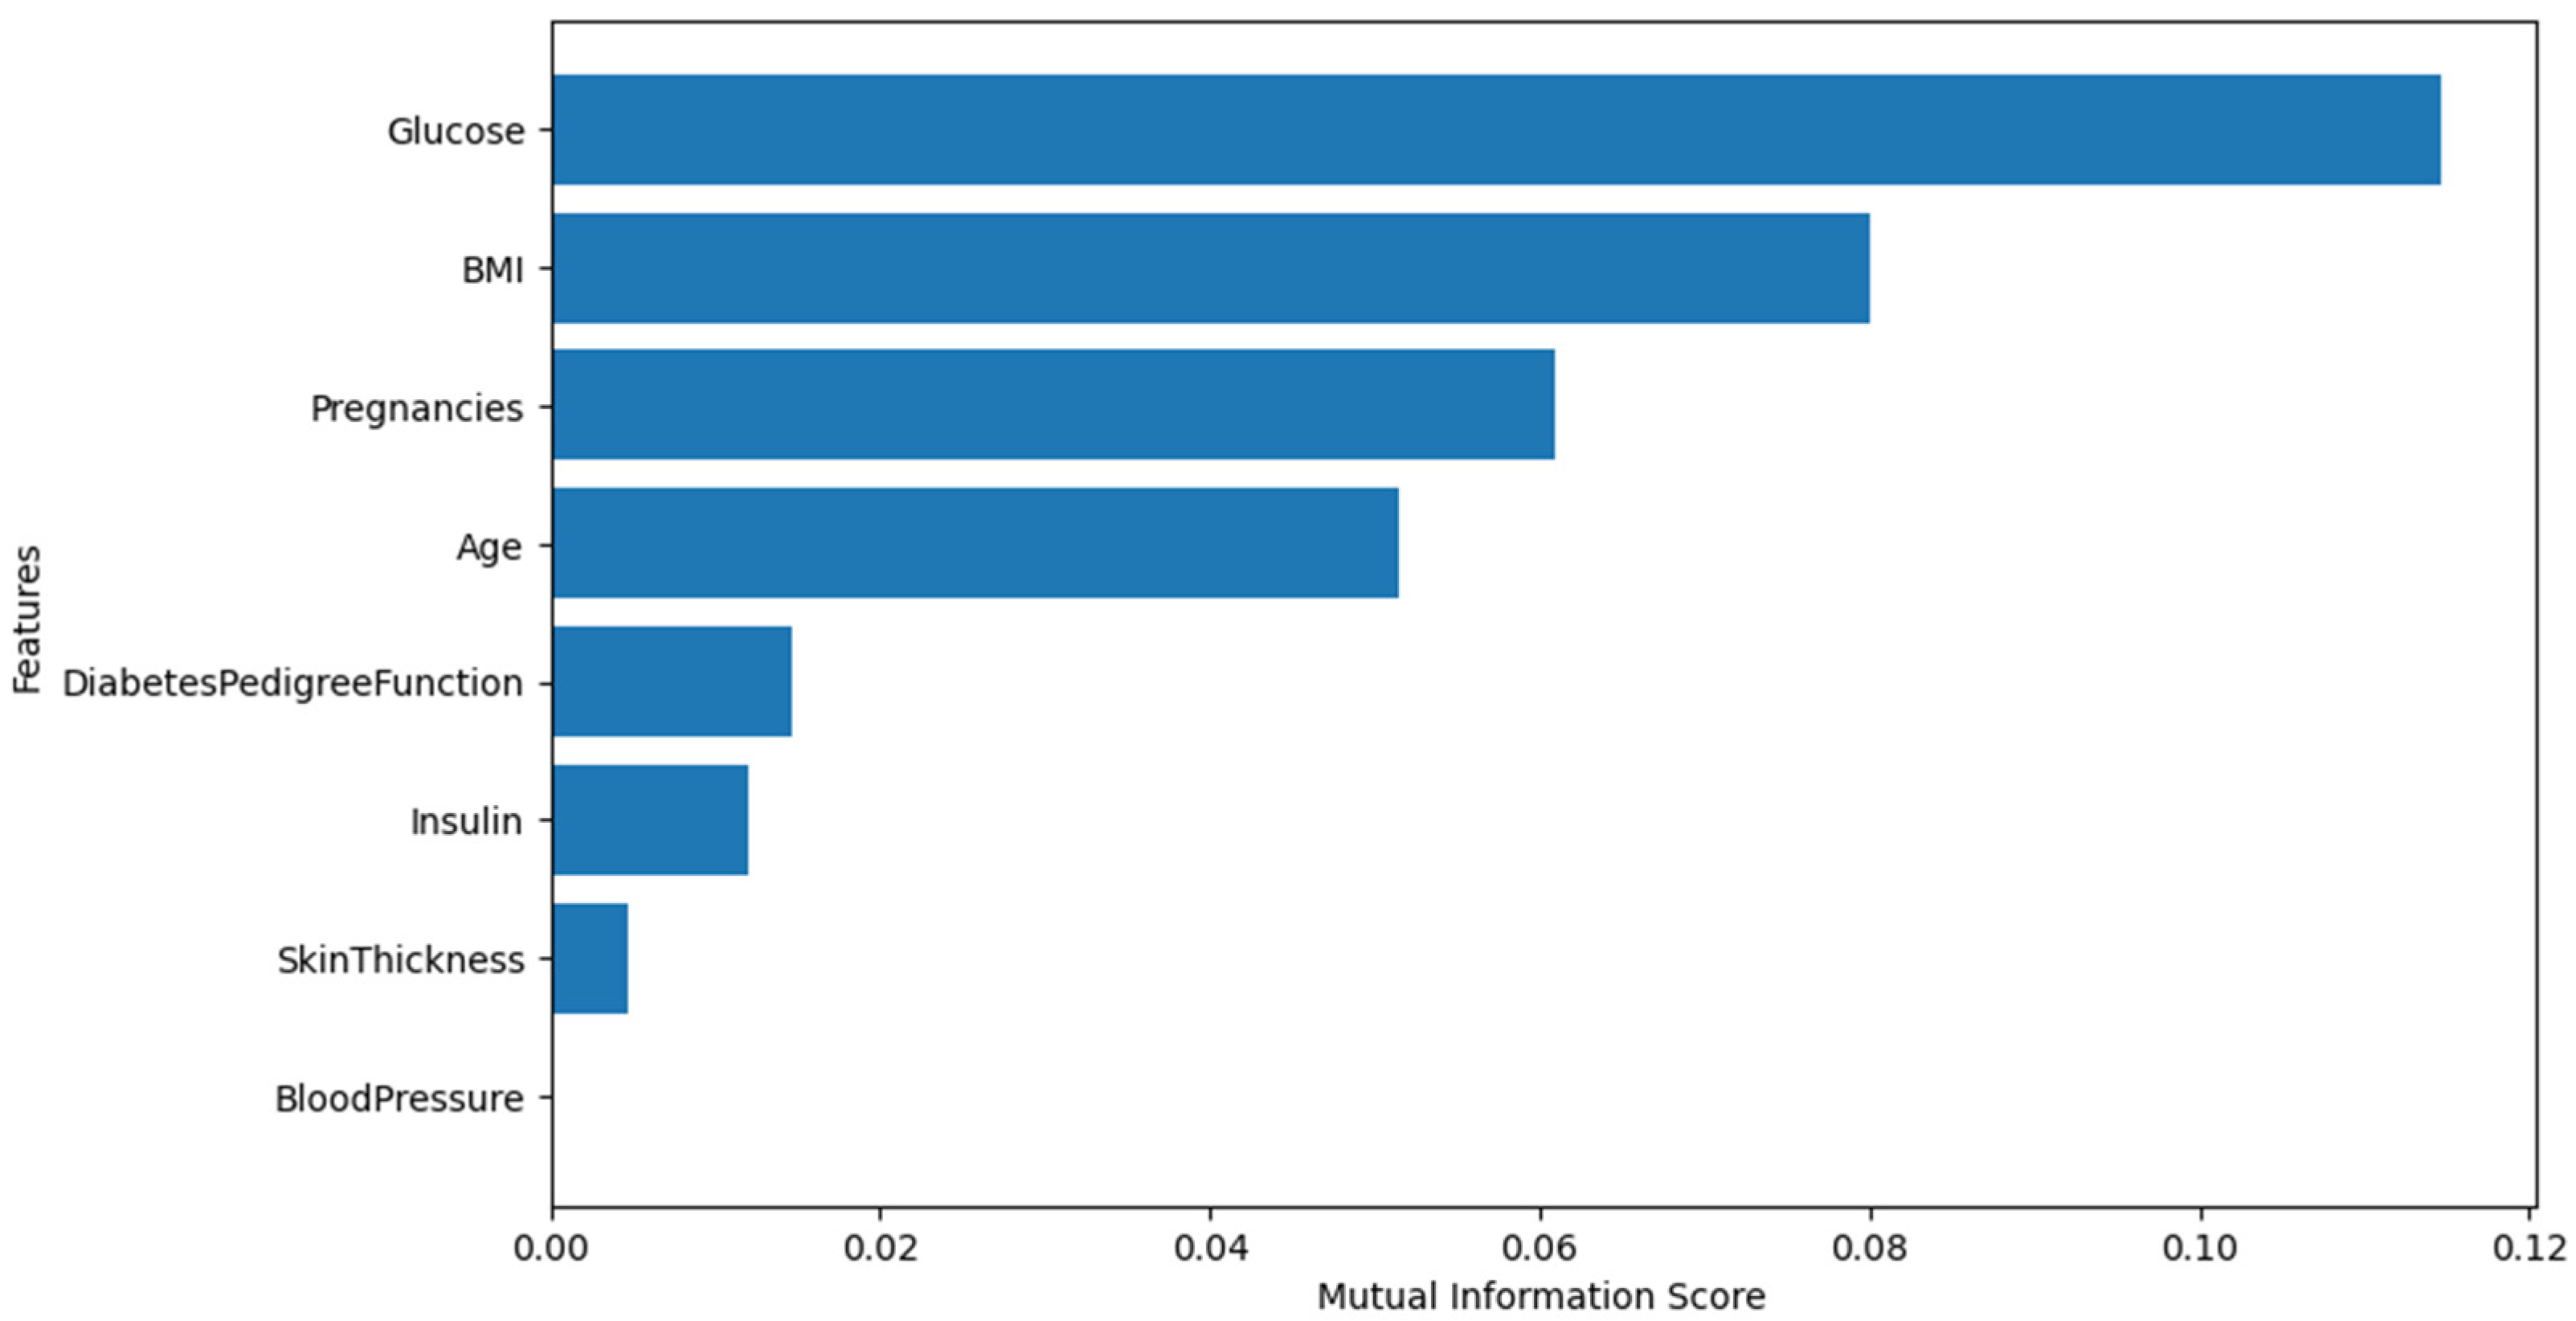
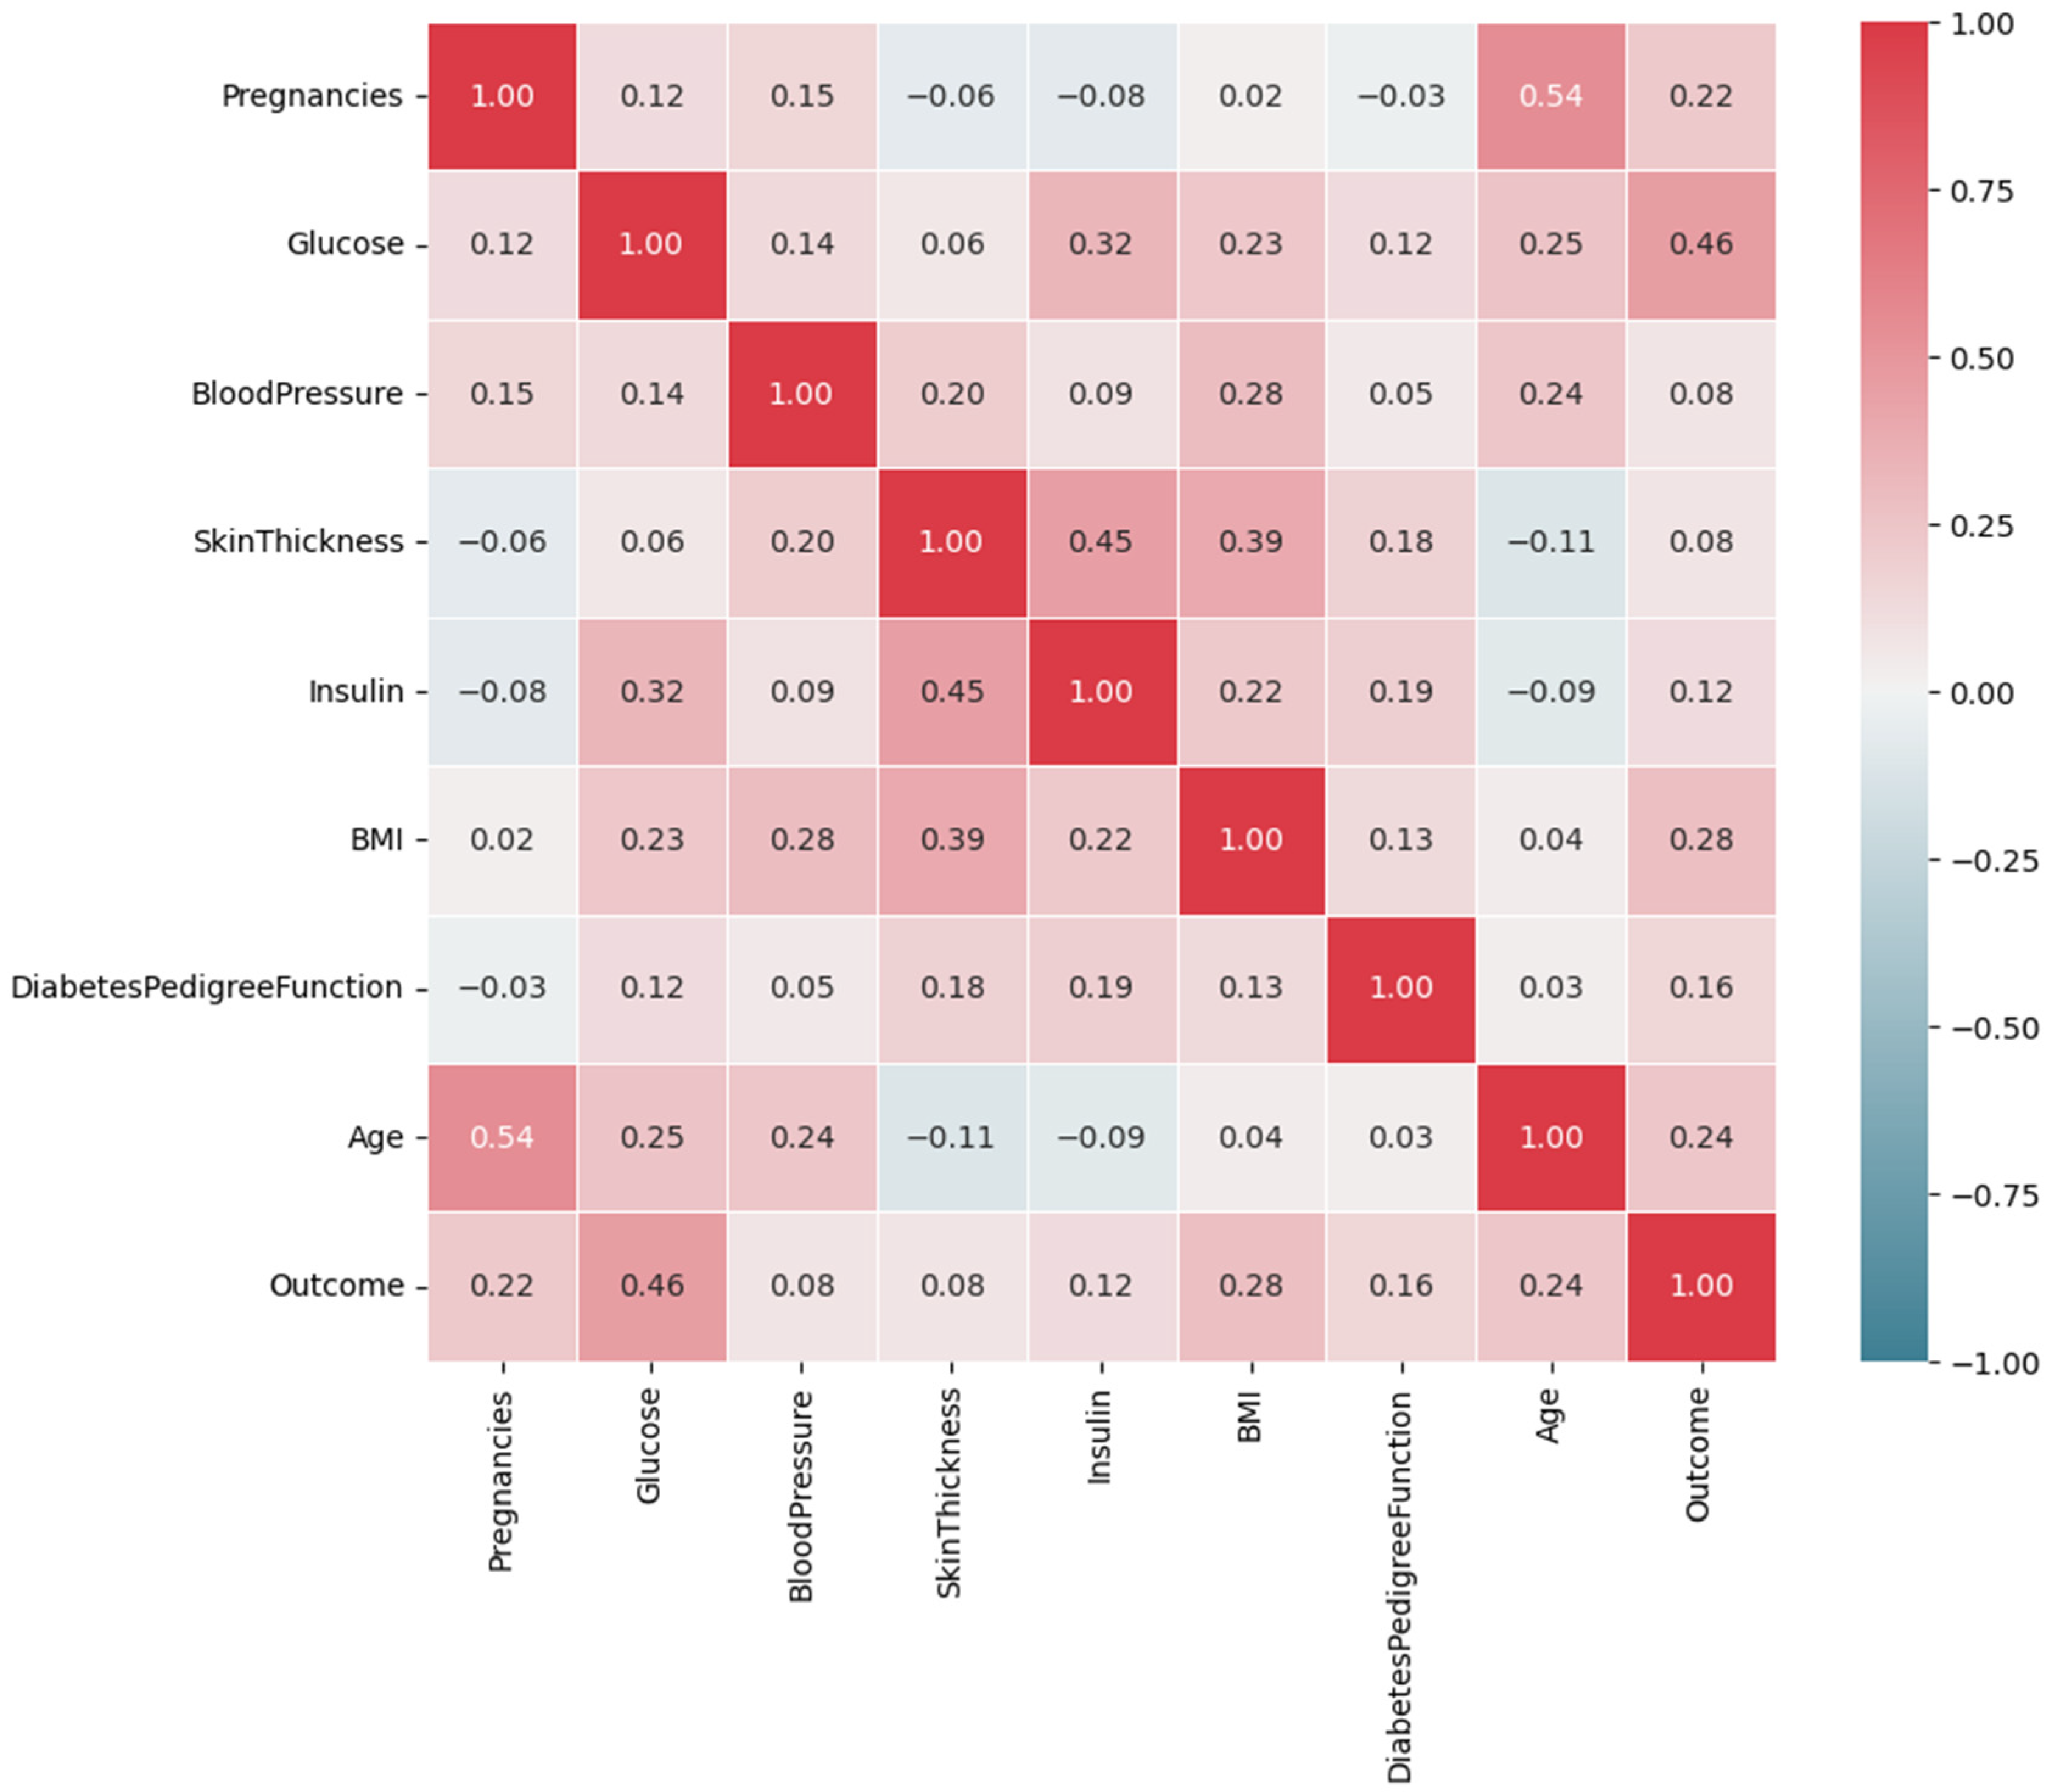
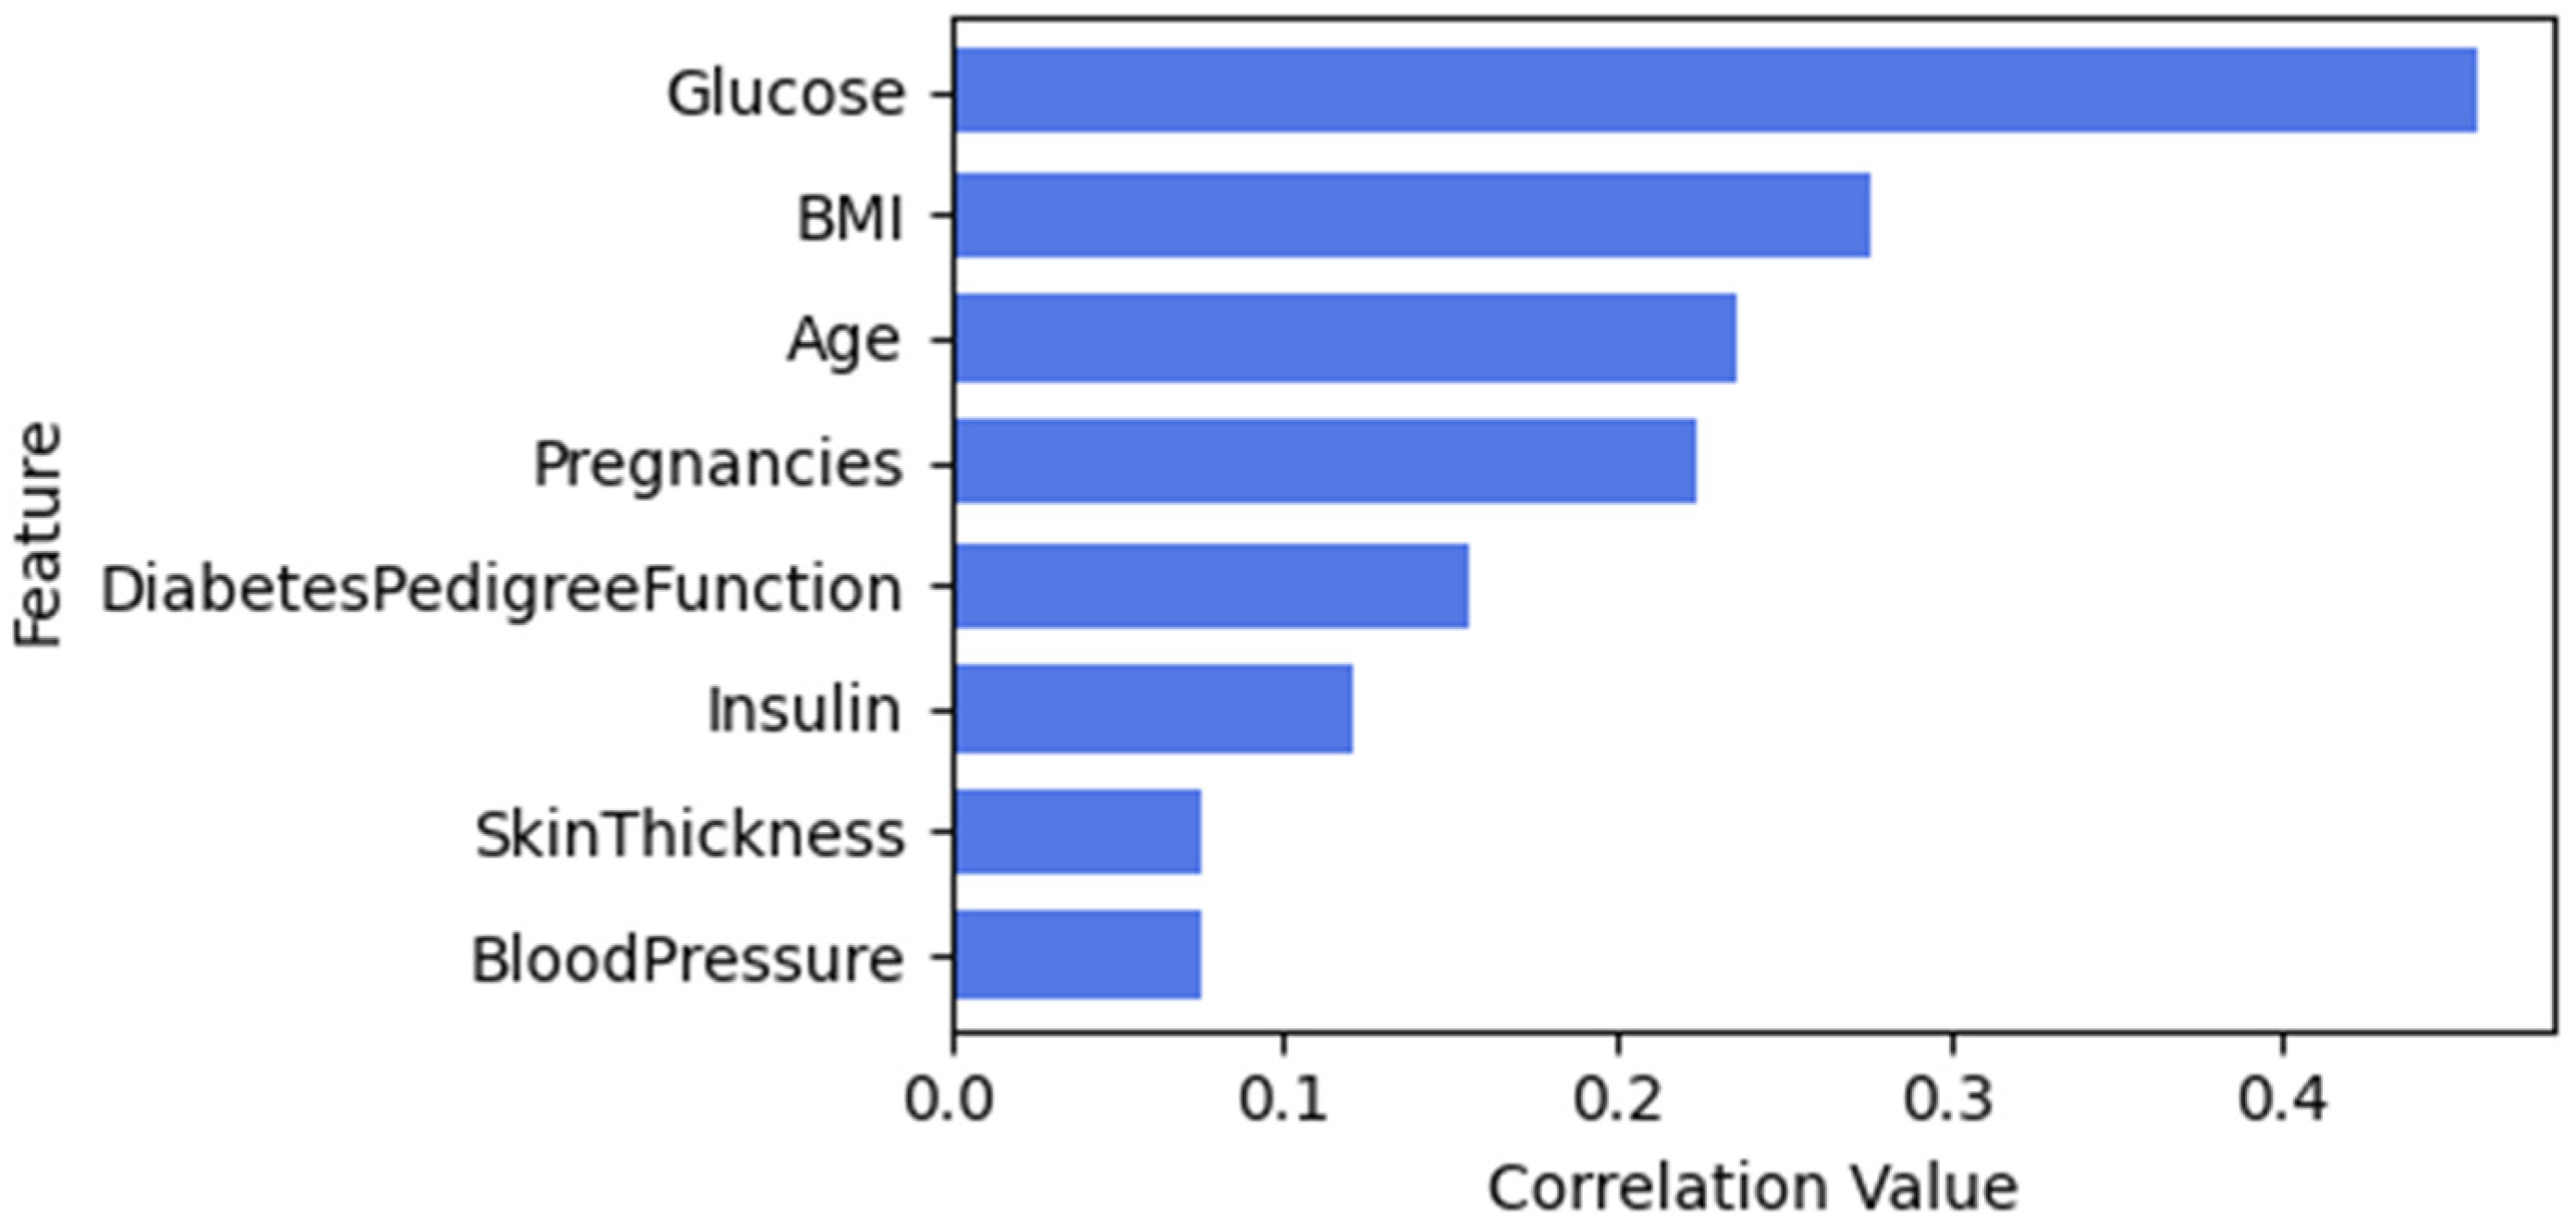
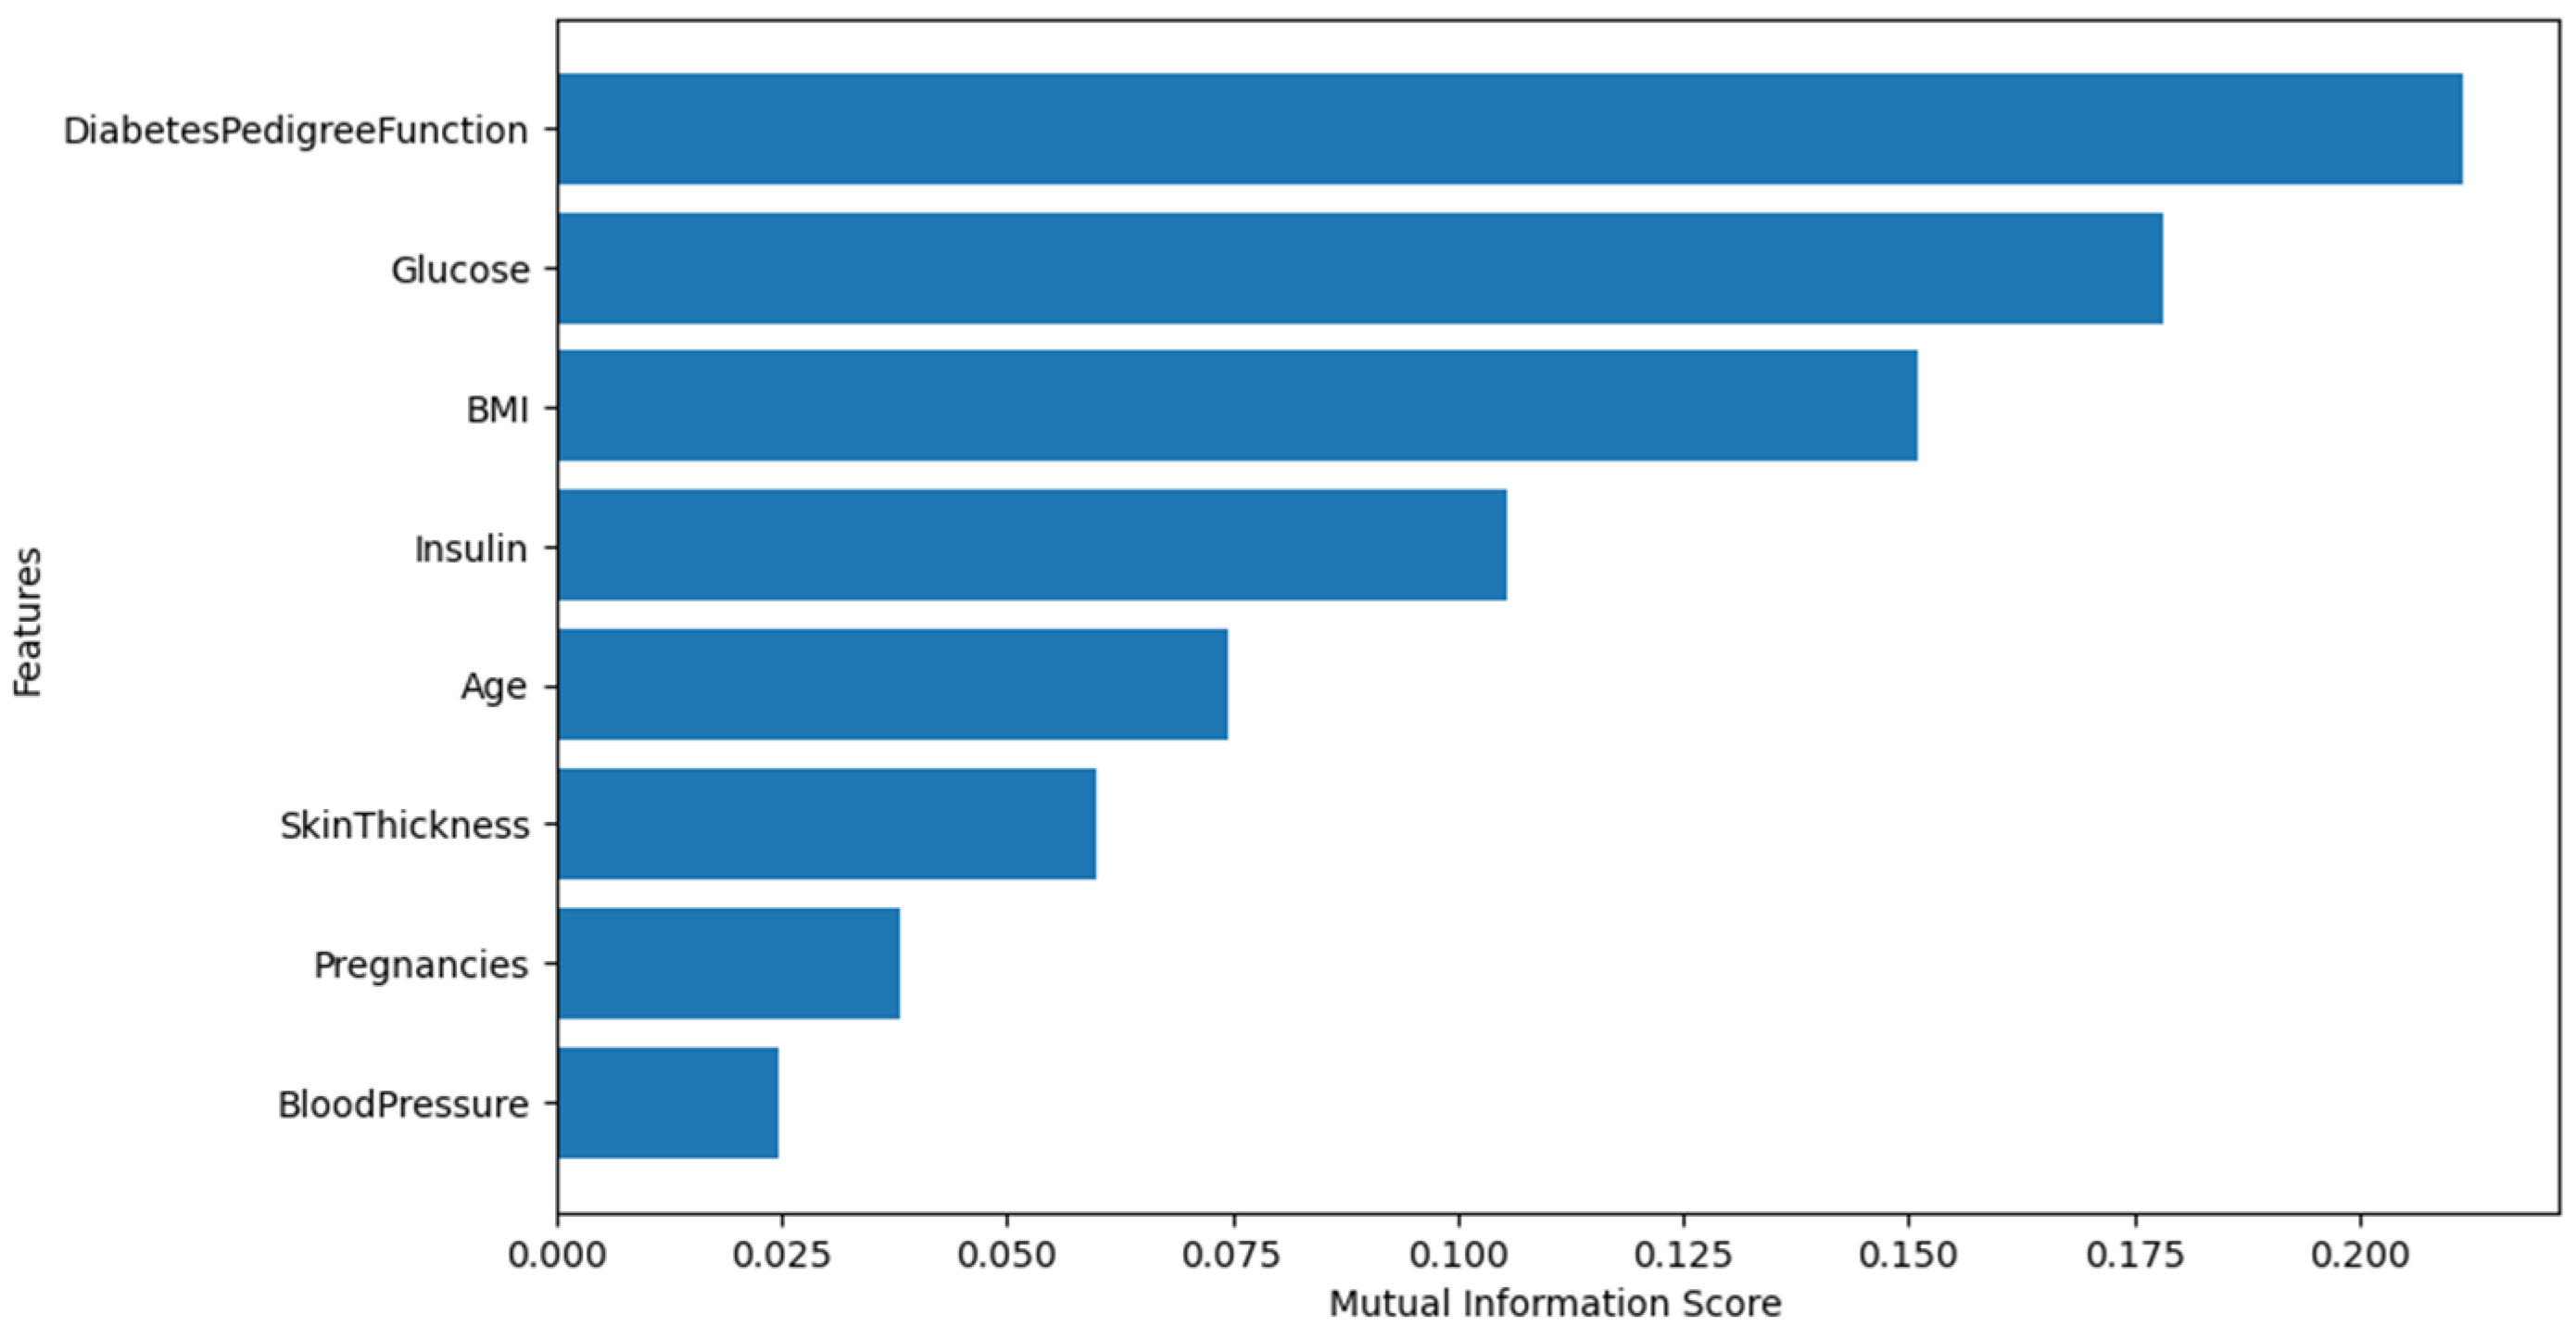
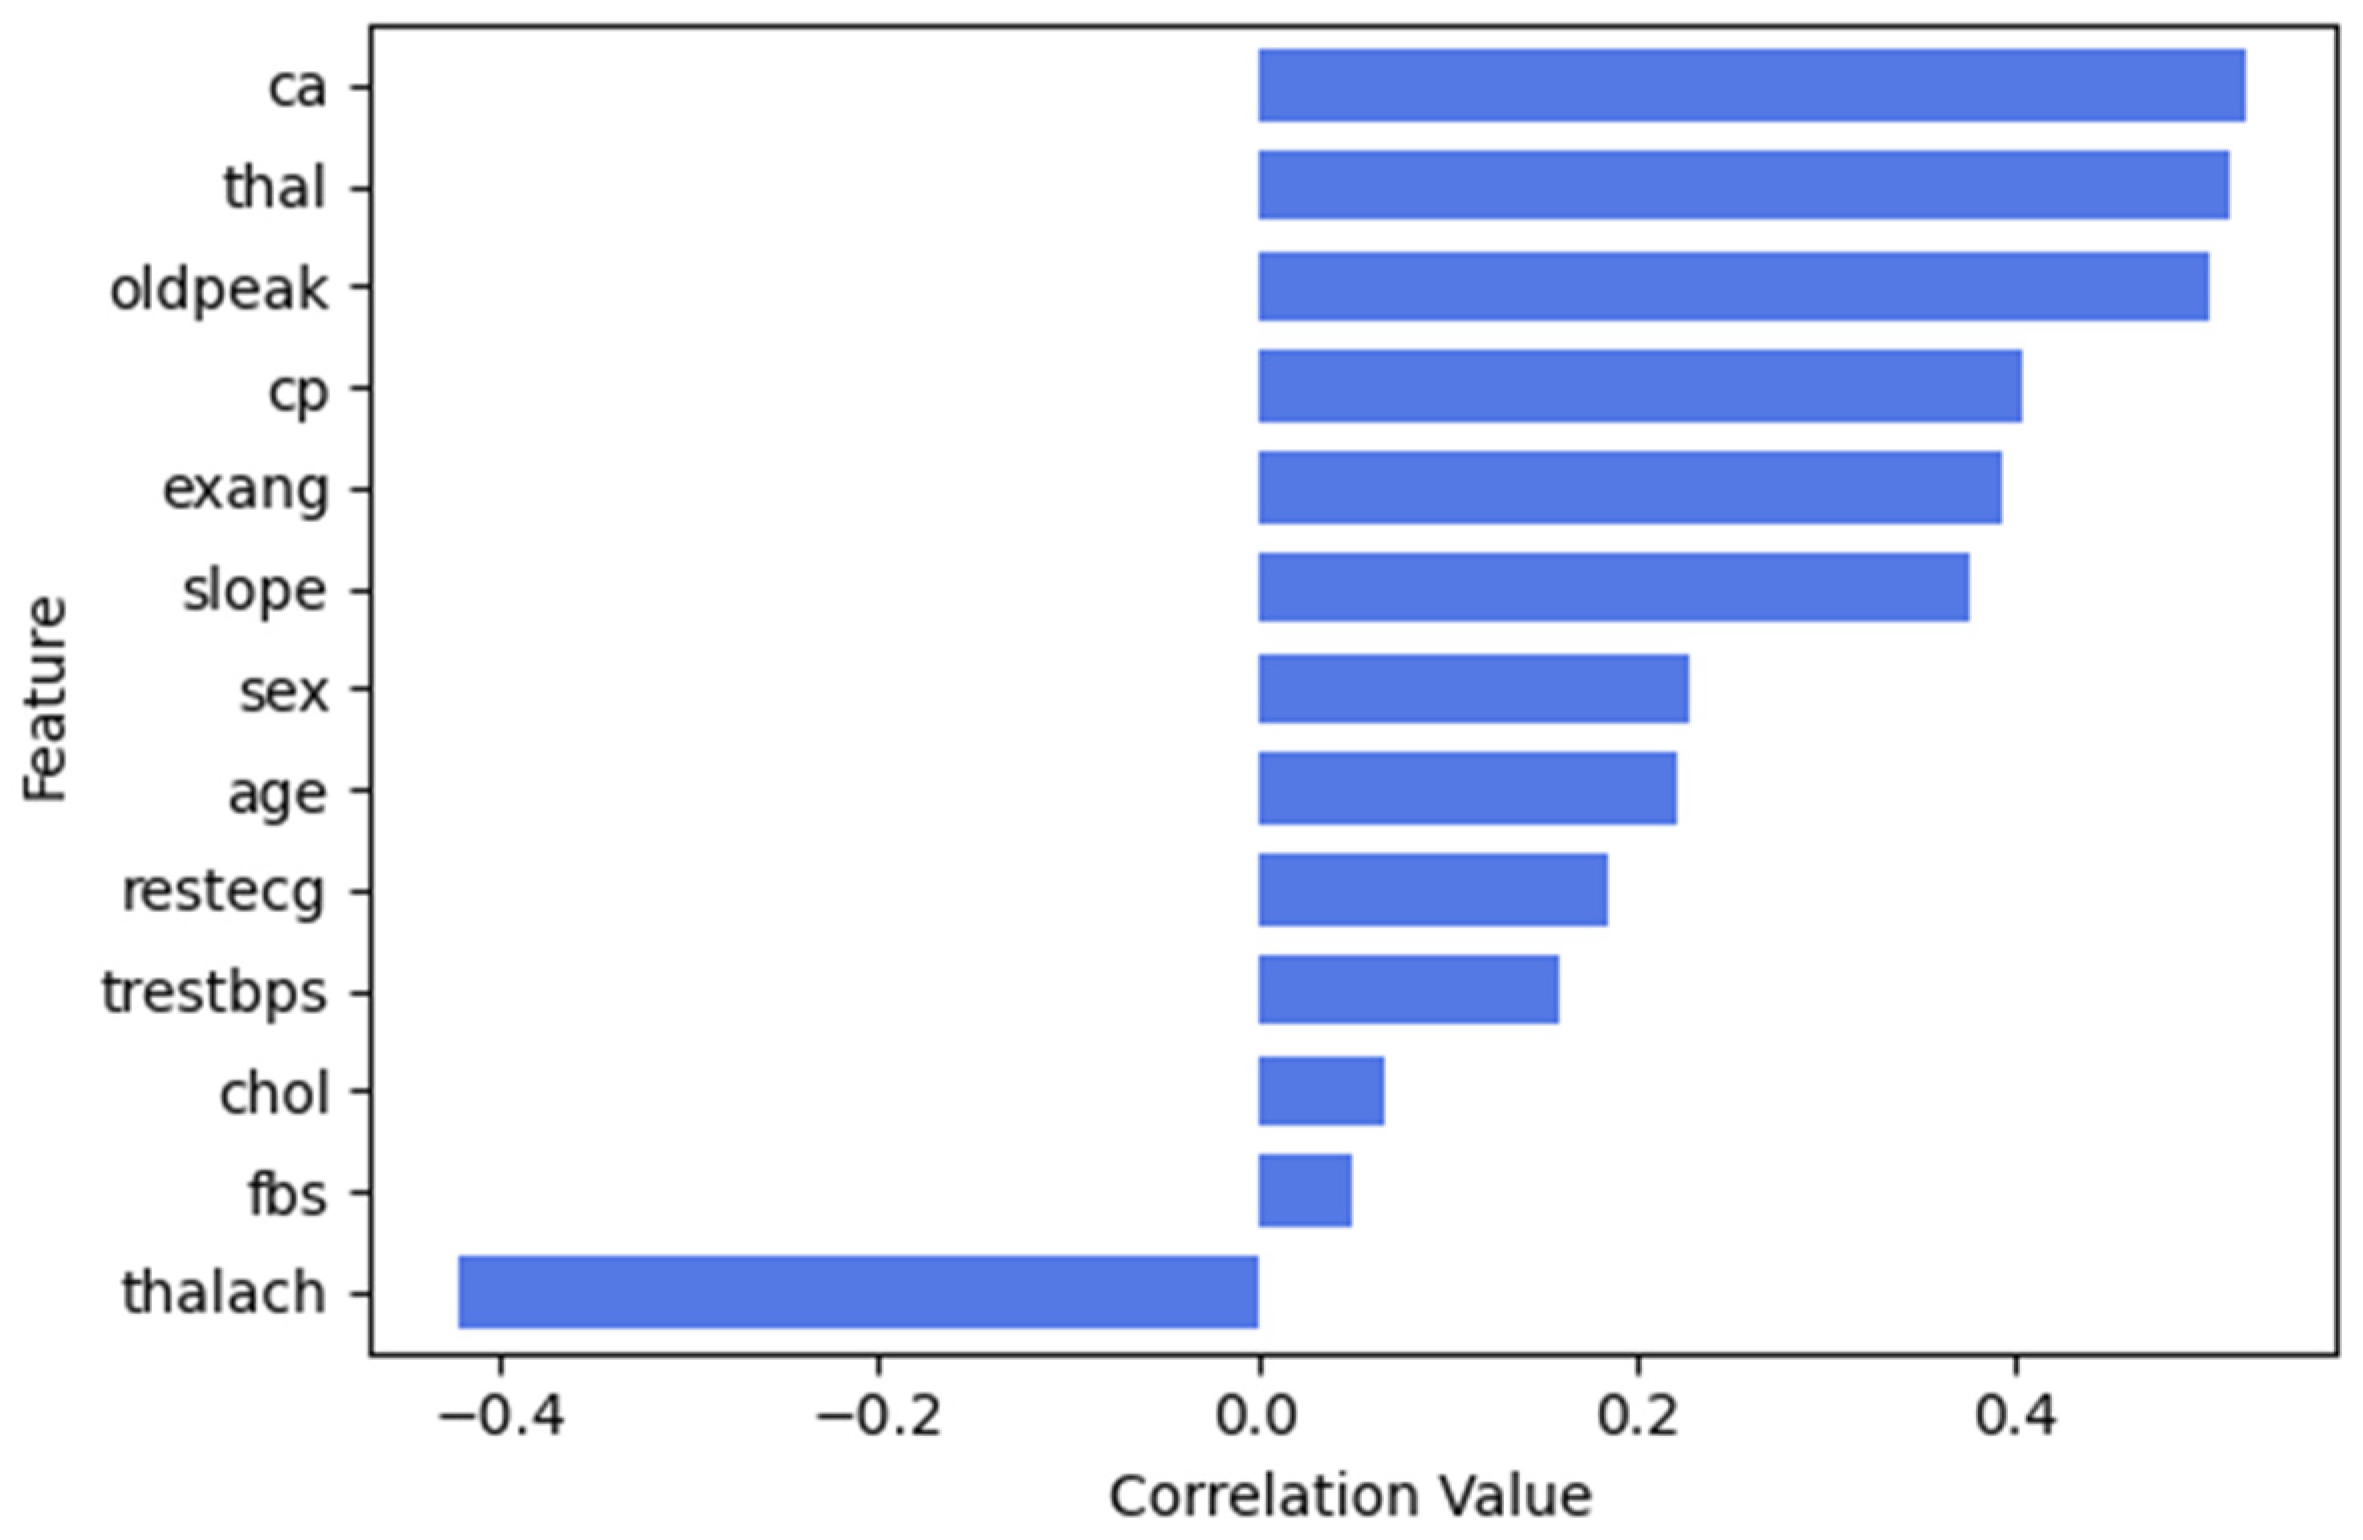
3.3.1. Feature Selection
Pima Indian Diabetes Dataset (PIDD)
Frankfurt Hospital Diabetes Dataset (FHDD)
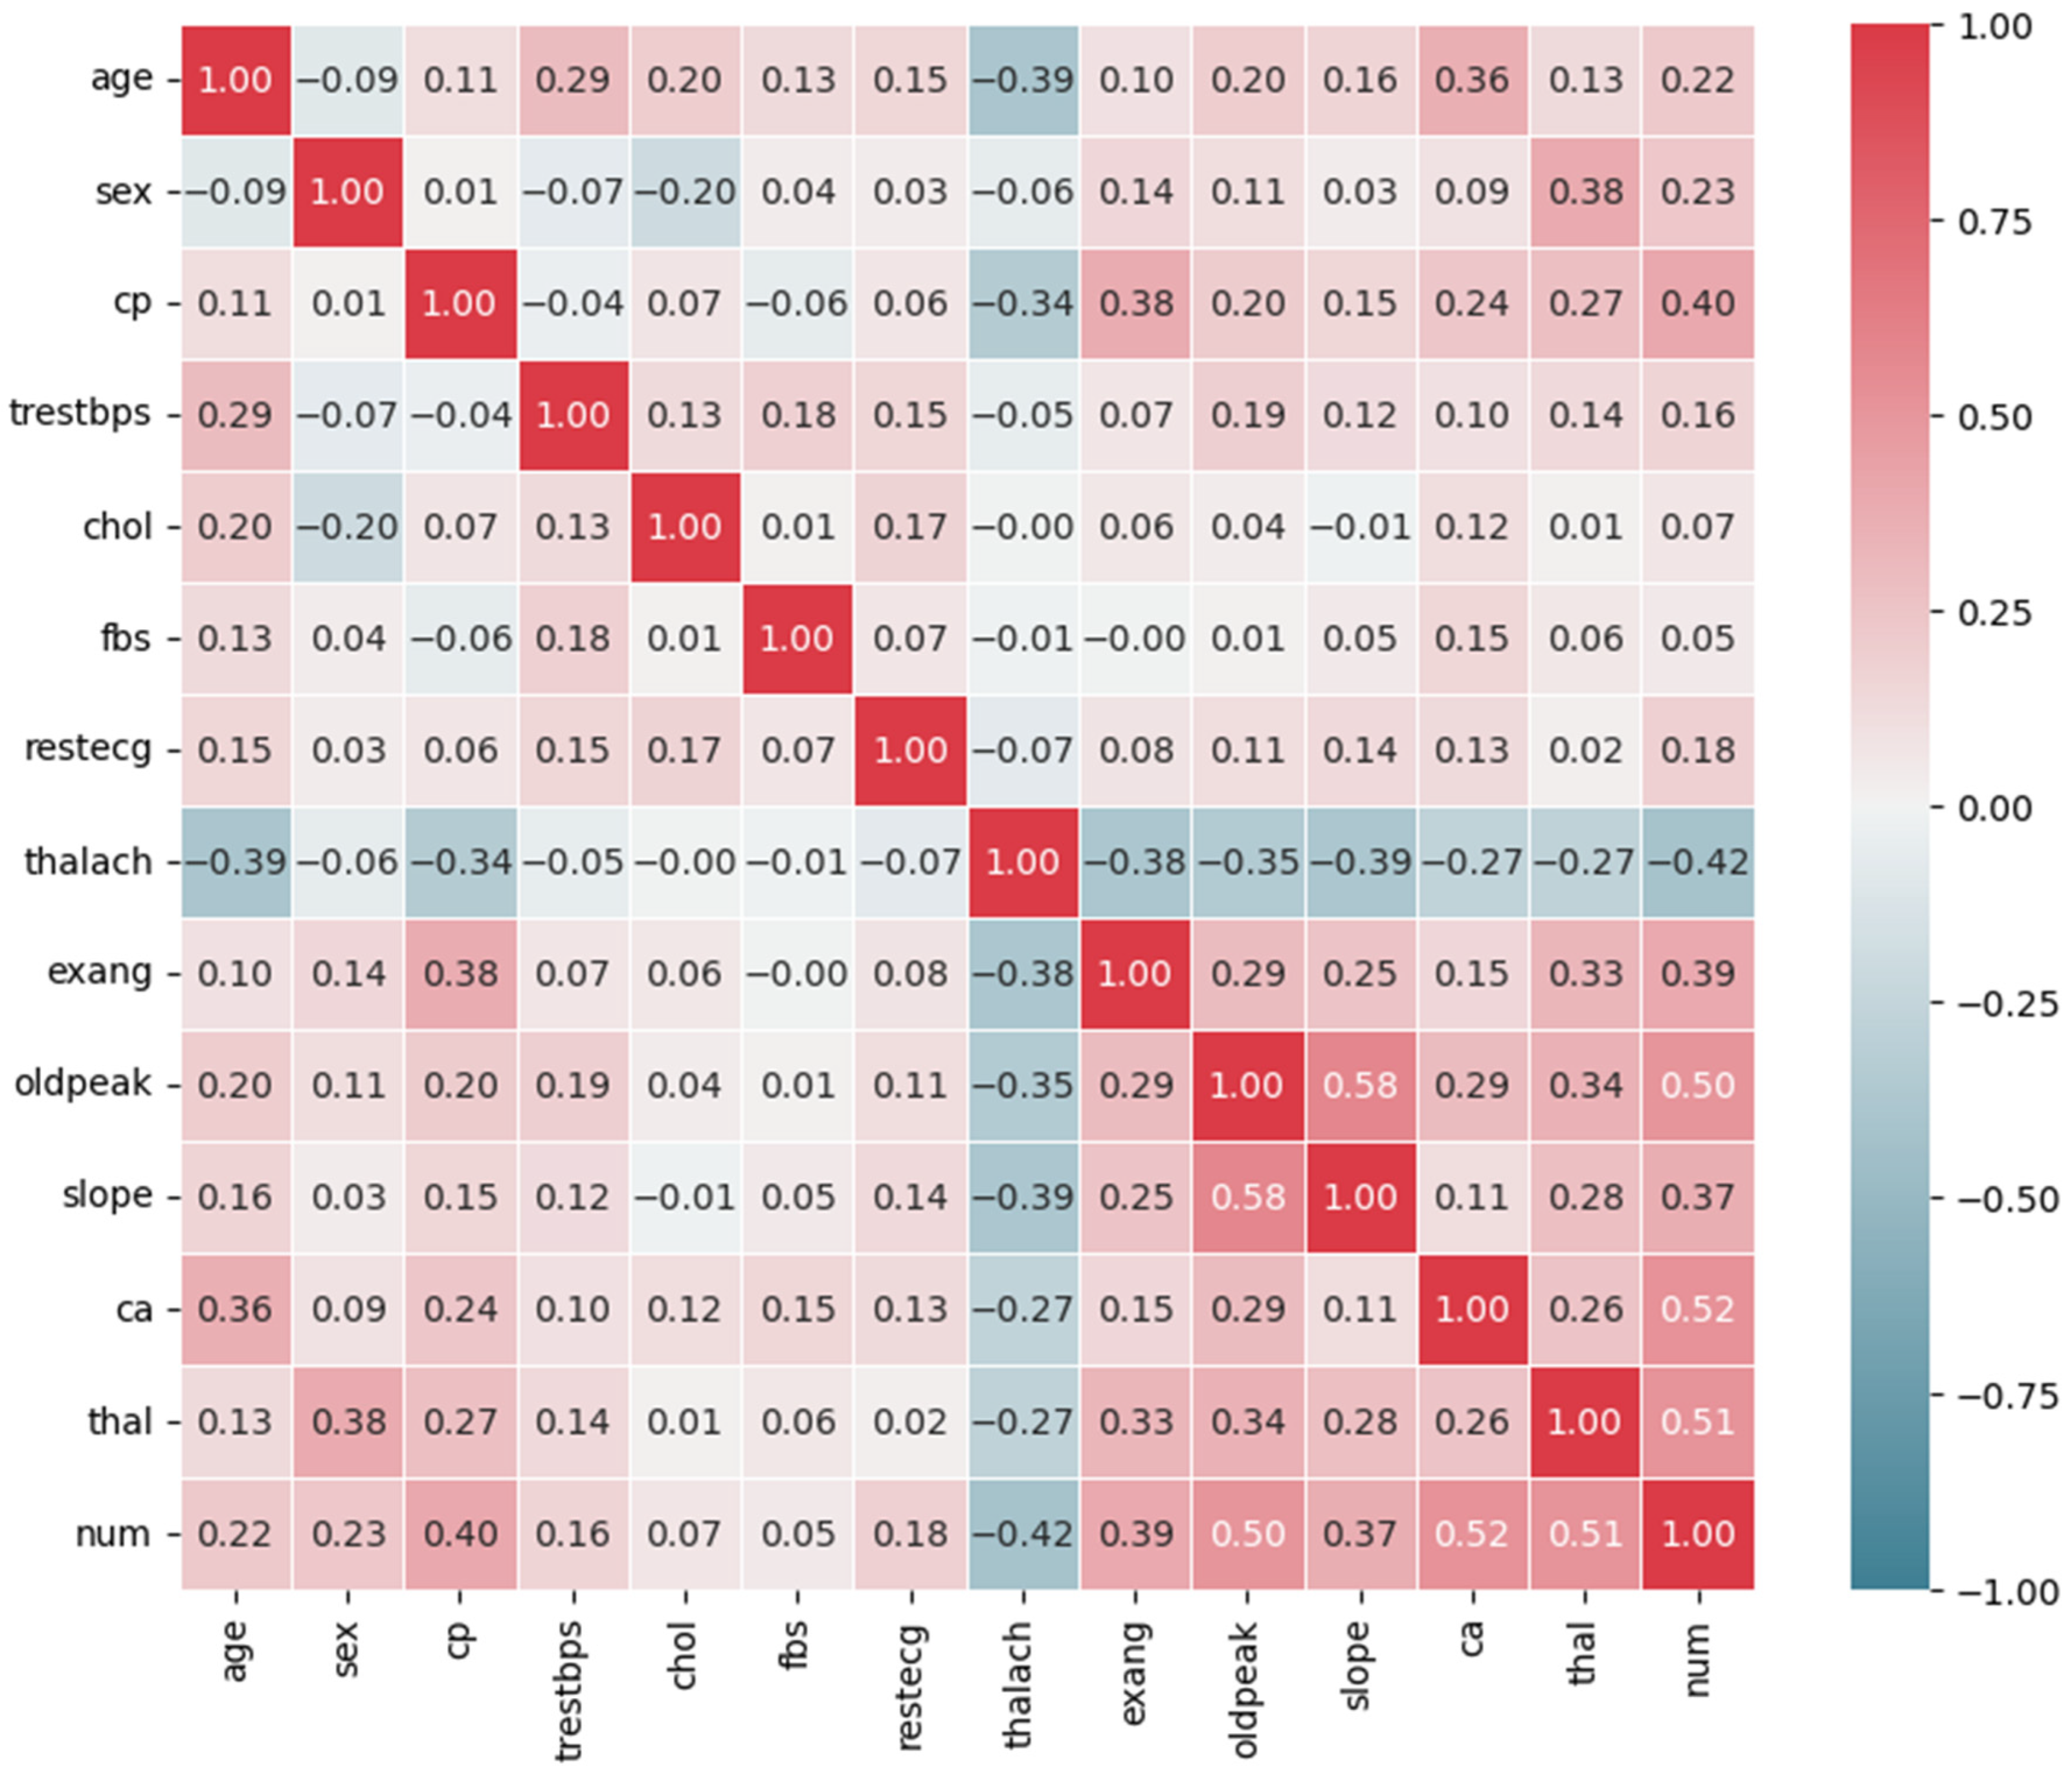
UCI Cleveland Heart Disease Dataset
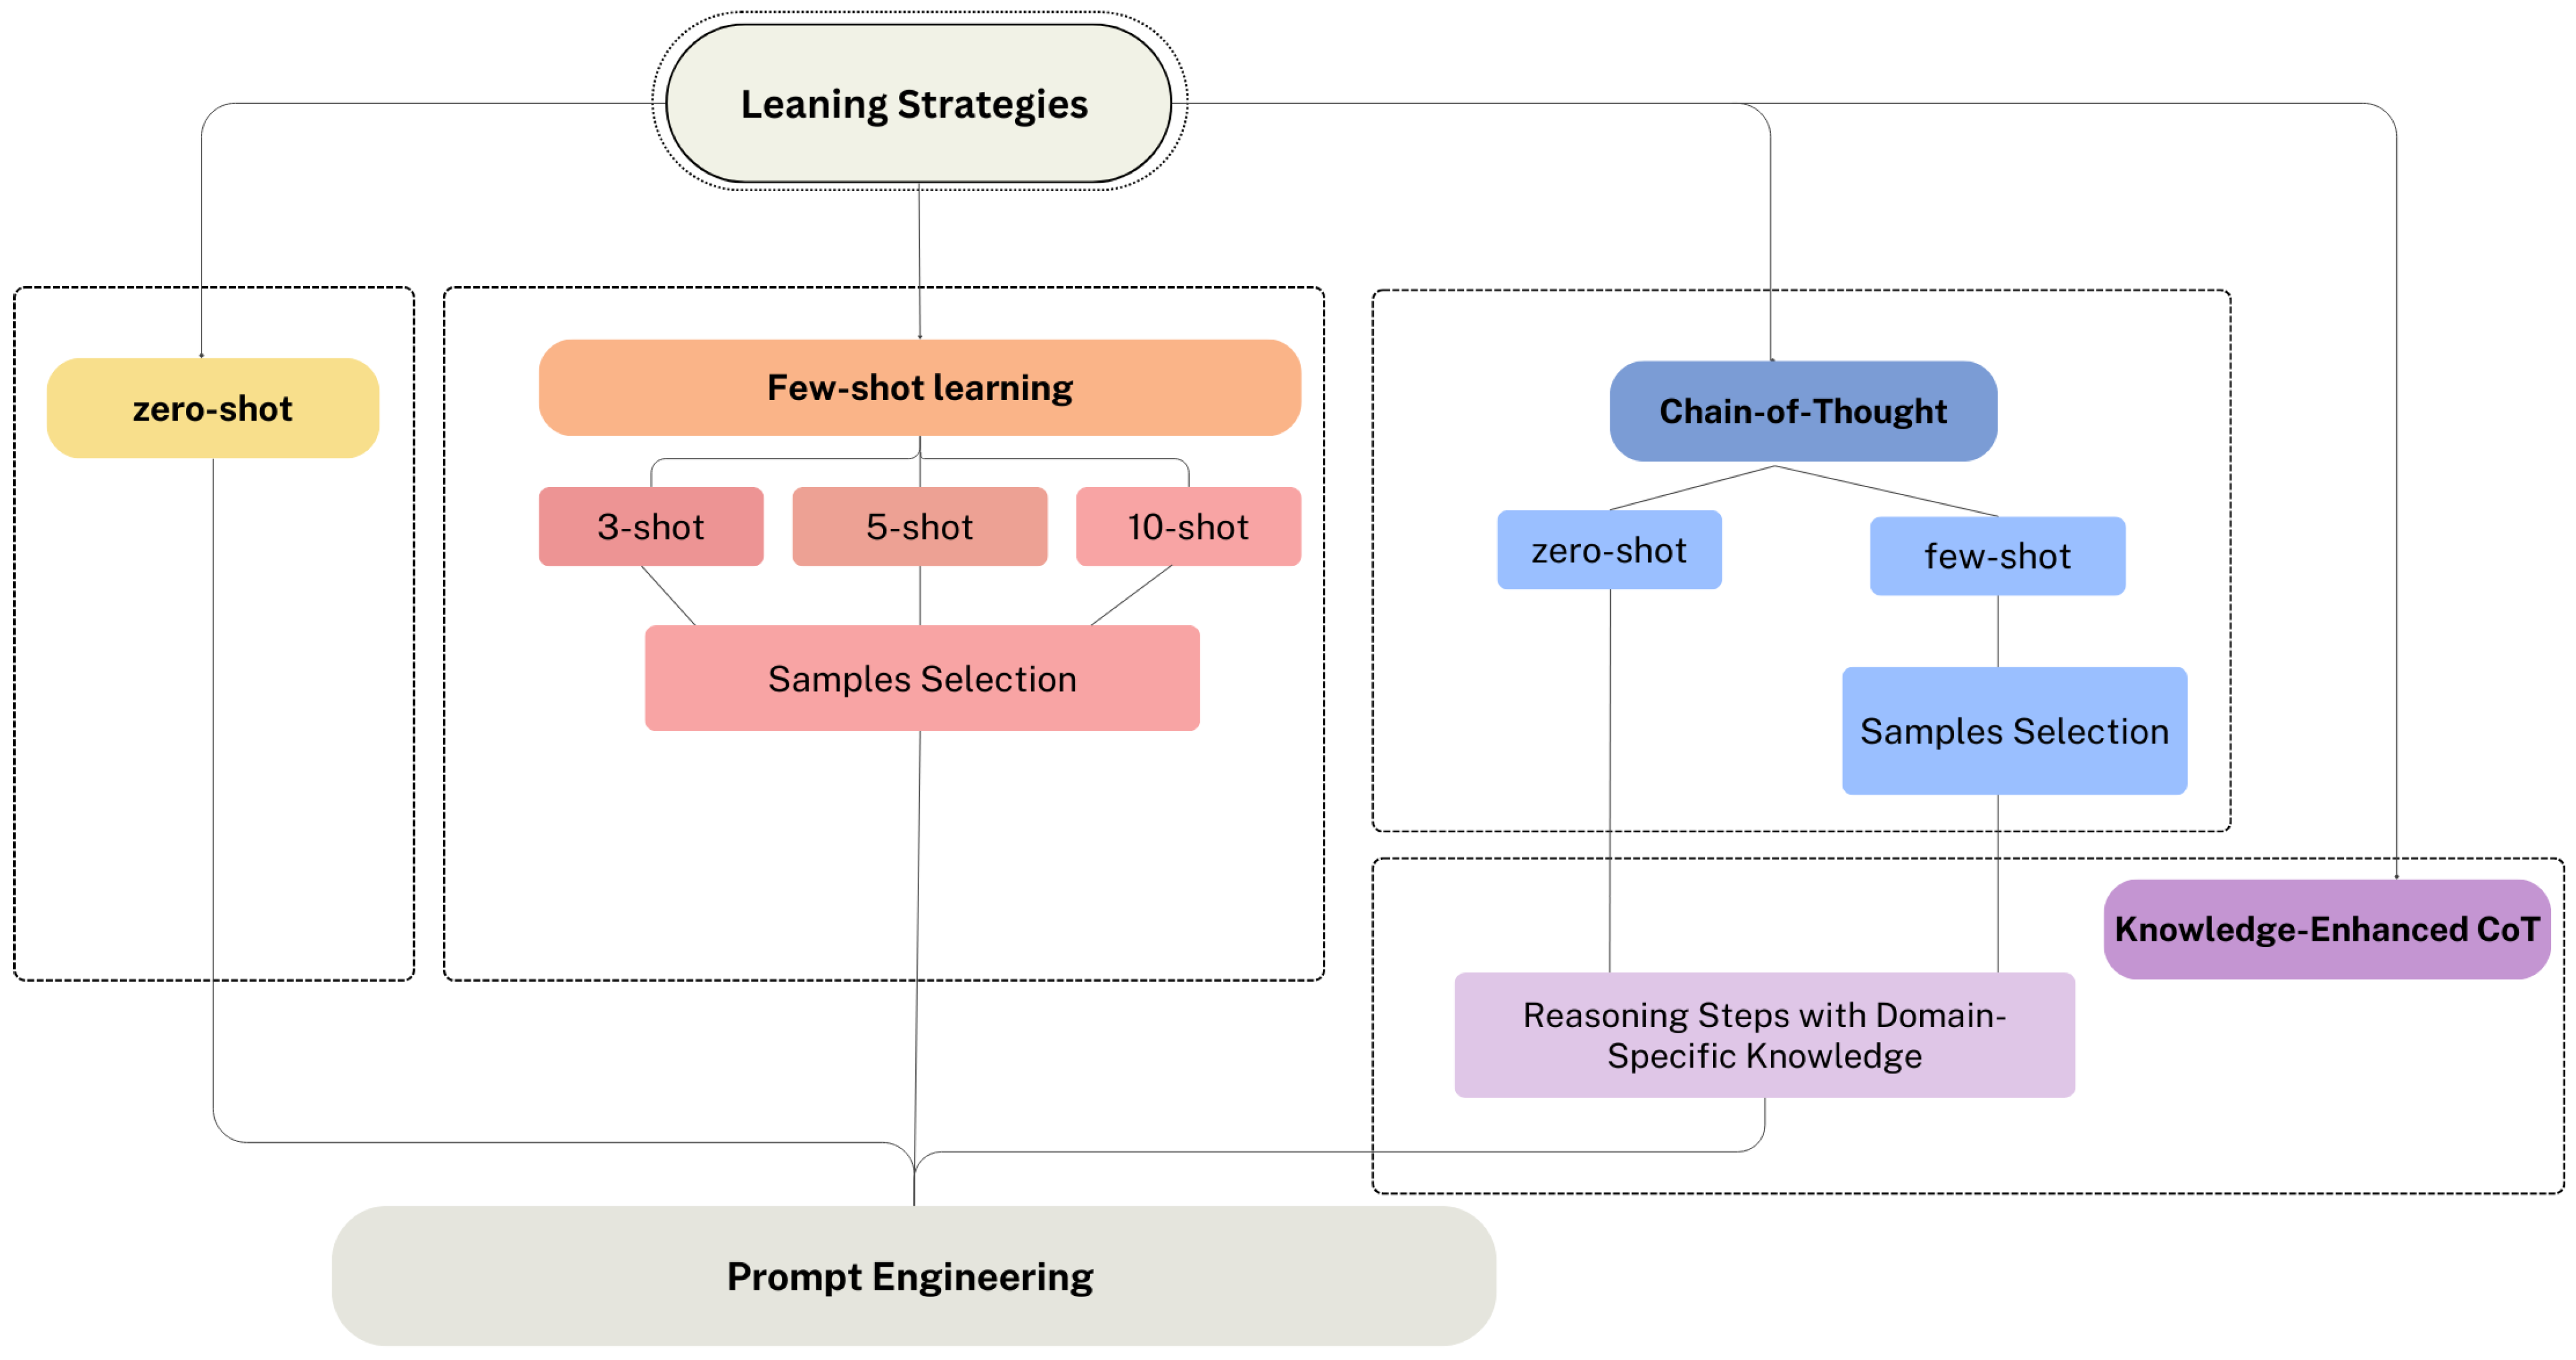
3.3.2. Learning Strategy Selection
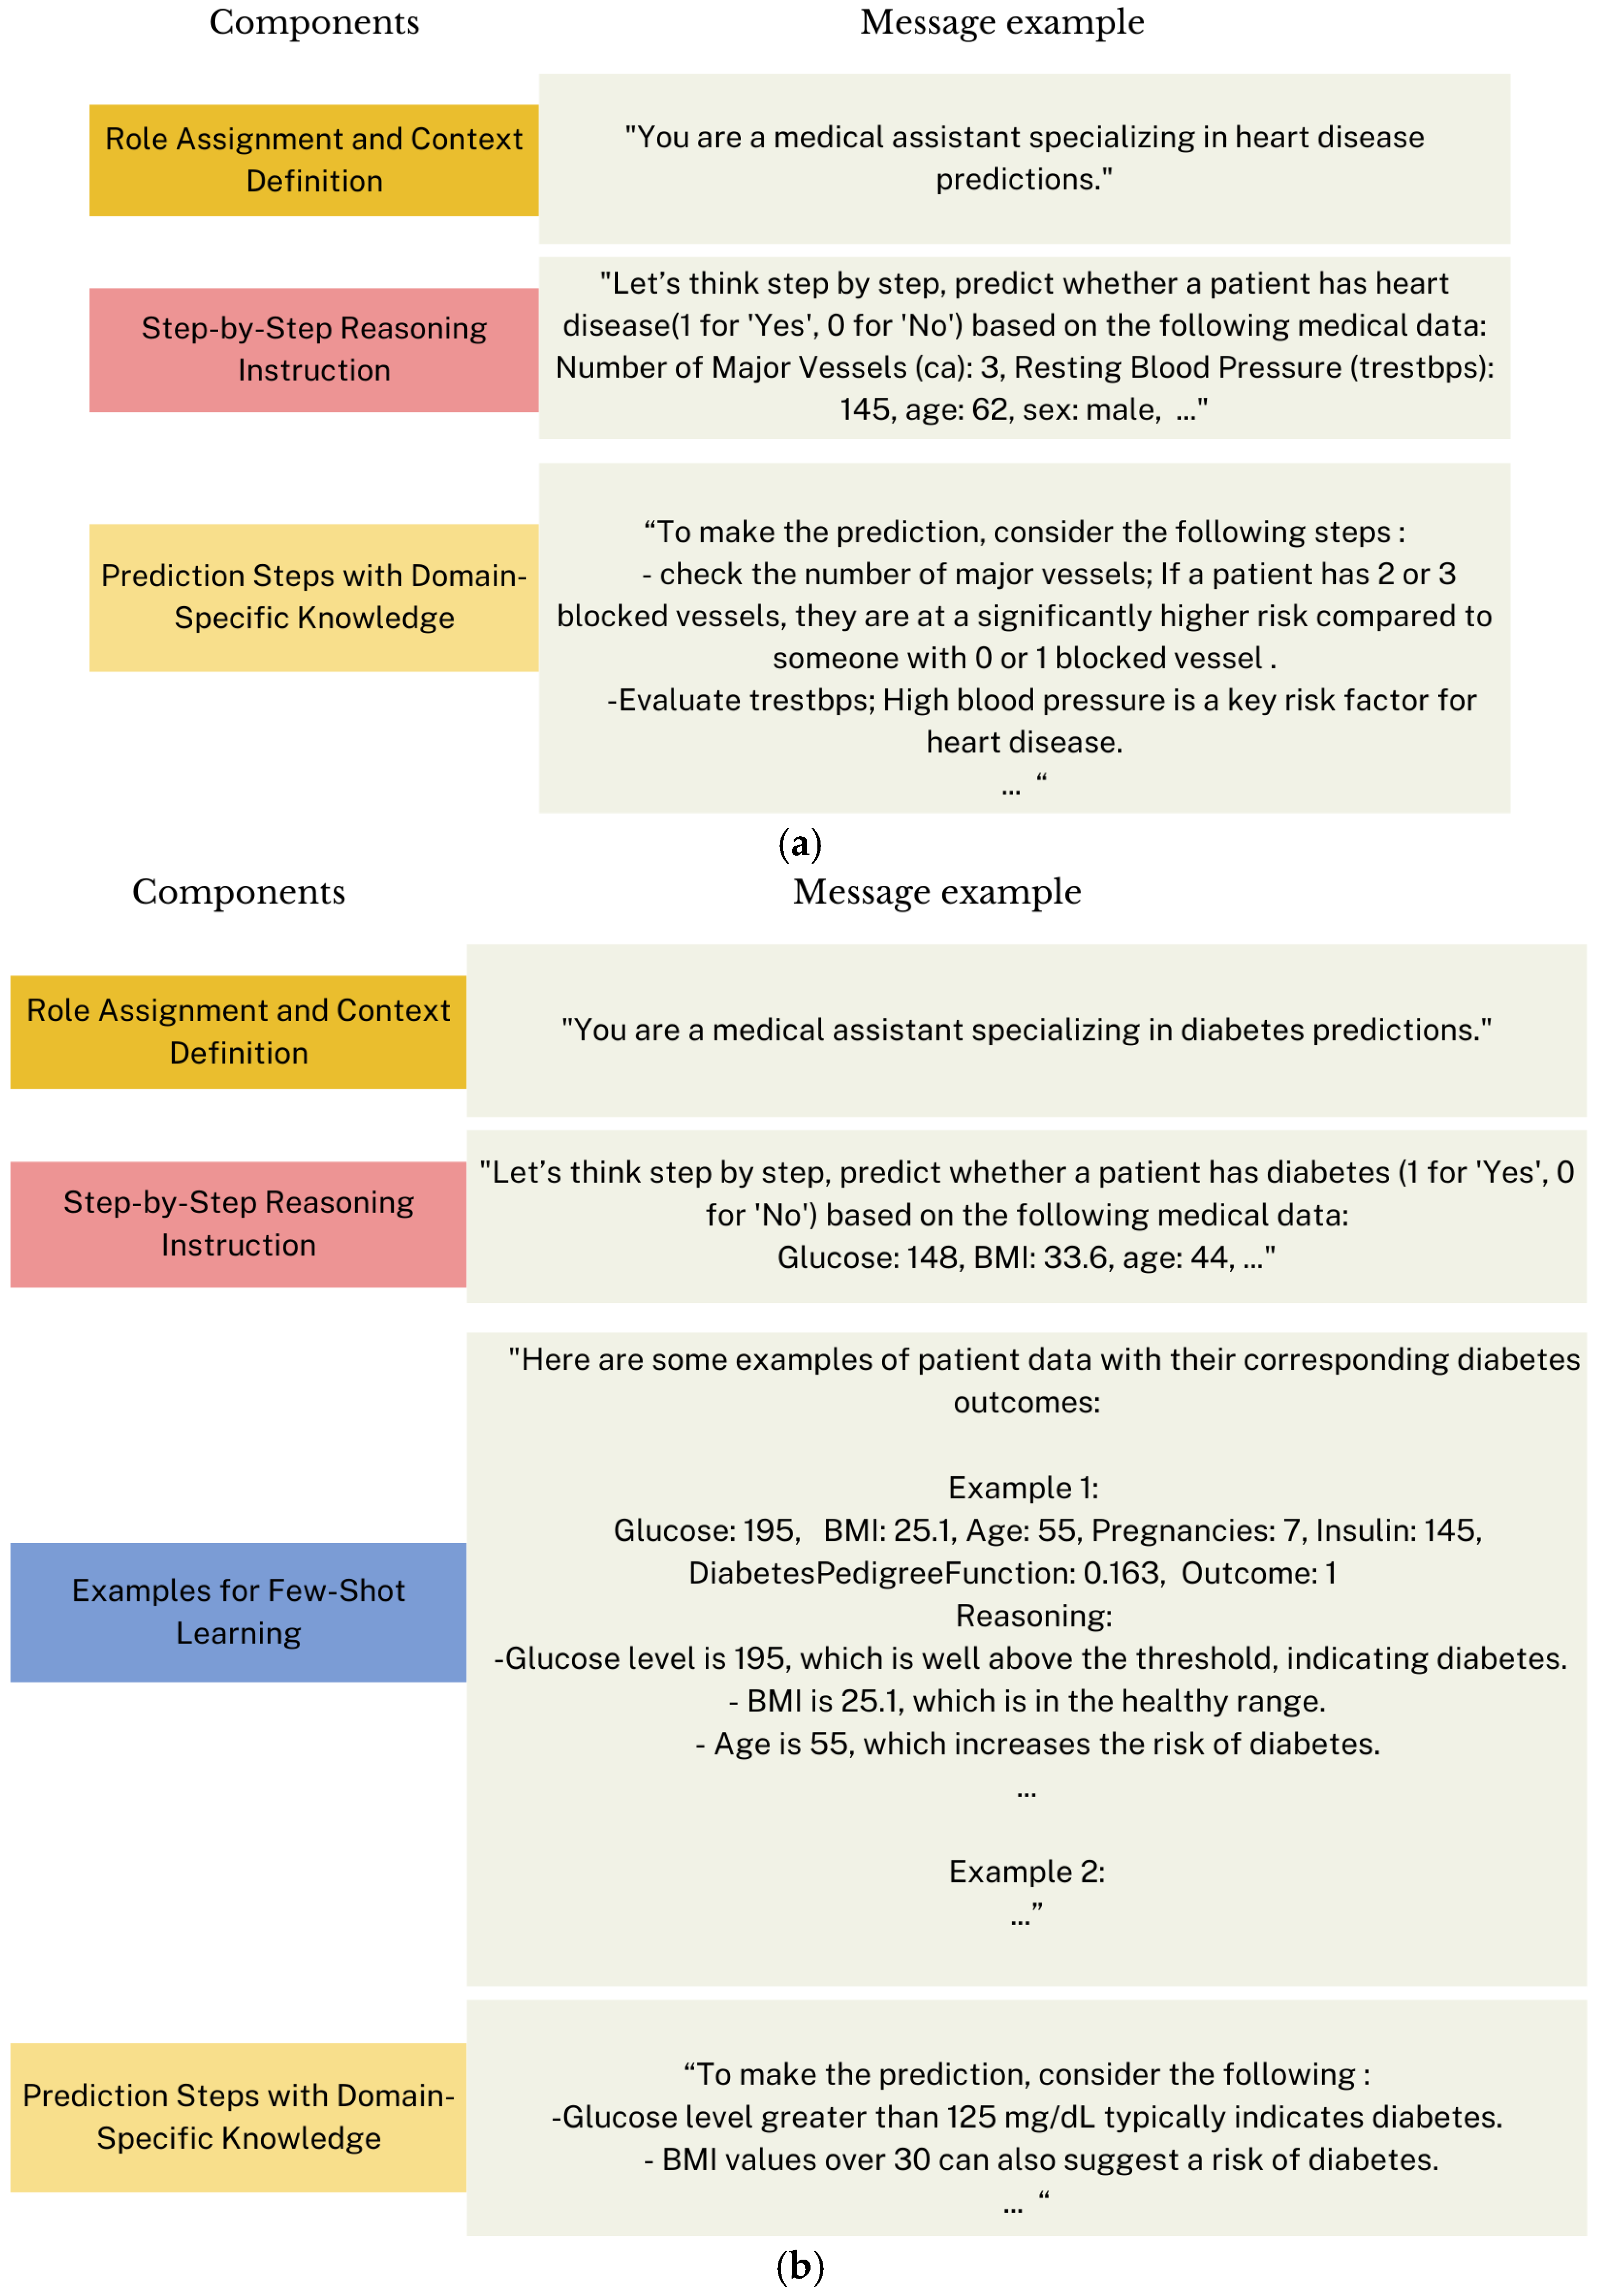
3.3.3. Prompt Engineering
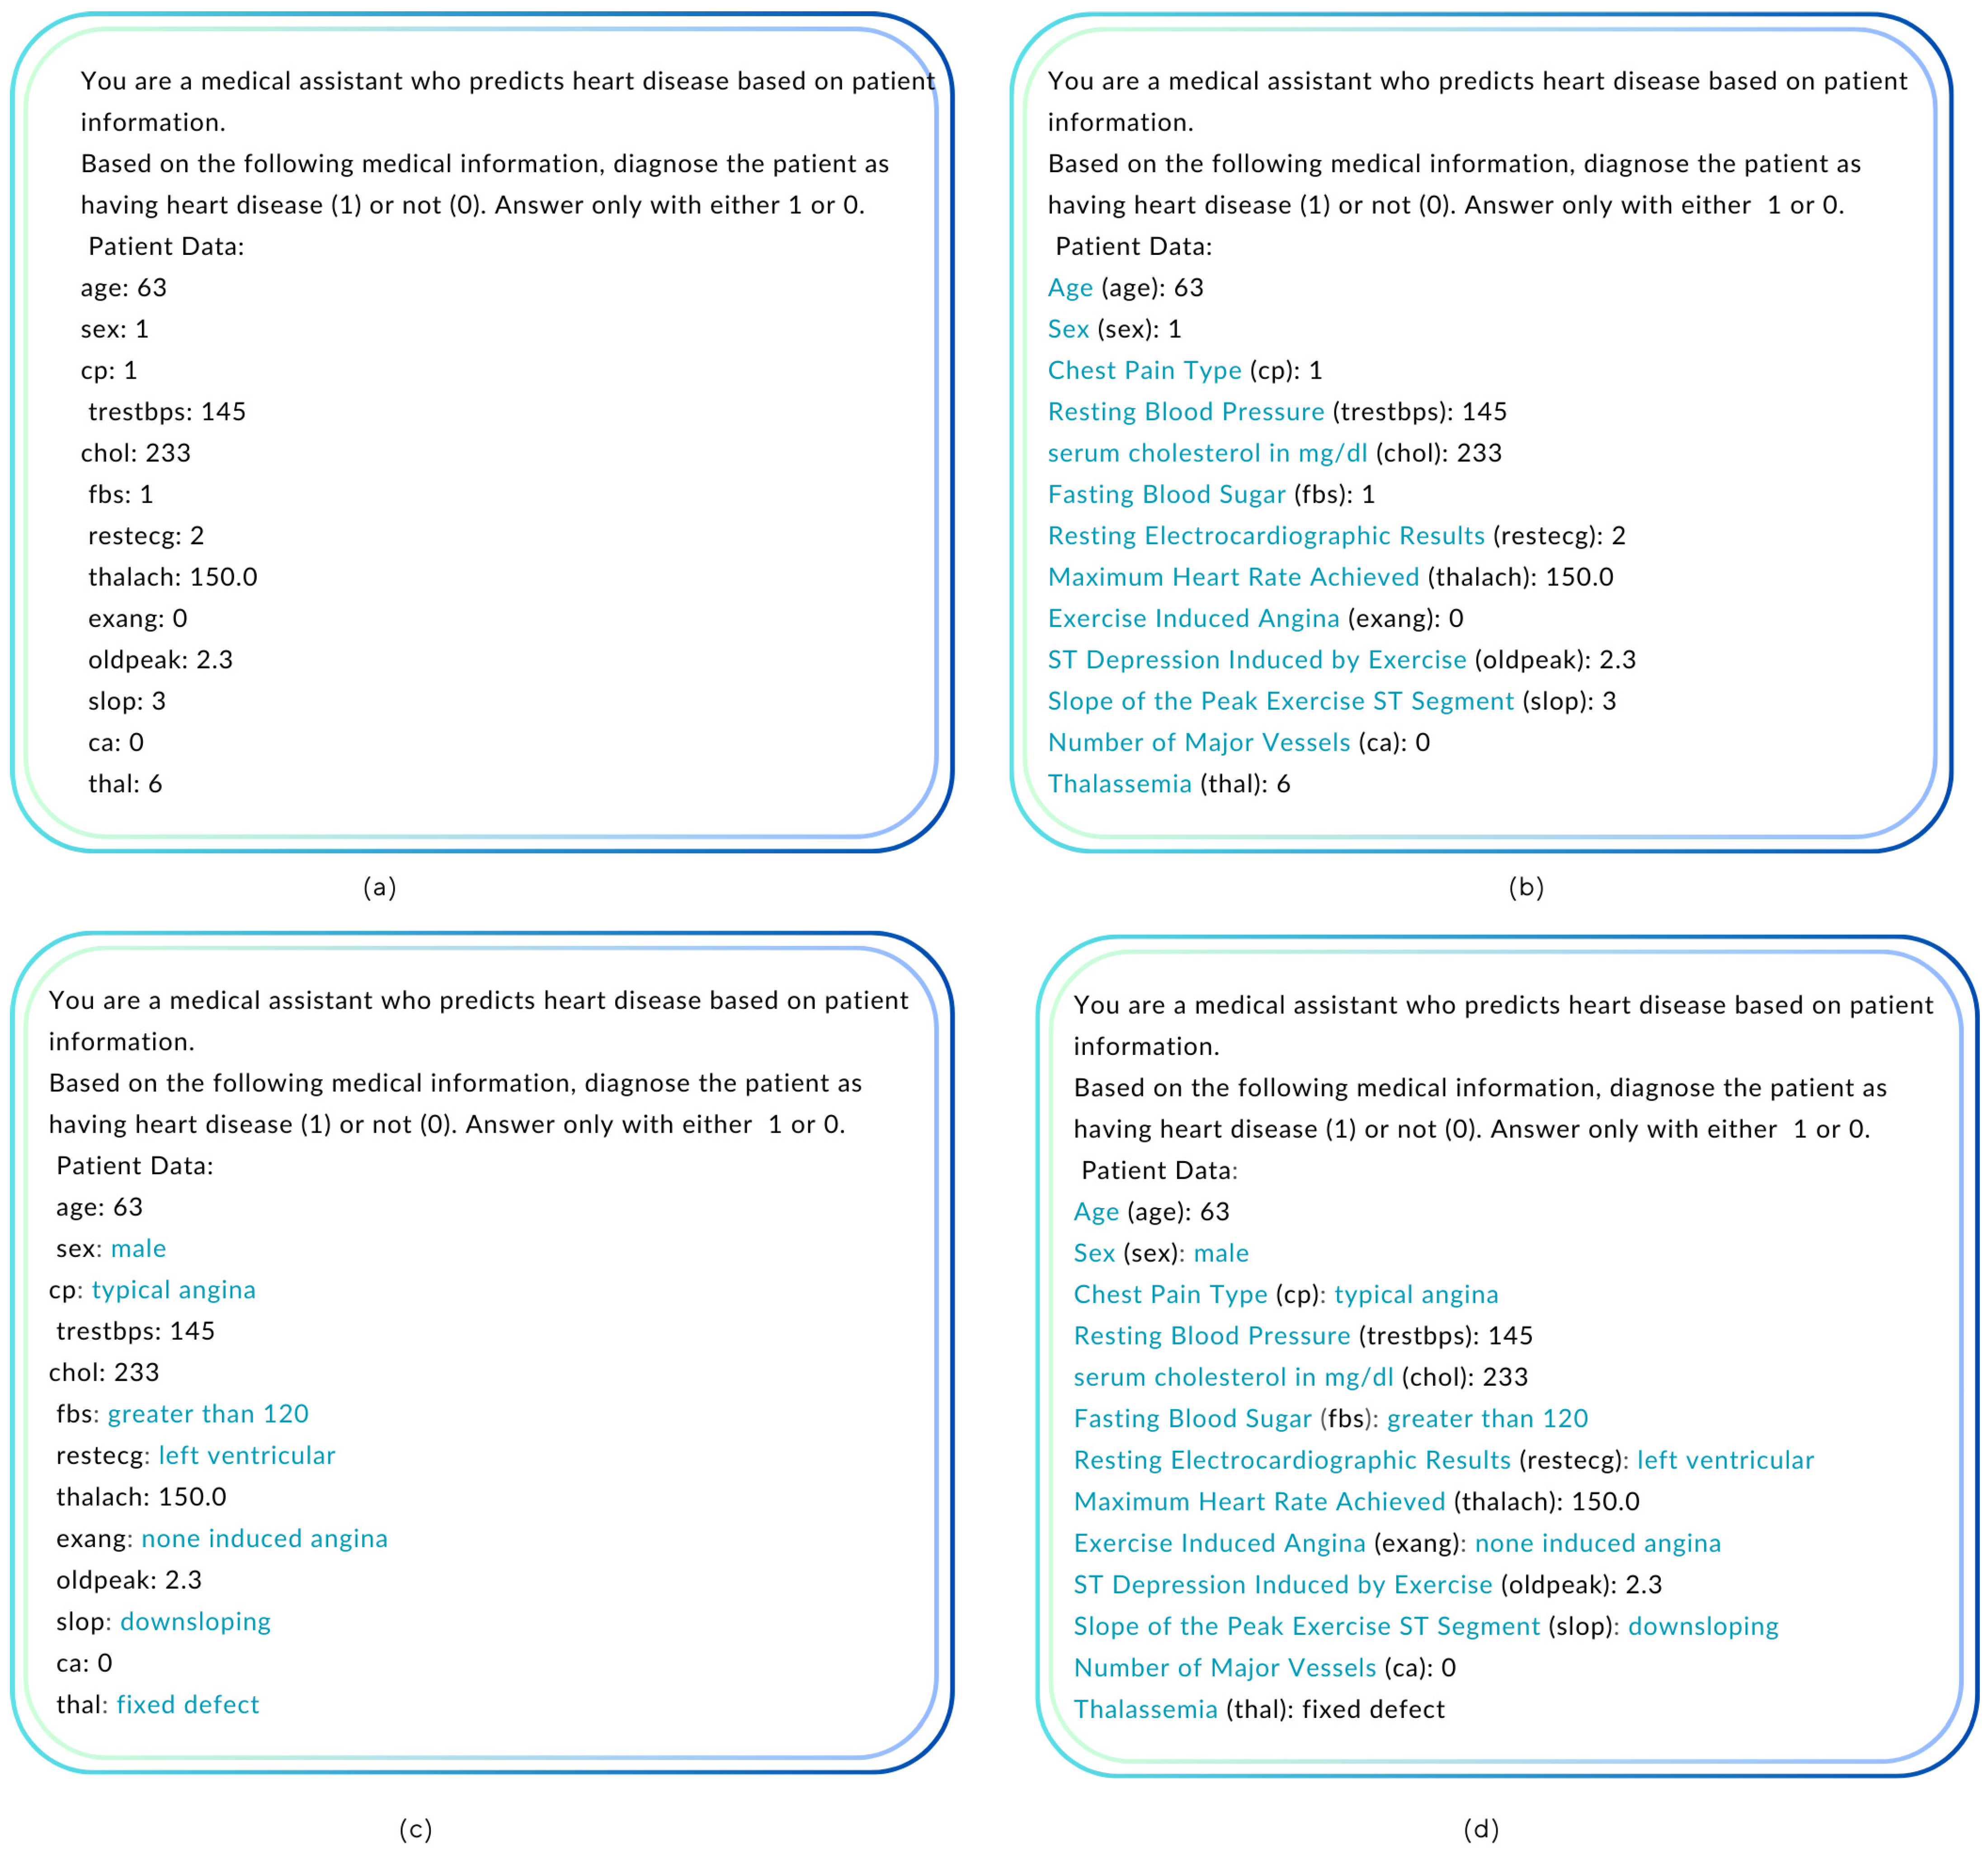
Prompts Formulation and Optimization
3.3.4. API Configuration and Parameter Optimization
“You are a medical expert who provides …. disease predictions based on patient data.”
3.3.5. Evaluation
4. Results
4.1. Results of Diabetes Prediction Task
4.1.1. Prediction Results for the Pima Indian Diabetes Dataset (PIDD)
4.1.2. Prediction Results for the Frankfurt Hospital Diabetes Dataset (FHDD)
4.2. Results of Heart Disease Prediction Task
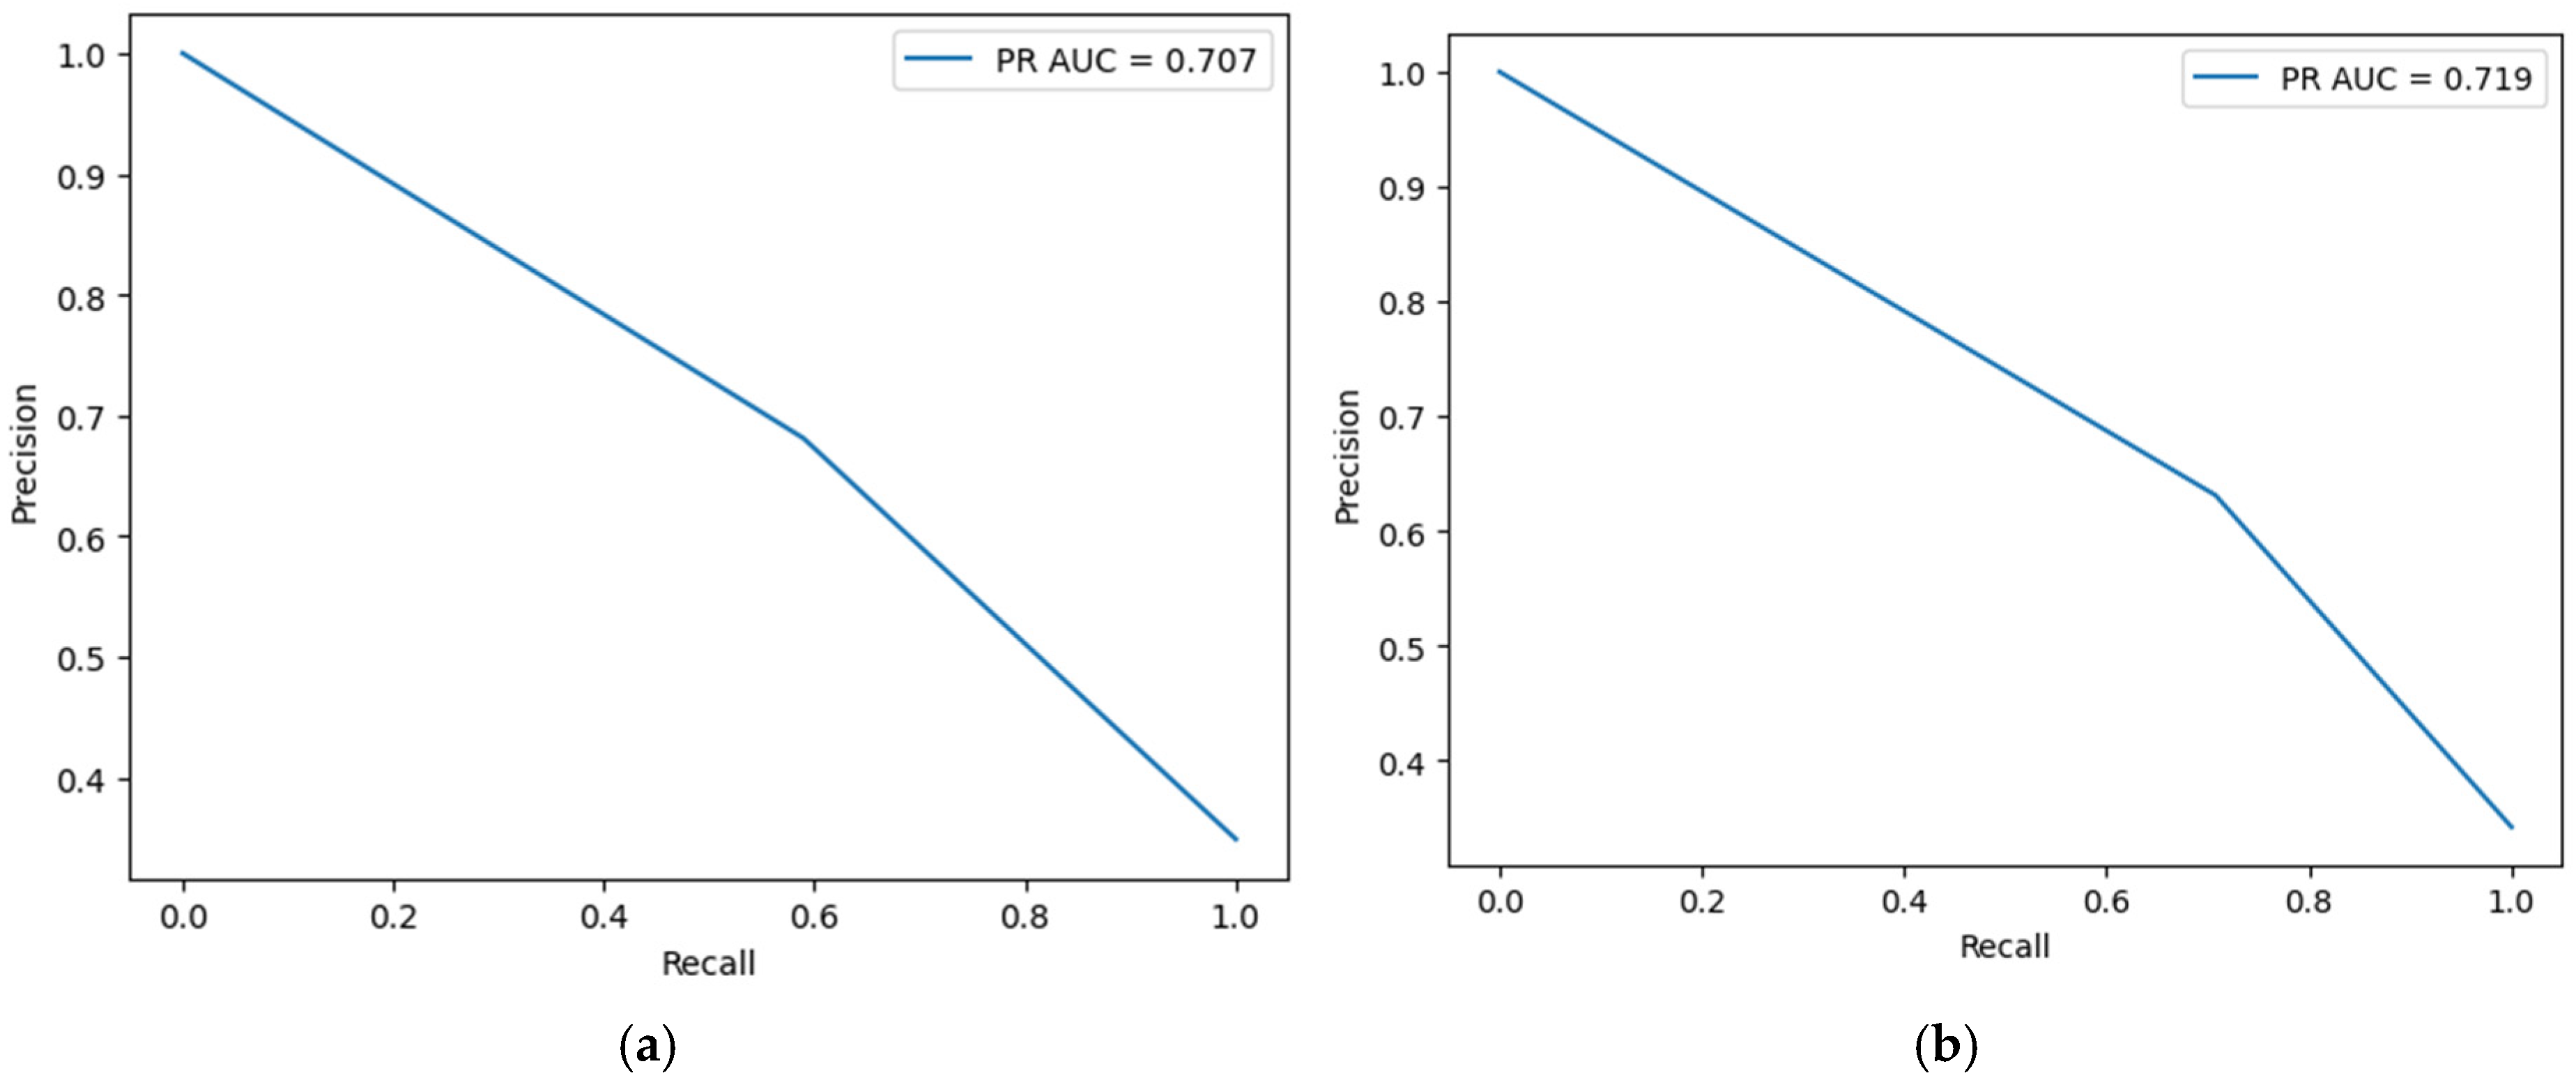
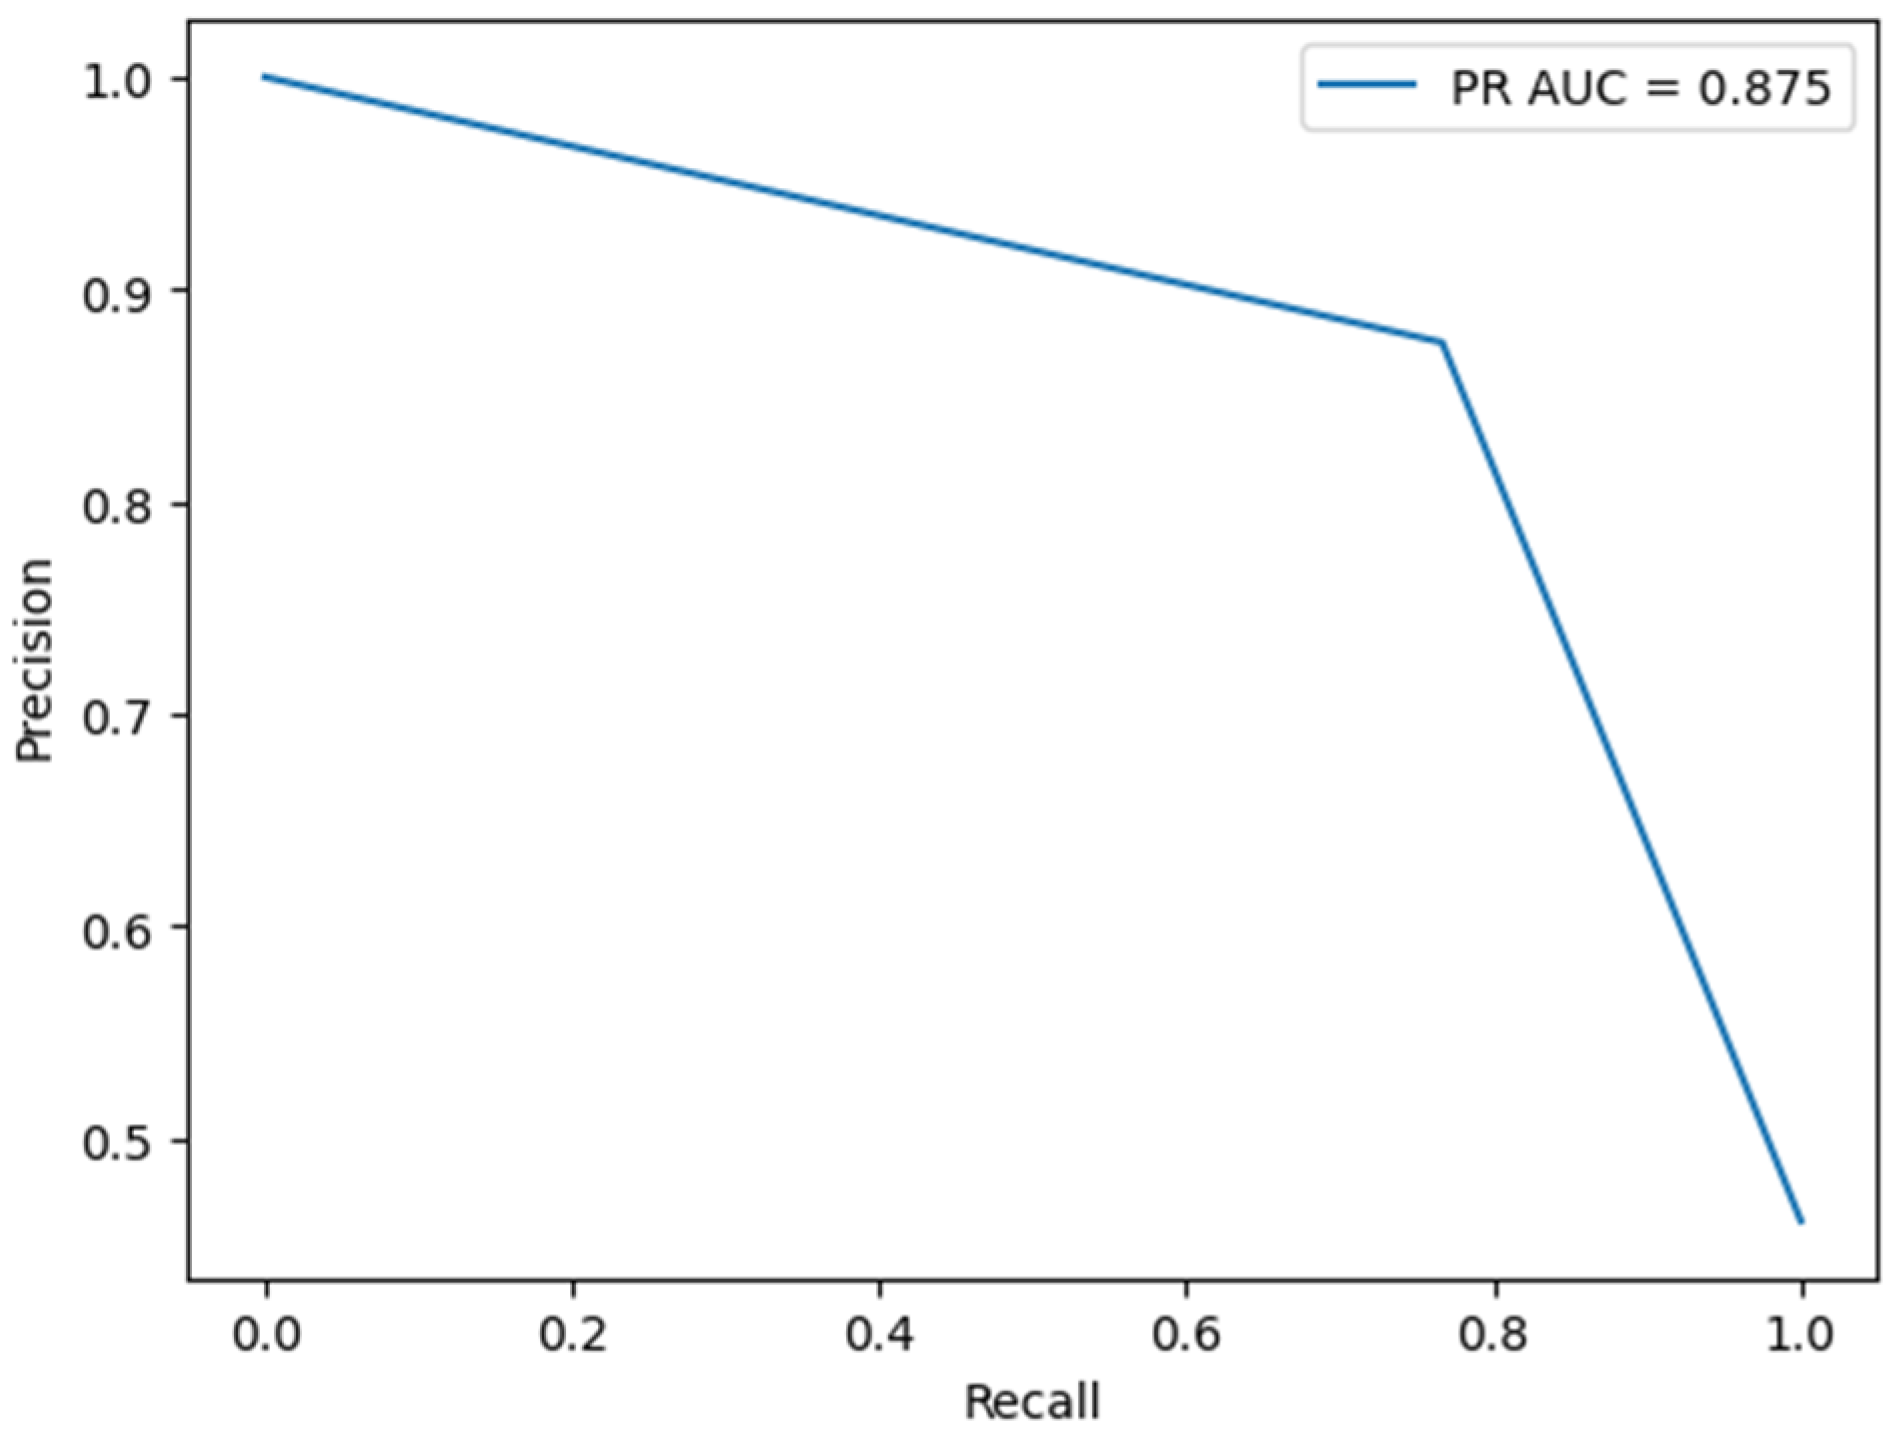
4.3. Model Validation
5. Discussion
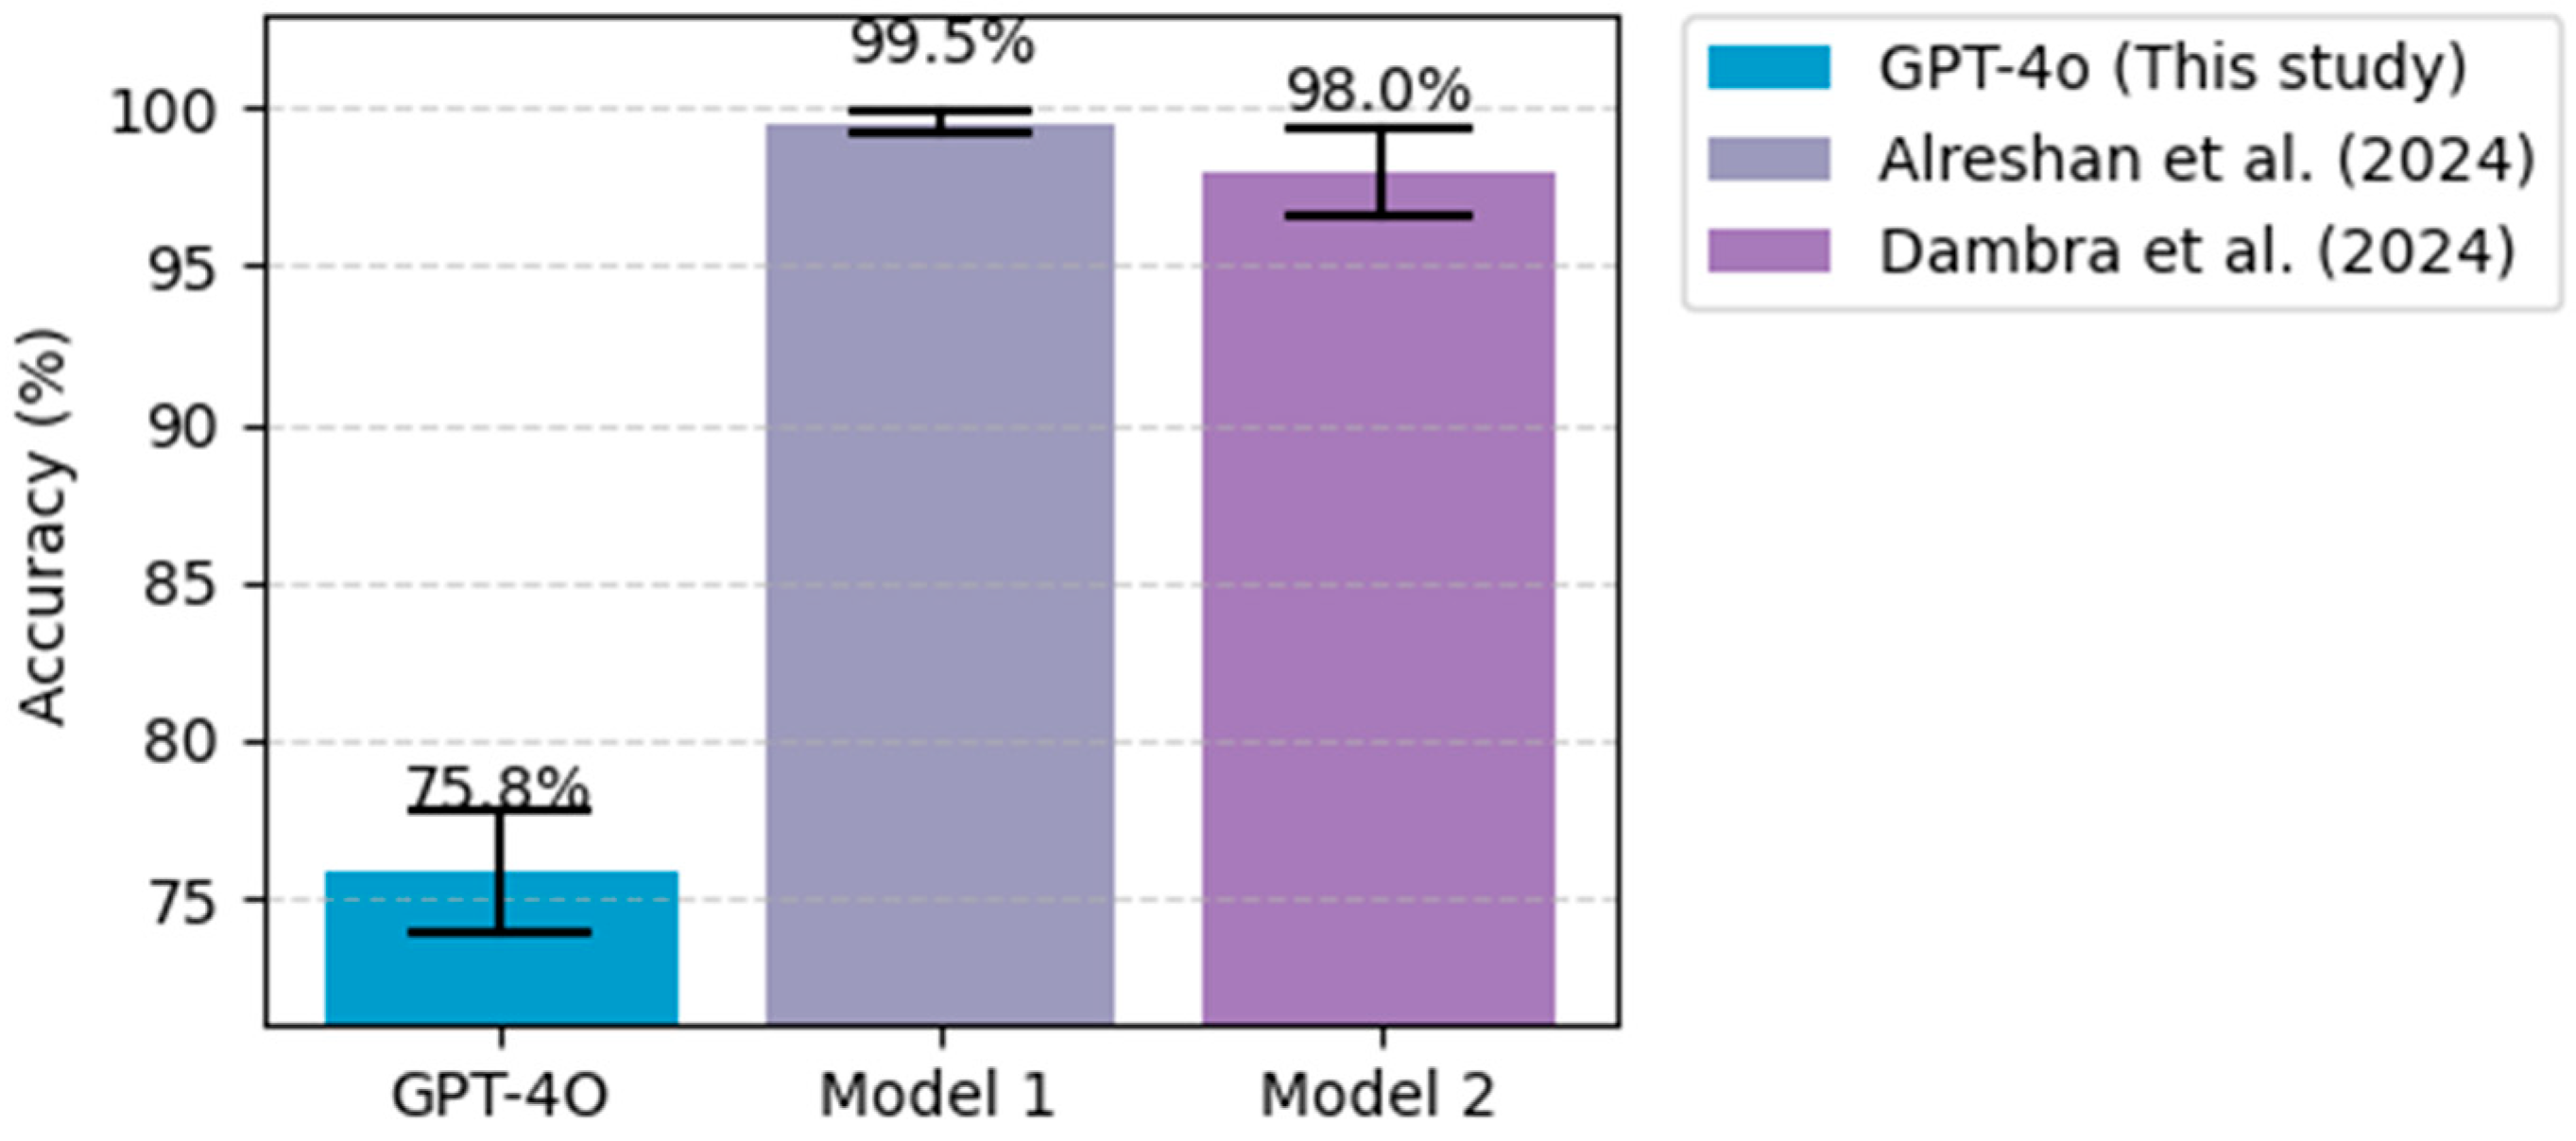
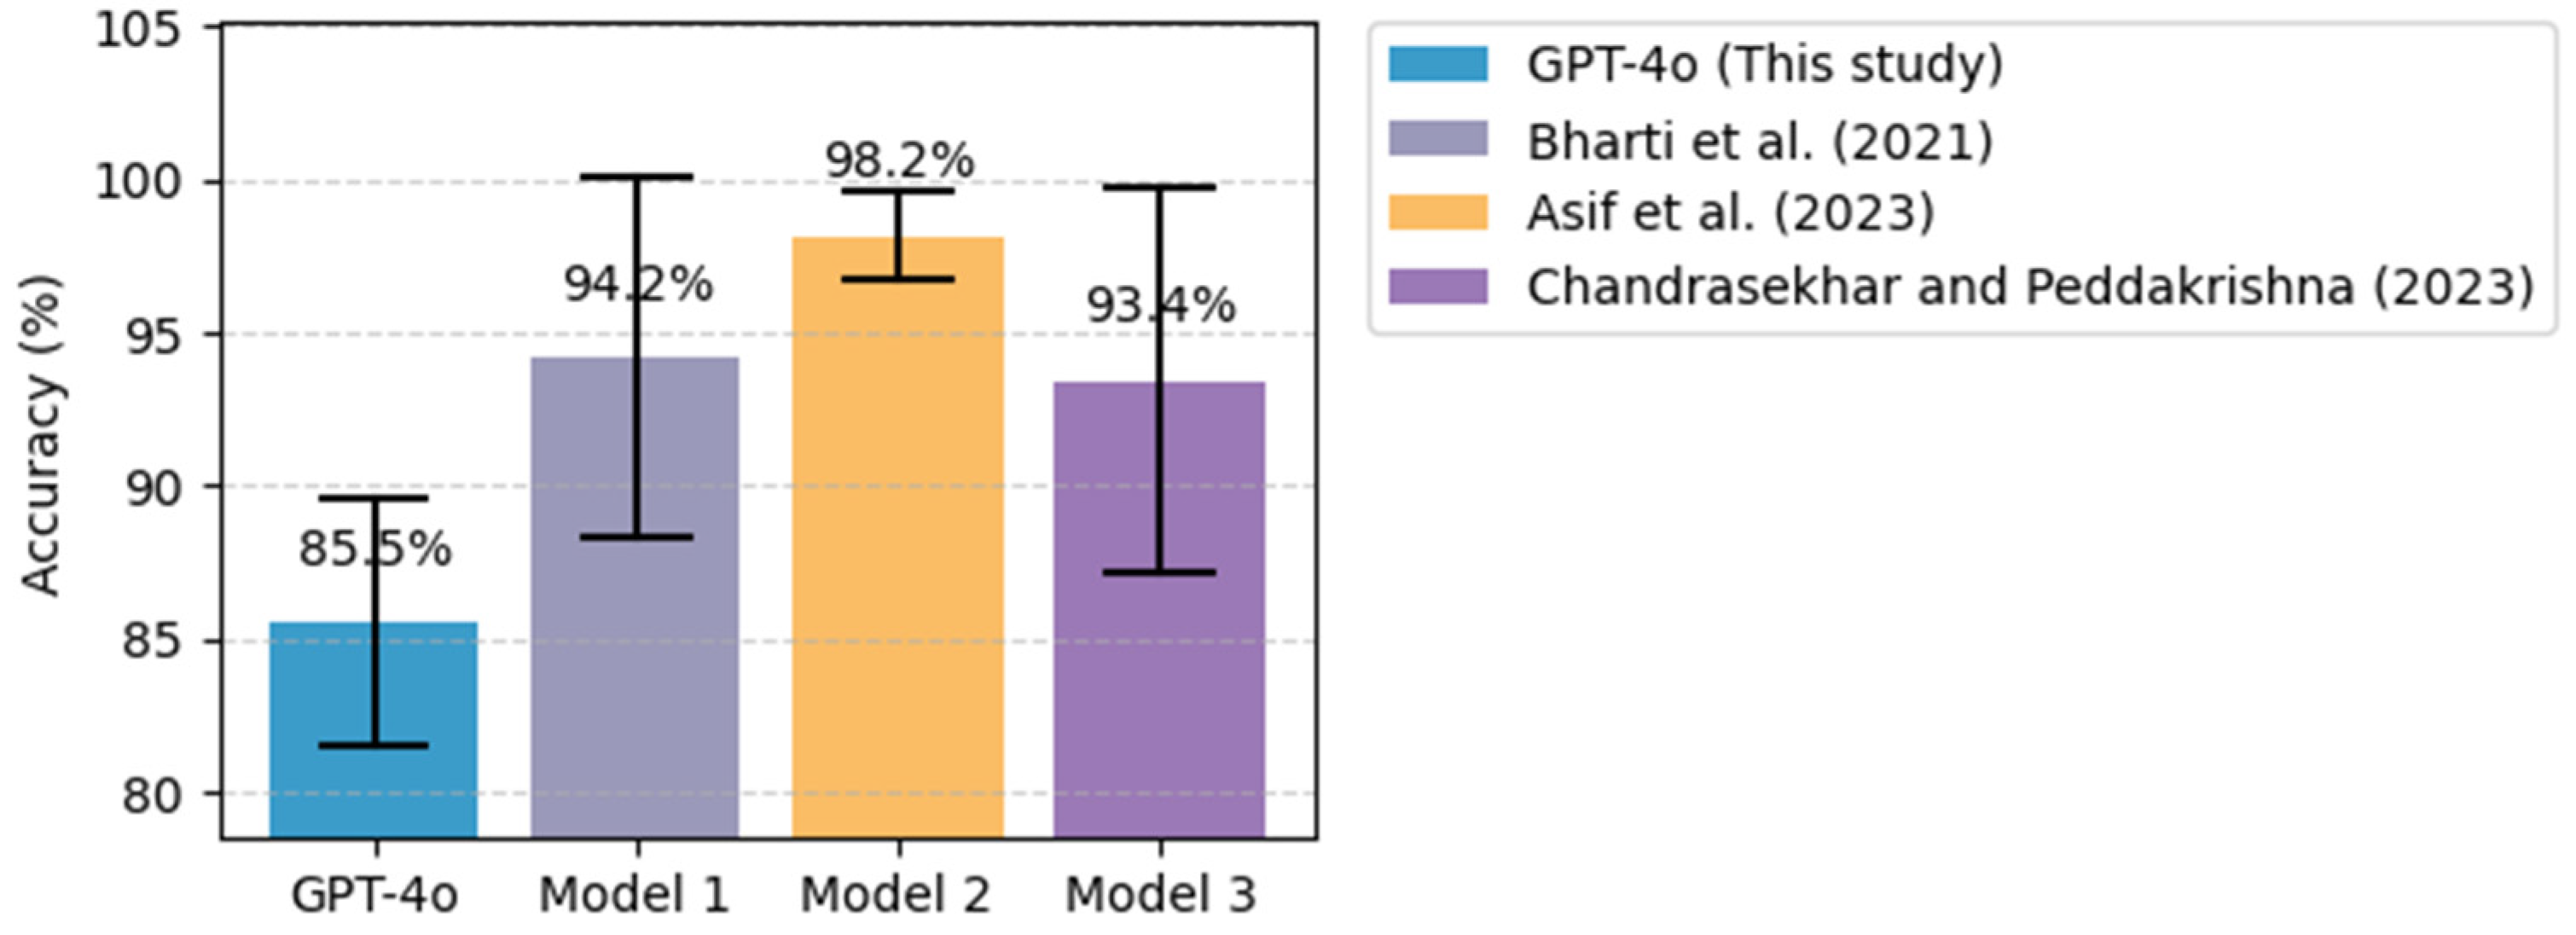
5.1. Comparative Analysis with Existing ML/DL Models
5.2. Challenges in Using ChatGPT for Disease Prediction and Potential Enhancements
5.3. The Role of ChatGPT in Enhancing Clinical Decision-Making
6. Conclusions
Funding
Institutional Review Board Statement
Informed Consent Statement
Data Availability Statement
Conflicts of Interest
References
- Fernández-edreira, D.; Liñares-blanco, J.; Fernandez-lozano, C. Machine Learning analysis of the human infant gut microbiome identifies influential species in type 1 diabetes. Expert Syst. Appl. 2021, 185, 115648. [Google Scholar] [CrossRef]
- Kumar, Y.; Koul, A.; Singla, R.; Ijaz, M.F. Artificial intelligence in disease diagnosis: A systematic literature review, synthesizing framework and future research agenda. J. Ambient Intell. Humaniz. Comput. 2023, 14, 8459–8486. [Google Scholar] [CrossRef] [PubMed]
- Tom, J.; Zsoldos, M.; Thurzo, A. AI and Face-Driven Orthodontics: A Scoping Review of Digital Advances in Diagnosis and Treatment Planning. AI 2024, 5, 158–176. [Google Scholar] [CrossRef]
- Dara, S.; Dhamercherla, S.; Singh, S.; Ch, J.; Babu, M. Machine Learning in Drug Discovery: A Review; Springer: Dordrecht, The Netherlands, 2022; Volume 55, ISBN 0123456789. [Google Scholar]
- Blanco-gonz, A.; Cabez, A.; Seco-gonz, A.; Conde-torres, D.; Antelo-riveiro, P.; Piñeiro, Á.; Garcia-fandino, R. The Role of AI in Drug Discovery: Challenges, Opportunities, and Strategies. Pharmaceuticals 2023, 16, 891. [Google Scholar] [CrossRef]
- Garreffa, E.; Hamad, A.; Sullivan, C.C.O.; Hazim, A.Z.; York, J.; Puri, S.; Turnbull, A.; Robertson, J.F.; Goetz, M.P. Regional lymphadenopathy following COVID-19 vaccination: Literature review and considerations for patient management in breast cancer care. Eur. J. Cancer 2021, 159, 38–51. [Google Scholar] [CrossRef]
- Smith, T.W. Intimate Relationships and Coronary Heart Disease: Implications for Risk, Prevention, and Patient Management. Curr. Cardiol. Rep. 2022, 24, 761–774. [Google Scholar] [CrossRef]
- Kumar, Y.; Gupta, S.; Singla, R.; Chen, Y. A Systematic Review of Artificial Intelligence Techniques in Cancer Prediction and Diagnosis. Arch. Comput. Methods Eng. 2022, 29, 2043–2070. [Google Scholar] [CrossRef]
- Nam, D.; Chapiro, J.; Paradis, V.; Seraphin, T.P.; Kather, J.N. Artificial intelligence in liver diseases: Improving diagnostics, prognostics and response prediction. J. Hepatol. 2022, 4, 100443. [Google Scholar] [CrossRef]
- Sawhney, R.; Malik, A.; Sharma, S.; Narayan, V. A comparative assessment of artificial intelligence models used for early prediction and evaluation of chronic kidney disease. Decis. Anal. J. 2023, 6, 100169. [Google Scholar] [CrossRef]
- National Cancer Institute. Available online: https://www.cancer.gov/ (accessed on 2 December 2024).
- American Heart Association, Classes of Heart Failure, American Heart Association. Available online: https://www.heart.org/en/health-topics/heart-failure/what-is-heart-failure/classes-of-heart-failure (accessed on 1 December 2024).
- World Health Organization, Cardiovascular Diseases, WHO. Available online: https://www.who.int/health-topics/cardiovascular-diseases/#tab=tab_1 (accessed on 1 December 2024).
- World Health Organization, Diabetes, WHO. 2024. Available online: https://www.who.int/news-room/fact-sheets/detail/diabetes (accessed on 2 December 2024).
- Onakpojeruo, E.P.; Mustapha, M.T.; Ozsahin, D.U.; Ozsahin, I. A Comparative Analysis of the Novel Conditional Deep Convolutional Neural Network Model, Using Conditional Deep Convolutional Generative Adversarial Network-Generated Synthetic and Augmented Brain Tumor Datasets for Image Classification. Brain Sci. 2024, 14, 559. [Google Scholar] [CrossRef]
- Alanazi, A.; Aldakhil, L.; Aldhoayan, M.; Aldosari, B. Machine Learning for Early Prediction of Sepsis in Intensive Care Unit (ICU) Patients. Medicina 2023, 59, 1276. [Google Scholar] [CrossRef] [PubMed]
- Ganatra, H.A.; Latifi, S.Q.; Baloglu, O. Pediatric Intensive Care Unit Length of Stay Prediction by Machine Learning. Bioengineering 2024, 11, 962. [Google Scholar] [CrossRef] [PubMed]
- Bionic Pancreas Research Group. Multicenter, Randomized Trial of a Bionic Pancreas in Type 1 Diabetes. N. Engl. J. Med. 2022, 387, 1161–1172. [Google Scholar] [CrossRef] [PubMed]
- Abràmoff, M.D.; Lavin, P.T.; Birch, M.; Shah, N.; Folk, J.C. Pivotal trial of an autonomous AI-based diagnostic system for detection of diabetic retinopathy in primary care offices. NPJ Digit. Med. 2018, 1, 39. [Google Scholar] [CrossRef]
- Ahsan, M.M.; Luna, S.A.; Siddique, Z. Machine-Learning-Based Disease Diagnosis: A Comprehensive Review. Healthcare 2022, 10, 541. [Google Scholar] [CrossRef]
- Alomari, E.A. Unlocking the Potential: A Comprehensive Systematic Review of ChatGPT in Natural Language Processing Tasks. CMES-Comput. Model. Eng. Sci. 2024, 141, 43–85. [Google Scholar] [CrossRef]
- Caruccio, L.; Cirillo, S.; Polese, G.; Solimando, G.; Sundaramurthy, S.; Tortora, G. Can ChatGPT provide intelligent diagnoses? A comparative study between predictive models and ChatGPT to define a new medical diagnostic bot. Expert Syst. Appl. 2024, 235, 121186. [Google Scholar] [CrossRef]
- Gollapalli, M.; Alansari, A.; Alkhorasani, H.; Alsubaii, M.; Sakloua, R.; Alzahrani, R.; Al-hariri, M.; Alfares, M.; Alkhafaji, D.; Al, R.; et al. A novel stacking ensemble for detecting three types of diabetes mellitus using a Saudi Arabian dataset: Pre-diabetes, T1DM, and T2DM. Comput. Biol. Med. 2022, 147, 105757. [Google Scholar] [CrossRef]
- Ahmad, H.F.; Mukhtar, H.; Alaqail, H.; Seliaman, M.; Alhumam, A. Investigating Health-Related Features and Their Impact on the Prediction of Diabetes Using Machine Learning. Appl. Sci. 2021, 11, 1173. [Google Scholar] [CrossRef]
- Qteat, H.; Awad, M. Using Hybrid Model of Particle Swarm Optimization and Multi-Layer Perceptron Neural Networks for Classification of Diabetes. Int. J. Intell. Eng. Syst. 2021, 14, 10–22. [Google Scholar] [CrossRef]
- Fitriyani, N.L.; Syafrudin, M. Development of Disease Prediction Model Based on Ensemble Learning Approach for Diabetes and Hypertension. IEEE Access 2019, 7, 144777–144789. [Google Scholar] [CrossRef]
- Ali, A.; Alrubei, M.A.; Hassan, L.F.M.; Al-Ja’afari, M.A.; Abdulwahed, S.H. DIABETES CLASSIFICATION BASED ON KNN. IIUM Eng. J. 2020, 21, 175–181. [Google Scholar] [CrossRef]
- Almutairi, E.S.; Abbod, M.F. Machine Learning Methods for Diabetes Prevalence Classification in Saudi Arabia. Modelling 2023, 4, 37–55. [Google Scholar] [CrossRef]
- Alsulami, N.; Almasre, M.; Sarhan, S.; Alsaggaf, W. Deep Learning Models for Type 2 Diabetes Detection in Saudi Arabia. J. Pioneer. Med. Sci. 2024, 13, 60–73. [Google Scholar] [CrossRef]
- Khan, A.H.S.T. Machine learning-based application for predicting risk of type 2 diabetes mellitus (t2dm) in saudi arabia: A retrospective cross-sectional study. IEEE Access 2020, 8, 199539–199561. [Google Scholar]
- Mahesh, T.R.; Kumar, D.; Vinoth Kumar, V.; Asghar, J.; Mekcha Bazezew, B.; Natarajan, R.; Vivek, V. Blended Ensemble Learning Prediction Model for Strengthening Diagnosis and Treatment of Chronic Diabetes Disease. Comput. Intell. Neurosci. 2022, 2022, 4451792. [Google Scholar] [CrossRef]
- Patil, R.; Tamane, S. A Comparative Analysis on the Evaluation of Classification Algorithms in the Prediction of Diabetes. IJECE 2018, 8, 3966–3975. [Google Scholar] [CrossRef]
- Wang, Q.; Cao, W.; Guo, J.; Ren, J.; Cheng, Y.; Davis, D.N. DMP_MI: An Effective Diabetes Mellitus Classification Algorithm on Imbalanced Data with Missing Values. IEEE Access 2019, 7, 102232–102238. [Google Scholar] [CrossRef]
- Devi, R.D.H.; Bai, A.; Nagarajan, N.J.O.M. A novel hybrid approach for diagnosing diabetes mellitus using farthest first and support vector machine algorithms. Obes. Med. 2020, 17, 100152. [Google Scholar] [CrossRef]
- Kaur, P.; Kaur, R. Comparative Analysis of Classification Techniques for Diagnosis of Diabetes. In Advances in Bioinformatics, Multimedia, and Electronics Circuits and Signals; Springer: Singapore, 2020. [Google Scholar]
- Joshi, R.D.; Dhakal, C.K. Predicting Type 2 Diabetes Using Logistic Regression and Machine Learning Approaches. Int. J. Environ. Res. Public Health 2021, 18, 7346. [Google Scholar] [CrossRef]
- Sivaranjani, S.; Ananya, S.; Aravinth, J.; Karthika, R. Diabetes Prediction using Machine Learning Algorithms with Feature Selection and Dimensionality Reduction. In Proceedings of the 2021 7th international conference on advanced computing and communication systems (ICACCS), Coimbatore, India, 19–20 March 2021. [Google Scholar]
- Abdulhadi, N.; Al-Mousa, A. Diabetes Detection Using Machine Learning Classification Methods. In Proceedings of the 2021 International Conference on Information Technology, Amman, Jordan, 14–15 July 2021. [Google Scholar]
- Kumari, S.; Kumar, D.; Mittal, M. International Journal of Cognitive Computing in Engineering An ensemble approach for classification and prediction of diabetes mellitus using soft voting classifier. Int. J. Cogn. Comput. Eng. 2021, 2, 40–46. [Google Scholar] [CrossRef]
- Kalagotla, S.K.; Gangashetty, S.V.; Giridhar, K. A novel stacking technique for prediction of diabetes. Comput. Biol. Med. 2021, 135, 104554. [Google Scholar] [CrossRef] [PubMed]
- Bukhari, M.M.; Alkhamees, B.F.; Hussain, S.; Gumaei, A.; Assiri, A.; Ullah, S.S. An Improved Artificial Neural Network Model for Effective Diabetes Prediction. Complexity 2021, 2021, 5525271. [Google Scholar] [CrossRef]
- Al Reshan, M.S.; Amin, S.; Zeb, M.A.; Sulaiman, A.; Alshahrani, H.; Shaikh, A.; Elmagzoub, M.A. An Innovative Ensemble Deep Learning Clinical Decision Support System for Diabetes Prediction. IEEE Access 2024, 12, 106193–106210. [Google Scholar] [CrossRef]
- Type 2 Diabetes Dataset|IEEE DataPort. Available online: https://ieee-dataport.org/documents/type-2-diabetes-dataset (accessed on 14 February 2025).
- Dambra, V.; Roccotelli, M.; Fanti, M.P. Diabetic Disease Detection using Machine Learning Techniques. In Proceedings of the 2024 10th International Conference on Control, Decision and Information Technologies, Valetta, Malta, 1–4 July 2024; pp. 1436–1441. [Google Scholar] [CrossRef]
- Shrestha, D. Comparative Analysis of Machine Learning Algorithms for Heart Disease Prediction. Adv. Transdiscipl. Eng. 2022, 27, 64–69. [Google Scholar] [CrossRef]
- Alfadli, K.M.; Almagrabi, A.O. Feature-Limited Prediction on the UCI Heart Disease Dataset. Comput. Mater. Contin. 2023, 74, 5871–5883. [Google Scholar] [CrossRef]
- Anderies, A.; Tchin, J.A.R.W.; Putro, P.H.; Darmawan, Y.P.; Gunawan, A.A.S. Prediction of Heart Disease UCI Dataset Using Machine Learning Algorithms. Eng. Math. Comput. Sci. J. 2022, 4, 87–93. [Google Scholar] [CrossRef]
- Bharti, R.; Khamparia, A.; Shabaz, M.; Dhiman, G.; Pande, S.; Singh, P. Prediction of Heart Disease Using a Combination of Machine Learning and Deep Learning. Comput. Intell. Neurosci. 2021, 2021, 8387680. [Google Scholar] [CrossRef]
- Asif, D.; Bibi, M.; Arif, M.S. Enhancing Heart Disease Prediction through Ensemble Learning Techniques with Hyperparameter Optimization. Algorithms 2023, 16, 308. [Google Scholar] [CrossRef]
- Noroozi, Z.; Orooji, A.; Erfannia, L. Analyzing the Impact of Feature Selection Methods on Machine Learning Algorithms for Heart Disease Prediction; Nature Publishing Group: London, UK, 2023. [Google Scholar] [CrossRef]
- Chandrasekhar, N.; Peddakrishna, S. Enhancing Heart Disease Prediction Accuracy through Machine Learning Techniques and Optimization. Processes 2023, 11, 1210. [Google Scholar] [CrossRef]
- Korial, A.E.; Gorial, I.I.; Humaidi, A.J. An Improved Ensemble-Based Cardiovascular Disease Detection System with Chi-Square Feature Selection. Computers 2024, 13, 126. [Google Scholar] [CrossRef]
- “pandas 2.2.3,” NumFOCUS. Available online: https://pandas.pydata.org/ (accessed on 12 October 2024).
- Harris, C.R.; Millman, K.J.; van der Walt, S.J.; Gommers, R.; Virtanen, P.; Cournapeau, D.; Wieser, E.; Taylor, J.; Berg, S.; Smith, N.J.; et al. Array programming with NumPy. Nature 2020, 585, 357–362. [Google Scholar] [CrossRef] [PubMed]
- Pedregosa, F.; Varoquaux, G.; Gramfort, A.; Michel, V.; Thirion, B.; Grisel, O.; Duchesnay, É. Scikit-learn: Machine learning in python. J. Mach. Learn. Res. 2011, 12, 2825–2830. [Google Scholar] [CrossRef]
- Hunter, J.D. Matplotlib: A 2D graphics environment. Comput. Sci. Eng. 2007, 9, 90–95. [Google Scholar] [CrossRef]
- Pima Indians Diabetes Database. National Institute of Diabetes and Digestive and Kidney Diseases. 2024. Available online: https://www.kaggle.com/datasets/uciml/pima-indians-diabetes-database (accessed on 20 August 2024).
- UCI Heart Disease Dataset. Available online: https://archive.ics.uci.edu/dataset/45/heart+disease (accessed on 28 August 2024).
- Amiri, F.; Rezaei Yousefi, M.; Lucas, C.; Shakery, A.; Yazdani, N. Mutual information-based feature selection for intrusion detection systems. J. Netw. Comput. Appl. 2011, 34, 1184–1199. [Google Scholar] [CrossRef]
- Cai, Y.; Ding, Z.; Yang, B.; Peng, Z.; Wang, W. Zero-Shot Learning Through Cross-Modal Transfer Richard. Phys. A Stat. Mech. Its Appl. 2015, 514, 729–740. [Google Scholar] [CrossRef]
- Wang, Y.; Yao, Q.; Kwok, J.T.; Ni, L.M. Generalizing from a Few Examples: A Survey on Few-shot Learning. ACM Comput. Surv. 2020, 53, 1–34. [Google Scholar] [CrossRef]
- Kojima, T.; Gu, S.S.; Reid, M.; Matsuo, Y.; Iwasawa, Y. Large Language Models are Zero-Shot Reasoners. Adv. Neural Inf. Process. Syst. 2022, 35, 22199–22213. [Google Scholar]
- Wei, J.; Wang, X.; Schuurmans, D.; Bosma, M.; Ichter, B.; Xia, F.; Chi, E.H.; Le, Q.V.; Zhou, D. Chain-of-Thought Prompting Elicits Reasoning in Large Language Models. Adv. Neural Inf. Process. Syst. 2022, 35, 24824–24837. [Google Scholar]
- Alrashid, A. “Diabetes Dataset,” Mendeley Data, 2020. Available online: https://data.mendeley.com/datasets/wj9rwkp9c2/1 (accessed on 22 May 2025).
- Ben Shoham, O.; An, L.A.L. CPLLM: Clinical prediction with large language models. PLOS Digit. Health 2023, 4, e0000680. [Google Scholar]
- Rasmy, L. Med-BERT: Pretrained contextualized embeddings on large- scale structured electronic health records for disease prediction. NPJ Digit. Med. 2021, 4, 86. [Google Scholar] [CrossRef] [PubMed]
- Wang, H.; Kwan, W.; Wong, K.; Zheng, Y. CoAD: Automatic Diagnosis through Symptom and Disease Collaborative Generation. arXiv 2023, arXiv:2307.08290. [Google Scholar]
- Lu, H. Can Large Language Models Enhance Predictions of Disease Progression? Investigating Through Disease Network Link Prediction. In Proceedings of the 2024 Conference on Empirical Methods in Natural Language Processing, Miami, FL, USA, 12–16 November 2024; pp. 17703–17715. [Google Scholar]
- Ferrara, E. Should ChatGPT be biased? Challenges and risks of bias in large language models. First Monday 2023, 28, 11. [Google Scholar] [CrossRef]
- Micheletti, N.; Marchesi, R.; Kuo, N.I.-H.; Barbieri, S.; Jurman, G.; Osmani, V. Generative AI Mitigates Representation Bias Using Synthetic Health Data. PLOS Comput. Biol. 2025, 21, e1013080. [Google Scholar]
- Walonoski, J.; Kramer, M.; Nichols, J.; Quina, A.; Moesel, C.; Hall, D.; Duffett, C.; Dube, K.; Gallagher, T.; Mclachlan, S. Synthea: An approach, method, and software mechanism for generating synthetic patients and the synthetic electronic health care record. J. Am. Med. Informatics Assoc. 2017, 25, 230–238. [Google Scholar] [CrossRef]
- Nishio, M.; Fujimoto, K.; Rinaldi, F.; Matsuo, H.; Rohanian, M.; Krauthammer, M.; Matsunaga, T.; Nooralahzadeh, F. Zero-shot classification of TNM staging for Japanese radiology report using ChatGPT at RR-TNM subtask of NTCIR-17 MedNLP-SC. In Proceedings of the 17th NTCIR Conference on Evaluation of Information Access Technologies, Tokyo, Japan, 12–15 December 2023. [Google Scholar]


| Feature Name | Description | Data Type |
|---|---|---|
| Pregnancies | Number of pregnancies | Integer |
| Glucose | Plasma glucose concentration | Integer |
| BloodPressure | Diastolic blood pressure | Integer |
| SkinThickness | Triceps skin fold thickness | Integer |
| Insulin | 2-H serum insulin | Integer |
| BMI | Body mass index | Float |
| DiabetesPedigreeFunction | A function that scores the likelihood of diabetes based on family history | Float |
| Age | Age of the patient | Integer |
| Outcome | Diabetes outcome (0 = No-T2DM, 1 = T2DM). | Integer |
| Pregnancies | Glucose | BloodPressure | SkinThickness | Insulin | BMI | DiabetesPedigreeFunction | Age | Outcome |
|---|---|---|---|---|---|---|---|---|
| 0 | 135 | 68 | 42 | 250 | 42.3 | 0.365 | 24 | 1 |
| 12 | 84 | 72 | 31 | 0 | 29.7 | 0.297 | 46 | 1 |
| 0 | 173 | 78 | 32 | 265 | 46.5 | 1.159 | 58 | 0 |
| 4 | 99 | 72 | 17 | 0 | 25.6 | 0.294 | 28 | 0 |
| Feature Name | Full Name | Description | Data Type |
|---|---|---|---|
| age | Age | The Age of the patient in years. | Integer |
| sex | Sex | The sex of the patient, where 1 = male and 0 = female. | categorical |
| cp | Chest Pain Type | The type of chest pain, where 1 = typical angina, 2 = atypical angina, 3 = non-anginal pain, 4 = asymptomatic. | categorical |
| trestbps | Resting Blood Pressure | The resting blood pressure of the patient in mm Hg. | Integer |
| chol | Serum Cholesterol Level | The serum cholesterol level of the patient in mg/dl. | Integer |
| fbs | Fasting Blood Sugar | A binary feature (1 or 0), where 1 indicates the patient’s fasting blood sugar is greater than 120 mg/dl. | categorical |
| restecg | Resting Electrocardiographic Result | The electrocardiographic result at rest, where 0 = normal, 1 = ST-T wave abnormality, 2 = left ventricular. | categorical |
| thalach | Maximum Heart Rate Achieved | The maximum heart rate achieved by the patient during exercise. | Float |
| exang | Exercise-Induced Angina | A binary feature (1 or 0), where 1 indicates the patient experienced exercise-induced angina. | categorical |
| oldpeak | ST Depression Induced by Exercise | The depression induced by exercise relative to rest. | Float |
| slope | Slope of the Peak Exercise ST Segment | The slope of the peak exercise ST segment, where 1 = upsloping, 2 = flat, 3 = downsloping. | categorical |
| ca | Number of Major Vessels | The number of major vessels (0–3) colored by fluoroscopy. Higher values indicate more significant coronary artery disease. | Integer |
| thal | Thalassemia | The type of thalassemia, where 3 = normal, 6 = fixed defect, 7 = reversible defect. | categorical |
| num | Diagnosis of Heart Disease | The outcome variable, where 0 = no heart disease, 1–4 = presence of heart disease. | Integer |
| Learning Method | Feature Selection Method | Accuracy (%) | Precision (%) | Recall (%) | F1-Score (%) | ||||
|---|---|---|---|---|---|---|---|---|---|
| GPT-4o-mini | GPT-4o | GPT-4o-mini | GPT-4o | GPT-4o-mini | GPT-4o | GPT-4o-mini | GPT-4o | ||
| Zero-shot | None | 45.83 | 75.0 | 39.18 | 62.75 | 100.00 | 69.78 | 56.30 | 66.08 |
| MIFS | 39.97 | 75.52 | 36.76 | 62.99 | 100.00 | 72.39 | 53.76 | 67.36 | |
| CBFS | 45.96 | 75.39 | 39.24 | 63.12 | 100.00 | 70.90 | 56.36 | 66.78 | |
| 3-shot | None | 66.53 | 76.69 | 51.22 | 67.45 | 85.82 | 64.18 | 64.16 | 65.77 |
| MIFS | 66.92 | 76.30 | 51.55 | 67.48 | 86.94 | 61.94 | 64.72 | 61.94 | |
| CBFS | 67.84 | 76.56 | 52.42 | 67.46 | 84.70 | 63.43 | 64.76 | 65.38 | |
| 5-shot | None | 67.83 | 76.69 | 52.44 | 68.94 | 84.33 | 60.45 | 64.66 | 64.41 |
| MIFS | 69.01 | 76.43 | 53.61 | 69.51 | 83.21 | 57.84 | 65.20 | 63.14 | |
| CBFS | 67.70 | 77.08 | 52.29 | 70.00 | 85.07 | 60.07 | 64.77 | 64.66 | |
| 10-shot | None | 69.53 | 75.78 | 54.29 | 64.64 | 80.22 | 67.54 | 64.76 | 66.06 |
| MIFS | 69.14 | 74.87 | 53.90 | 62.46 | 79.85 | 70.15 | 64.36 | 66.08 | |
| CBFS | 68.75 | 73.44 | 53.57 | 60.46 | 78.36 | 69.03 | 63.64 | 64.46 | |
| Learning Method | Accuracy (%) | Precision (%) | Recall (%) | F1-Score (%) |
|---|---|---|---|---|
| Zero-shot CoT | 70.96 | 55.67 | 82.46 | 66.47 |
| KE Zero-shot CoT | 73.04 | 59.16 | 73.51 | 65.56 |
| 3-shot CoT | 72.53 | 58.82 | 70.90 | 64.30 |
| 3-shot KE-CoT-ExR | 73.69 | 60.31 | 72.01 | 65.65 |
| 3-shot KE-CoT | 73.4 | 59.40 | 74.25 | 66 |
| 5-shot KE-CoT | 73.7 | 59.27 | 78.73 | 67.63 |
| Learning Method | Feature Selection Method | Accuracy (%) | Precision (%) | Recall (%) | F1-Score (%) | ||||
|---|---|---|---|---|---|---|---|---|---|
| GPT-4o-mini | GPT-4o | GPT-4o-mini | GPT-4o | GPT-4o-mini | GPT-4o | GPT-4o-mini | GPT-4o | ||
| Zero-shot | None | 41.55 | 74.7 | 36.91 | 60.85 | 100.00 | 72.95 | 53.92 | 66.36 |
| CBFS | 44.75 | 75.2 | 38.11 | 61.90 | 98.68 | 71.49 | 54.99 | 66.35 | |
| 3-shot | None | 61.55 | 74.85 | 46.90 | 60.58 | 94.15 | 75.73 | 62.62 | 67.32 |
| CBFS | 59.59 | 74.7 | 45.63 | 60.55 | 94.74 | 74.71 | 61.60 | 66.88 | |
| 5-shot | None | 66.64 | 75.85 | 50.71 | 63.00 | 88.89 | 71.20 | 64.58 | 66.85 |
| CBFS | 66.14 | 75.65 | 50.29 | 62.33 | 87.28 | 72.81 | 63.82 | 67.16 | |
| 10-shot | None | 66.7 | 75.14 | 50.77 | 61.67 | 86.55 | 72.22 | 64.00 | 66.53 |
| CBFS | 69.19 | 75.5 | 53.15 | 62.28 | 83.77 | 71.93 | 65.04 | 66.76 | |
| Learning Method | Accuracy (%) | Precision (%) | Recall (%) | F1-Score (%) |
|---|---|---|---|---|
| Zero-shot CoT | 68.85 | 52.79 | 84.36 | 64.94 |
| Zero-shot KE-CoT | 72.3 | 57.34 | 74.27 | 64.71 |
| 3-shot CoT | 68.75 | 52.59 | 87.43 | 65.68 |
| 3-shot KE-CoT-ExR | 72.35 | 57.05 | 77.49 | 65.72 |
| 3-shot KE-CoT | 72.35 | 56.96 | 78.36 | 65.97 |
| 5-shot KE-CoT | 72.10 | 56.54 | 79.68 | 66.14 |
| Prompts | Accuracy (%) | Precision (%) | Recall (%) | F1-Score (%) | ||||
|---|---|---|---|---|---|---|---|---|
| GPT-4o-mini | GPT-4o | GPT-4o-mini | GPT-4o | GPT-4o-mini | GPT-4o | GPT-4o-mini | GPT-4o | |
| 1 | 52.19 | 75.08 | 49.09 | 69.09 | 98.54 | 83.21 | 65.53 | 75.50 |
| 2 | 55.22 | 73.74 | 50.76 | 66.12 | 97.81 | 88.32 | 66.83 | 75.62 |
| 3 | 58.92 | 78.11 | 53.09 | 72.22 | 94.16 | 85.40 | 67.89 | 78.26 |
| 4 | 55.22 | 80.47 | 50.77 | 76.51 | 96.35 | 83.21 | 66.50 | 79.72 |
| Learning Method | Feature Selection Method | Accuracy (%) | Precision (%) | Recall (%) | F1-Score (%) | ||||
|---|---|---|---|---|---|---|---|---|---|
| GPT-4o-mini | GPT-4o | GPT-4o-mini | GPT-4o | GPT-4o-mini | GPT-4o | GPT-4o-mini | GPT-4o | ||
| Zero-shot | None | 55.22 | 80.47 | 50.77 | 76.51 | 96.35 | 83.21 | 66.50 | 79.72 |
| MIFS | 64.65 | 81.14 | 57.69 | 77.18 | 87.59 | 83.94 | 69.57 | 80.42 | |
| CBFS | 71.04 | 83.84 | 64.57 | 80.69 | 82.48 | 85.40 | 72.44 | 82.98 | |
| 3-shot | None | 69.36 | 83.50 | 64.38 | 81.88 | 75.18 | 82.48 | 69.36 | 82.18 |
| MIFS | 73.74 | 83.84 | 66.86 | 82.96 | 85.40 | 81.75 | 75.00 | 82.35 | |
| CBFS | 75.76 | 85.19 | 76.42 | 85.50 | 68.61 | 81.75 | 72.31 | 83.58 | |
| 5-shot | None | 74.07 | 82.49 | 69.48 | 81.02 | 78.10 | 81.02 | 73.54 | 81.02 |
| MIFS | 74.41 | 82.83 | 69.43 | 86.44 | 69.43 | 74.45 | 74.15 | 80.00 | |
| CBFS | 78.45 | 85.52 | 79.67 | 87.30 | 71.53 | 80.29 | 75.38 | 83.65 | |
| 10-shot | None | 74.07 | 82.83 | 69.23 | 84.68 | 78.83 | 76.64 | 73.72 | 80.46 |
| MIFS | 72.73 | 82.15 | 66.28 | 85.59 | 83.21 | 73.72 | 73.79 | 79.22 | |
| CBFS | 77.44 | 84.18 | 76.12 | 85.71 | 74.45 | 78.83 | 75.28 | 82.13 | |
| Learning Method | Accuracy (%) | Precision (%) | Recall (%) | F1-Score (%) |
|---|---|---|---|---|
| Zero-shot CoT | 75.76 | 67.57 | 91.24 | 77.64 |
| zero-shot KE-CoT | 65.66 | 57.58 | 97.08 | 72.28 |
| 3-shot CoT | 76.77 | 70.73 | 84.67 | 77.08 |
| 3-shot KE-CoT-ExR | 72.05 | 64.21 | 89.05 | 74.62 |
| 3-shot KE-CoT | 76.9 | 73.24 | 75.91 | 74.55 |
| 5-shot KE-CoT | 72.05 | 63.64 | 91.97 | 75.22 |
| Dataset | Accuracy (%) | Precision (%) | Recall (%) | F1-Score (%) |
|---|---|---|---|---|
| Pima Indian Diabetes Dataset | 76.56 (−0.52) | 67.19 (−2.81) | 64.18 (+4.11) | 65.65 (−0.66) |
| Frankfurt Hospital Diabetes Dataset | 75.05 (−0.8) | 61.52 (−1.48) | 72.22 (+1.02) | 66.44 (−0.41) |
| Cleveland UCI Heart Disease Dataset | 85.19 (−0.33) | 86.61 (−0.69) | 80.29 (0) | 83.33 (−0.32) |
| Dataset | Ref. | Approach | |
|---|---|---|---|
| Diabetes Disease | Pima Indian Diabetes Dataset | Bukhari et al. [42] | Deep learning (ABP-SCGNN) |
| Alreshan et al. [43] | Deep learning (stack-ANN) | ||
| Frankfurt Hospital Diabetes Dataset | Alreshan et al. [43] | Deep learning (stack-ANN) | |
| Dambra et al. [45] | Random forest | ||
| Heart Disease | Cleveland UCI Heart Disease Dataset | Asif et al. [50] | Extra tree classifier |
| Bharti et al. [49] | Deep learning (ANN) | ||
| Chandrasekhar and Peddakrishna [52] | Soft voting ensemble method with feature scaling to address outliers |
Disclaimer/Publisher’s Note: The statements, opinions and data contained in all publications are solely those of the individual author(s) and contributor(s) and not of MDPI and/or the editor(s). MDPI and/or the editor(s) disclaim responsibility for any injury to people or property resulting from any ideas, methods, instructions or products referred to in the content. |
© 2025 by the author. Licensee MDPI, Basel, Switzerland. This article is an open access article distributed under the terms and conditions of the Creative Commons Attribution (CC BY) license (https://creativecommons.org/licenses/by/4.0/).
Share and Cite
Alomari, E. Evaluating ChatGPT for Disease Prediction: A Comparative Study on Heart Disease and Diabetes. BioMedInformatics 2025, 5, 33. https://doi.org/10.3390/biomedinformatics5030033
Alomari E. Evaluating ChatGPT for Disease Prediction: A Comparative Study on Heart Disease and Diabetes. BioMedInformatics. 2025; 5(3):33. https://doi.org/10.3390/biomedinformatics5030033
Chicago/Turabian StyleAlomari, Ebtesam. 2025. "Evaluating ChatGPT for Disease Prediction: A Comparative Study on Heart Disease and Diabetes" BioMedInformatics 5, no. 3: 33. https://doi.org/10.3390/biomedinformatics5030033
APA StyleAlomari, E. (2025). Evaluating ChatGPT for Disease Prediction: A Comparative Study on Heart Disease and Diabetes. BioMedInformatics, 5(3), 33. https://doi.org/10.3390/biomedinformatics5030033