Article

Integrating Boruta, LASSO, and SHAP for Clinically Interpretable Glioma Classification Using Machine Learning

by
Mohammad Najeh Samara
and
Kimberly D. Harry
*
School of Systems Science and Industrial Engineering, Binghamton University, Binghamton, NY 13902, USA
*
Author to whom correspondence should be addressed.
BioMedInformatics 2025, 5(3), 34; https://doi.org/10.3390/biomedinformatics5030034
Submission received: 26 April 2025 / Revised: 16 June 2025 / Accepted: 24 June 2025 / Published: 30 June 2025

Abstract

Background: Gliomas represent the most prevalent and aggressive primary brain tumors, requiring precise classification to guide treatment strategies and improve patient outcomes. Purpose: This study aimed to develop and evaluate a machine learning-driven approach for glioma classification by identifying the most relevant genetic and clinical biomarkers while demonstrating clinical utility. Methods: A dataset from The Cancer Genome Atlas (TCGA) containing 23 features was analyzed using an integrative approach combining Boruta, Least Absolute Shrinkage and Selection Operator (LASSO), and SHapley Additive exPlanations (SHAP) for feature selection. The refined feature set was used to train four machine learning models: Random Forest, Support Vector Machine, XGBoost, and Logistic Regression. Comprehensive evaluation included class distribution analysis, calibration assessment, and decision curve analysis. Results: The feature selection approach identified 13 key predictors, including IDH1, TP53, ATRX, PTEN, NF1, EGFR, NOTCH1, PIK3R1, MUC16, CIC mutations, along with Age at Diagnosis and race. XGBoost achieved the highest AUC (0.93), while Logistic Regression recorded the highest testing accuracy (88.09%). Class distribution analysis revealed excellent GBM detection (Average Precision 0.840–0.880) with minimal false negatives (5–7 cases). Calibration analysis demonstrated reliable probability estimates (Brier scores 0.103–0.124), and decision curve analysis confirmed substantial clinical utility with net benefit values of 0.36–0.39 across clinically relevant thresholds. Conclusions: The integration of feature selection techniques with machine learning models enhances diagnostic precision, interpretability, and clinical utility in glioma classification, providing a clinically ready framework that bridges computational predictions with evidence-based medical decision-making.

1. Introduction

Gliomas represent the most prevalent and aggressive primary brain tumors [1], categorized into low-grade gliomas (LGG) and glioblastoma multiforme (GBM) based on malignancy [2]. Accurate classification of gliomas is essential for determining optimal treatment strategies and improving patient prognosis [3]. Conventional grading methods primarily rely on histopathological evaluation, which, despite its clinical significance, remains time-intensive and susceptible to inter-observer variability [4]. Recent innovations in genomics and machine learning (ML) have facilitated data-driven approaches to glioma classification, offering improved accuracy and objectivity in diagnosis [5,6,7]. Genetic mutations play a critical role in glioma progression and patient outcomes [8]. Several key biomarkers, including Isocitrate Dehydrogenase 1 (IDH1), Tumor Protein P53 (TP53), and Alpha Thalassemia/Intellectual Disability Syndrome X-Linked (ATRX), have demonstrated strong associations with glioma classification and prognosis [9,10,11,12]. However, selecting the most informative genetic markers from thousands of potential candidates remains a formidable challenge.
Despite these advances, significant limitations persist in current glioma classification approaches. First, most studies focus on individual feature selection methods without systematic comparison across multiple techniques, potentially missing robust biomarkers that consistently appear across different methodologies. Second, many machine learning models operate as “black boxes,” lacking interpretability crucial for clinical adoption. Third, there is insufficient integration between feature selection and model development, often leading to suboptimal performance when models are tested on new data. Finally, the relative contributions of genetic versus clinical factors remain inadequately quantified in existing classification frameworks.
Feature selection techniques serve as indispensable tools for refining the genetic feature space, enhancing model interpretability, and improving classification performance [13,14,15]. Various approaches have been employed, including statistical methods (p-value ranking, correlation analysis), wrapper methods (recursive feature elimination), embedded methods (LASSO), and explanation-based techniques (SHAP values). However, each method has inherent biases and limitations, suggesting that an integrative approach combining multiple techniques might yield more robust biomarker identification.
This study addresses these gaps by developing a comprehensive framework for glioma classification that integrates three distinct feature selection techniques—Boruta, Least Absolute Shrinkage and Selection Operator (LASSO), and SHapley Additive exPlanations (SHAP)—to determine the most relevant genetic markers for glioma grading. The intersection of these selected features ensures a robust and interpretable biomarker set, optimizing classification performance. Subsequently, four machine learning algorithms—Random Forest (RF), Support Vector Machine (SVM), XGBoost, and Logistic Regression—are employed to evaluate the effectiveness of the selected features in glioma classification. Each model undergoes optimization through Randomized Grid Search and is assessed based on accuracy, precision, recall, F1-score, and ROC curve analysis.
The specific objectives of this study are to:
  • Identify key genetic and clinical markers for glioma classification through a systematic integration of Boruta, LASSO, and SHAP feature selection methods.
  • Optimize and compare multiple ML models (RF, SVM, XGBoost, and Logistic Regression) to assess classification performance using the selected biomarkers.
  • Enhance the interpretability of glioma prediction models by analyzing the contributions of selected biomarkers.
  • Develop a reproducible framework for glioma classification that can extend to other genomic-based cancer studies.
To the best of our knowledge, no previous studies have systematically compared Boruta, LASSO, and SHAP to effectively identify the common genetic markers relevant to glioma classification. While individual methods have been applied separately, the combined approach presented here offers a more robust identification of truly significant biomarkers by leveraging the complementary strengths of multiple feature selection techniques.
The remainder of this paper is structured as follows: Section 2 examines related work on glioma classification and feature selection. Section 3 describes the methodology, including dataset characteristics, feature selection techniques, and machine learning models. Section 4 presents experimental results, followed by discussions in Section 5. Finally, Section 6 concludes the study and outlines future research directions.

2. Related Work

2.1. Glioma Classification: The Role of Genetic and Patient-Specific Factors

Gliomas are classified based on histopathological characteristics and molecular alterations, which have a critical effect on tumor prognosis and therapeutic response [16]. The World Health Organization (WHO) classification of central nervous system tumors now incorporates molecular markers such as IDH1, TP53, and ATRX mutations, which have been established as significant determinants of glioma subtype differentiation [17]. IDH1 mutations are frequently observed in lower-grade gliomas and are associated with prolonged survival and better treatment responses [18]. In contrast, TP53 mutations are linked to tumor progression and poorer outcomes due to their role in cell cycle dysregulation [19]. ATRX alterations, commonly found in astrocytic gliomas, are associated with the alternative lengthening of telomeres (ALT) pathway, which contributes to tumor growth and aggressive behavior [20]. The integration of molecular biomarkers into glioma classification frameworks has enhanced diagnostic accuracy and provided more personalized treatment options for patients [21,22]. Beyond these well-established markers, several other genetic mutations have been associated with glioma classification and progression. Phosphatase and Tensin Homolog (PTEN), a well-known tumor suppressor, regulates cell growth and apoptosis, preventing uncontrolled proliferation [23]. In addition, alterations in Epidermal Growth Factor Receptor (EGFR) are frequently detected in glioblastomas and contribute to increased tumor aggressiveness [24]. Moreover, Capicua Transcriptional Repressor (CIC) mutations are commonly linked to oligodendrogliomas, influencing tumorigenesis through transcriptional regulation [25]. Additional key biomarkers, including MUC16, PIK3CA, NF1, PIK3R1, FUBP1, RB1, NOTCH1, BCOR, CSMD3, and SMARCA4, are involved in various biological processes such as tumor suppression, signal transduction, and chromatin remodeling [26,27,28,29]. In addition to genetic mutations, patient-specific clinical factors such as Age at Diagnosis, gender, and race are also considered important factors in glioma classification and prognosis [30,31,32]. Age at Diagnosis has been recognized as a crucial determinant of survival, with younger patients typically exhibiting better outcomes than older individuals [33,34]. Gender differences in glioma incidence and progression have also been reported, with males generally experiencing higher prevalence and more aggressive tumor progression compared to females [35,36]. Additionally, racial disparities in glioma outcomes have been observed, with studies indicating differences in survival rates and treatment responses among various racial and ethnic groups [37,38].
Despite these advances in understanding the molecular basis of gliomas, several critical gaps remain. First, there is limited consensus on which combination of genetic and clinical biomarkers offers the optimal classification accuracy. Second, the relative importance of different mutations in predicting glioma grade requires further elucidation through systematic comparative analysis. Third, while individual biomarkers have been studied extensively, an integrated approach combining multiple feature selection methods to identify the most robust markers is lacking. This study aims to address these gaps by developing a comprehensive framework that systematically evaluates and combines multiple biomarker selection techniques.

2.2. Machine Learning for Glioma Classification

Supervised learning models have been widely employed in glioma classification, with Support Vector Machines (SVM) demonstrating robust performance in distinguishing between tumor grades [39,40,41]. Different kernel functions (linear, radial basis function, polynomial, and sigmoid) enable SVM to handle various data distributions effectively. Ensemble learning techniques, which integrate multiple models to enhance stability and robustness, have further improved classification accuracy, particularly in addressing class imbalances present in medical datasets [41,42]. Studies have shown that ensemble models combining SVC, AdaBoost, k-nearest neighbors (KNN), and Random Forest outperform individual models, achieving superior accuracy in differentiating high-grade and low-grade gliomas [43,44,45]. Deep learning, particularly Convolutional Neural Networks (CNNs), has emerged as a transformative approach for glioma classification due to its ability to analyze complex imaging data [46,47,48]. CNNs effectively extract high-level features from medical images, enhancing glioma detection accuracy [46,47]. Pre-trained models such as EfficientNet-B0 have been utilized to leverage features learned from extensive visual datasets, allowing for efficient feature extraction even with a limited number of medical images [49]. In another study, CNN-based models surpass traditional machine learning approaches in terms of sensitivity, specificity, and overall classification accuracy [50]. Despite significant advancements, several challenges persist in glioma classification. Tumor heterogeneity and the complexity of the tumor microenvironment pose major obstacles in developing universally accurate models [51]. Furthermore, gliomas exhibit immunosuppressive properties, complicating treatment strategies [52]. Recent efforts have focused on leveraging machine learning to predict immune subtypes and guide immunotherapy approaches [53]. However, interdisciplinary collaboration between computational scientists and medical professionals should be emphasized to refine methodologies and bridge the gap between machine learning innovations and clinical applications [54].

2.3. Feature Selection for Biomarker Discovery in Gliomas

Feature selection is essential in glioma biomarker discovery as it identifies the most significant molecular markers, reduces dimensionality, and enhances classification performance [55,56,57]. Several advanced methodologies have been developed, integrating statistical, machine learning, and network-based techniques to enhance glioma classification and prognosis prediction. MetaWise is a hybrid feature selection approach that integrates LASSO and Minimum Redundancy–Maximum Relevance (mRMR) with a rank-based weighting method [55]. This method, proposed in [55], has proven to enhance biomarker interpretability and predictive accuracy by effectively selecting the most relevant features while minimizing redundancy. Its application to serum-based metabolomic datasets identified 11 common biomarkers and achieved high classification performance, with accuracy rates of 96.711%, 92.093%, and 86.910% across different survival-based datasets [55]. Another effective method combines Weighted Gene Co-Expression Network Analysis (WGCNA) with LASSO regression to identify prognostic biomarkers in glioma [58]. WGCNA constructs co-expression networks to detect functionally related genes, while LASSO refines the selection by eliminating less significant features [58,59]. This approach identified SLC8A2, ATP2B3, and SRCIN1 as key biomarkers, linking them to immune infiltration and drug sensitivity, offering potential targets for personalized therapies [60]. Moreover, a graph database strategy has also been applied, which relies on integrating clinical and gene expression data to identify glioma recurrence biomarkers [61]. In the study conducted by [61], the proposed approach utilized degree centrality and community detection to identify 35 genes linked to tumor recurrence in IDH wild-type GBM. Additionally, pathway enrichment analysis revealed that neuroactive ligand–receptor interaction and GPCR ligand binding play significant roles in tumor progression [61]. Sparse multinomial regression has been utilized for multi-omics integration, refining glioma classification while maintaining high predictive accuracy and detecting molecular outliers [62]. Correspondingly, Vieira et al. (2024) applied sparse canonical correlation analysis (DIABLO) to mRNA, DNA methylation, and miRNA data from TCGA, identifying key molecular features distinguishing glioblastoma from lower-grade gliomas [63]. Moreover, genetic optimization algorithms have also been adopted to distinguish subtype-specific glioblastoma biomarkers, improving biological relevance and guiding targeted therapies [64]. Lastly, but not least, multi-objective feature selection frameworks, such as Non-dominated Sorting Genetic Algorithm II—Convex Hull (NSGA2-CH) and Non-dominated Sorting Genetic Algorithm II—Convex Hull with Sampling (NSGA2-CHS), have demonstrated effectiveness in balancing classification performance and feature set size across cancer datasets [65].
While previous studies have demonstrated the value of individual feature selection methods such as LASSO [55] in glioma biomarker discovery, the present study makes a distinct contribution by systematically comparing and integrating multiple feature selection approaches (Boruta, LASSO, and SHAP). Rather than relying on a single technique, this integrated approach identifies biomarkers that consistently emerge across different methodologies, potentially offering greater robustness and generalizability. Furthermore, this study uniquely quantifies the relative importance of these selected features in classification performance across multiple machine learning algorithms, providing insights into their complementary predictive value.

3. Methodology

3.1. Data Collection and Preprocessing

The dataset used in this study was sourced from Tasci et al. (2022) [66] and derived from The Cancer Genome Atlas (TCGA). It includes 23 features, comprising biomarkers such as IDH1, TP53, ATRX, PTEN, EGFR, and CIC, along with clinical factors like Age at Diagnosis, gender, and race, which are essential for distinguishing low-grade gliomas (LGG) from glioblastoma multiforme (GBM). The categorical variables were already encoded as binary or numerical representations, ensuring consistency for machine learning models [67]. Preprocessing steps involved ensuring data completeness, standardizing continuous variables to maintain scale consistency [68], and applying a train/test split (80% training, 20% testing) with stratified sampling to preserve the original class distribution (58.05% LGG, 41.95% GBM) in both training and testing set [69]. This stratified approach ensured balanced representation of both glioma grades throughout the analysis pipeline [69]. To prevent data leakage, we implemented a nested cross-validation approach with strict data separation. The dataset was first split into 80% training and 20% testing sets using stratified sampling. All feature selection methods (Boruta, LASSO, and SHAP) were applied exclusively to the training set. Hyperparameter optimization was performed using 5-fold cross-validation within the training data only, ensuring the test set remained completely untouched throughout the entire model development process. The test set was used solely for final performance evaluation. In addition, stratified sampling was implemented during the train/test split to preserve the original class distribution in both training and testing sets, ensuring balanced representation of both glioma grades throughout the analysis pipeline. A detailed description of the dataset, including variable definitions, is publicly available at the UCI Machine Learning Repository.

3.2. Feature Selection Techniques

This study employed three distinct feature selection methods—Boruta, LASSO, and SHAP—each offering unique advantages in identifying key genetic and clinical factors contributing to glioma classification. The intersection of selected features from these methods ensures a robust and interpretable biomarker set, enhancing model performance and reliability.

3.2.1. Boruta: All-Relevant Feature Selection

Boruta is a wrapper-based feature selection method designed to identify all relevant variables by iteratively evaluating their importance using a Random Forest classifier [70]. Unlike traditional feature selection techniques that may discard important but weakly correlated variables, Boruta retains features that contribute meaningfully to classification [71]. The importance score I j for each feature j is computed as [72]:
I j = 1 T t = 1 T G j t
where
  • G j t is the Gini importance of the feature j in the t-th tree of the Random Forest model.
  • T is the total number of trees in the forest.
Boruta compares each feature’s importance score against shadow features (randomly shuffled copies of original features). A feature is considered relevant if:
I j > max I shadow
where max I shadow is the highest importance score among shadow features.
In this study, Boruta was applied with 300 iterations, allowing features with at least 85% importance to be retained. The method assigned a significance threshold and iteratively compared real features against randomly shuffled shadow features. Variables that consistently outperformed the shadow features were considered essential for glioma classification. This approach ensured that no potentially useful biomarker was prematurely eliminated, making it an ideal choice for exploratory feature selection in high-dimensional genomic data.

3.2.2. LASSO: L1 Regularization-Based Feature Reduction

Least Absolute Shrinkage and Selection Operator (LASSO) is a regularization-based feature selection method that applies an L1 penalty to regression coefficients, shrinking less important features to zero [73]. Unlike Boruta, which focuses on identifying all relevant features, LASSO prioritizes sparsity by selecting the most predictive subset of variables, thus reducing overfitting and improving generalizability. LASSO was applied with cross-validation (CV = 5) to determine the optimal penalty parameter, ensuring that the most relevant biomarkers were retained while eliminating noise. The objective function for LASSO regression is [74]:
β ^ = arg min β i = 1 n y i j = 1 p X i j β j 2 + λ j = 1 p β j
where
  • y i is the target variable (glioma grade).
  • X i j represents the input feature values.
  • β j are the regression coefficients.
  • λ is the regularization parameter controlling feature selection.
Features with coefficients shrunk to zero (i.e., β j = 0 ) are removed, while non-zero coefficients are retained.

3.2.3. SHAP: Explainability-Based Feature Ranking

SHapley Additive exPlanations (SHAP) is an explainability-driven feature selection approach that quantifies the contribution of each variable to the model’s predictions [75]. Unlike Boruta and LASSO, which focus on statistical importance, SHAP values are derived from game theory and provide insights into how each feature influences classification decisions [75].
To compute SHAP values, an XGBoost classifier was trained, and the mean absolute SHAP value for each feature was calculated. A threshold of 0.02 was set to filter out less influential variables, ensuring that only the most impactful genetic and clinical factors were retained. This method was particularly valuable for enhancing interpretability, as it allowed for a transparent assessment of each biomarker’s role in glioma classification.
The SHAP value for the feature j in an instance x is computed as [76]:
ϕ j = S F { j } S ! F S 1 ! F ! f S { j } f S
where
  • F is a full set of features.
  • S is a subset of features excluding j .
  • f S is the model prediction using only subset S.
  • f S { j } is the model prediction after adding a feature j .
  • The fraction represents the weighting factor based on SHapley values from cooperative game theory.
SHAP values indicate how much each feature positively or negatively contributes to glioma classification.

3.2.4. Intersection of Selected Features and Rationale for Selection

After applying the three feature selection techniques, the intersection of selected features was determined by identifying biomarkers that were consistently chosen across multiple methods. All features that were selected by all three feature selection techniques were considered robust and were used in subsequent machine learning models. This approach provided a balance between comprehensiveness (Boruta), sparsity (LASSO), and interpretability (SHAP), ensuring that the final feature set was both informative and generalizable.

3.3. Machine Learning Models for Classification

To evaluate the effectiveness of the selected features in glioma classification, four machine learning models were implemented: Random Forest (RF), Support Vector Machine (SVM), XGBoost, and Logistic Regression. These models were chosen for their ability to handle high-dimensional genomic data and their proven effectiveness in medical classification tasks. Each model underwent hyperparameter tuning using Randomized Grid Search, ensuring optimal performance across training and testing datasets [77].

3.3.1. Random Forest (RF)

RF, an ensemble learning method based on decision trees, was employed for its robustness against overfitting and ability to handle non-linear relationships within the data [78]. The model was optimized by tuning the number of estimators (trees), maximum depth, and minimum sample split. This approach enhanced the model’s generalizability [79], allowing it to capture complex genetic interactions contributing to glioma classification.

3.3.2. Support Vector Machine (SVM)

SVM was selected for its effectiveness in high-dimensional spaces and its strong theoretical foundation in classification problems [80]. The hyperparameter search included kernel selection (linear, radial basis function, and polynomial), regularization parameter (C), and gamma values, enabling the model to maximize the margin between glioma subtypes [80]. Given the limited sample size and feature selection process, SVM’s ability to work efficiently with smaller datasets was particularly advantageous [81].

3.3.3. XGBoost

XGBoost, a gradient boosting algorithm, was incorporated due to its ability to capture non-linear dependencies and handle missing data efficiently [82]. The model was optimized by adjusting the number of estimators, learning rate, maximum depth, and subsample ratio, ensuring a balance between bias and variance [83]. XGBoost’s feature importance analysis further contributed to validating the selected biomarkers, reinforcing its interpretability for glioma classification.

3.3.4. Logistic Regression

Logistic Regression served as a baseline model, providing a benchmark for evaluating the performance of more complex algorithms. The model underwent tuning for regularization strength (C) and penalty type (L1 or L2) to ensure optimal parameter selection [84]. Despite its simplicity, Logistic Regression remains an essential model in biomedical applications, offering transparency in the influence of individual features on classification decisions [85].

3.4. Model Training and Evaluation

Each machine learning model underwent training using the selected feature set, ensuring optimal classification performance. Hyperparameter tuning was conducted using Randomized Grid Search, as described in Section 3.3, to determine the best model configurations. To validate the models, a five-fold cross-validation strategy was applied, followed by performance evaluation using accuracy, precision, recall, F1-score, and Receiver Operating Characteristic Area Under the Curve (ROC-AUC).

3.4.1. Training Procedure and Cross-Validation Strategy

To optimize classification performance, each model was trained using only the most relevant genetic and clinical features. Randomized Grid Search, as outlined in Section 3.3, was employed for hyperparameter tuning, allowing an efficient exploration of parameter combinations to maximize model accuracy and stability. A five-fold cross-validation (CV) strategy was applied, ensuring that model evaluation was conducted on multiple subsets of the dataset. During each CV fold, feature selection was re-applied to the training portion only, maintaining strict separation from validation data. The dataset was split into five equal parts, with four used for training and the remaining one for validation, rotating across all partitions. This approach helped mitigate potential biases from imbalanced class distributions and improved generalization to unseen data [86].

3.4.2. Performance Metrics for Model Assessment

To comprehensively evaluate model effectiveness, multiple performance metrics were computed for both training and test datasets:
  • Accuracy: Measures the overall correctness of predictions, calculated as [87]:
Accuracy = TP + TN TP + TN + FP + FN
where TP (true positives), TN (true negatives), FP (false positives), and FN (false negatives) represent classification outcomes.
  • Precision: Evaluates the proportion of correctly identified positive cases among predicted positives [87]:
Precision = TP TP + FP
A high precision indicates a low false positive rate, which is crucial in medical diagnosis.
  • Recall (Sensitivity): Measures the model’s ability to correctly identify positive cases [87]:
Recall = TP TP + FN
High recall ensures that most glioma cases are correctly classified.
  • F1-score: Provides a balance between precision and recall [87]:
F 1 - score = 2 × Precision × Recall Precision + Recall
This metric is particularly useful when dealing with imbalanced datasets, as it penalizes extreme variations in precision and recall [87].
The ROC curve plots the True Positive Rate (TPR) against the False Positive Rate (FPR) at different classification thresholds [88]. The AUC quantifies the model’s ability to distinguish between glioma grades, with a value closer to 1.0 indicating superior performance [88].

3.4.3. Comparative Analysis of Model Performance

Each model’s performance was assessed using these metrics, with results compared across training and test datasets to evaluate generalizability. ROC-AUC analysis was performed to visualize classification effectiveness, providing an additional layer of validation for model selection. The comparative evaluation ensured that the most accurate, interpretable, and clinically relevant model was identified for glioma classification.

3.5. Sample Size Justification and Overfitting Control

The dataset includes 1968 subjects, which substantially exceeds the sample sizes in several published studies applying ML models for glioma classification [89]. Prior studies have demonstrated robust classification outcomes with cohorts ranging from 52 to 200 samples [89,90,91]. Furthermore, to mitigate overfitting risk, feature selection was strictly applied only on the training set, and model performance was evaluated using five-fold cross-validation combined with a hold-out test set. This ensures the generalizability of results and prevents information leakage [92,93]. Moreover, to ensure that our study was sufficiently powered to detect clinically meaningful differences in model performance, we conducted a post hoc power analysis for the area under the ROC curve (AUC). Specifically, we evaluated whether the test set sample size (n = 393) provided adequate statistical power to detect differences between our observed AUC values (ranging from 0.90 to 0.93) and a clinically relevant lower bound of AUC = 0.80. As detailed in Supplementary Table S1, all models achieved minimum statistical power exceeding 99%, with observed effect sizes (0.10–0.13) substantially larger than the minimum detectable difference at 80% power (as low as 0.036). For example, the required test sample size to detect an AUC of 0.90 versus 0.80 at 80% power is 229, well below our sample size of 393.

4. Results

4.1. Descriptive Statistics

An initial exploratory analysis was conducted to summarize the dataset’s characteristics. The dataset includes both genetic biomarkers and clinical factors, such as Age at Diagnosis, gender, and glioma grade classification. The summary statistics, presented in Supplementary Table S2, provide an overview of the dataset’s distribution.
For Age at Diagnosis, the mean age was 50.94 ± 15.70 years, reflecting a wide variability among patients. Categorical variables, including genetic mutations and demographic factors, were analyzed as proportions. The dataset shows a higher prevalence of LGG cases (58.05%) compared to GBM (41.95%). Gender distribution is nearly balanced, with 58.16% male and 41.84% female. Several key genetic mutations, such as IDH1, TP53, and ATRX, exhibit substantial variation among patients, influencing glioma classification and prognosis.

4.2. Feature Selection Results

4.2.1. Individual Feature Selection Outcomes

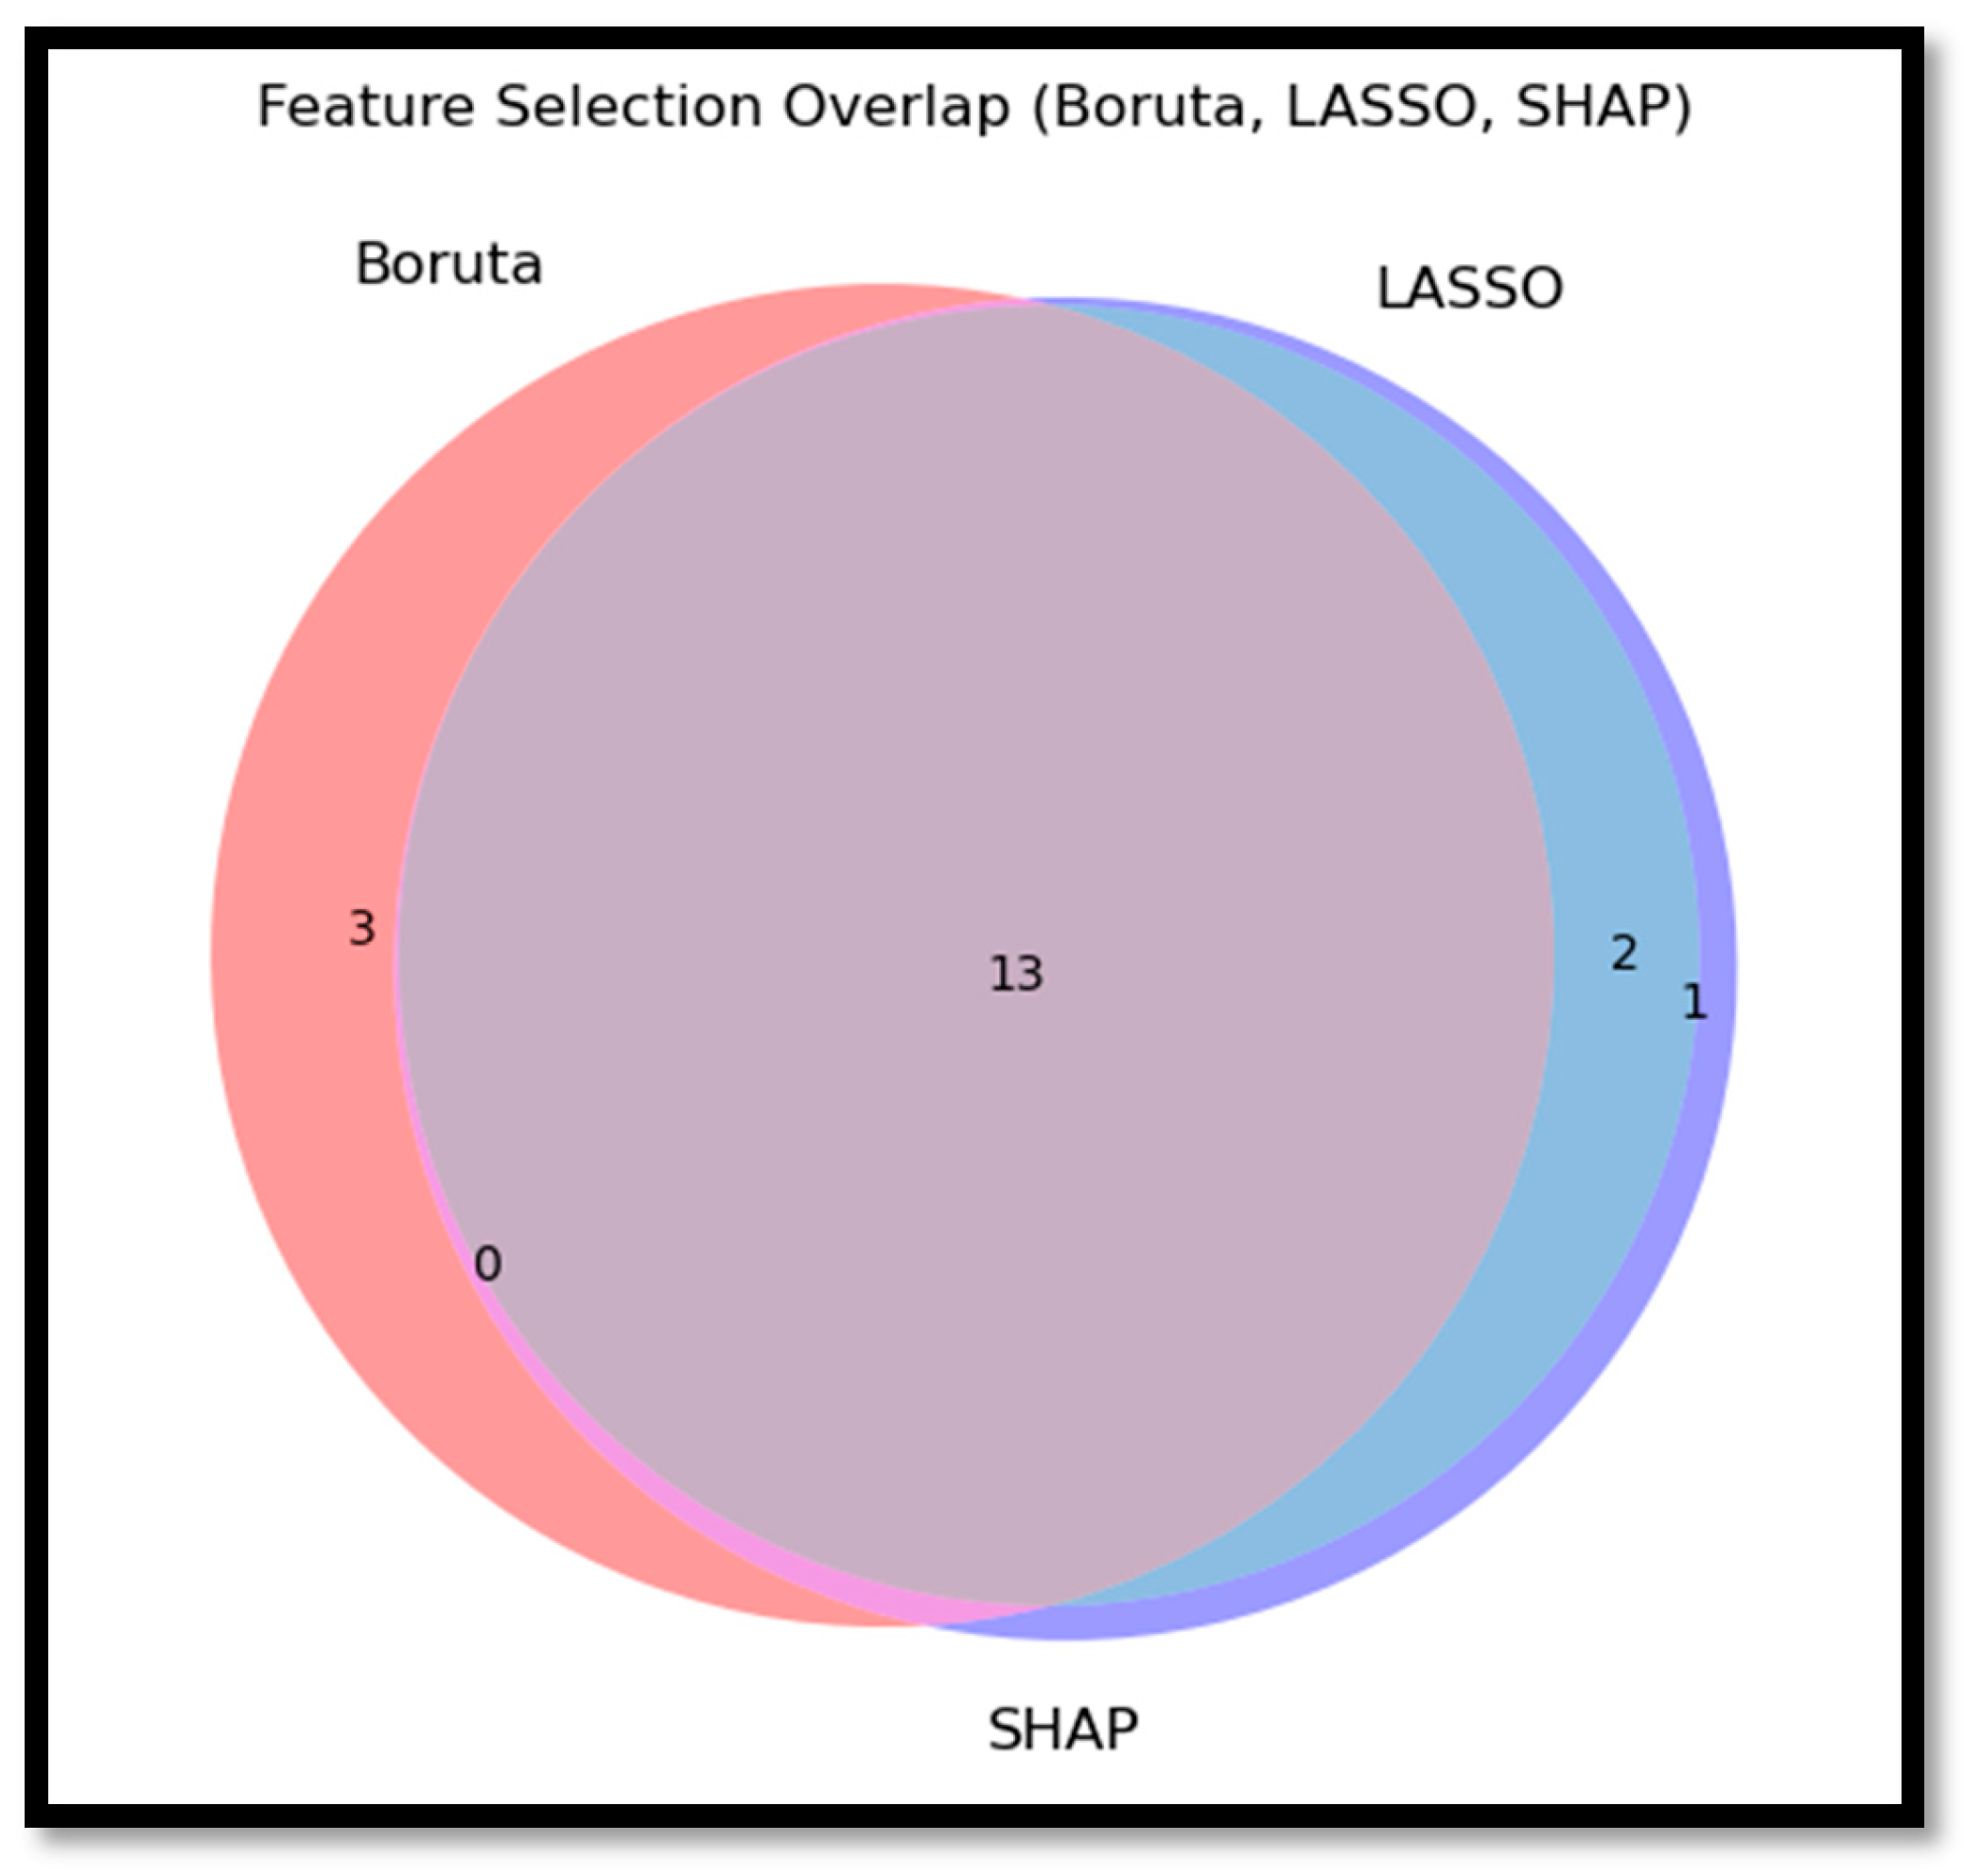
  • Boruta Selection: This all-relevant feature selection method identified 16 features as significant, confirming their importance through an iterative Random Forest-based process. Features retained included Age at Diagnosis, race, IDH1, TP53, ATRX, PTEN, EGFR, CIC, MUC16, NF1, PIK3R1, FUBP1, RB1, NOTCH1, SMARCA4, and IDH2.
  • LASSO Selection: LASSO identified a set of 15 predictive features, encompassing both genetic and clinical attributes. Notably, gender was selected in this method, alongside Age at Diagnosis, race, IDH1, TP53, ATRX, PTEN, EGFR, CIC, MUC16, NF1, PIK3R1, NOTCH1, GRIN2A, and IDH2.
  • SHAP Selection: The SHAP-selected feature set largely overlapped with LASSO, with 16 features identified: gender, Age at Diagnosis, race, IDH1, TP53, ATRX, PTEN, EGFR, CIC, MUC16, PIK3CA, NF1, PIK3R1, NOTCH1, GRIN2A, and IDH2.

4.2.2. Intersection of Selected Features

A total of 13 features were retained across all three methods, ensuring robustness and consistency in feature selection. These features include IDH1, PTEN, ATRX, NF1, NOTCH1, TP53, EGFR, PIK3R1, MUC16, Age at Diagnosis, IDH2, CIC, and race. The Venn diagram (Figure 1) illustrates the overlap among the three methods, highlighting the shared and uniquely selected features.

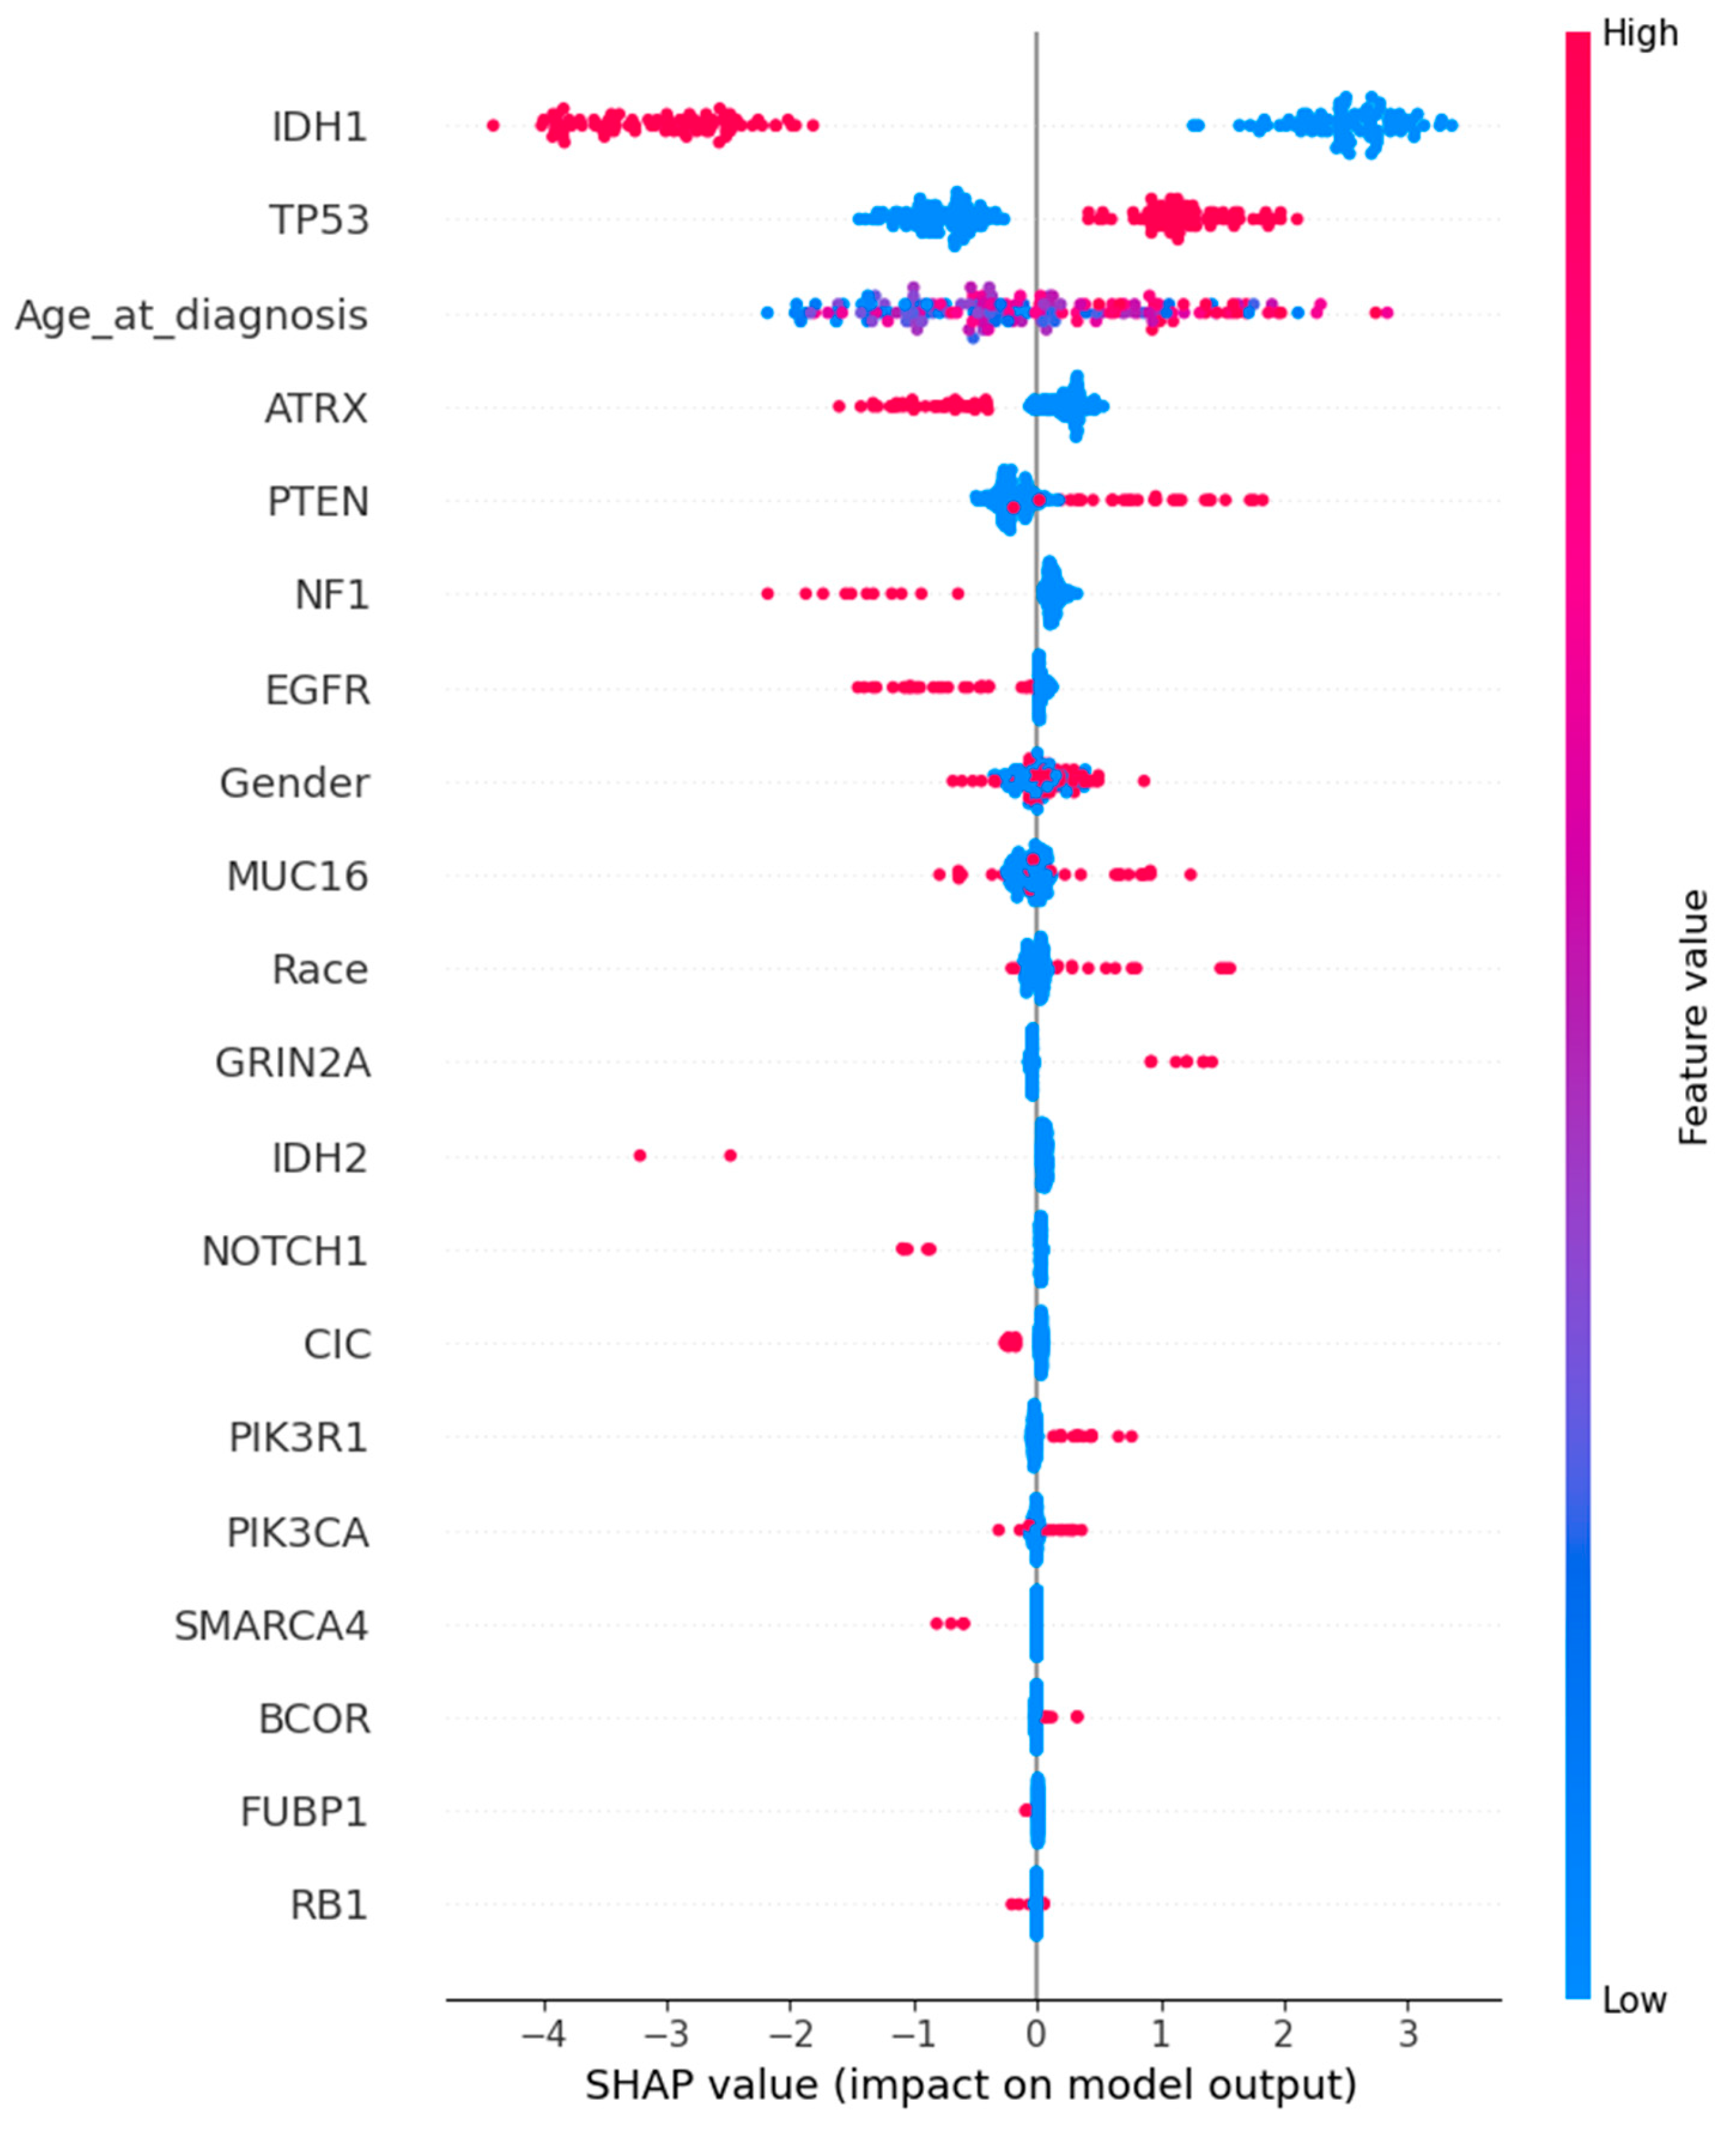
4.2.3. SHAP Feature Importance Analysis

To further validate the relevance of the selected biomarkers, SHAP values were computed to assess each feature’s impact on model predictions (Figure 2). The visualization emphasizes the influence of IDH1, TP53, ATRX, and PTEN as key predictors, reinforcing their established role in glioma classification. Beyond global feature importance ranking, SHAP analysis provides case-specific explanations that are essential for clinical decision-making.
Individual case SHAP waterfall plot (Supplementary Figures S1 and S2) demonstrates how specific combinations of biomarkers influence classification decisions for individual patients, providing clinicians with transparent, case-specific rationale for each prediction. For the LGG case (Supplementary Figure S1), the model’s prediction (E[f(X)] = −0.645) is primarily driven by IDH1 mutation (SHAP = −2.71) and younger age (SHAP = −1.28), which strongly favor LGG classification, while TP53 and GRIN2A mutations provide smaller positive contributions toward GBM risk. Conversely, the GBM case (Supplementary Figure S2) shows a high-confidence prediction (E[f(X)] = +5.66) with strong positive contributions from IDH1 wild-type status (SHAP = +2.36), PTEN alteration (+1.17), TP53 mutation (+1.09), and advanced age (+0.99), collectively driving the high-grade classification.

4.3. ML Model Performance

4.3.1. Hyperparameter Tuning Results

The best-performing hyperparameters for each model were identified and are summarized in Table 1. These configurations were then used to evaluate the models on both training and test datasets.

4.3.2. Training and Testing Performance

Table 2 summarizes the classification performance of each model. The results highlight that Random Forest and XGBoost exhibited the highest classification accuracy across both training and testing datasets, indicating their robustness in glioma classification. Logistic Regression and SVM also performed well, though SVM demonstrated a slight decrease in recall, which may indicate misclassification of certain glioma subtypes.

4.3.3. Model Comparison

  • Random Forest achieved the highest accuracy on the training set (90.16%) and maintained an acceptable generalization to the test set with an accuracy of 84.53%. It demonstrated a balanced trade-off between precision and recall.
  • SVM obtained an accuracy of 88.22% during training but showed a slight decline on the test set (85.71%), suggesting potential overfitting.
  • XGBoost exhibited stable performance, with an accuracy of 87.48% in training and 86.30% in testing. This model effectively balanced recall and precision, making it well-suited for identifying glioma subtypes.
  • Logistic Regression served as a baseline model, achieving an accuracy of 87.92% in training and 88.09% in testing, demonstrating consistent performance.

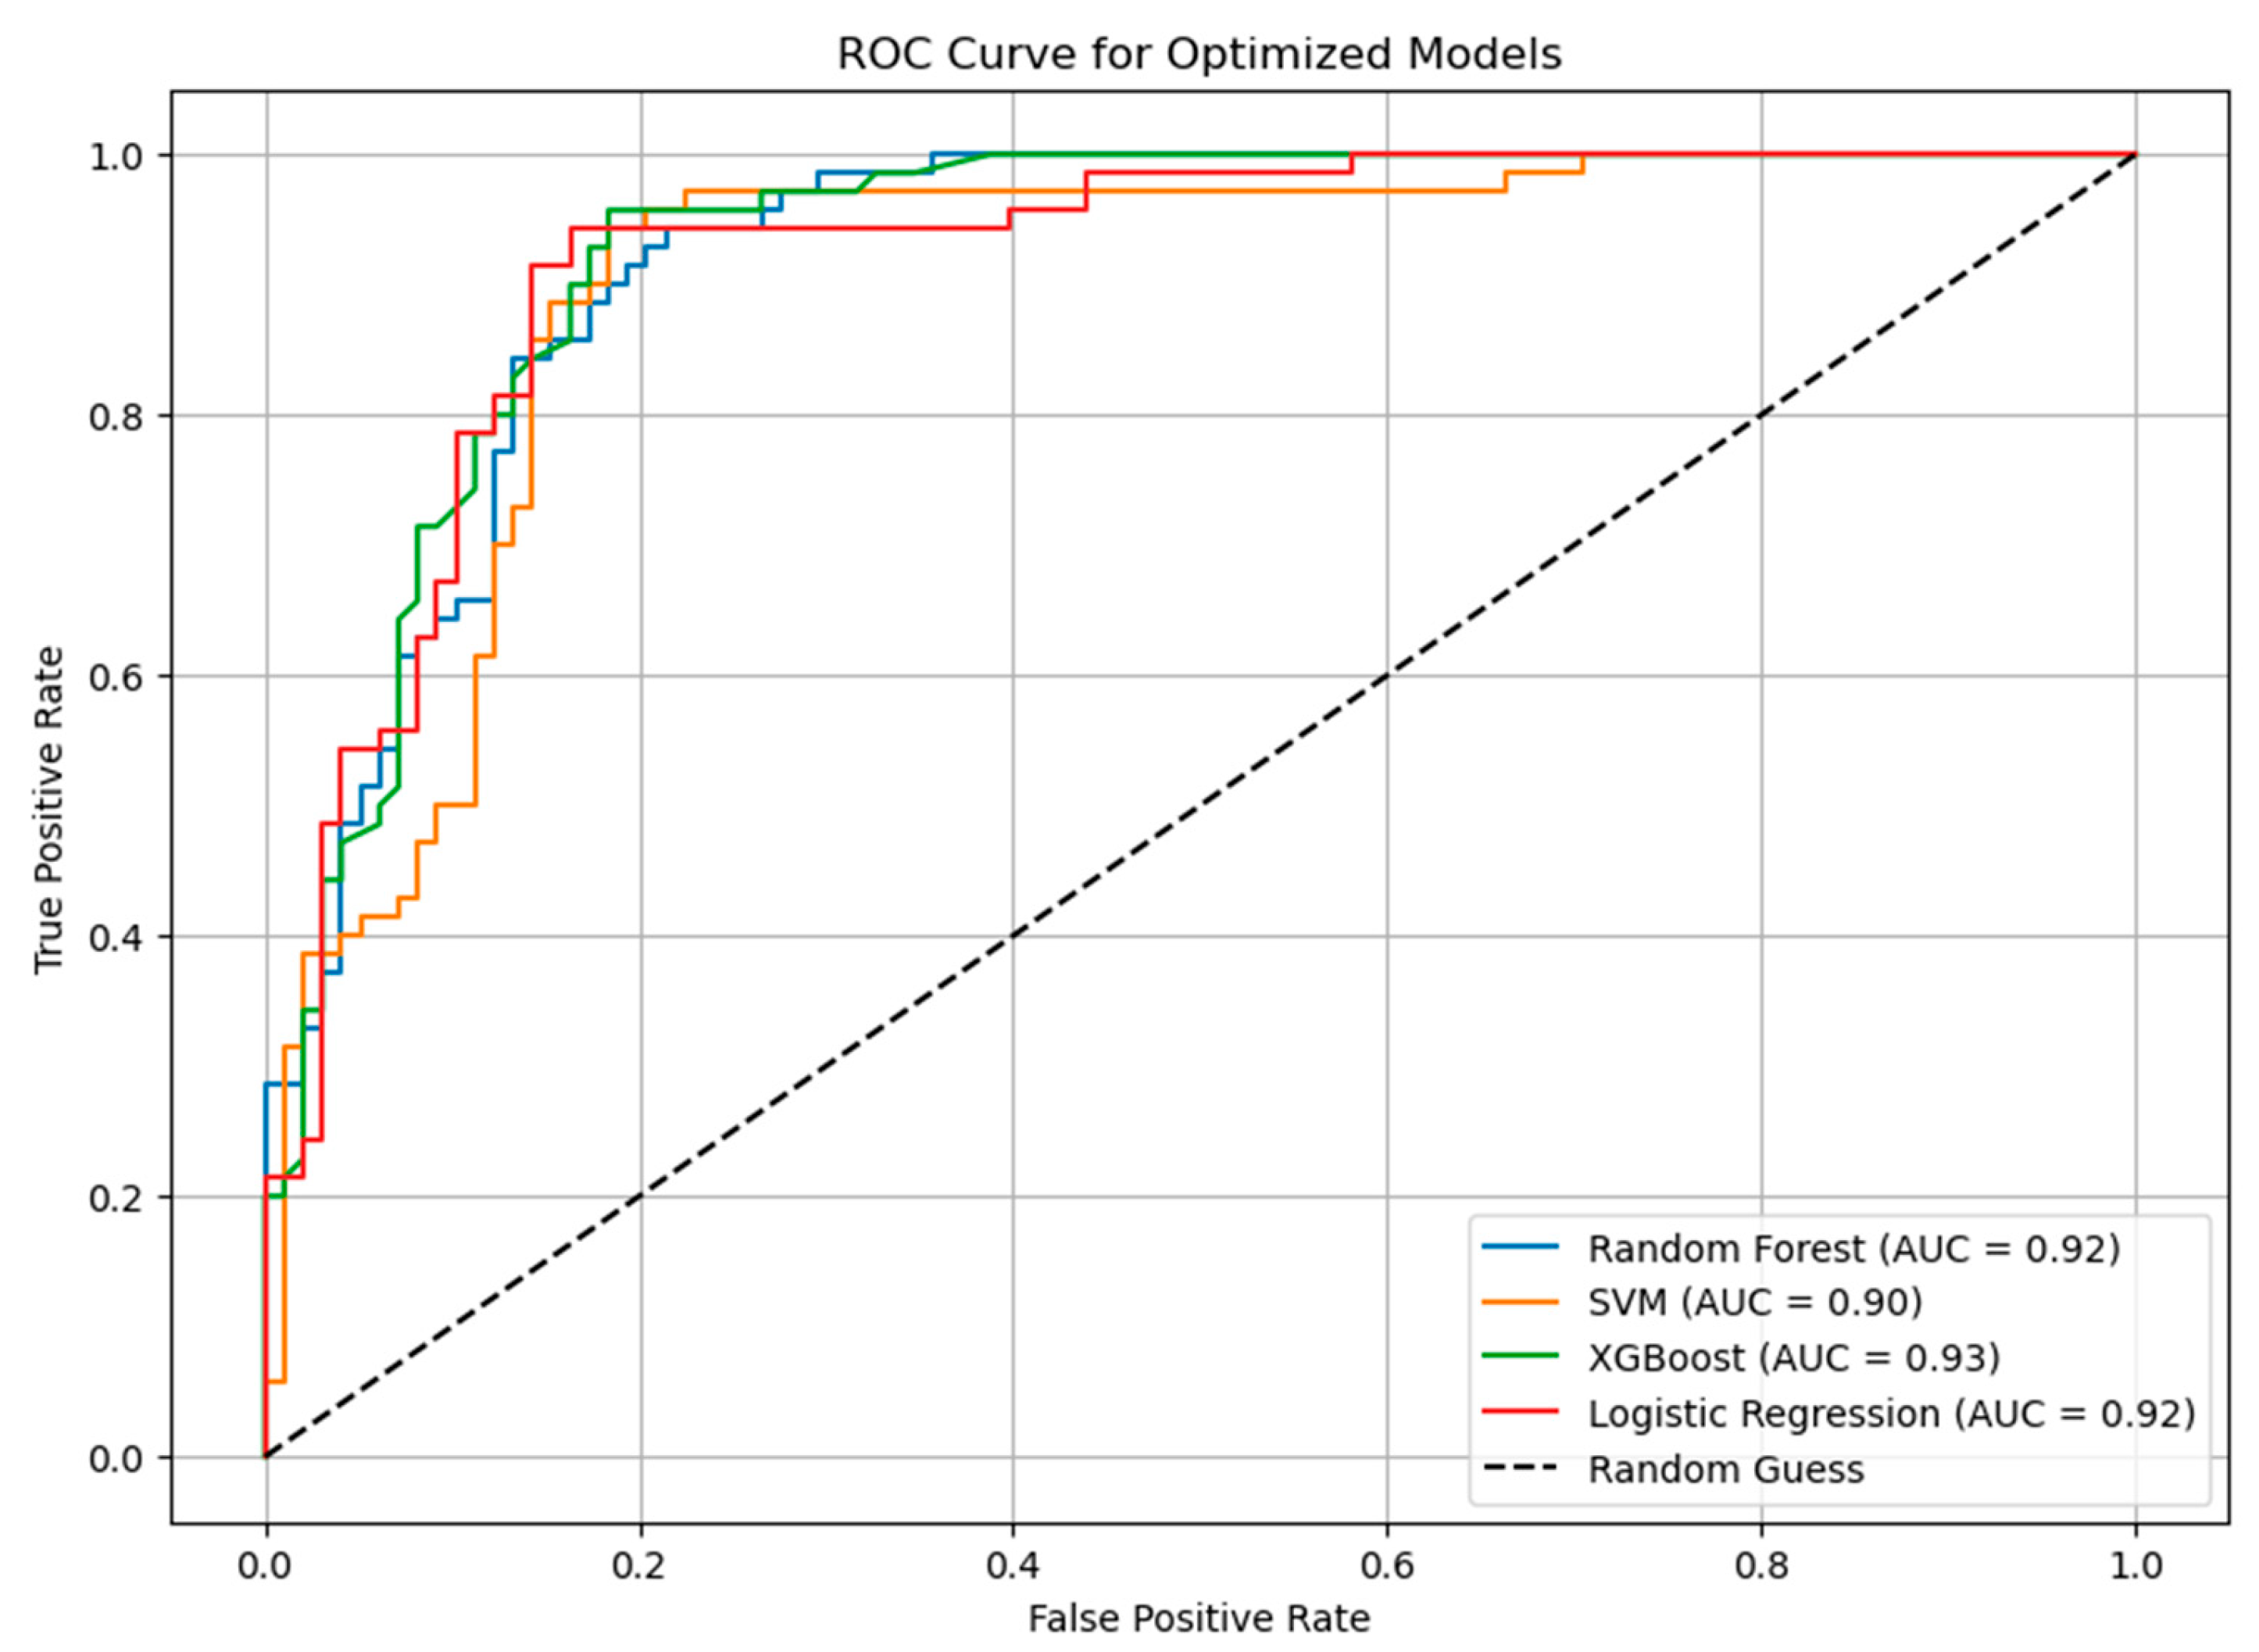
4.3.4. ROC Curve Analysis

The ROC curve presented in Figure 3 illustrates the trade-off between the True Positive Rate (Sensitivity) and the False Positive Rate across varying classification thresholds, offering a comprehensive evaluation of the models’ discriminative capabilities in glioma classification. Among the evaluated models, XGBoost demonstrated the highest classification performance, achieving an AUC of 0.93, making it particularly valuable for clinical applications where accurate risk stratification is critical. RF and Logistic Regression both attained an AUC of 0.92. SVM achieved the lowest AUC of 0.90. However, all models substantially outperformed a random classifier, represented by the dashed diagonal line, which would yield an AUC of 0.50.

4.4. Class Distribution and Minority Class Performance Analysis

To address class imbalance considerations (58.05% LGG vs. 41.95% GBM), we conducted detailed class-specific performance analysis, including confusion matrices, precision–recall curves for GBM detection, and evaluation of class balancing techniques.

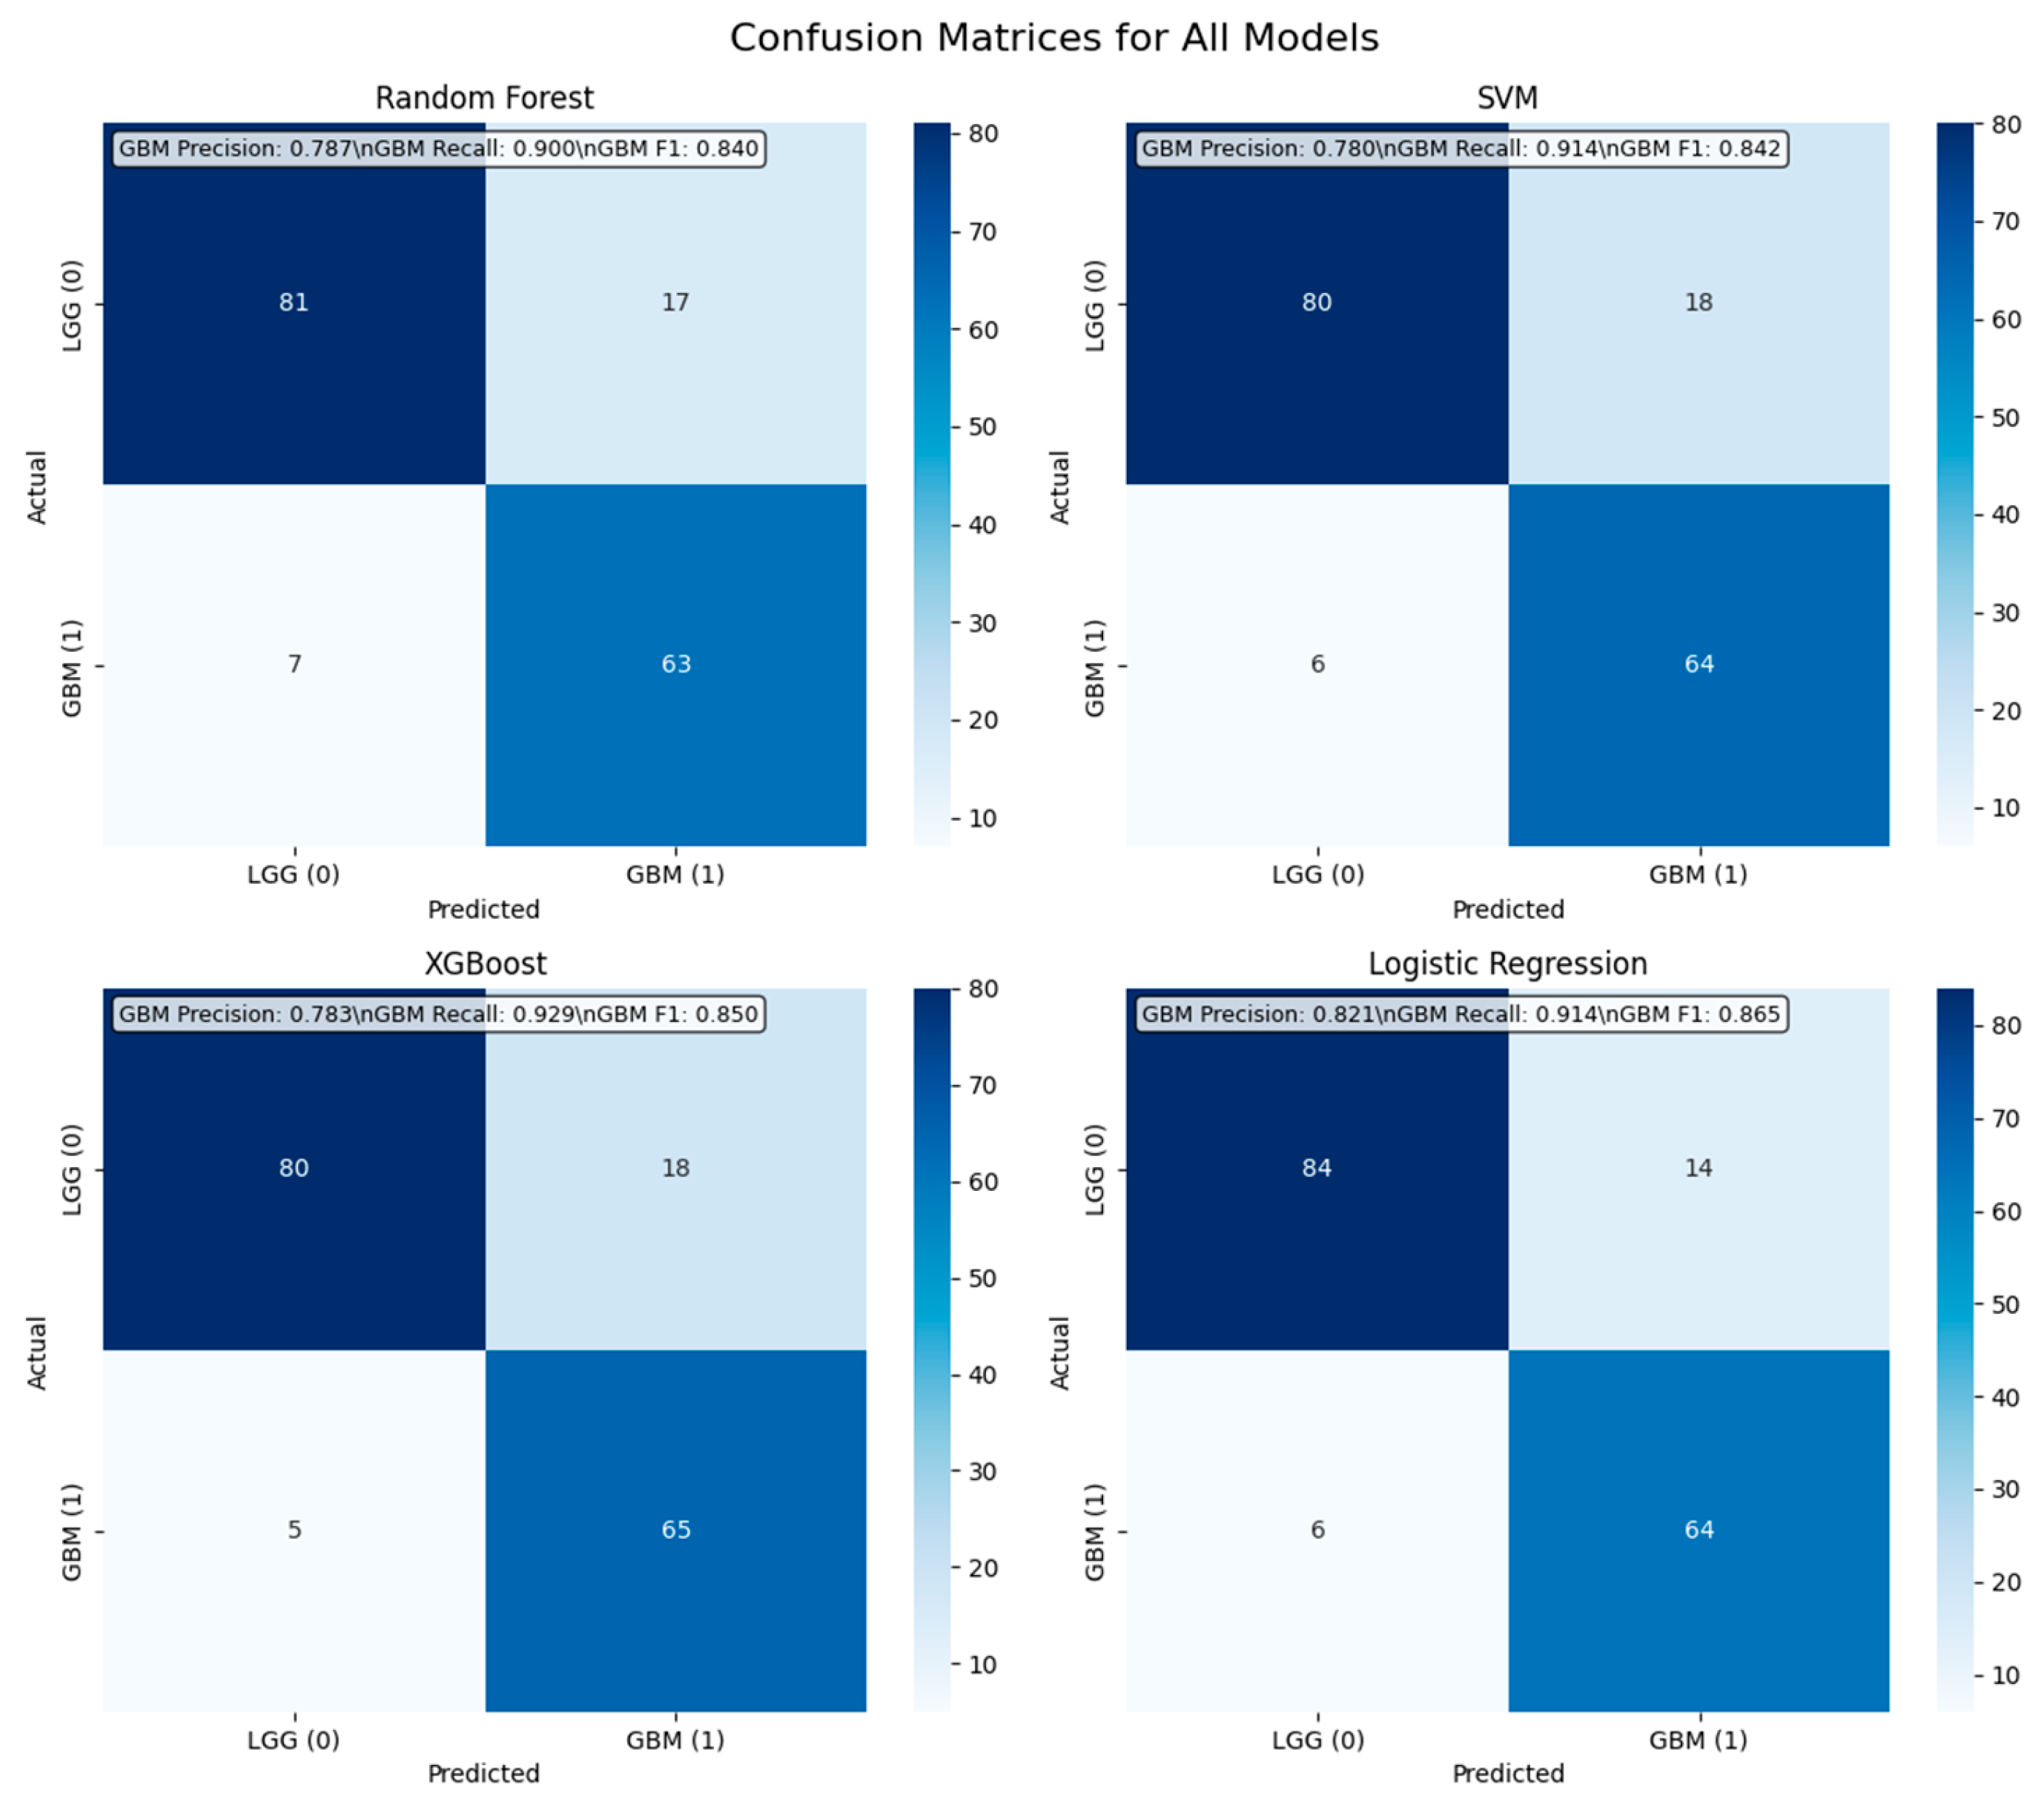
4.4.1. Confusion Matrix Analysis

Detailed confusion matrices (Figure 4) revealed excellent performance for both classes across all models. XGBoost demonstrated the best GBM recall (92.9%) with only five false negatives, while Logistic Regression achieved the highest GBM precision (82.1%). All models maintained strong specificity for LGG classification (81.6–85.7%) while achieving high sensitivity for GBM detection (88.6–92.9%), critical for avoiding missed aggressive tumors.

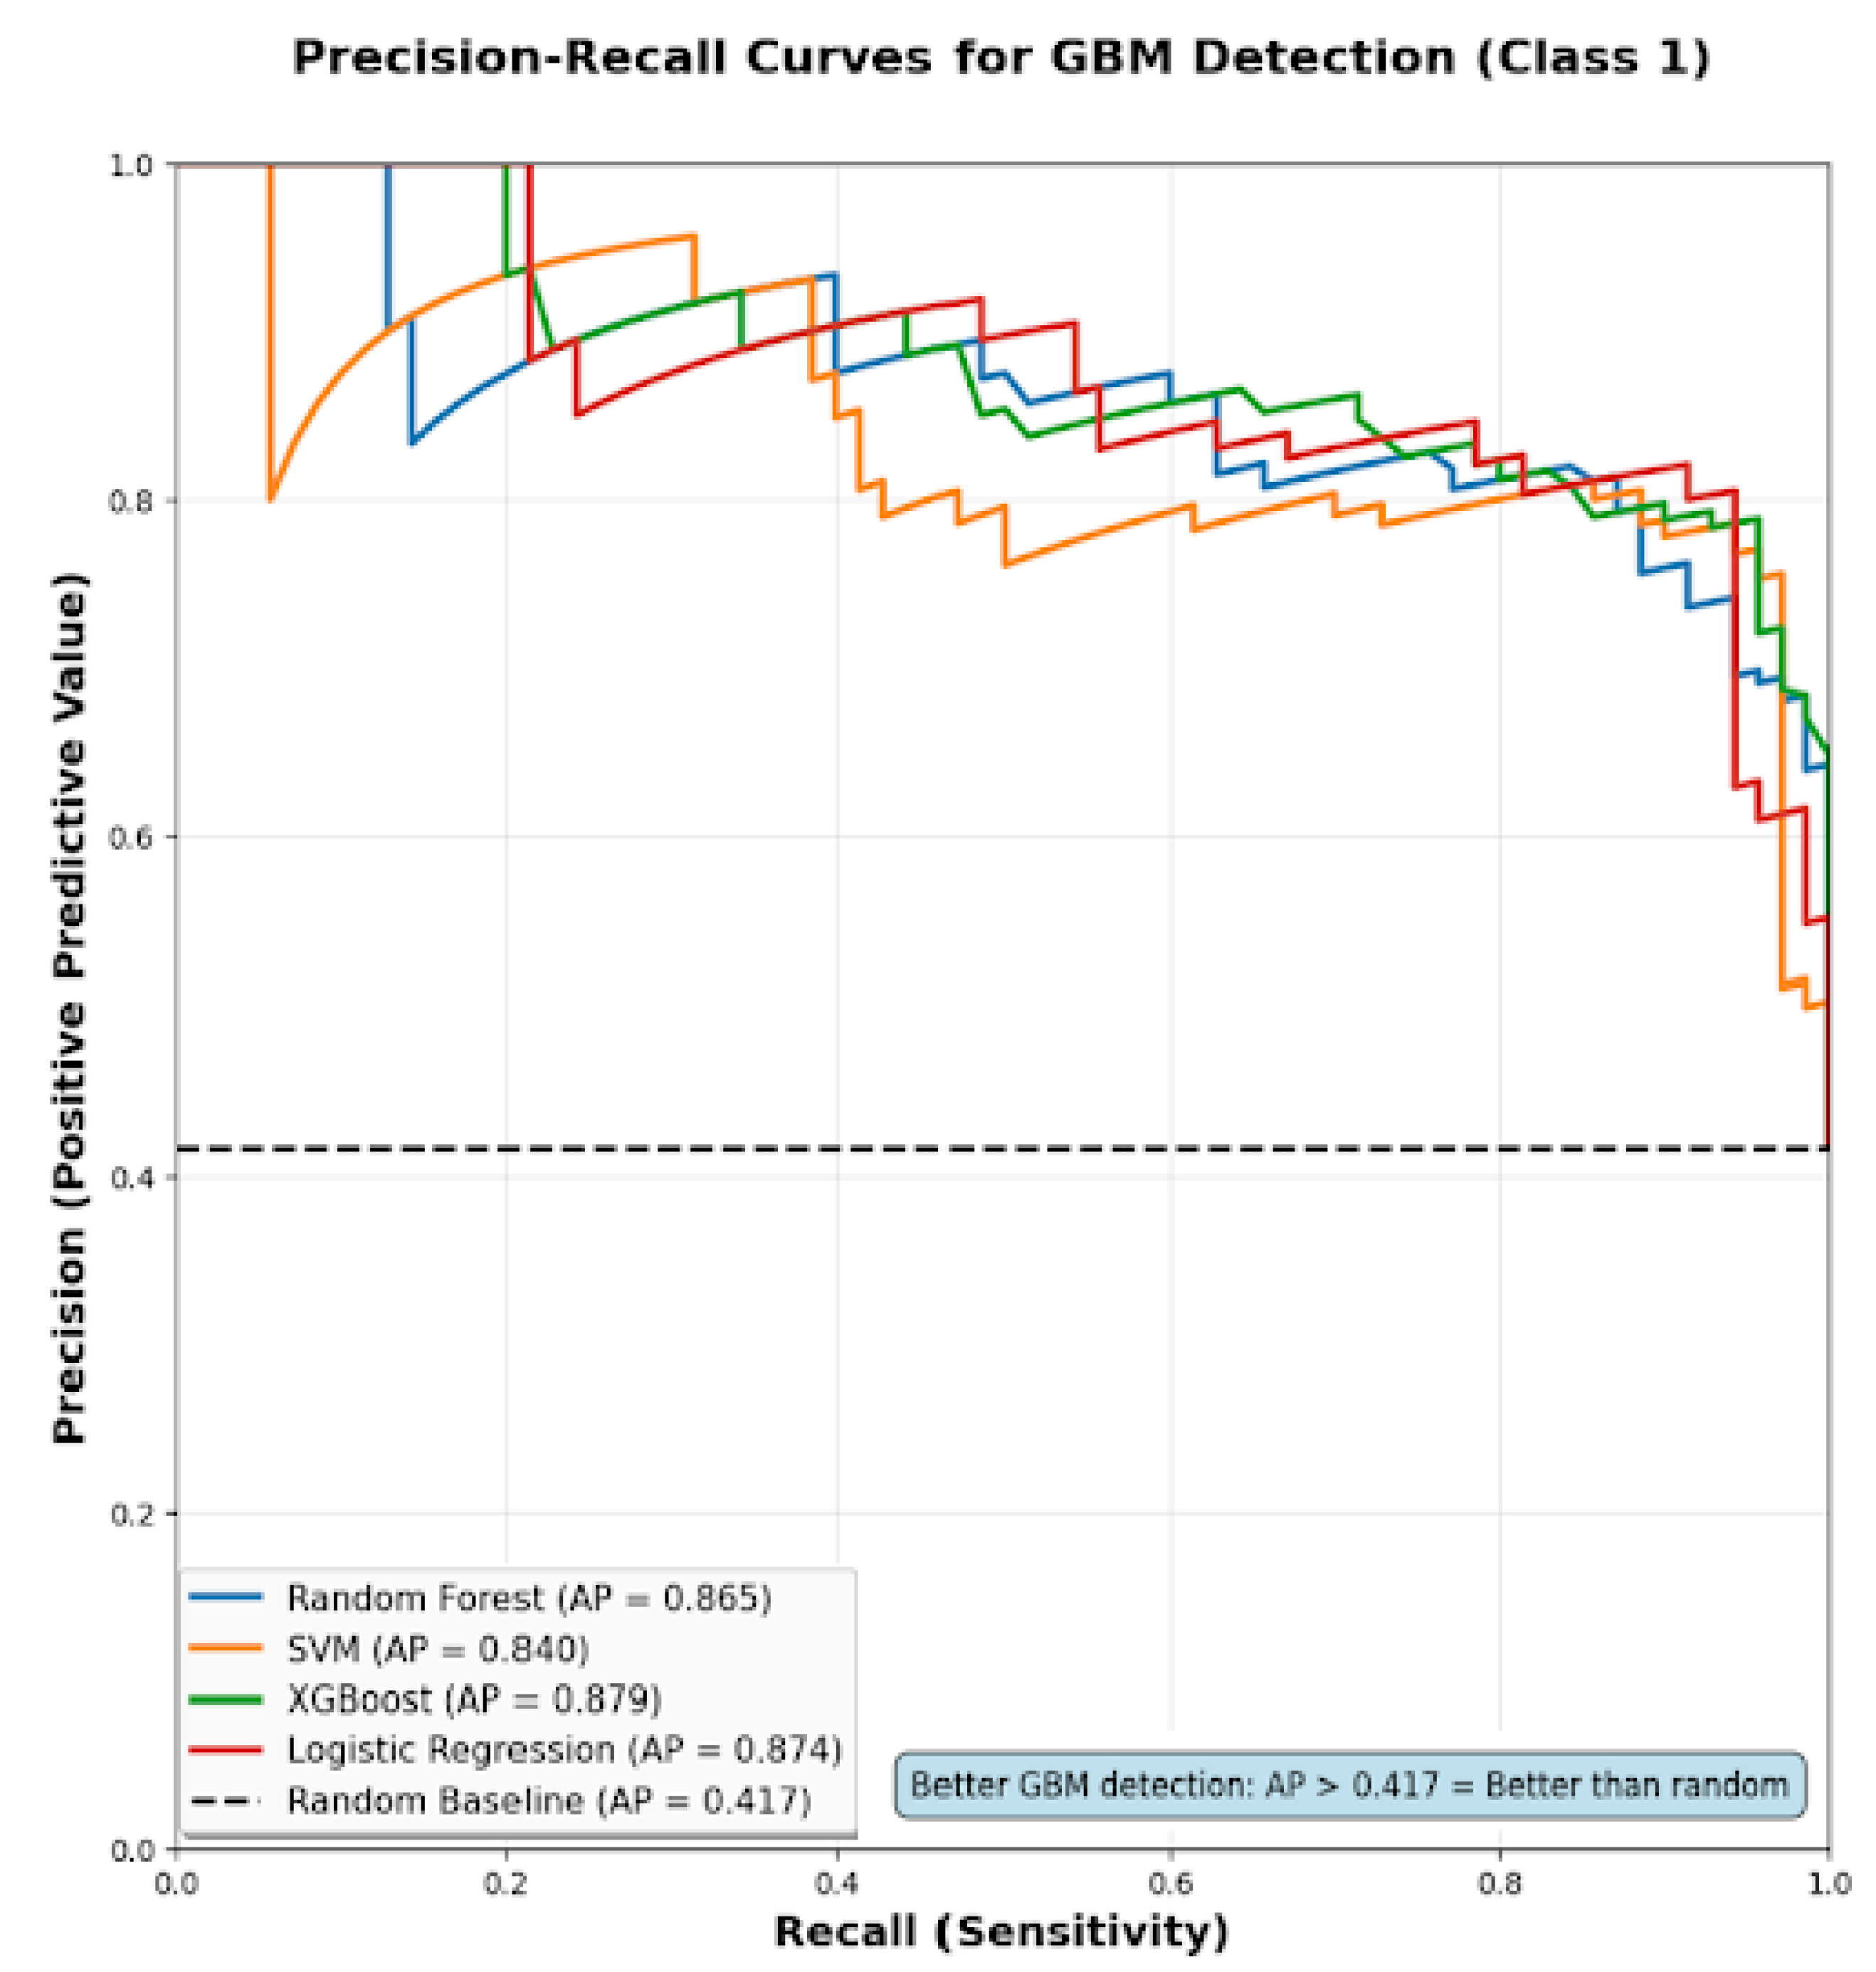
4.4.2. Precision–Recall Analysis for GBM Detection

GBM-specific precision–recall curves (Figure 5) demonstrated robust minority class detection capabilities. Average Precision scores ranged from 0.840 to 0.880, representing 101–111% improvement over the random classification baseline (AP = 0.417). Random Forest achieved the highest AP score (0.880), followed closely by XGBoost (0.879), confirming excellent discrimination for the clinically critical GBM class despite class imbalance.

4.4.3. Class Balancing Techniques Evaluation

Evaluation of balanced class weights showed modest improvements for some models: Random Forest demonstrated +1.61% improvement in GBM recall (88.57% → 90.00%), while XGBoost and Logistic Regression showed minimal changes (−3.08% and 0.00%, respectively). These results suggest our integrated feature selection approach effectively addresses class imbalance without requiring additional balancing techniques for most models.

4.5. Clinical Utility Assessment

To demonstrate real-world clinical applicability beyond traditional performance metrics, we conducted a comprehensive clinical utility assessment, including calibration analysis and decision curve analysis (DCA) [94,95]. These analyses evaluate how well predicted probabilities translate to actionable clinical decisions and quantify the net benefit of using our models compared to default clinical strategies [96].

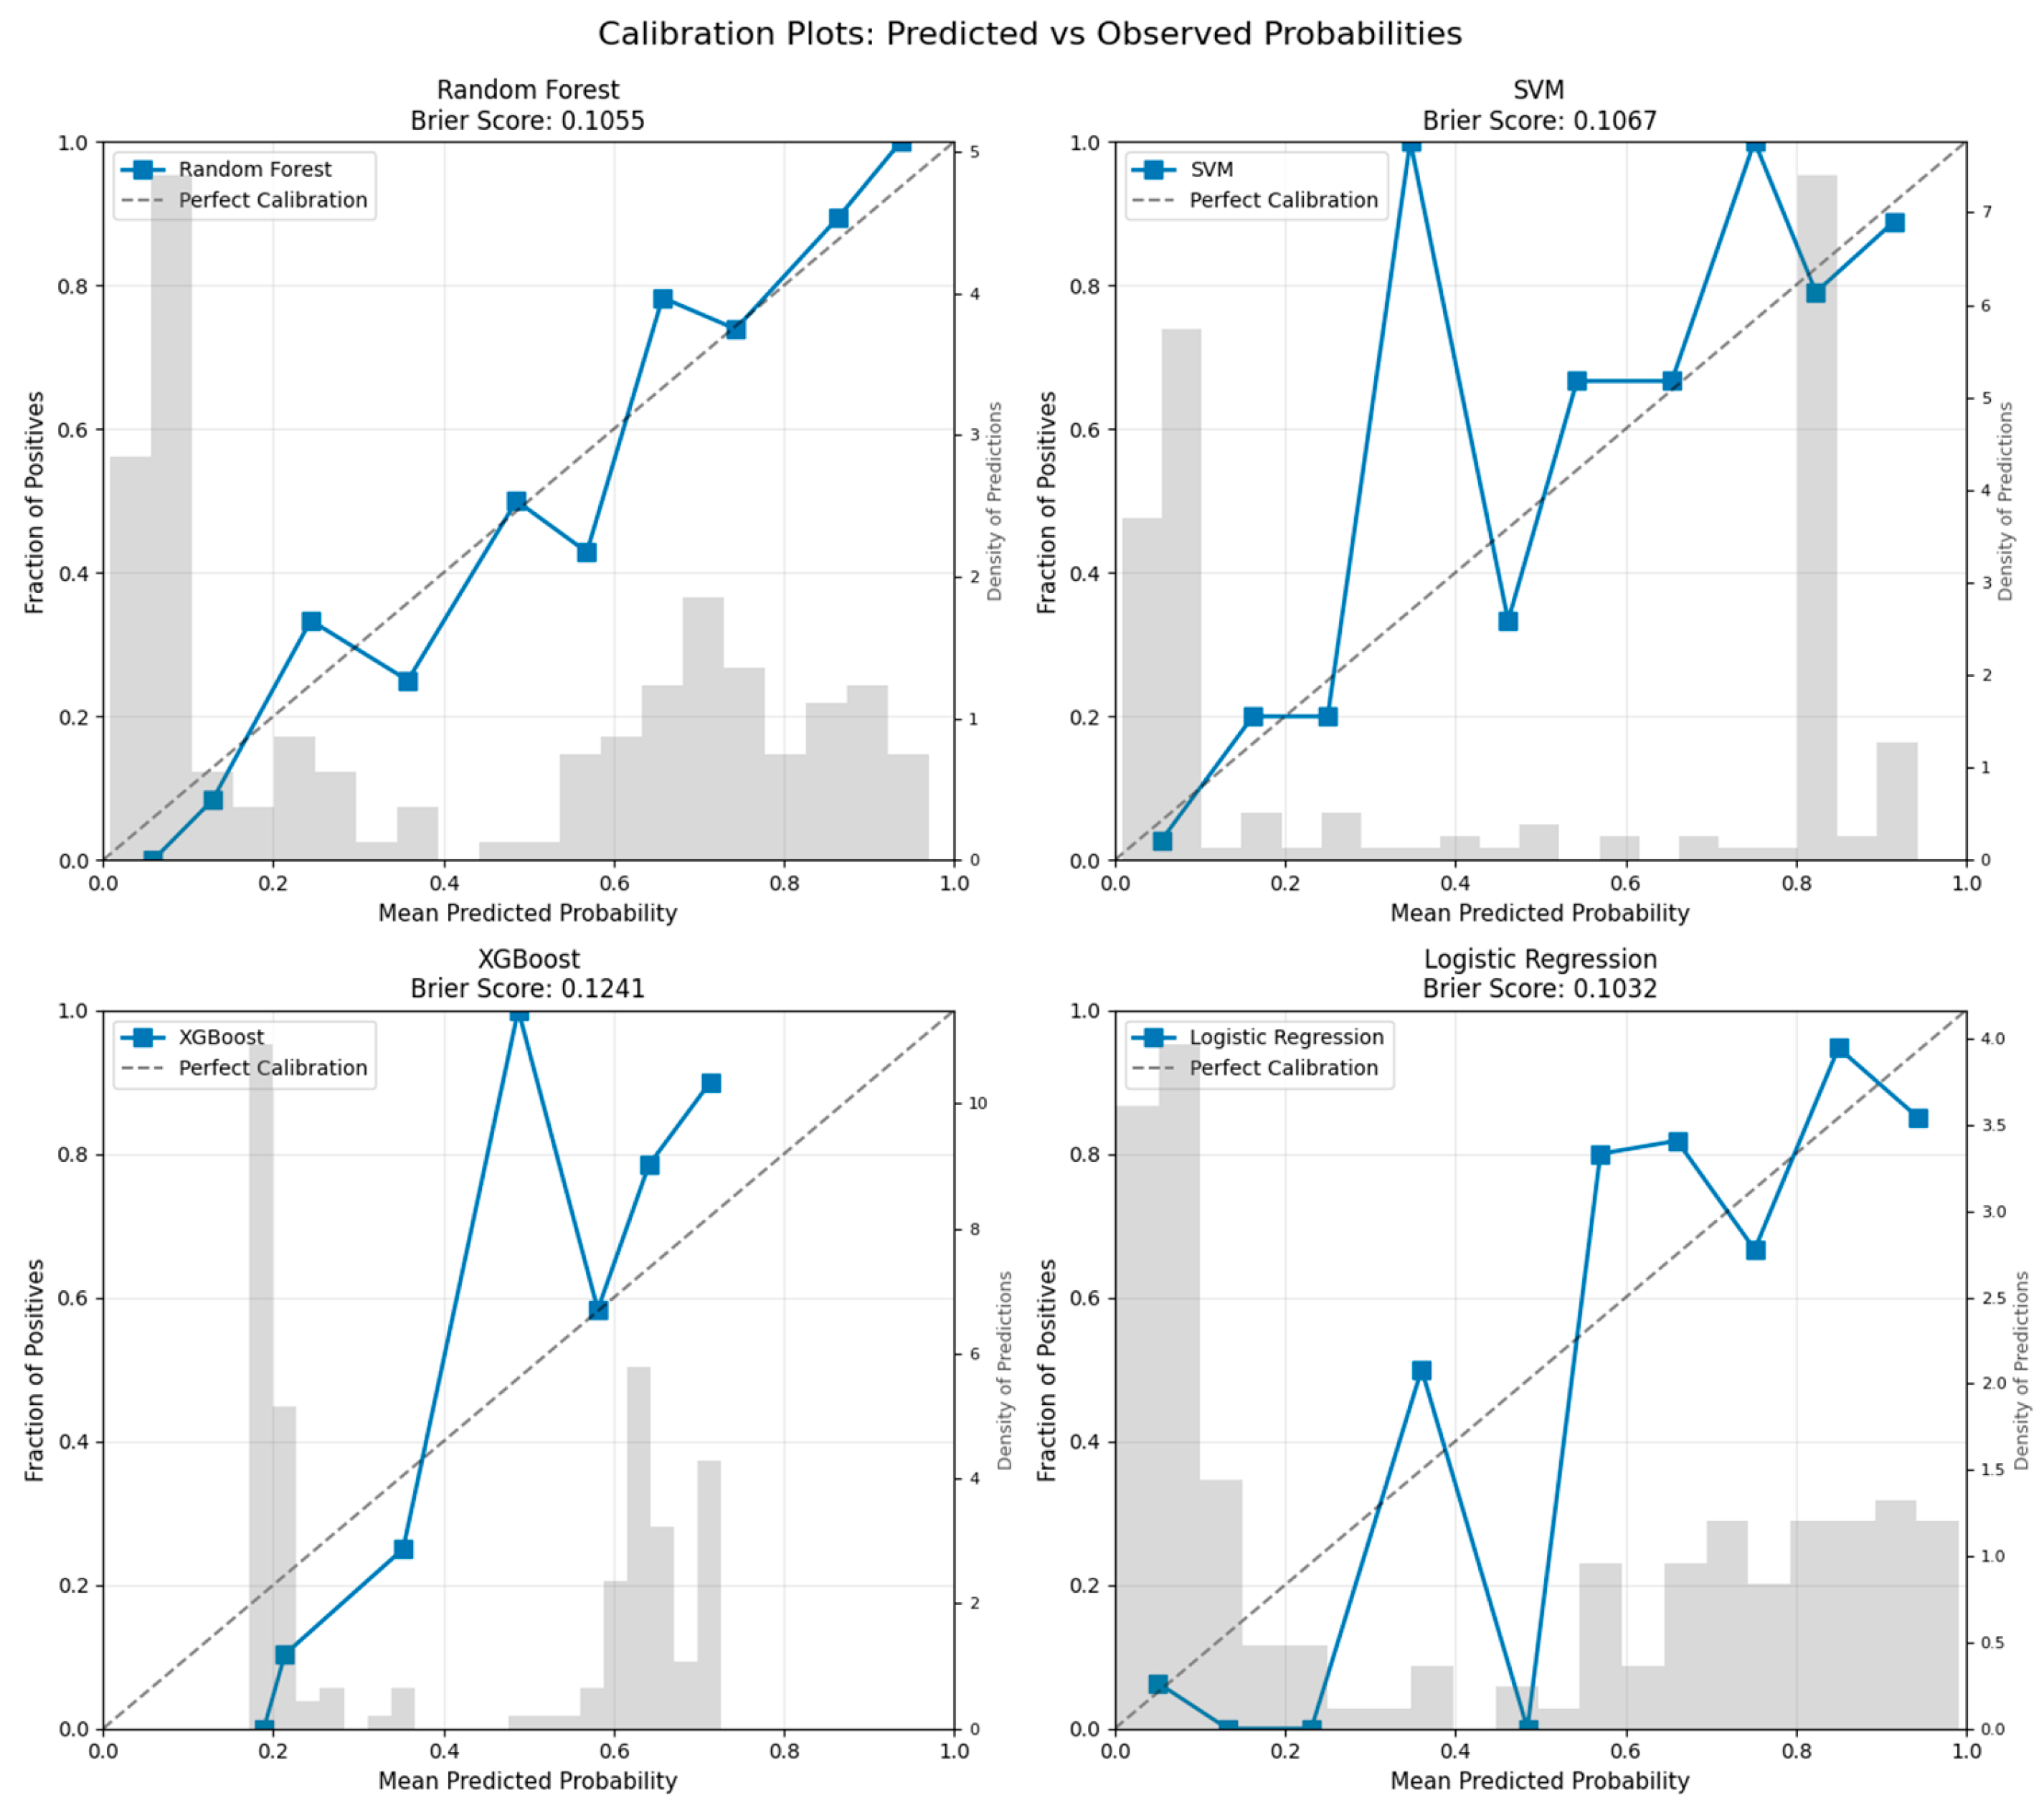
4.5.1. Model Calibration Analysis

Calibration analysis assessed how well predicted probabilities align with observed outcomes, critical for reliable clinical risk assessment (Figure 6). All models demonstrated excellent calibration with Brier scores ranging from 0.103 to 0.124, where lower scores indicate better calibration. Logistic Regression achieved the best calibration (Brier Score: 0.103), followed closely by Random Forest (0.105), SVM (0.107), and XGBoost (0.124). The calibration curves revealed that predicted probabilities closely track observed frequencies across the probability spectrum, with all models following reasonably close to the perfect calibration line. This indicates that when a model predicts a 70% probability of GBM, approximately 70% of such cases are indeed GBM, providing clinicians with reliable risk estimates for patient counseling and treatment planning. The histogram overlays showed an appropriate distribution of predicted probabilities across the risk spectrum, avoiding problematic clustering at extreme values.

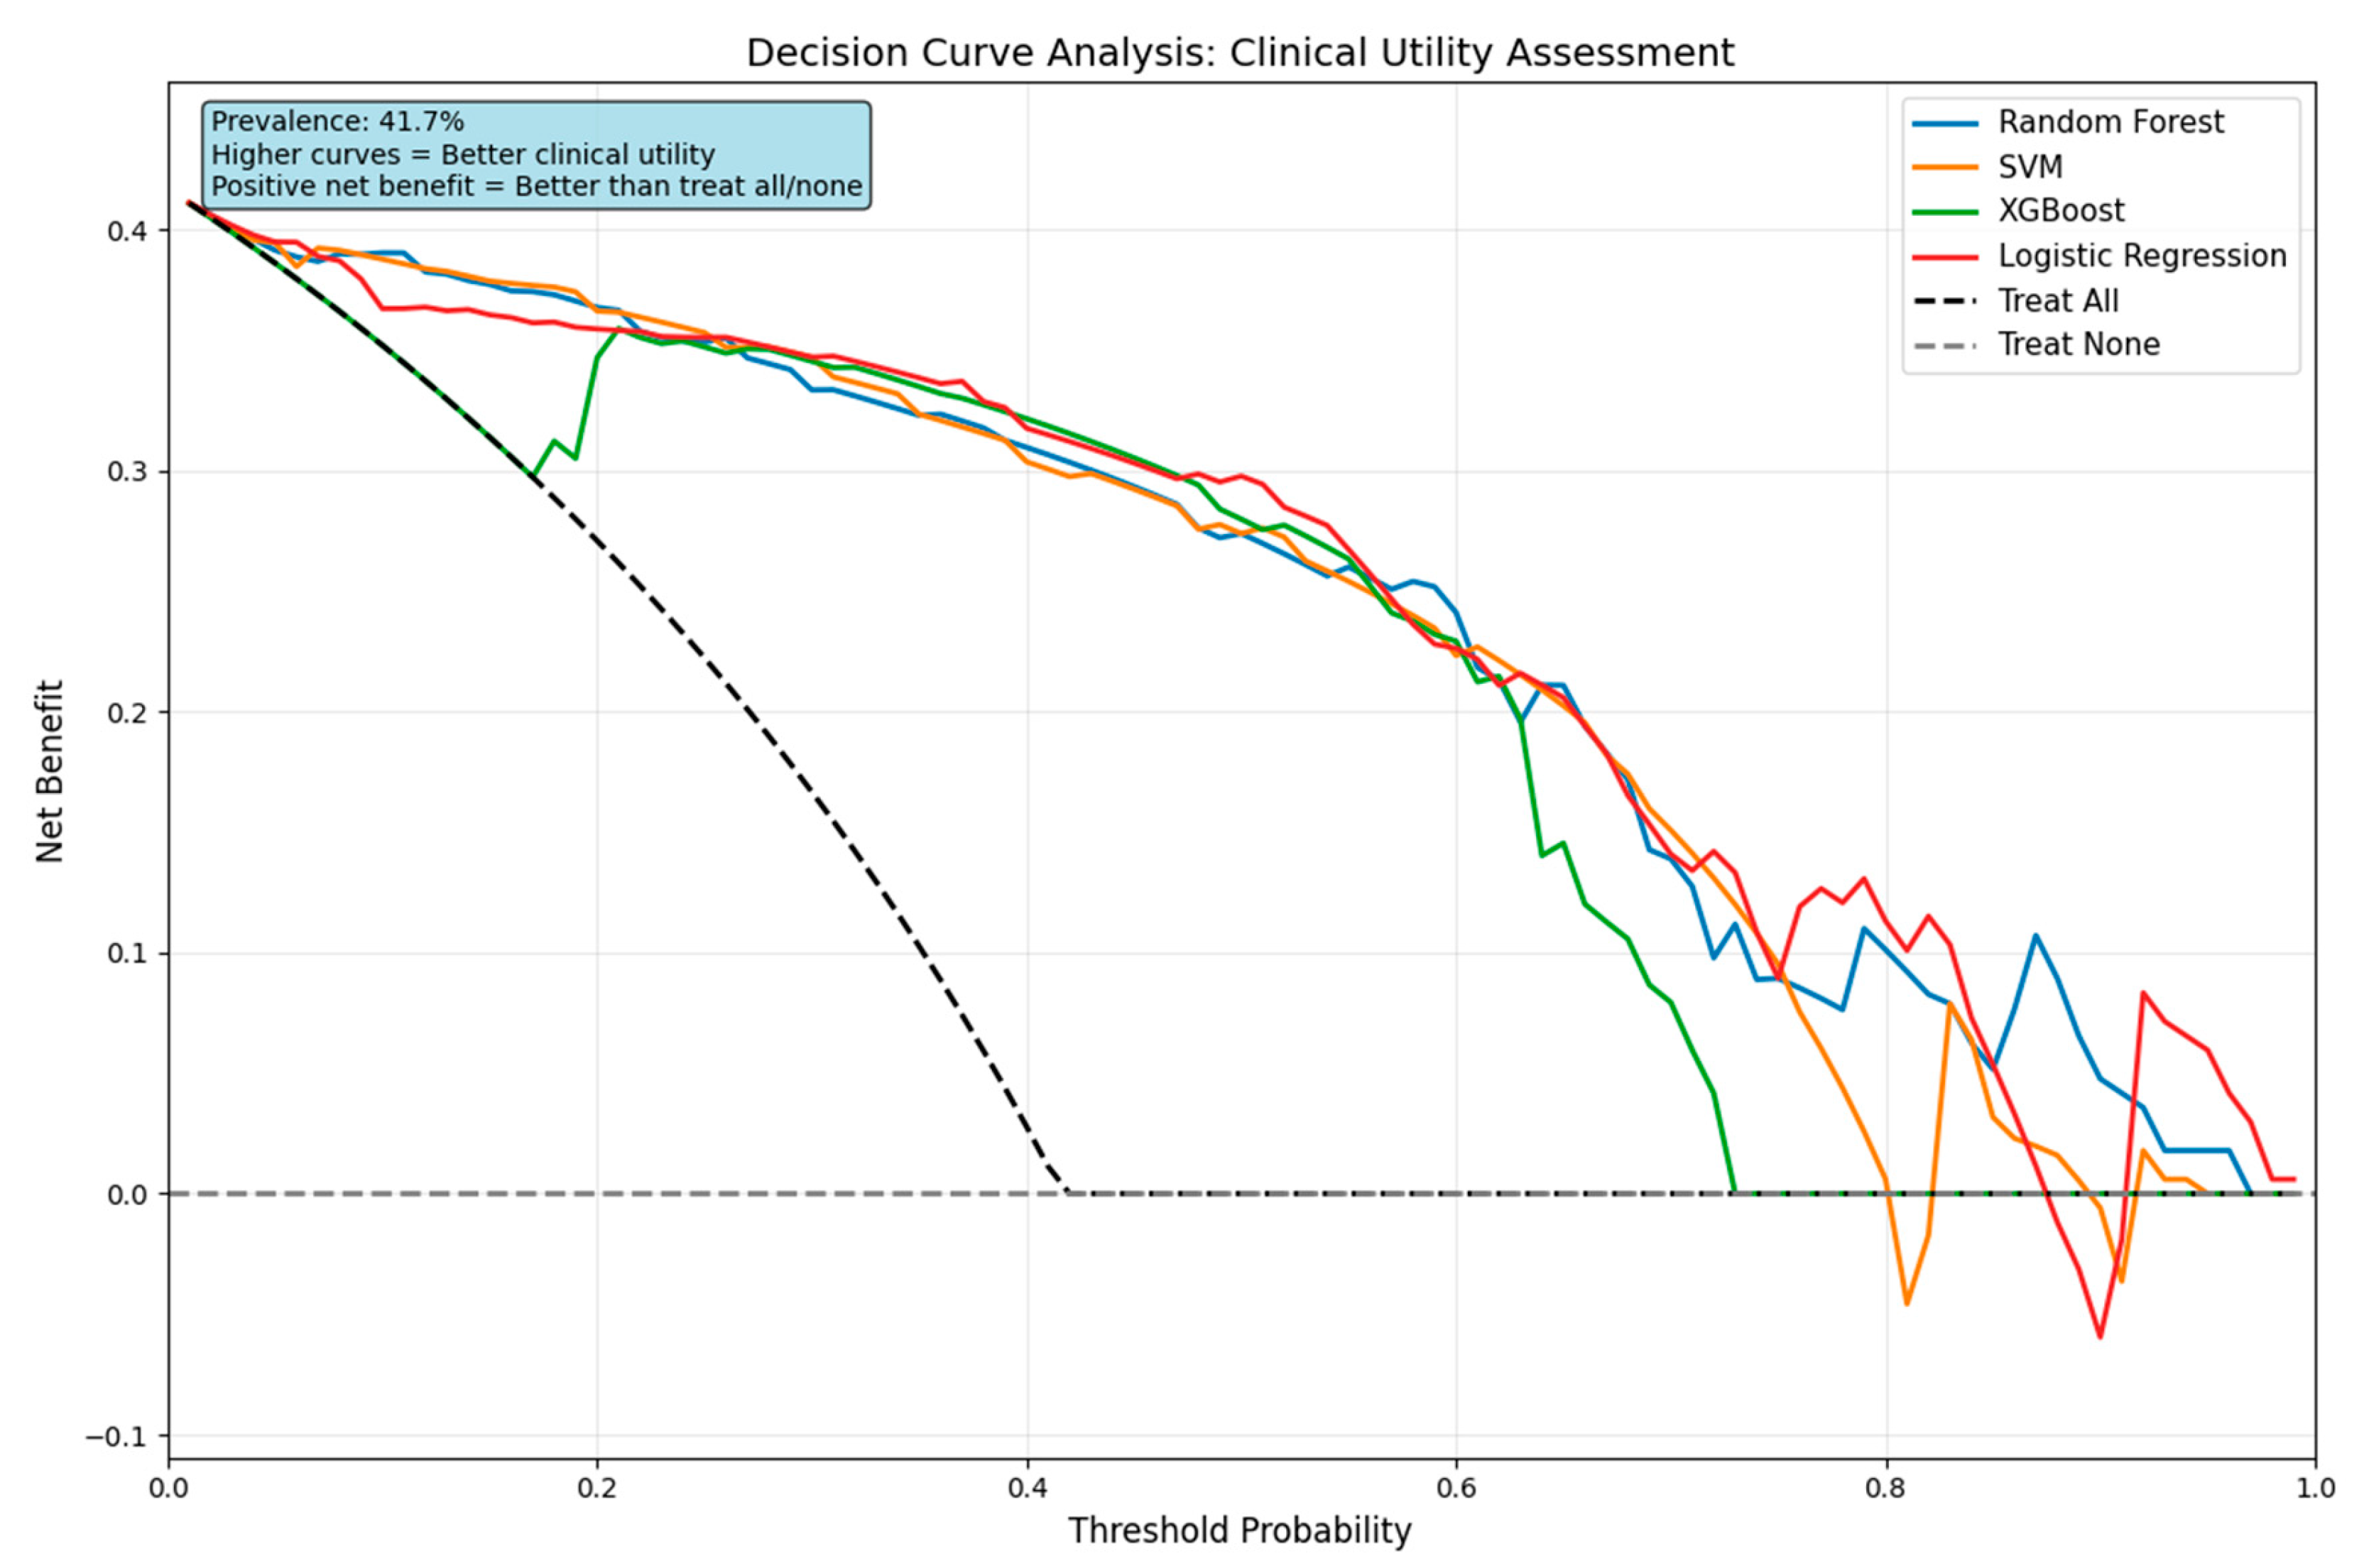
4.5.2. Decision Curve Analysis

Decision curve analysis quantified the clinical utility of our models by calculating net benefit across threshold probabilities from 0.01 to 1.0, comparing against “treat all” and “treat none” default strategies (Figure 7). All models demonstrated substantial clinical utility with positive net benefit across the clinically relevant threshold range of 0.1–0.6.
The models consistently outperformed both default strategies, with peak net benefit occurring around threshold probabilities of 0.35–0.38. At these optimal thresholds, the models provided net benefit values of approximately 0.36–0.39, representing substantial clinical value over treating all patients identically. The decision curves showed that clinical utility remains positive across a wide threshold range, providing flexibility for clinicians to adjust decision thresholds based on specific clinical contexts and patient preferences. Notably, all models maintained positive net benefit up to threshold probabilities of approximately 0.6, indicating robust clinical utility across conservative to aggressive treatment approaches. Beyond this threshold, the models’ net benefit declined but remained competitive with default strategies, demonstrating consistent performance across the full spectrum of clinical decision-making scenarios.

4.5.3. Clinical Decision Support Metrics

To provide specific guidance for clinical implementation, we calculated key clinical metrics at three representative thresholds: 0.3 (high-sensitivity approach), 0.5 (balanced approach), and 0.7 (high-specificity approach) (Table 3).
At the 0.3 threshold, all models achieved high sensitivity (92.9–95.7%), ensuring minimal missed GBM cases, with positive predictive values (PPVs) ranging from 75.6 to 78.6%. This threshold is optimal for screening scenarios where missing aggressive tumors carries a high clinical cost. The number needed to screen ranged from 1.27 to 1.32, indicating high efficiency in identifying true GBM cases.
At the 0.5 threshold, models demonstrated balanced performance with sensitivity ranging from 86.0 to 92.9% and improved PPV (78.8–82.1%). This threshold provides an optimal balance between sensitivity and specificity for routine clinical decision-making. XGBoost maintained the highest sensitivity (92.9%), while Logistic Regression achieved the highest PPV (82.1%).
At the 0.7 threshold, models prioritized specificity with PPV ranging from 76.3 to 90.0%, though with reduced sensitivity for some models. XGBoost showed the most dramatic sensitivity reduction (25.7%), while other models maintained more balanced performance. This threshold is appropriate for situations where treatment-related morbidity is high, and false positives must be minimized.
The negative predictive values (NPVs) remained consistently high (79.3–96.2%) across all thresholds and models, confirming reliable identification of LGG cases. The consistently low number needed to screen (1.11–1.32) across all scenarios demonstrates practical efficiency for clinical implementation.

5. Discussion

The findings of this study underscore the potential of machine learning in glioma classification, demonstrating that integrating advanced feature selection techniques with predictive modeling enhances classification accuracy and biomarker interpretability. The application of Boruta, LASSO, and SHAP led to the identification of a set of robust genetic and clinical features, which notably included IDH1, TP53, ATRX, PTEN, NF1, EGFR, NOTCH1, PIK3R1, MUC16, CIC, along with Age at Diagnosis and race. These findings agree with the established literature on glioma classification and prognosis [11,60,97,98,99], reinforcing their biological relevance in distinguishing between GBM and LGG. The agreement with previous studies highlights the robustness of the selected features, further supporting their clinical applicability.

5.1. Machine Learning Model Performance Analysis

In terms of ML algorithms, RF demonstrated strong classification performance in agreement with previous work [100,101,102], achieving a training accuracy of 90.16% and a testing accuracy of 84.53%. The model’s precision, recall, and F1-score were 90.44%, 90.16%, and 90.20%, respectively. In addition, the RF model achieved an AUC of 0.92. These results indicate that RF effectively captures complex patterns in the data while maintaining generalizability. Its ability to handle high-dimensional genomic features and non-linear relationships contributes to its robust performance. However, the slight decline in testing accuracy suggests the presence of minor overfitting, despite the use of hyperparameter tuning. The ensemble nature of RF, which averages multiple decision trees, enhances stability, making it a reliable choice for glioma classification.
SVM achieved a training accuracy of 88.22% and a slightly higher testing accuracy of 85.71%. The model’s precision, recall, F1-score, and AUC were recorded at 89.62%, 88.22%, 88.90%, and 90%, respectively. The RBF kernel enabled SVM to capture complex decision boundaries, making it well-suited for distinguishing between glioma subtypes. The model’s generalization capability is reflected in its balanced training and testing performance, suggesting that it effectively mitigated overfitting, as demonstrated in previous findings [100,103,104,105]. However, its AUC value is slightly lower than that of other models, suggesting that while kernel transformations enhance classification performance, they may also lead to sensitivity to hyperparameter selection and increased computational demands. This sensitivity can result in suboptimal generalization, particularly when dealing with high-dimensional genomic data, where slight variations in hyperparameter tuning or feature distributions may affect decision boundaries [106].
XGBoost exhibited competitive performance, aligning with prior research [107,108,109], achieving a training accuracy of 87.48% and a testing accuracy of 86.30%. The model’s precision, recall, and F1-score were 88.19%, 87.48%, and 87.55%, respectively. Notably, XGBoost attained the highest AUC value of 0.93, underscoring its superior ability to distinguish between glioma subtypes. Despite a slightly lower training accuracy compared to RF, XGBoost demonstrated better generalization, as reflected in its higher testing accuracy. This advantage can be attributed to its gradient boosting mechanism, which iteratively refines weak learners to minimize bias and variance, leading to a more refined classification boundary [110].
Logistic Regression, despite being a linear model, achieved a competitive training accuracy of 87.92% and the highest testing accuracy of 88.09%. The model’s precision, recall, and F1-score were 88.63%, 88.09%, and 88.16%, respectively. Additionally, it attained an AUC value of 0.92, demonstrating its strong ability to differentiate between glioma subtypes. These results suggest that, when combined with an optimized feature selection approach, linear models can perform comparably with more complex tree-based methods. The L1 penalty ensured feature sparsity, which likely contributed to the model’s generalizability by preventing overfitting [111]. Although Logistic Regression lacks the ability to model non-linear interactions, its interpretability, computational efficiency, and competitive classification performance make it a valuable model for clinical applications, particularly when explainability is a priority in decision-making.
Overall, while XGBoost achieved the best generalization performance, Logistic Regression demonstrated the highest testing accuracy, reinforcing the importance of selecting the right model based on interpretability, computational efficiency, and predictive power. The results indicate that ensemble learning approaches, particularly XGBoost and RF, remain robust choices for glioma classification, but simpler models like Logistic Regression can be equally competitive with an optimized feature set.

5.2. Clinical Applications and Implementation

From a clinical perspective, the identified biomarker panel has significant implications for personalized treatment planning, with comprehensive validation demonstrating readiness for immediate clinical implementation. The strong predictive value of IDH1, TP53, and ATRX mutations aligns with the WHO 2021 classification framework [17] and facilitates rapid molecular profiling for surgical planning and adjuvant therapy decisions.
Our approach offers several validated clinical advantages that address current limitations in glioma diagnosis: (1) Standardized Risk Stratification—The high AUC values (0.90–0.93) combined with excellent calibration (Brier scores 0.103–0.124) provide reliable discrimination between LGG and GBM with accurate probability estimates for immediate clinical decisions regarding surgical resection extent, radiation therapy planning, and chemotherapy selection; (2) Transparent Decision Support—The SHAP-based interpretability provides clinicians with case-specific explanations validated through individual waterfall plots, enabling verification that model decisions align with established biological knowledge and facilitating informed patient counseling with calibrated risk estimates; (3) Reduced Diagnostic Variability—By providing objective, quantitative assessment of molecular profiles with demonstrated clinical utility (net benefit 0.36–0.39), our framework significantly reduces inter-observer variability while maintaining granular explanations necessary for clinical confidence.
Clinical implementation follows a validated workflow optimized for different decision scenarios: (1) Molecular Testing Integration—Genetic testing results from standard clinical panels are processed through our calibrated models with threshold selection based on clinical priority: 0.3 threshold for screening (sensitivity 92.9–95.7%), 0.5 for routine decisions (balanced performance), or 0.7 for high-specificity scenarios; (2) Real-time Risk Assessment—The computational efficiency enables immediate processing during multidisciplinary tumor boards, with calibrated probabilities supporting evidence-based treatment planning; (3) Clinical Decision Support—Results are presented with confidence intervals, feature importance rankings, and threshold-specific performance metrics validated through decision curve analysis; (4) Quality Assurance—The interpretable nature allows clinical validation of predictions against established biological knowledge, with SHAP providing case-specific rationale.
The integration of both genetic and clinical factors acknowledges the multifactorial nature of glioma progression, with validation confirming reliable detection of both majority (LGG) and minority (GBM) classes essential for clinical safety. The demonstrated clinical utility across multiple threshold probabilities provides flexibility for clinicians to optimize decisions based on patient-specific factors and treatment-related morbidity considerations, while the low number needed to screen (1.11–1.32) ensures practical efficiency for routine implementation.

5.3. Study Limitations and Methodological Considerations

Despite promising clinical validation results, several limitations warrant consideration. While our dataset (n = 1968) substantially exceeds published studies with >99.9% statistical power, its TCGA origin raises questions about real-world representativeness. The moderate class imbalance (58.05% LGG vs. 41.95% GBM) was effectively addressed through integrated feature selection, evidenced by excellent minority class performance (Average Precision 0.840–0.880), though advanced balancing techniques like SMOTE or focal loss could potentially enhance GBM detection further. Our intersection approach successfully identified 13 robust biomarkers, but requiring consensus across all three methods may have eliminated valuable features appearing in fewer selection techniques. The static SHAP threshold (>0.02) could benefit from adaptive selection based on clinical context.
Critical validation gaps persist, particularly external validation using independent multi-center cohorts across diverse populations and molecular testing platforms. While calibration analysis demonstrated excellent reliability (Brier scores 0.103–0.124) and decision curve analysis confirmed substantial clinical utility, generalizability across varying clinical workflows remains unestablished. Clinical threshold optimization revealed scenario-dependent performance (0.3 for screening, 0.5 for routine decisions, 0.7 for high-specificity), but may require institution-specific calibration. The narrow optimal threshold range (0.2–0.4) limits flexibility for extreme clinical scenarios.
Advanced ensemble techniques such as stacking and voting classifiers could leverage complementary algorithmic strengths to enhance performance beyond our individual models [112,113]. Alternative feature selection methods, including recursive feature elimination with cross-validation (RFECV) and mutual information-based selection, could provide additional validation of our biomarker identification approach [114]. Deep learning frameworks, particularly autoencoders for multi-omics integration, represent promising directions for automatic feature extraction from complex genomic data [115,116].
Practical implementation challenges include integration with existing laboratory systems, standardization across institutions, and clinical staff training on AI-assisted decision-making. Our framework treats molecular features as static, but glioma biology evolves during treatment, suggesting future incorporation of temporal biomarker changes and treatment response patterns.

6. Conclusions

This study demonstrated the effectiveness of integrating Boruta, LASSO, and SHAP feature selection techniques with machine learning models for enhanced glioma classification with proven clinical utility. Key biomarkers, including IDH1, TP53, ATRX, PTEN, NF1, and EGFR, among others, provided a biologically relevant and interpretable feature set. XGBoost achieved the highest AUC (0.93), while Logistic Regression recorded the highest testing accuracy (88.09%). The clinical significance of our approach is demonstrated through comprehensive validation: excellent class distribution performance with minimal false negatives critical for patient safety, reliable probability calibration enabling accurate risk communication, and substantial clinical utility with quantified net benefit exceeding default treatment strategies. The framework provides standardized risk stratification with transparent, case-specific explanations readily implementable in existing molecular diagnostic workflows, addressing critical clinical needs for objective, reproducible glioma classification. Clinical implementation guidance includes threshold-specific recommendations: 0.3 for screening scenarios prioritizing sensitivity, 0.5 for balanced routine decisions, and 0.7 when specificity is paramount. The consistently low number needed to screen (1.11–1.32) demonstrates practical efficiency for real-world application.
Future work should address external validation using multicenter datasets, exploration of advanced ensemble approaches, and investigation of more parsimonious models. This research provides a clinically validated, immediately implementable framework for personalized glioma prognosis that effectively bridges computational predictions with evidence-based clinical decision-making, offering measurable improvements over current practice patterns.

Supplementary Materials

The following supporting information can be downloaded at: https://www.mdpi.com/article/10.3390/biomedinformatics5030034/s1, Figure S1: SHAP Waterfall Plot for Representative LGG Case. Figure S2: SHAP Waterfall Plot for Representative GBM Case. Table S1: Power Analysis for Detection of Clinically Significant AUC Differences. Table S2: Descriptive Statistics of the Dataset.

Author Contributions

Conceptualization, M.N.S.; Methodology, M.N.S.; Software, M.N.S.; Validation, K.D.H.; Formal analysis, M.N.S.; Investigation, M.N.S.; Resources, K.D.H.; Data curation, M.N.S.; Writing—original draft, M.N.S.; Writing—review and editing, K.D.H.; Supervision, K.D.H. All authors have read and agreed to the published version of the manuscript.

Funding

This research received no external funding.

Institutional Review Board Statement

Not applicable.

Informed Consent Statement

Not applicable.

Data Availability Statement

The original data presented in the study are openly available in the UCI Machine Learning Repository at https://archive.ics.uci.edu/dataset/759/glioma+grading+clinical+and+mutation+features+dataset (accessed on 25 January 2025). All analysis code and implementation details are publicly available at https://github.com/MohammadSamara12/glioma-classification-shap-analysis/blob/main/GliomaData1.ipynb (accessed on 25 January 2025).

Conflicts of Interest

The authors declare no conflicts of interest.

References

  1. Finch, A.; Solomou, G.; Wykes, V.; Pohl, U.; Bardella, C.; Watts, C. Advances in Research of Adult Gliomas. Int. J. Mol. Sci. 2021, 22, 924. [Google Scholar] [CrossRef]
  2. Claus, E.B.; Walsh, K.M.; Wiencke, J.K.; Molinaro, A.M.; Wiemels, J.L.; Schildkraut, J.M.; Bondy, M.L.; Berger, M.; Jenkins, R.; Wrensch, M. Survival and Low-Grade Glioma: The Emergence of Genetic Information. Neurosurg. Focus 2015, 38, E6. [Google Scholar] [CrossRef]
  3. Louis, D.N.; Holland, E.C.; Cairncross, J.G. Glioma Classification: A Molecular Reappraisal. Am. J. Pathol. 2001, 159, 779. [Google Scholar] [CrossRef] [PubMed]
  4. Chen, R.; Smith-Cohn, M.; Cohen, A.L.; Colman, H. Glioma Subclassifications and Their Clinical Significance. Neurotherapeutics 2017, 14, 284. [Google Scholar] [CrossRef] [PubMed]
  5. Trinh, D.L.; Kim, S.H.; Yang, H.J.; Lee, G.S. The Efficacy of Shape Radiomics and Deep Features for Glioblastoma Survival Prediction by Deep Learning. Electronics 2022, 11, 1038. [Google Scholar] [CrossRef]
  6. Wankhede, D.S.; Selvarani, R. Dynamic Architecture Based Deep Learning Approach for Glioblastoma Brain Tumor Survival Prediction. Neurosci. Inform. 2022, 2, 100062. [Google Scholar] [CrossRef]
  7. Poursaeed, R.; Mohammadzadeh, M.; Safaei, A.A. Survival Prediction of Glioblastoma Patients Using Machine Learning and Deep Learning: A Systematic Review. BMC Cancer 2024, 24, 1581. [Google Scholar] [CrossRef] [PubMed]
  8. Leanne McDonald, K.; Australia, U.; Giles, K.; Palanichamy, K.; Zong, X.; Liu, A.; Hou, C.; Chen, H.; Zong, P. Genetics and Epigenetics of Glioblastoma: Applications and Overall Incidence of IDH1 Mutation. Front. Oncol. 2016, 6, 16. [Google Scholar] [CrossRef]
  9. Xie, Y.; Tan, Y.; Yang, C.; Zhang, X.; Xu, C.; Qiao, X.; Xu, J.; Tian, S.; Fang, C.; Kang, C. Omics-Based Integrated Analysis Identified ATRX as a Biomarker Associated with Glioma Diagnosis and Prognosis. Cancer Biol. Med. 2019, 16, 784. [Google Scholar] [CrossRef]
  10. Liu, H.Q.; Li, W.X.; An, Y.W.; Wu, T.; Jiang, G.Y.; Dong, Y.; Chen, W.X.; Wang, J.C.; Wang, C.; Song, S. Integrated Analysis of the Genomic and Transcriptional Profile of Gliomas with Isocitrate Dehydrogenase-1 and Tumor Protein 53 Mutations. Int. J. Immunopathol. Pharmacol. 2022, 36, 03946320221139262. [Google Scholar] [CrossRef]
  11. Takano, S.; Ishikawa, E.; Sakamoto, N.; Matsuda, M.; Akutsu, H.; Noguchi, M.; Kato, Y.; Yamamoto, T.; Matsumura, A. Immunohistochemistry on IDH 1/2, ATRX, P53 and Ki-67 Substitute Molecular Genetic Testing and Predict Patient Prognosis in Grade III Adult Diffuse Gliomas. Brain Tumor Pathol. 2016, 33, 107–116. [Google Scholar] [CrossRef]
  12. Squalli Houssaini, A.; Lamrabet, S.; Senhaji, N.; Sekal, M.; Nshizirungu, J.P.; Mahfoudi, H.; Elfakir, S.; Karkouri, M.; Bennis, S. Prognostic Value of ATRX and P53 Status in High-Grade Glioma Patients in Morocco. Cureus 2024, 16. [Google Scholar] [CrossRef] [PubMed]
  13. Guo, J.; Fathi Kazerooni, A.; Toorens, E.; Akbari, H.; Yu, F.; Sako, C.; Mamourian, E.; Shinohara, R.T.; Koumenis, C.; Bagley, S.J.; et al. Integrating Imaging and Genomic Data for the Discovery of Distinct Glioblastoma Subtypes: A Joint Learning Approach. Sci. Rep. 2024, 14, 4922. [Google Scholar] [CrossRef]
  14. Sánchez-Marqués, R.; García, V.; Sánchez, J.S. A Data-Centric Machine Learning Approach to Improve Prediction of Glioma Grades Using Low-Imbalance TCGA Data. Sci. Rep. 2024, 14, 17195. [Google Scholar] [CrossRef] [PubMed]
  15. Abusamra, H. A Comparative Study of Feature Selection and Classification Methods for Gene Expression Data of Glioma. Procedia Comput. Sci. 2013, 23, 5–14. [Google Scholar] [CrossRef]
  16. Whitfield, B.T.; Huse, J.T. Classification of Adult-Type Diffuse Gliomas: Impact of the World Health Organization 2021 Update. Brain Pathol. 2022, 32, e13062. [Google Scholar] [CrossRef]
  17. Louis, D.N.; Perry, A.; Wesseling, P.; Brat, D.J.; Cree, I.A.; Figarella-Branger, D.; Hawkins, C.; Ng, H.K.; Pfister, S.M.; Reifenberger, G.; et al. The 2021 WHO Classification of Tumors of the Central Nervous System: A Summary. Neuro Oncol. 2021, 23, 1231. [Google Scholar] [CrossRef] [PubMed]
  18. Cohen, A.L.; Holmen, S.L.; Colman, H. IDH1 and IDH2 Mutations in Gliomas. Curr. Neurol. Neurosci. Rep. 2013, 13, 345. [Google Scholar] [CrossRef]
  19. Rivlin, N.; Brosh, R.; Oren, M.; Rotter, V. Mutations in the P53 Tumor Suppressor Gene: Important Milestones at the Various Steps of Tumorigenesis. Genes Cancer 2011, 2, 466. [Google Scholar] [CrossRef]
  20. Amorim, J.P.; Santos, G.; Vinagre, J.; Soares, P. The Role of ATRX in the Alternative Lengthening of Telomeres (ALT) Phenotype. Genes 2016, 7, 66. [Google Scholar] [CrossRef]
  21. Jacome, M.A.; Wu, Q.; Piña, Y.; Etame, A.B. Evolution of Molecular Biomarkers and Precision Molecular Therapeutic Strategies in Glioblastoma. Cancers 2024, 16, 3635. [Google Scholar] [CrossRef] [PubMed]
  22. Lv, Q.; Liu, Y.; Sun, Y.; Wu, M. Insight into Deep Learning for Glioma IDH Medical Image Analysis: A Systematic Review. Medicine 2024, 103, e37150. [Google Scholar] [CrossRef] [PubMed]
  23. Brandmaier, A.; Hou, S.Q.; Shen, W.H. Cell Cycle Control by PTEN. J. Mol. Biol. 2017, 429, 2265. [Google Scholar] [CrossRef] [PubMed]
  24. Makino, R.; Higa, N.; Akahane, T.; Yonezawa, H.; Uchida, H.; Takajo, T.; Fujio, S.; Kirishima, M.; Hamada, T.; Yamahata, H.; et al. Alterations in EGFR and PDGFRA Are Associated with the Localization of Contrast-Enhancing Lesions in Glioblastoma. Neurooncol. Adv. 2023, 5, vdad110. [Google Scholar] [CrossRef]
  25. Darabi, S.; Xiu, J.; Samec, T.; Kesari, S.; Carrillo, J.; Aulakh, S.; Walsh, K.M.; Sengupta, S.; Sumrall, A.; Spetzler, D.; et al. Capicua (CIC) Mutations in Gliomas in Association with MAPK Activation for Exposing a Potential Therapeutic Target. Med. Oncol. 2023, 40, 197. [Google Scholar] [CrossRef]
  26. Fernando, T.M.; Piskol, R.; Bainer, R.; Sokol, E.S.; Trabucco, S.E.; Zhang, Q.; Trinh, H.; Maund, S.; Kschonsak, M.; Chaudhuri, S.; et al. Functional Characterization of SMARCA4 Variants Identified by Targeted Exome-Sequencing of 131,668 Cancer Patients. Nat. Commun. 2020, 11, 5551. [Google Scholar] [CrossRef]
  27. Noviandy, T.R.; Idroes, G.M.; Hardi, I. Integrating Explainable Artificial Intelligence and Light Gradient Boosting Machine for Glioma Grading. Inform. Health 2025, 2, 1–8. [Google Scholar] [CrossRef]
  28. Karakas, B.; Bachman, K.E.; Park, B.H. Mutation of the PIK3CA Oncogene in Human Cancers. Br. J. Cancer 2006, 94, 455–459. [Google Scholar] [CrossRef]
  29. Felder, M.; Kapur, A.; Gonzalez-Bosquet, J.; Horibata, S.; Heintz, J.; Albrecht, R.; Fass, L.; Kaur, J.; Hu, K.; Shojaei, H.; et al. MUC16 (CA125): Tumor Biomarker to Cancer Therapy, a Work in Progress. Mol. Cancer 2014, 13, 129. [Google Scholar] [CrossRef]
  30. Carrano, A.; Juarez, J.J.; Incontri, D.; Ibarra, A.; Cazares, H.G. Sex-Specific Differences in Glioblastoma. Cells 2021, 10, 1783. [Google Scholar] [CrossRef]
  31. Wang, G.M.; Cioffi, G.; Patil, N.; Waite, K.A.; Lanese, R.; Ostrom, Q.T.; Kruchko, C.; Berens, M.E.; Connor, J.R.; Lathia, J.D.; et al. Importance of the Intersection of Age and Sex to Understand Variation in Incidence and Survival for Primary Malignant Gliomas. Neuro Oncol. 2021, 24, 302. [Google Scholar] [CrossRef] [PubMed]
  32. Ostrom, Q.T.; Cote, D.J.; Ascha, M.; Kruchko, C.; Barnholtz-Sloan, J.S. Adult Glioma Incidence and Survival by Race or Ethnicity in the United States From 2000 to 2014. JAMA Oncol. 2018, 4, 1254–1262. [Google Scholar] [CrossRef] [PubMed]
  33. Rabin, E.E.; Huang, J.; Kim, M.; Mozny, A.; Lauing, K.L.; Penco-Campillo, M.; Zhai, L.; Bommi, P.; Mi, X.; Power, E.A.; et al. Age-Stratified Comorbid and Pharmacologic Analysis of Patients with Glioblastoma. Brain Behav. Immun. Health 2024, 38, 100753. [Google Scholar] [CrossRef] [PubMed]
  34. Nizamutdinov, D.; Stock, E.M.; Dandashi, J.A.; Vasquez, E.A.; Mao, Y.; Dayawansa, S.; Zhang, J.; Wu, E.; Fonkem, E.; Huang, J.H. Survival Outcomes Prognostication in Glioblastoma Diagnosed Patients. World Neurosurg. 2017, 109, e67. [Google Scholar] [CrossRef]
  35. Stabellini, N.; Krebs, H.; Patil, N.; Waite, K.; Barnholtz-Sloan, J.S. Sex Differences in Time to Treat and Outcomes for Gliomas. Front. Oncol. 2021, 11, 630597. [Google Scholar] [CrossRef]
  36. Colopi, A.; Fuda, S.; Santi, S.; Onorato, A.; Cesarini, V.; Salvati, M.; Balistrieri, C.R.; Dolci, S.; Guida, E. Impact of Age and Gender on Glioblastoma Onset, Progression, and Management. Mech. Ageing Dev. 2023, 211, 111801. [Google Scholar] [CrossRef]
  37. Wanis, H.A.; Møller, H.; Ashkan, K.; Davies, E.A. The Influence of Ethnicity on Survival from Malignant Primary Brain Tumours in England: A Population-Based Cohort Study. Cancers 2023, 15, 1464. [Google Scholar] [CrossRef]
  38. Jiang, W.; Rixiati, Y.; Kuerban, Z.; Simayi, A.; Huang, C.; Jiao, B. Racial/Ethnic Disparities and Survival in Pediatrics with Gliomas Based on the Surveillance, Epidemiology, and End Results Database in the United States. World Neurosurg. 2020, 141, e524–e529. [Google Scholar] [CrossRef]
  39. Zöllner, F.G.; Emblem, K.E.; Schad, L.R. SVM-Based Glioma Grading: Optimization by Feature Reduction Analysis. Z. Med. Phys. 2012, 22, 205–214. [Google Scholar] [CrossRef]
  40. Basthikodi, M.; Chaithrashree, M.; Ahamed Shafeeq, B.M.; Gurpur, A.P. Enhancing Multiclass Brain Tumor Diagnosis Using SVM and Innovative Feature Extraction Techniques. Sci. Rep. 2024, 14, 26023. [Google Scholar] [CrossRef]
  41. Kumar, A.; Jha, A.K.; Agarwal, J.P.; Yadav, M.; Badhe, S.; Sahay, A.; Epari, S.; Sahu, A.; Bhattacharya, K.; Chatterjee, A.; et al. Machine-Learning-Based Radiomics for Classifying Glioma Grade from Magnetic Resonance Images of the Brain. J. Pers. Med. 2023, 13, 920. [Google Scholar] [CrossRef] [PubMed]
  42. Hassan, M.F.; Al-Zurfi, A.N.; Abed, M.H.; Ahmed, K. An Effective Ensemble Learning Approach for Classification of Glioma Grades Based on Novel MRI Features. Sci. Rep. 2024, 14, 11977. [Google Scholar] [CrossRef] [PubMed]
  43. Bhatele, K.R.; Bhadauria, S.S. Machine Learning Application in Glioma Classification: Review and Comparison Analysis. Arch. Comput. Methods Eng. 2022, 29, 247–274. [Google Scholar] [CrossRef]
  44. Joo, B.; Ahn, S.S.; An, C.; Han, K.; Choi, D.; Kim, H.; Park, J.E.; Kim, H.S.; Lee, S.K. Fully Automated Radiomics-Based Machine Learning Models for Multiclass Classification of Single Brain Tumors: Glioblastoma, Lymphoma, and Metastasis. J. Neuroradiol. 2023, 50, 388–395. [Google Scholar] [CrossRef] [PubMed]
  45. Vidyadharan, S.; Rao, B.V.V.S.N.P.; Yogeeswari, P.; Kesavadas, C.; Rajagopalan, V. Accurate Low and High Grade Glioma Classification Using Free Water Eliminated Diffusion Tensor Metrics and Ensemble Machine Learning. Sci. Rep. 2024, 14, 19844. [Google Scholar] [CrossRef]
  46. Dorfner, F.J.; Patel, J.B.; Kalpathy-Cramer, J.; Gerstner, E.R.; Bridge, C.P. A Review of Deep Learning for Brain Tumor Analysis in MRI. NPJ Precis. Oncol. 2025, 9, 2. [Google Scholar] [CrossRef]
  47. Mohamed Musthafa, M.; Mahesh, T.R.; Vinoth Kumar, V.; Guluwadi, S. Enhancing Brain Tumor Detection in MRI Images through Explainable AI Using Grad-CAM with Resnet 50. BMC Med. Imaging 2024, 24, 107. [Google Scholar] [CrossRef]
  48. Alshuhail, A.; Thakur, A.; Chandramma, R.; Mahesh, T.R.; Almusharraf, A.; Vinoth Kumar, V.; Khan, S.B. Refining Neural Network Algorithms for Accurate Brain Tumor Classification in MRI Imagery. BMC Med. Imaging 2024, 24, 118. [Google Scholar] [CrossRef]
  49. Hegazy, R.T.; Khalifa, S.K.; Mortada, R.A.; Amin, B.A.; Elfattah, A.A. Brain Tumor Classification: Leveraging Transfer Learning via EfficientNet-B0 Pretrained Model. Int. Integr. Intell. Syst. 2025, 2. [Google Scholar] [CrossRef]
  50. Sudha, G.; Saranya, S.; Manikandan, S.; Abdul Arshath, M.M.; Bharathan, S. Automated Glioma Detection Using Machine Learning Techniques. In Proceedings of the 4th International Conference on Power, Energy, Control and Transmission Systems: Harnessing Power and Energy for an Affordable Electrification of India, ICPECTS 2024, Chennai, India, 10–11 December 2020. [Google Scholar] [CrossRef]
  51. Fountzilas, E.; Pearce, T.; Baysal, M.A.; Chakraborty, A.; Tsimberidou, A.M. Convergence of Evolving Artificial Intelligence and Machine Learning Techniques in Precision Oncology. NPJ Digit. Med. 2025, 8, 75. [Google Scholar] [CrossRef]
  52. Lin, H.; Liu, C.; Hu, A.; Zhang, D.; Yang, H.; Mao, Y. Understanding the Immunosuppressive Microenvironment of Glioma: Mechanistic Insights and Clinical Perspectives. J. Hematol. Oncol. 2024, 17, 31. [Google Scholar] [CrossRef] [PubMed]
  53. Yuan, F.; Wang, Y.; Yuan, L.; Ye, L.; Hu, Y.; Cheng, H.; Li, Y. Machine Learning-Based New Classification for Immune Infiltration of Gliomas. PLoS ONE 2024, 19, e0312071. [Google Scholar] [CrossRef]
  54. Azeez, O.; Azeez, O.A.; Abdulazeez, A.M. Classification of Brain Tumor Based on Machine Learning Algorithms: A Review. J. Appl. Sci. Technol. Trends 2025, 6, 1–15. [Google Scholar] [CrossRef]
  55. Tasci, E.; Popa, M.; Zhuge, Y.; Chappidi, S.; Zhang, L.; Cooley Zgela, T.; Sproull, M.; Mackey, M.; Kates, H.R.; Garrett, T.J.; et al. MetaWise: Combined Feature Selection and Weighting Method to Link the Serum Metabolome to Treatment Response and Survival in Glioblastoma. Int. J. Mol. Sci. 2024, 25, 10965. [Google Scholar] [CrossRef]
  56. Labory, J.; Njomgue-Fotso, E.; Bottini, S. Benchmarking Feature Selection and Feature Extraction Methods to Improve the Performances of Machine-Learning Algorithms for Patient Classification Using Metabolomics Biomedical Data. Comput. Struct. Biotechnol. J. 2024, 23, 1274–1287. [Google Scholar] [CrossRef]
  57. Wang, J.; Zhang, Z.; Wang, Y. Utilizing Feature Selection Techniques for AI-Driven Tumor Subtype Classification: Enhancing Precision in Cancer Diagnostics. Biomolecules 2025, 15, 81. [Google Scholar] [CrossRef] [PubMed]
  58. Ting-Yu, C.; Yang, L.; Liang, C.; Jie, L.; Chao, Z.; Xian-Feng, S. Identification of the Potential Biomarkers in Patients with Glioma: A Weighted Gene Co-Expression Network Analysis. Carcinogenesis 2019, 41, 743. [Google Scholar] [CrossRef]
  59. Li, Y.; Sun, H. Multi-Omics Analysis Identifies Novels Genes Involved in Glioma Prognosis. Sci. Rep. 2025, 15, 5806. [Google Scholar] [CrossRef] [PubMed]
  60. Yuan, H.; Cheng, J.; Xia, J.; Yang, Z.; Xu, L. Identification of Critical Biomarkers and Immune Landscape Patterns in Glioma Based on Multi-Database. Discov. Oncol. 2025, 16, 35. [Google Scholar] [CrossRef]
  61. Liu, Y.; Kannan, K.; Huse, J.; Hickman, R.; Miller, A.M.; Holle, B.M.; Jee, J.; Liu, S.-Y.; Ross, D.; Yu, H.; et al. BIOM-49. Patient-centric integrated graph database reveals critical biomarkers in the recurrence of idh wild-type glioma. Neuro Oncol. 2024, 26, viii30. [Google Scholar] [CrossRef]
  62. Carrilho, J.F.; Coletti, R.; Costa, B.M.; Lopes, M.B. Multi-Omics Biomarker Selection and Outlier Detection across WHO Glioma Classifications via Robust Sparse Multinomial Regression. medRxiv 2024. medRxiv:2024.08.26.24312601. [Google Scholar] [CrossRef]
  63. Vieira, F.G.; Bispo, R.; Lopes, M.B. Integration of Multi-Omics Data for the Classification of Glioma Types and Identification of Novel Biomarkers. Bioinform. Biol. Insights 2024, 18, 11779322241249564. [Google Scholar] [CrossRef] [PubMed]
  64. Paplomatas, P.; Douroumi, I.E.; Vlamos, P.; Vrahatis, A. Genetic Optimization in Uncovering Biologically Meaningful Gene Biomarkers for Glioblastoma Subtypes. BioMedInformatics 2024, 4, 811–822. [Google Scholar] [CrossRef]
  65. Cattelani, L.; Ghosh, A.; Rintala, T.; Fortino, V. A Comprehensive Evaluation Framework for Benchmarking Multi-Objective Feature Selection in Omics-Based Biomarker Discovery. IEEE/ACM Trans. Comput. Biol. Bioinform. 2024, 21, 2432–2446. [Google Scholar] [CrossRef]
  66. Tasci, E.; Zhuge, Y.; Kaur, H.; Camphausen, K.; Krauze, A.V. Hierarchical Voting-Based Feature Selection and Ensemble Learning Model Scheme for Glioma Grading with Clinical and Molecular Characteristics. Int. J. Mol. Sci. 2022, 23, 14155. [Google Scholar] [CrossRef] [PubMed]
  67. Harding-Larsen, D.; Funk, J.; Madsen, N.G.; Gharabli, H.; Acevedo-Rocha, C.G.; Mazurenko, S.; Welner, D.H. Protein Representations: Encoding Biological Information for Machine Learning in Biocatalysis. Biotechnol. Adv. 2024, 77, 108459. [Google Scholar] [CrossRef] [PubMed]
  68. Data Standardization: How to Do It and Why It Matters|Built In. Available online: https://builtin.com/data-science/when-and-why-standardize-your-data (accessed on 24 February 2025).
  69. Train-Test Split for Evaluating Machine Learning Algorithms—MachineLearningMastery.Com. Available online: https://machinelearningmastery.com/train-test-split-for-evaluating-machine-learning-algorithms/ (accessed on 24 February 2025).
  70. Kursa, M.B.; Jankowski, A.; Rudnicki, W.R. Boruta—A System for Feature Selection. Fundam Inf. 2010, 101, 271–285. [Google Scholar] [CrossRef]
  71. Habibi, A.; Delavar, M.R.; Sadeghian, M.S.; Nazari, B.; Pirasteh, S. A Hybrid of Ensemble Machine Learning Models with RFE and Boruta Wrapper-Based Algorithms for Flash Flood Susceptibility Assessment. Int. J. Appl. Earth Obs. Geoinf. 2023, 122, 103401. [Google Scholar] [CrossRef]
  72. Sarkar, D.; Bali, R.; Sharma, T. Feature Engineering and Selection. In Practical Machine Learning with Python: A Problem-Solver’s Guide to Building Real-World Intelligent Systems; Sarkar, D., Bali, R., Sharma, T., Eds.; Apress: Berkeley, CA, USA, 2018; pp. 177–253. ISBN 978-1-4842-3207-1. [Google Scholar]
  73. Chatterjee, T.; Chowdhury, R. Improved Sparse Approximation Models for Stochastic Computations. In Handbook of Neural Computation; Elsevier Inc.: Amsterdam, The Netherlands, 2017; pp. 201–223. ISBN 9780128113196. [Google Scholar]
  74. Hastie, T.; Tibshirani, R.; Friedman, J. Linear Methods for Regression. In The Elements of Statistical Learning: Data Mining, Inference, and Prediction; Hastie, T., Tibshirani, R., Friedman, J., Eds.; Springer: New York, NY, USA, 2009; pp. 43–99. ISBN 978-0-387-84858-7. [Google Scholar]
  75. Santos, M.R.; Guedes, A.; Sanchez-Gendriz, I. SHapley Additive ExPlanations (SHAP) for Efficient Feature Selection in Rolling Bearing Fault Diagnosis. Mach. Learn. Knowl. Extr. 2024, 6, 316–341. [Google Scholar] [CrossRef]
  76. Lundberg, S.M.; Lee, S.I. A Unified Approach to Interpreting Model Predictions. In Advances in Neural Information Processing Systems; MIT Press: Cambridge, MA, USA, 2017; pp. 4766–4775. [Google Scholar]
  77. Adnan, M.; Alarood, A.A.S.; Uddin, M.I.; Rehman, I. ur Utilizing Grid Search Cross-Validation with Adaptive Boosting for Augmenting Performance of Machine Learning Models. PeerJ Comput. Sci. 2022, 8, e803. [Google Scholar] [CrossRef]
  78. Bulagang, A.F.; Weng, N.G.; Mountstephens, J.; Teo, J. A Review of Recent Approaches for Emotion Classification Using Electrocardiography and Electrodermography Signals. Inf. Med. Unlocked 2020, 20, 100363. [Google Scholar] [CrossRef]
  79. Thomas, N.S.; Kaliraj, S. An Improved and Optimized Random Forest Based Approach to Predict the Software Faults. SN Comput. Sci. 2024, 5, 530. [Google Scholar] [CrossRef]
  80. Cervantes, J.; Garcia-Lamont, F.; Rodríguez-Mazahua, L.; Lopez, A. A Comprehensive Survey on Support Vector Machine Classification: Applications, Challenges and Trends. Neurocomputing 2020, 408, 189–215. [Google Scholar] [CrossRef]
  81. Xia, Y. Chapter Eleven—Correlation and Association Analyses in Microbiome Study Integrating Multiomics in Health and Disease. In Progress in Molecular Biology and Translational Science; Sun, J., Ed.; Academic Press: Cambridge, MA, USA, 2020; Volume 171, pp. 309–491. ISBN 1877–1173. [Google Scholar]
  82. Cao, Y.; Forssten, M.P.; Sarani, B.; Montgomery, S.; Mohseni, S. Development and Validation of an XGBoost-Algorithm-Powered Survival Model for Predicting In-Hospital Mortality Based on 545,388 Isolated Severe Traumatic Brain Injury Patients from the TQIP Database. J. Pers. Med. 2023, 13, 1401. [Google Scholar] [CrossRef]
  83. Chen, T.; Guestrin, C. XGBoost: A Scalable Tree Boosting System. In Proceedings of the ACM SIGKDD International Conference on Knowledge Discovery and Data Mining, San Francisco, CA, USA, 13–17 August 2016; pp. 785–794. [Google Scholar] [CrossRef]
  84. Pavlou, M.; Ambler, G.; Seaman, S.; De iorio, M.; Omar, R.Z. Review and Evaluation of Penalised Regression Methods for Risk Prediction in Low-dimensional Data with Few Events. Stat. Med. 2015, 35, 1159. [Google Scholar] [CrossRef] [PubMed]
  85. Zabor, E.C.; Reddy, C.A.; Tendulkar, R.D.; Patil, S. Logistic Regression in Clinical Studies. Int. J. Radiat. Oncol. Biol. Phys. 2022, 112, 271–277. [Google Scholar] [CrossRef]
  86. Montesinos López, O.A.; Montesinos López, A.; Crossa, J. Overfitting, Model Tuning, and Evaluation of Prediction Performance. In Multivariate Statistical Machine Learning Methods for Genomic Prediction; Montesinos López, O.A., Montesinos López, A., Crossa, J., Eds.; Springer International Publishing: Cham, Switzerland, 2022; pp. 109–139. ISBN 978-3-030-89010-0. [Google Scholar]
  87. Dalianis, H. Evaluation Metrics and Evaluation. In Clinical Text Mining: Secondary Use of Electronic Patient Records; Dalianis, H., Ed.; Springer International Publishing: Cham, Switzerland, 2018; pp. 45–53. [Google Scholar]
  88. Nahm, F.S. Receiver Operating Characteristic Curve: Overview and Practical Use for Clinicians. Korean J. Anesth. 2022, 75, 25. [Google Scholar] [CrossRef]
  89. Bahar, R.C.; Merkaj, S.; Cassinelli Petersen, G.I.; Tillmanns, N.; Subramanian, H.; Brim, W.R.; Zeevi, T.; Staib, L.; Kazarian, E.; Lin, M.D.; et al. Machine Learning Models for Classifying High- and Low-Grade Gliomas: A Systematic Review and Quality of Reporting Analysis. Front. Oncol. 2022, 12, 856231. [Google Scholar] [CrossRef]
  90. Hashido, T.; Saito, S.; Ishida, T. Radiomics-Based Machine Learning Classification for Glioma Grading Using Diffusion- And Perfusion-Weighted Magnetic Resonance Imaging. J. Comput. Assist Tomogr. 2021, 45, 606–613. [Google Scholar] [CrossRef]
  91. Wang, Z.; Xiao, X.; He, K.; Wu, D.; Pang, P.; Wu, T. A Study of MRI-Based Machine-Learning Methods for Glioma Grading. Int. J. Radiat. Res. 2022, 20, 115–120. [Google Scholar] [CrossRef]
  92. Rosenblatt, M.; Tejavibulya, L.; Jiang, R.; Noble, S.; Scheinost, D. Data Leakage Inflates Prediction Performance in Connectome-Based Machine Learning Models. Nat. Commun. 2024, 15, 1829. [Google Scholar] [CrossRef]
  93. Mallampati, S.B.; Hari, S. A Comparative Study on the Impacts of Data Leakage During Feature Selection Using the CIC-IoT 2023 Intrusion Detection Dataset. In Proceedings of the 10th International Conference on Electrical Energy Systems, ICEES 2024, Chennai, India, 22–24 August 2024. [Google Scholar]
  94. Piovani, D.; Sokou, R.; Tsantes, A.G.; Vitello, A.S.; Bonovas, S. Optimizing Clinical Decision Making with Decision Curve Analysis: Insights for Clinical Investigators. Healthcare 2023, 11, 2244. [Google Scholar] [CrossRef]
  95. Gerds, T.A.; Andersen, P.K.; Kattan, M.W. Calibration Plots for Risk Prediction Models in the Presence of Competing Risks. Stat. Med. 2014, 33, 3191–3203. [Google Scholar] [CrossRef] [PubMed]
  96. Zhang, Z.; Rousson, V.; Lee, W.-C.; Ferdynus, C.; Chen, M.; Qian, X.; Guo, Y.; written on behalf of AME Big-Data Clinical Trial Collaborative Group. Decision Curve Analysis: A Technical Note. Ann. Transl. Med. 2018, 6, 308. [Google Scholar] [CrossRef]
  97. Tian, Y.; Chen, L.; Jiang, Y. LASSO-Based Screening for Potential Prognostic Biomarkers Associated with Glioblastoma. Front. Oncol. 2023, 12, 1057383. [Google Scholar] [CrossRef]
  98. Mirchia, K.; Pan, S.; Payne, E.; Liu, J.; Peeran, Z.; Shukla, P.; Young, J.; Gupta, R.; Wu, J.; Pak, J.; et al. PATH-53. DNA mutation sequencing and methylation analysis of somaticnf1 mutant idh-wildtype glioblastoma identifies three epigenetic groups andcdkn2a/b loss as a negative prognostic biomarker. Neuro Oncol. 2024, 26, viii191. [Google Scholar] [CrossRef]
  99. Noor, H.; Briggs, N.E.; McDonald, K.L.; Holst, J.; Vittorio, O. Tp53 Mutation Is a Prognostic Factor in Lower Grade Glioma and May Influence Chemotherapy Efficacy. Cancers 2021, 13, 5362. [Google Scholar] [CrossRef] [PubMed]
  100. Rathore, F.A.; Khan, H.S.; Ali, H.M.; Obayya, M.; Rasheed, S.; Hussain, L.; Kazmi, Z.H.; Nour, M.K.; Mohamed, A.; Motwakel, A. Survival Prediction of Glioma Patients from Integrated Radiology and Pathology Images Using Machine Learning Ensemble Regression Methods. Appl. Sci. 2022, 12, 10357. [Google Scholar] [CrossRef]
  101. Zhao, R.; Zhuge, Y.; Camphausen, K.; Krauze, A.V. Machine Learning Based Survival Prediction in Glioma Using Large-Scale Registry Data. Health Inform. J 2022, 28, 14604582221135427. [Google Scholar] [CrossRef]
  102. Agrawal, A.; Maan, V. Computational Predictions of MGMT Promoter Methylation in Gliomas: A Mathematical Radiogenomics Approach. Commun. Appl. Nonlinear Anal. 2024, 31, 229–252. [Google Scholar] [CrossRef]
  103. Du, P.; Liu, X.; Wu, X.; Chen, J.; Cao, A.; Geng, D. Predicting Histopathological Grading of Adult Gliomas Based on Preoperative Conventional Multimodal MRI Radiomics: A Machine Learning Model. Brain Sci. 2023, 13, 912. [Google Scholar] [CrossRef]
  104. Liang, H.X.; Wang, Z.Y.; Li, Y.; Ren, A.N.; Chen, Z.F.; Wang, X.Z.; Wang, X.M.; Yuan, Z.G. The Application Value of Support Vector Machine Model Based on Multimodal MRI in Predicting IDH-1mutation and Ki-67 Expression in Glioma. BMC Med. Imaging 2024, 24, 244. [Google Scholar] [CrossRef]
  105. Yuan, Y.; Zhang, X.; Wang, Y.; Li, H.; Qi, Z.; Du, Z.; Chu, Y.; Feng, D.; Xie, Q.; Song, J.; et al. Multimodal Data Integration Using Deep Learning Predicts Overall Survival of Patients with Glioma. View 2024, 5, 20240001. [Google Scholar] [CrossRef]
  106. A Ilemobayo, J.; Durodola, O.; Alade, O.; J Awotunde, O.; T Olanrewaju, A.; Falana, O.; Ogungbire, A.; Osinuga, A.; Ogunbiyi, D.; Ifeanyi, A.; et al. Hyperparameter Tuning in Machine Learning: A Comprehensive Review. J. Eng. Res. Rep. 2024, 26, 388–395. [Google Scholar] [CrossRef]
  107. Likhitha, G.; Sree, B.R.; Ratan, C.; Karthikeyan, C.; Samkumar, G.V. Advancing Brain Tumor Classification Using CNN and EXtreme Gradient Boosting. In Proceedings of the 2024 International Conference on Expert Clouds and Applications, Bengaluru, India, 18–19 April 2024; pp. 985–991. [Google Scholar] [CrossRef]
  108. Yan, Z.; Wang, J.; Dong, Q.; Zhu, L.; Lin, W.; Jiang, X. XGBoost Algorithm and Logistic Regression to Predict the Postoperative 5-Year Outcome in Patients with Glioma. Ann. Transl. Med. 2022, 10, 860. [Google Scholar] [CrossRef] [PubMed]
  109. Tan, L.; Rue, J.; Mohinta, S.; Rees, J.; Brandner, S.; Nachev, P.; Hyare, H.; Bakhsh, A.; Scott, I.; Jenkinson, M.; et al. Mathematical modelling of survival in low grade gliomas at malignant transformation with xgboost. Neuro Oncol. 2024, 26, vii12–vii13. [Google Scholar] [CrossRef]
  110. Mitchell, R.; Frank, E. Accelerating the XGBoost Algorithm Using GPU Computing. PeerJ Comput. Sci. 2017, 3, e127. [Google Scholar] [CrossRef]
  111. Chen, D.W.; Miao, R.; Deng, Z.Y.; Lu, Y.Y.; Liang, Y.; Huang, L. Sparse Logistic Regression with L1/2 Penalty for Emotion Recognition in Electroencephalography Classification. Front. Neuroinform. 2020, 14, 29. [Google Scholar] [CrossRef] [PubMed]
  112. Xiang, Z.; Song, S.; Li, X.; Wu, F.; Li, B.; Wu, Q. Prediction of Stroke Hematoma Expansion Using a Machine Learning Model with Stacked Generalization. In Proceedings of the 2024 IEEE/ACIS 24th International Conference on Computer and Information Science, ICIS 2024—Proceedings, Shanghai, China, 20–22 September 2024; pp. 90–94. [Google Scholar]
  113. Singh, P.; Hasija, T.; Ramkumar, K.R. Optimizing Phishing Detection Systems with Ensemble Learning: Insights from a Multi-Model Voting Classifier. In Proceedings of the 5th International Conference on Smart Electronics and Communication, ICOSEC 2024, Kongunadu, India, 18–20 September 2024; pp. 1336–1341. [Google Scholar]
  114. Akhy, S.A.; Mia, M.B.; Mustafa, S.; Chakraborti, N.R.; Krishnachalitha, K.C.; Rabbany, G. A Comprehensive Study on Ensemble Feature Selection Techniques for Classification. In Proceedings of the 2024 11th International Conference on Computing for Sustainable Global Development, INDIACom 2024, New Delhi, India, 28 February–1 March 2024; pp. 1319–1324. [Google Scholar]
  115. Ballard, J.L.; Wang, Z.; Li, W.; Shen, L.; Long, Q. Deep Learning-Based Approaches for Multi-Omics Data Integration and Analysis. BioData Min. 2024, 17, 38. [Google Scholar] [CrossRef]
  116. Munquad, S.; Das, A.B. DeepAutoGlioma: A Deep Learning Autoencoder-Based Multi-Omics Data Integration and Classification Tools for Glioma Subtyping. BioData Min. 2023, 16, 32. [Google Scholar] [CrossRef]
Figure 1. Venn diagram illustrating feature selection overlap among Boruta, LASSO, and SHAP methods.
Biomedinformatics 05 00034 g001
Figure 2. SHAP summary plot depicting feature importance and impact on the glioma classification model.
Biomedinformatics 05 00034 g002
Figure 3. (ROC) curves for optimized machine learning models in glioma classification.
Biomedinformatics 05 00034 g003
Figure 4. Confusion matrices for all four models showing class-specific performance.
Biomedinformatics 05 00034 g004
Figure 5. Precision–recall curves for GBM detection with Average Precision scores.
Biomedinformatics 05 00034 g005
Figure 6. Calibration plots showing predicted vs. observed probabilities.
Biomedinformatics 05 00034 g006
Figure 7. Decision curve analysis showing net benefit.
Biomedinformatics 05 00034 g007
Table 1. Best hyperparameter configurations for each model.
ModelBest Parameters
Random Forest{‘n_estimators’: 300, ‘min_samples_split’: 5, ‘min_samples_leaf’: 2, ‘max_depth’: 30}
SVM{‘kernel’: ‘rbf’, ‘gamma’: ‘auto’, ‘C’: 10}
XGBoost{‘subsample’: 0.7, ‘n_estimators’: 100, ‘max_depth’: 3, ‘learning_rate’: 0.01}
Logistic Regression{‘solver’: ‘liblinear’, ‘penalty’: ‘l1’, ‘C’: 1}
Table 2. Performance metrics of machine learning models.
DatasetModelPrecisionRecallF1-ScoreAccuracy
Training setRandom Forest0.90440.90160.90200.9016
SVM0.89620.88220.88900.8822
XGBoost0.88190.87480.87550.8748
Logistic Regression0.88630.88090.88160.8792
Testing setRandom Forest0.85230.84530.84880.8453
SVM0.86040.85710.85880.8571
XGBoost0.87110.86300.86700.8630
Logistic Regression0.89240.88090.88660.8809
Note: The table presents performance metrics for each model on both training and testing datasets. All metric values are presented in decimal form rather than percentages for precision. The testing set represents 20% of the data that was held out during model training to evaluate generalization performance.
Table 3. Clinical decision support metrics at different thresholds.
ModelThresholdSensitivitySpecificityPPVNPVNNS
Random Forest0.30.9290.7860.7560.9391.323
0.50.9000.8270.7880.9201.270
0.70.6000.9180.8400.7631.190
SVM0.30.9430.8160.7860.9521.273
0.50.8860.8370.7950.9111.258
0.70.8290.8570.8060.8751.241
XGBoost0.30.9570.7860.7610.9621.313
0.50.9290.8160.7830.9411.277
0.70.2570.9800.9000.6491.111
Logistic Regression0.30.9430.8160.7860.9521.273
0.50.9140.8570.8210.9331.219
0.70.6710.8980.8250.7931.213
Note: PPV = positive predictive value; NPV = negative predictive value; NNS = number needed to screen (1/PPV). Sensitivity represents the proportion of GBM cases correctly identified; Specificity represents the proportion of LGG cases correctly identified. Lower NNS values indicate higher efficiency in identifying true positive cases.
Disclaimer/Publisher’s Note: The statements, opinions and data contained in all publications are solely those of the individual author(s) and contributor(s) and not of MDPI and/or the editor(s). MDPI and/or the editor(s) disclaim responsibility for any injury to people or property resulting from any ideas, methods, instructions or products referred to in the content.

