Article

Impact of Data Pre-Processing Techniques on XGBoost Model Performance for Predicting All-Cause Readmission and Mortality Among Patients with Heart Failure

by
Qisthi Alhazmi Hidayaturrohman
1,2 and
Eisuke Hanada
3,*
1
Graduate School of Science and Engineering, Saga University, Saga 840-8502, Japan
2
Department of Electrical Engineering, Universitas Pembangunan Nasional Veteran Jakarta, Jakarta 12450, Indonesia
3
Faculty of Science and Engineering, Saga University, Saga 840-8502, Japan
*
Author to whom correspondence should be addressed.
BioMedInformatics 2024, 4(4), 2201-2212; https://doi.org/10.3390/biomedinformatics4040118
Submission received: 10 September 2024 / Revised: 15 October 2024 / Accepted: 29 October 2024 / Published: 1 November 2024

Abstract

:
Background: Heart failure poses a significant global health challenge, with high rates of readmission and mortality. Accurate models to predict these outcomes are essential for effective patient management. This study investigates the impact of data pre-processing techniques on XGBoost model performance in predicting all-cause readmission and mortality among heart failure patients. Methods: A dataset of 168 features from 2008 heart failure patients was used. Pre-processing included handling missing values, categorical encoding, and standardization. Four imputation techniques were compared: Mean, Multivariate Imputation by Chained Equations (MICEs), k-nearest Neighbors (kNNs), and Random Forest (RF). XGBoost models were evaluated using accuracy, recall, F1-score, and Area Under the Curve (AUC). Robustness was assessed through 10-fold cross-validation. Results: The XGBoost model with kNN imputation, one-hot encoding, and standardization outperformed others, with an accuracy of 0.614, recall of 0.551, and F1-score of 0.476. The MICE-based model achieved the highest AUC (0.647) and mean AUC (0.65 ± 0.04) in cross-validation. All pre-processed models outperformed the default XGBoost model (AUC: 0.60). Conclusions: Data pre-processing, especially MICE with one-hot encoding and standardization, improves XGBoost performance in heart failure prediction. However, moderate AUC scores suggest further steps are needed to enhance predictive accuracy.

1. Introduction

As one of the deadliest diseases and most prominent health issues globally, heart failure affects an estimated 64 million people worldwide and accounts for substantial healthcare expenditures [1]. Disease progression is unpredictable, which presents significant challenges for patient care and outcome prediction. Accurate readmission and mortality risk prediction is essential for optimizing treatment strategies and resource allocation in healthcare systems [2].
While traditional approaches have relied on statistical methods such as logistic regression and the Cox proportional hazard model [3], machine learning has emerged as powerful tools for analyzing complex medical data, particularly heart failure data, and developing predictive models [4]. For instance, A. Sundararaman et al. built a logistic regression model with a structured dataset that contains demographic and clinical variables to predict the hospital readmission of heart failure patients, with the results showing an AUC of 0.68 [5]. More recently, machine learning-based models have gained prominence. V. Sharma et al. compared 12 machine learning models with an LACE score model and found that all machine learning models outperformed it, with an AUC of 0.570 for heart failure prediction [6].
The eXtreme Gradient Boosting (XGBoost) algorithm showed promising performance in building predictive models, including its ability to address missing values [7] and to capture non-linear relations between variables [8]. Building on these capabilities, V. Sharma et al. reported that their XGBoost model resulted in superior predictive performance compared to 11 other machine learning applications, with an AUC of 0.654 [6]. While this performance was promising, L. Jing et al. presented an XGBoost model that predicted 1-year all-cause mortality with an AUC of 0.77, outperforming two other proposed models based on logistic regression (AUC: 0.74) and RF (AUC: 0.76) [9]. Expanding on this work, C. Luo et al. developed an XGBoost model that has the ability to reduce overfitting by presenting well-shaped calibration plots of an XGBoost model that had an AUC of 0.809 (95% CI 0.805–0.814) in their external validation [10]. Collectively, these findings underscore the potential of machine learning algorithms, especially XGBoost, in capturing complex relations among heart failure data.
However, the performance of such algorithms is heavily reliant on the quality and preparation of input data, especially in real-world clinical datasets, particularly heart failure datasets, which often contain missing values, various data types, and possible errors, making data pre-processing essential to improve model robustness and performance. Data pre-processing, including techniques like imputation, feature encoding, and standardization, plays a crucial role in improving the performance and reliability of predictive models [11]. Zolbanin and Delen presented the value and importance of data pre-processing, including imputation techniques, in building predictive models for hospital readmission of patients with chronic disease, reporting that Random Forest predictive models showed better results, with AUC scores of 0.752 and 0.754 for heart failure and COPD, respectively [12]. For imputation, A. K. Waljee et al. compared four different techniques for handling completely missing random laboratory data. Their results showed that missForest (an RF-based imputation in R language) outperformed other imputation techniques, including MICE, kNN, and Mean imputation [13]. While studies explaining the impact of standardization or z-score normalization in heart failure prediction might not be that familiar, Rizinde, Ngaruye, and Cahill utilized a standardization technique when building their predictive models [14]. However, their proposed study did not include comparative studies that comprehensively described why they needed standardization in building the models. Additionally, while various studies examined the impact of data pre-processing on machine learning-based models in various settings, which commonly resulted in better performance than without pre-processing, Rusdah and Murfi demonstrated that XGBoost without imputation outperformed models with Mean and kNN imputation when handling missing factors used for life insurance risk prediction [15].
Machine learning models applied to heart failure data, such as XGBoost, often need help with overfitting, especially when trained on small or imbalanced datasets. Overfitting occurs when the model captures noise or overly specific patterns in the training data, resulting in high accuracy on the training set but poor performance on unseen test data, which usually can be seen in the difference between after cross-validation and initial performance [4,7,8]. This problem is especially prevalent when models are trained on datasets with missing values, which is common in clinical data [11,12,13,14,15]. As a result, the model’s predictions may not generalize well to other datasets, even in a controlled experimental setting. This study aims to reduce overfitting by employing rigorous preprocessing methods and using techniques such as 10-fold cross-validation to ensure that the XGBoost model works consistently across different subsets of data. In doing so, we seek to improve the robustness of the model in experimental datasets without overfitting to specific patterns in the training data, ensuring that it can be effectively generalized.
While machine learning models like XGBoost have shown promise in predicting clinical outcomes, the influence of data preprocessing, particularly imputation, encoding, and standardization, on these models has yet to be thoroughly explored in the context of heart failure data. Given the high levels of missing and heterogeneous data in clinical records, this study seeks to fill this knowledge gap by comparing various preprocessing approaches to optimize XGBoost model performance and inform future work in clinical predictive analytics. Specifically, this study seeks to accomplish the following:
  • Evaluate and compare the effectiveness of different imputation methods (Mean, Multivariate Imputation by Chained Equation (MICE), k-nearest Neighbors (kNNs), and Random Forest) in enhancing model performance. While Mean imputation offers simplicity, MICE considers variable relations, kNN captures local data structures, and Random Forest imputation offers robustness against data complexity.
  • Assess the impact of feature encoding and standardization on prediction accuracy.
  • Examine the robustness of these models through comprehensive cross-validation.
It is our hope that our findings offer new insights for optimizing data pre-processing strategies, potentially improving real-time risk predictions and personalized care for heart failure patients.

2. Materials and Methods
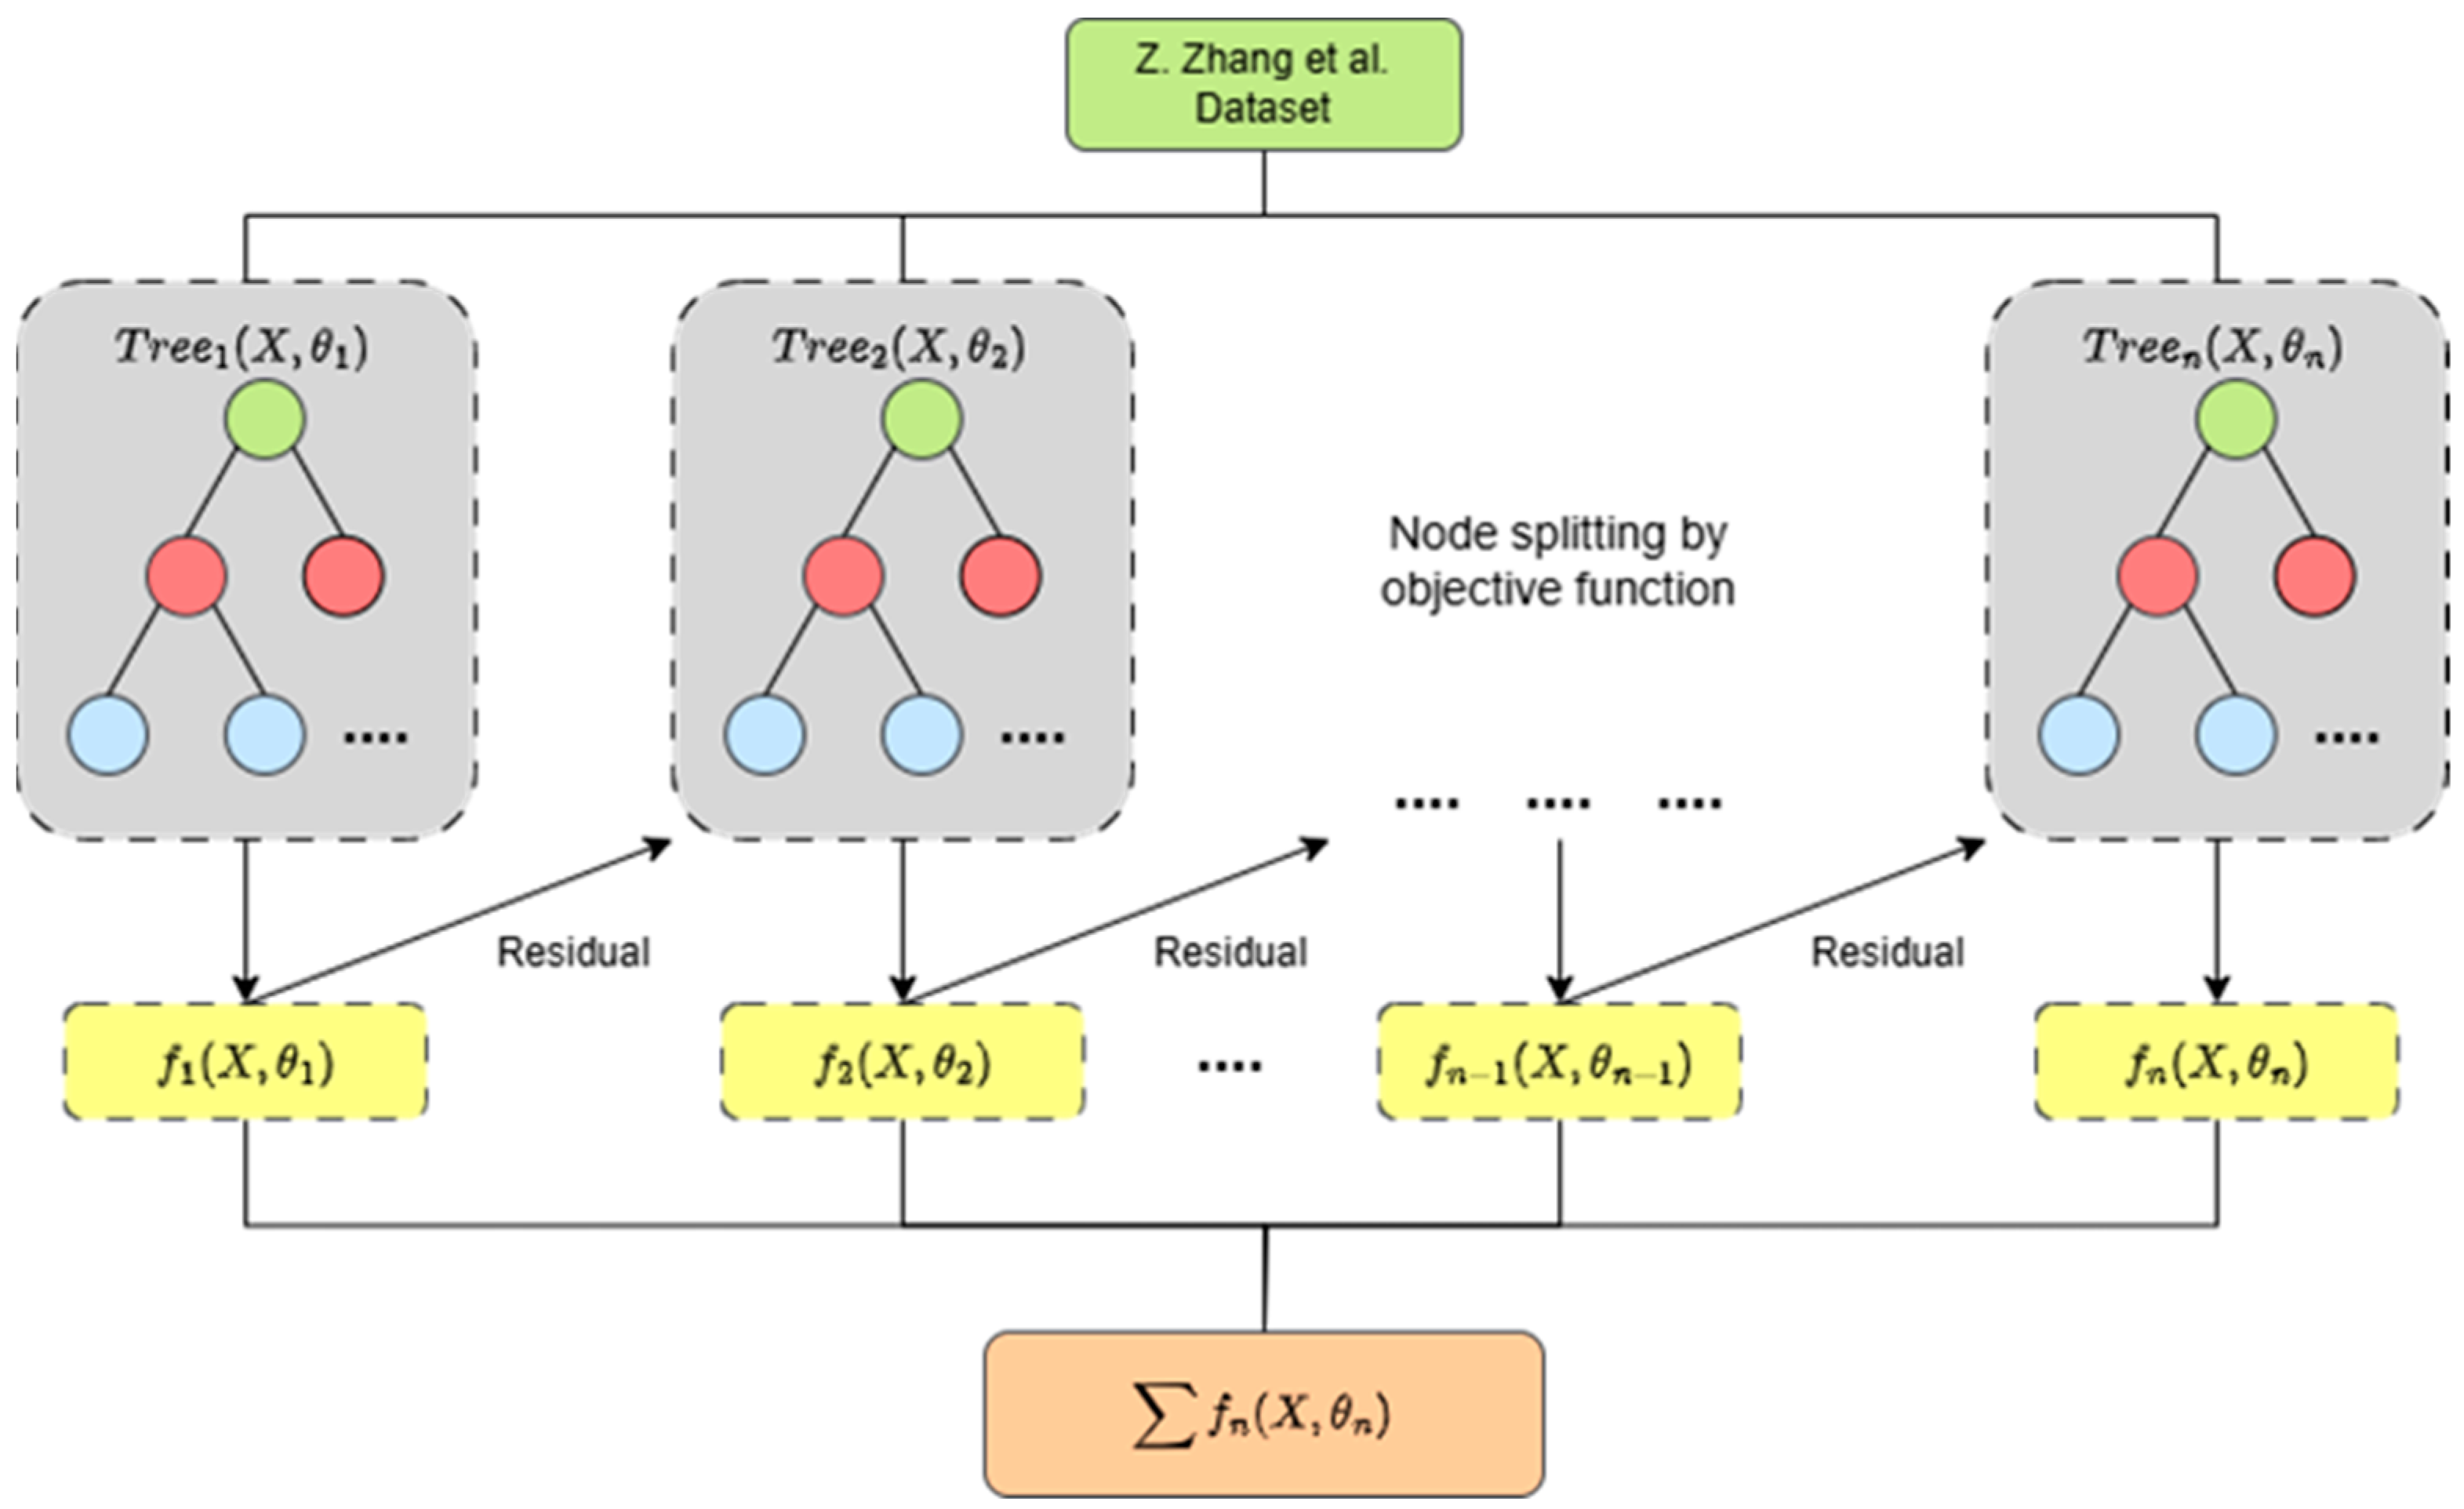
2.1. Dataset

This study is based on a dataset from a retrospective study conducted by Z. Zhang et al. [16] that was published on the Physionet website [17]. They extracted data from electronic healthcare records routinely collected by Zigong Fourth People’s Hospital, China, between December 2016 and June 2019. The dataset includes 168 features for 2008 patients diagnosed with heart failure according to European Society of Cardiology (ESC) criterion.
The Zhang dataset consists of baseline clinical characteristics that were measured on hospital admission, including body temperature, respiration rate, pulse rate, blood pressure, body mass index (BMI), New York Heart Association (NYHA) class, heart failure type, grade of Killip, and GCS or Glasglow Coma Scale. In addition, the dataset included laboratory findings [17]. Possible outcomes included mortality and readmission within twenty-eight days, three months, and six months. Table S1 describes the dataset dictionary, and S2 describes the summary of each feature of the dataset, which comprises clinical, demographic, and laboratory variables, including vital signs, comorbidities, and lab results, essential for predicting heart failure risk outcomes.

2.2. Pre-Processing Techniques Applied

In the pre-processing stage, we removed eight features (‘Unnamed: 0’, ‘inpatient.number’, ‘DestitationDischarge’, ‘admission.ward’, ‘admission.way’, ‘occupation’, ‘discharge.department’, ‘visit.times’, and ‘discargeDay’) that were not necessary in the predictive model-building stage: none were related to the expected outcomes of the model. Because we focused on predicting all-cause readmission and mortality, we assigned a new feature that combined readmission and mortality within six months. This new outcome label summed up all the outcomes, including readmission and mortality within twenty-eight days and three months. We removed the other outcome features to avoid duplication in our predictive model-building stage.

2.2.1. Handling Missing Values and Imputation

Because the dataset had about 18% missing values, as presented in Table S2, we removed features with more than 50% missing values [18]. However, before removing them, we first checked the importance of the feature using XGBoost to determine if it influenced the performance of the predictive model. Based on the results of the XGBoost-based model, as visualized in Figure S2, the ‘high-sensitivity-protein’ feature was in the top 10 even though it had about 53% missing values; therefore, we kept it in the dataset for further processing.
Furthermore, we separated continuous and categorical features from the dataset for the encoding and standardization process. In this study, we implemented Mode imputation to address the missing value problem in categorical features. In contrast, for our comparison of continuous features, we used four different imputation techniques: Mean, Multivariate Imputation by Chained Equations (MICEs), k-nearest Neighbor (kNN), and Random Forest (RF) imputation.

2.2.2. Label Encoding and Standardization

Because nine categorical features remained, we used one-hot encoding to convert them into an integer data type. This step was performed by creating a new variable for each categorical output, meaning that the new variable contained a binary output, either 0 or 1, representing the value of the categorical feature [19]. For example, a categorical feature has left, right, and center. By implementing one-hot encoding, the categorical feature was divided into left and right category variables that contain 0 or 1, which represented the absence (0) or presence (1) of the category. However, while the left and right categories have 0 values, the category is the center. This technique is suitable for non-ordinal categorical features, so it was used to convert the dataset’s categorical features. Aside from the increasing of dimensionality of the dataset after applying one-hot encoding, one-hot encoding gives valuable insight into the model’s interpretation.
After inputting the continuous features with the various techniques, we implemented standardization to transform all of the continuous features into an equal weight value [20]. Standardization, also known as z-score normalization, is a crucial step in pre-processing. The dataset used in this study contains various types of continuous features that might be related, but it has different units and various ranges of values. Standardization transforms the continuous features to a similar scale, with a mean of 0 and a variation of 1. The following formula is the first form that transforms normal variates to a standard score. It is known as the z-score formula [21]:
Z 1 = X X ¯ σ ,
where X is the original data value, X ¯ is the sample mean, and σ is the sample standard deviation.

2.3. XGBoost Model Building

Our predictive models were built using the XGBoost algorithm. XGBoost is a tree-based boosting algorithm that satisfies the demand for prediction issues [22]. XGBoost leverages the n-number of decision tree probability results. By employing the gradient boosting strategy, the XGBoost algorithm generates one new tree at a time rather than all trees simultaneously. It regularly fixed the prior test results by matching the residuals of the latest prediction. After training the model, the XGBoost algorithm obtained n trees, each corresponding to a prediction score. XGBoost obtained the final prediction values by adding up each corresponding tree score [23], as shown in Figure 1.
By default, XGBoost can build a predictive model without removing or performing imputation to address missing values [4]. However, in this study, we carried out pre-processing stages, including removing features with more than 50% missing values, performing imputation for features with 50% or less missing values, encoding the categorical features, and standardizing for continuous features. The overall process of our study is shown in the flow diagram presented in Figure 2.

2.4. Model Evaluation and Validation

We used classification metrics to evaluate the performance of our predictive models. It contains true positive (TP), true negative (TN), false positive (FP), and false negative (FN) classes [24]. By leveraging the classification metrics, we evaluated each predictive model by measuring its accuracy, precision, recall, F1-score, and AUC. Accuracy is the most common metric used to evaluate classification performance. By dividing the sum of true positives and true negatives and combining the whole classes, we can measure the accuracy of the models [25].
A c c u r a c y = T P + T N T P + F P + T N + F N ,
Precision, also known as the positive prediction value (PPV), is the ratio of properly identified positive samples to the total number of predicted positive samples, as presented in the following equation [25]:
P r e c i s i o n P P V = T P F P + T P ,
The other performance parameter, called recall or sensitivity, is the ratio of successfully identified positive samples to all positive samples. To measure recall, we divided the true positive by the sum of the true positive and false negative as in the following formula [25]:
R e c a l l s e n s i t i v i t y = T P T P + F N ,
The F1-score represents the harmonic mean of precision and recall as the following equation [26]:
F 1 s c o r e = 2 · P r e c i s i o n × R e c a l l P r e c i s i o n + R e c a l l ,
Furthermore, we calculated the Area under the ROC curve (AUC) as a measure of the ROC curve, which represents its classification ability. The receiver operating characteristic curve does not have scalar values because it uses recall and precision as a two-dimensional graph represented as the y- and x-axis [25]. Figure 3 presents four crucial points in the ROC curve. While point A represents no positive classification for the classifier, point C represents all positives for the classifier. Point B is known as the ideal operating point, which represents the perfect classification. On the contrary, point D represents no classification that is correctly identified. The ROC also evaluates how well a classification model distinguishes its label class, measured by the AUC in scalar value between zero and one, with a chance level of 0.5 [26].

2.5. Cross-Validation

We used 10-fold cross-validation to validate the robustness of our models. In machine learning, k-fold cross-validation is commonly used to prevent the overfitting of the predictive model [27]. In contrast, k-fold cross-validation may also be used to determine a model’s robustness by randomly sampling a dataset with a specific machine learning algorithm [28]. The k-fold cross-validation divides the learning set into a k subset with equal size. The term “fold” refers to the resulting subset number. K-fold cross-validation trains k-1 subsets that represent the training set and builds them into a model. Next, the remaining subset, the validation set, is subjected to the model, which provides the performance. We used the AUC with cross-validation as the performance parameter for model validation. Although computationally intensive, 10-fold cross-validation was chosen to ensure robustness across folds. Furthermore, in this study, we were able to manage the computational requirements because the given dataset was not that large.

3. Results

After removing features that were not necessary for model building and adding one outcome feature, all-cause readmission and mortality within six months, we obtained a dataset with 167 features and 2008 entries. We then removed features with more than 50% missing values, leaving 108 features and 2008 entries. After the removal process, the current dataset had 26 categorical and 82 continuous features. We then implemented Mode imputation and encoding for categorical features and various imputations (Mean, MICE, kNN, and RF) with standardization for continuous features.

3.1. Model Performance Comparison

In the model-building stage, we split the dataset: 80% for training and 20% for the test set. We compared each model that went through the pre-processing stage presented in Figure 2 with a model we built without a pre-processing stage.
According to the comparison of the initial performance evaluations of all the models tested, shown in Table 1, the XGBoost model combined with kNN-based imputation, encoding, and standardization outperformed the others in four parameters: accuracy (0.614), recall (0.551), precision (0.432), and F1-score (0.492), with the highest proportion of correct positive predictions and best balance between precision and recall. In contrast, the XGBoost model with MICE imputation, encoding, and standardization achieved the highest performance in terms of the AUC (0.647), which indicates that this pre-processing combination improved the model’s overall predictive ability and capacity to correctly identify all-cause readmission and mortality for about 64.6% of the cases. Mean- and Random Forest-based imputation did not perform as well as the other models, but it was still slightly better than the default model, with an AUC over 0.60.
The advantage of the XGBoost algorithm is that it can address missing value problems by default without involving any imputation in the previous stage. Nevertheless, the resulting performance may not be as good as the previously imputed models. The default XGBoost model, which handles missing values internally without pre-processing, showed an AUC of 0.60. While slightly lower than the pre-processed models, this performance demonstrates the ability of XGBoost to handle missing data effectively. The performance of the default model was marginally lower across most metrics than were the pre-processed models, which shows that, while XGBoost can handle missing data internally, additional pre-processing steps can enhance its predictive performance.
Although not significant, the differences in performance across the various pre-processing methods highlight the impact of data preparation choices on model outcomes. The MICE-based imputation model’s higher AUC (0.646) indicates a slight edge for it in heart failure risk prediction discriminative ability.

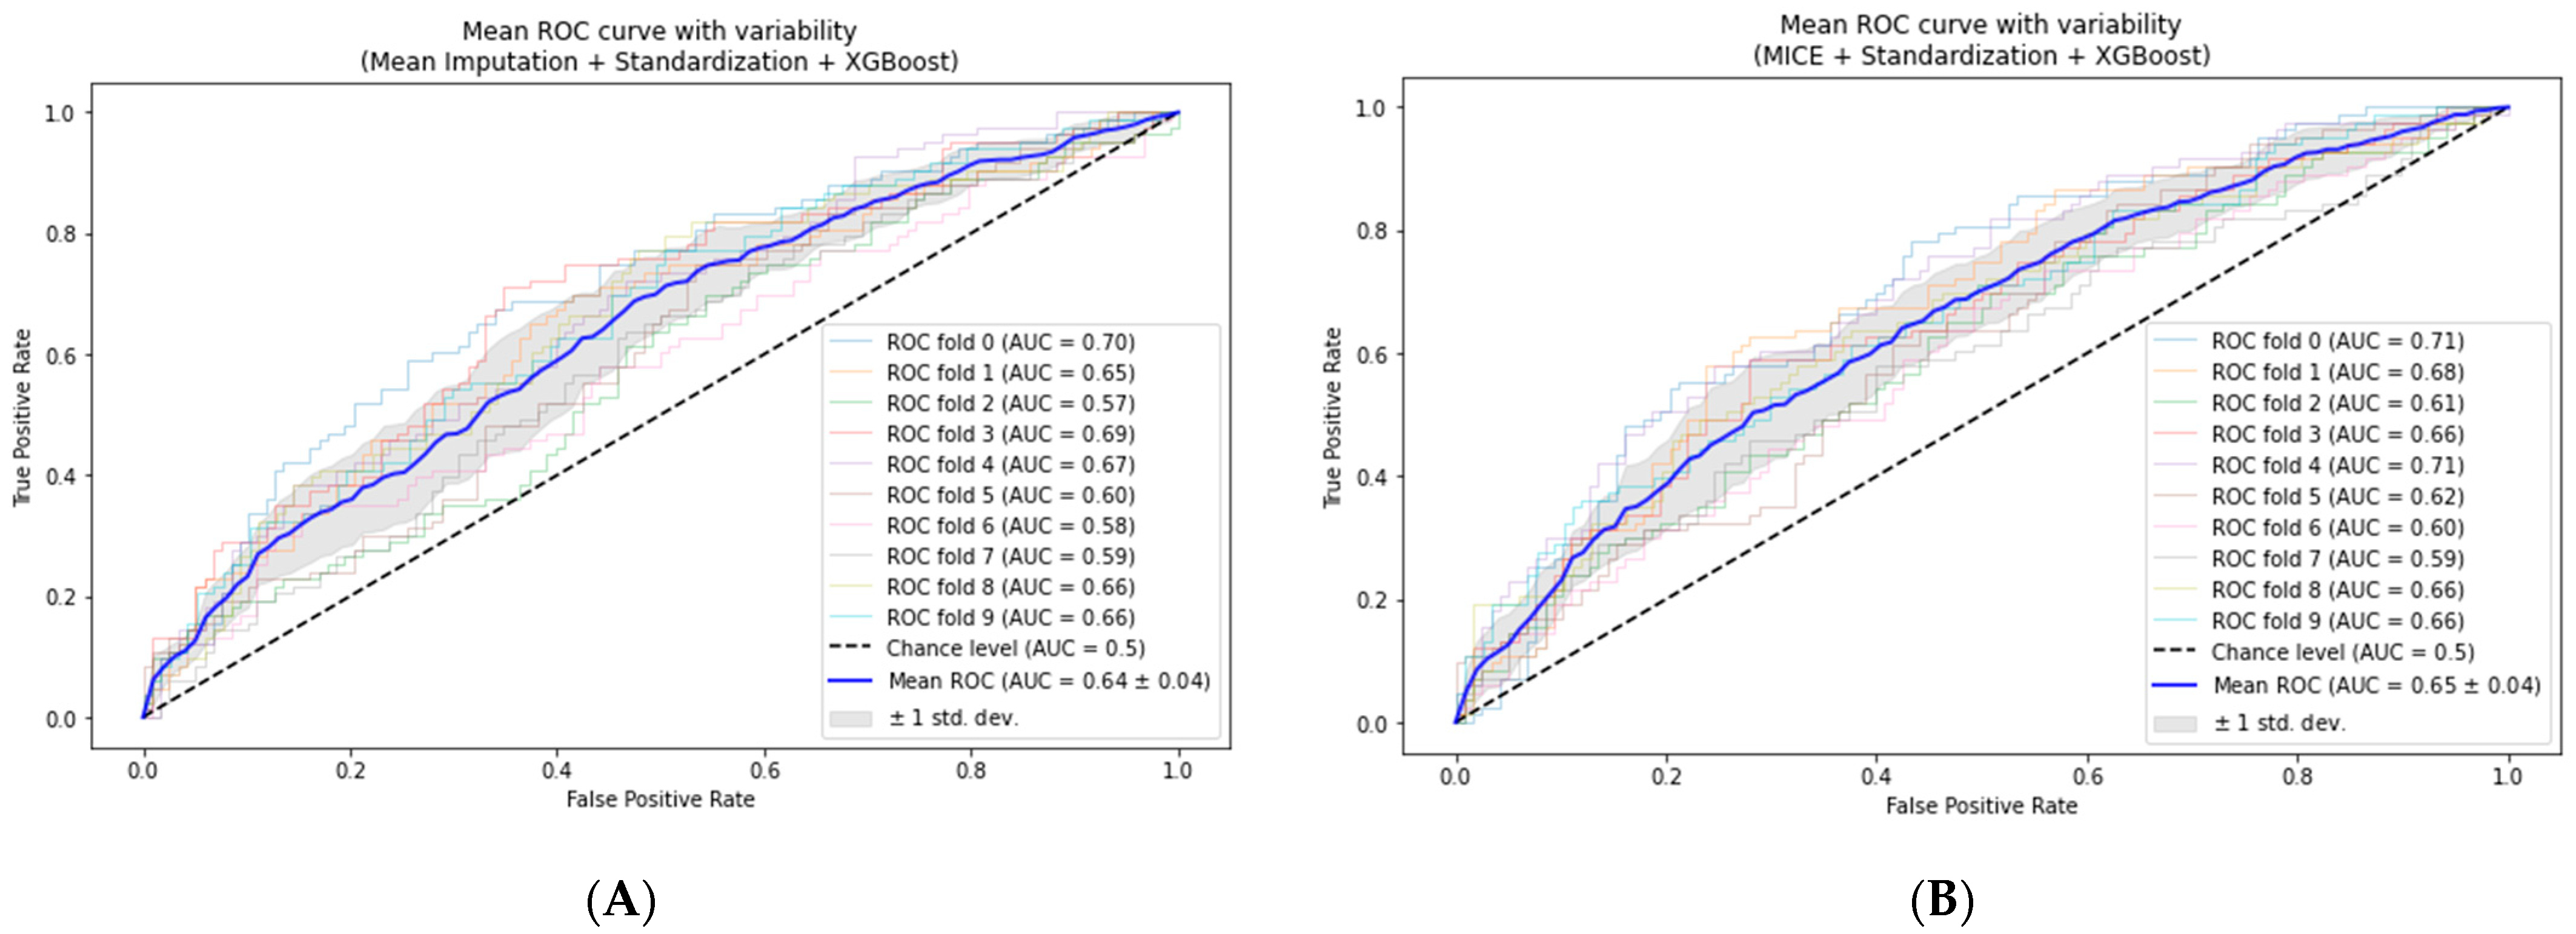
3.2. Cross-Validation of the Models

We validated the performance of each proposed model with 10-fold cross-validation, focusing on the AUC, as shown in Figure 4. This approach provides a more robust assessment of model performance than does a single train-test split. Our cross-validation results revealed nuanced differences in model performance across various pre-processing strategies:
  • Mean-based imputation model: The AUC increased to 0.64 ± 0.04, suggesting a slight enhancement in predictive power and generalizability.
  • MICE-based model: The mean of the AUC slightly increased from 0.647 to 0.65 ± 0.04, demonstrating stability across different data subsets.
  • kNN-based imputation model: We observed improvement from 0.619 to 0.63 ± 0.06, indicating a modest increase in model performance.
  • Random Forest-based imputation: This method generated slight improvement, from 0.625 to 0.63 ± 0.06, showing stability in various data subsets.
The standard deviations (ranging from 0.04 to 0.06) across all models suggest moderate consistency in performance across different data subsets. This variability underscores the importance of robust validation techniques in assessing model reliability. MICE-based imputation still demonstrated the highest mean AUC (0.65), while kNN- and Random Forest-based imputation showed the lowest (0.63). The mean-based imputation methods resulted in a mean AUC of 0.64. Although the differences in AUC scores between imputation methods are relatively small, they highlight the potential impact of pre-processing choices on the performance of a model.

3.3. Comparison to Related Studies

We compared our proposed method to those of other studies with similar objectives that proposed different approaches to the Zhang dataset (Table 2). The values in bold indicate the highest score of each parameter. However, because each study presented different performance parameters, we only showed the performance calculated in each study. Our study results were not superior in terms of F1-score, sensitivity, or recall; however, the best AUC score was obtained by the MICE-based model, indicating that our proposed MICE-based model is able to accurately rank a randomly selected positive instance higher than a randomly selected negative instance in a more effective way than the models of other studies.

4. Discussion

Our study highlights the significant impact of pre-processing techniques on the performance of XGBoost models used to predict all-cause readmission and mortality among patients with heart failure. Our findings demonstrate that, although XGBoost can address missing values by default, additional pre-processing stages can enhance its predictive performance. The MICE technique, when combined with one-hot encoding and standardization, achieved the highest AUC, 0.647, in the initial evaluation and 0.65 ± 0.04 in the 10-fold cross-validation. This result suggests that the ability of MICE to consider the relation between variables during imputation may benefit heart failure predictive analytic models.
Although the MICE imputation technique outperformed other imputation techniques in this study in terms of AUC and general predictive performance, its computational complexity suggests that a more straightforward imputation method may still be preferable in specific real-world applications, mainly where interpretability, speed, and ease of use are essential. In this study, kNN imputation showed more promise than the MICE imputation technique, with moderate performance in every parameter. KNN imputation requires minor computational processing compared to MICE but can still outperform other imputations mentioned in this study.
The consistent improvement in model performance across different pre-processing techniques underscores the importance of data preparation in clinical predictive modeling. The variability in performance metrics across different imputation techniques highlights nuanced trade-offs in choosing pre-processing techniques. These slight differences have meaningful implications in a clinical context where false positives and negatives carry different weights.
Our decision to maintain the ‘high-sensitivity-protein’ feature despite its high missingness proved insightful, demonstrating the value of combining domain knowledge with data-driven approaches in feature selection. This approach would be relevant to medical informatics: features with high missing values may hold significant predictive power.
The 10-fold cross-validation results, showing AUC scores ranging from 0.63 to 0.65 with a standard deviation of 0.04–0.06, indicate that the proposed models correctly ranked a randomly chosen positive instance (a patient who will be readmitted or die) higher rate than a randomly chosen negative instance 60% of the time. Additionally, our findings show moderate model stability across different data subsets. This consistency shows that our models would maintain predictive performance across varied patient cohorts. However, the relatively poor AUC scores also point to the challenging nature of predicting heart failure outcomes and the potential need for more advanced modeling techniques and/or additional data sources to significantly improve predictive performance. Furthermore, from a practical point of view, an AUC between 0.63 and 0.65 means that, if clinicians were to use this model, they would be right about 63% to 65% of the time when predicting if a patient is at higher risk. While this range is not perfect, it offers a valuable starting point for identifying higher-risk patients, particularly in resource-limited settings.
A limitation of our study is the reliance on a single dataset from one hospital in China, which may limit the generalizability of our findings to other populations. Additionally, even though our proposed pre-processing techniques improved the performance of the models, the modest improvement suggests that the available features affected the predictive power. Future work will focus on different datasets from different sources to improve the generalizability of predictive analytic approaches to heart failure risk prediction.

5. Conclusions

This study demonstrates that thoughtful data pre-processing can meaningfully improve the predictive performance of XGBoost models for heart failure outcomes. The modest improvements in AUC scores highlight the inherent complexity of predicting heart failure readmission and mortality, underscoring the critical role of data preparation in clinical predictive modeling. Our findings reveal that, while pre-processing techniques like MICE imputation, feature encoding, and standardization enhance model performance, there remains significant room for improvement in predictive accuracy. This research emphasizes the importance of balancing sophisticated data handling with clinical domain knowledge to develop more effective tools. Future works will focus on incorporating diverse data sources and advanced modeling techniques to better capture the multifaceted nature of heart failure progression and to improve patient outcomes.

Supplementary Materials

The following supporting information can be downloaded at https://www.mdpi.com/article/10.3390/biomedinformatics4040118/s1, Table S1: Dataset dictionary; Table S2: Dataset summary; Table S3: Dataset missingness; Figure S1: Creating a new outcome and removing unnecessary and unused outcome features; Figure S2: Feature importance of the dataset based on XGBoost model.

Author Contributions

Conceptualization, Q.A.H. and E.H.; methodology, Q.A.H.; writing—original draft preparation, Q.A.H.; software, Q.A.H.; validation, Q.A.H. and E.H.; writing—review and editing, Q.A.H. and E.H.; supervision, E.H. All authors have read and agreed to the published version of the manuscript.

Funding

This research received no external funding.

Institutional Review Board Statement

This study used a dataset from Physionet that is publicly accessible but that has restricted access to download. This study was conducted in accordance with the Declaration of Helsinki and approved by the institutional Review Board of Zigong Fourth People’s Hospital (protocol code: 2020-010 and day of approval: 8 June 2020).

Informed Consent Statement

Not applicable.

Data Availability Statement

The dataset used in this study can be accessed at https://physionet.org/content/heart-failure-zigong/1.3/ (accessed on 9 September 2024).

Acknowledgments

The authors would like to thank the members of the Laboratory of Fundamental and Applied Informatics at Saga University who supported this study.

Conflicts of Interest

The authors declare no conflicts of interest.

References

  1. Shahim, B.; Kapelios, C.J.; Savarese, G.; Lund, L.H. Global Public Health Burden of Heart Failure: An Updated Review. Card. Fail. Rev. 2023, 9, e11. [Google Scholar] [CrossRef] [PubMed]
  2. Helm, J.E.; Alaeddini, A.; Stauffer, J.M.; Bretthauer, K.M.; Skolarus, T.A. Reducing Hospital Readmissions by Integrating Empirical Prediction with Resource Optimization. Prod. Oper. Manag. 2016, 25, 233–257. [Google Scholar] [CrossRef]
  3. Krittayaphong, R.; Chichareon, P.; Komoltri, C.; Sairat, P.; Lip, G.Y.H. Predicting Heart Failure in Patients with Atrial Fibrillation: A Report from the Prospective COOL-AF Registry. J. Clin. Med. 2023, 12, 1265. [Google Scholar] [CrossRef] [PubMed]
  4. Badawy, M.; Ramadan, N.; Hefny, H.A. Healthcare Predictive Analytics Using Machine Learning and Deep Learning Techniques: A Survey. J. Electr. Syst. Inf. Technol. 2023, 10, 40. [Google Scholar] [CrossRef]
  5. Sundararaman, A.; Valady Ramanathan, S.; Thati, R. Novel Approach to Predict Hospital Readmissions Using Feature Selection from Unstructured Data with Class Imbalance. Big Data Res. 2018, 13, 65–75. [Google Scholar] [CrossRef]
  6. Sharma, V.; Kulkarni, V.; Mcalister, F.; Eurich, D.; Keshwani, S.; Simpson, S.H.; Voaklander, D.; Samanani, S. Predicting 30-Day Readmissions in Patients With Heart Failure Using Administrative Data: A Machine Learning Approach. J. Card. Fail. 2022, 28, 710–722. [Google Scholar] [CrossRef]
  7. Zhang, X.; Yan, C.; Gao, C.; Malin, B.A.; Chen, Y. Predicting Missing Values in Medical Data Via XGBoost Regression. J. Healthc. Inform. Res. 2020, 4, 383–394. [Google Scholar] [CrossRef]
  8. Chen, Z.-Y.; Zhang, T.-H.; Zhang, R.; Zhu, Z.-M.; Yang, J.; Chen, P.-Y.; Ou, C.-Q.; Guo, Y. Extreme Gradient Boosting Model to Estimate PM2.5 Concentrations with Missing-Filled Satellite Data in China. Atmos. Environ. 2019, 202, 180–189. [Google Scholar] [CrossRef]
  9. Jing, L.; Ulloa Cerna, A.E.; Good, C.W.; Sauers, N.M.; Schneider, G.; Hartzel, D.N.; Leader, J.B.; Kirchner, H.L.; Hu, Y.; Riviello, D.M.; et al. A Machine Learning Approach to Management of Heart Failure Populations. JACC Heart Fail. 2020, 8, 578–587. [Google Scholar] [CrossRef]
  10. Luo, C.; Zhu, Y.; Zhu, Z.; Li, R.; Chen, G.; Wang, Z. A Machine Learning-Based Risk Stratification Tool for in-Hospital Mortality of Intensive Care Unit Patients with Heart Failure. J. Transl. Med. 2022, 20, 136. [Google Scholar] [CrossRef]
  11. Mallikharjuna Rao, K.; Saikrishna, G.; Supriya, K. Data Preprocessing Techniques: Emergence and Selection towards Machine Learning Models—A Practical Review Using HPA Dataset. Multimed. Tools Appl. 2023, 82, 37177–37196. [Google Scholar] [CrossRef]
  12. Zhang, Z.; Cao, L.; Chen, R.; Zhao, Y.; Lv, L.; Xu, Z.; Xu, P. Electronic Healthcare Records and External Outcome Data for Hospitalized Patients with Heart Failure. Sci. Data 2021, 8, 46. [Google Scholar] [CrossRef] [PubMed]
  13. Zhang, Z.; Cao, L.; Zhao, Y.; Xu, Z.; Chen, R.; Lv, L.; Xu, P. Hospitalized Patients with Heart Failure: Integrating Electronic Healthcare Records and External Outcome Data. PhysioNet 2020, 101, e215–e220. [Google Scholar] [CrossRef] [PubMed]
  14. Cismondi, F.; Fialho, A.S.; Vieira, S.M.; Reti, S.R.; Sousa, J.M.C.; Finkelstein, S.N. Missing Data in Medical Databases: Impute, Delete or Classify? Artif. Intell. Med. 2013, 58, 63–72. [Google Scholar] [CrossRef]
  15. Dahouda, M.K.; Joe, I. A Deep-Learned Embedding Technique for Categorical Features Encoding. IEEE Access 2021, 9, 114381–114391. [Google Scholar] [CrossRef]
  16. Dzierżak, R. Comparison of the influence of standardization and normalization of data on the effectiveness of spongy tissue texture classification. Inform. Autom. Pomiary W Gospod. I Ochr. Sr. 2019, 9, 66–69. [Google Scholar] [CrossRef]
  17. Milligan, G.W.; Cooper, M.C. A Study of Standardization of Variables in Cluster Analysis. J. Classif. 1988, 5, 181–204. [Google Scholar] [CrossRef]
  18. Ali, Z.H.; Burhan, A.M. Hybrid Machine Learning Approach for Construction Cost Estimation: An Evaluation of Extreme Gradient Boosting Model. Asian J. Civ. Eng. 2023, 24, 2427–2442. [Google Scholar] [CrossRef]
  19. Guo, R.; Zhao, Z.; Wang, T.; Liu, G.; Zhao, J.; Gao, D. Degradation State Recognition of Piston Pump Based on ICEEMDAN and XGBoost. Appl. Sci. 2020, 10, 6593. [Google Scholar] [CrossRef]
  20. Vujovic, Ž.Ð. Classification Model Evaluation Metrics. Int. J. Adv. Comput. Sci. Appl. 2021, 12, 599–606. [Google Scholar] [CrossRef]
  21. Sokolova, M.; Japkowicz, N.; Szpakowicz, S. Beyond Accuracy, F-Score and ROC: A Family of Discriminant Measures for Performance Evaluation. In AI 2006: Advances in Artificial Intelligence; Sattar, A., Kang, B., Eds.; Lecture Notes in Computer Science; Springer: Berlin/Heidelberg, Germany, 2006; Volume 4304, pp. 1015–1021. ISBN 978-3-540-49787-5. [Google Scholar]
  22. Tharwat, A. Classification Assessment Methods. Appl. Comput. Inform. 2021, 17, 168–192. [Google Scholar] [CrossRef]
  23. Berrar, D. Cross-Validation. In Encyclopedia of Bioinformatics and Computational Biology; Elsevier: Amsterdam, The Netherlands, 2019; pp. 542–545. ISBN 978-0-12-811432-2. [Google Scholar]
  24. Lasfar, R.; Tóth, G. The Difference of Model Robustness Assessment Using Cross-validation and Bootstrap Methods. J. Chemom. 2024, 38, e3530. [Google Scholar] [CrossRef]
  25. Zhang, Y.; Gao, Z.; Wittrup, E.; Gryak, J.; Najarian, K. Increasing Efficiency of SVMp+ for Handling Missing Values in Healthcare Prediction. PLoS Digit. Health 2023, 2, e0000281. [Google Scholar] [CrossRef] [PubMed]
  26. Chen, S.; Hu, W.; Yang, Y.; Cai, J.; Luo, Y.; Gong, L.; Li, Y.; Si, A.; Zhang, Y.; Liu, S.; et al. Predicting Six-Month Re-Admission Risk in Heart Failure Patients Using Multiple Machine Learning Methods: A Study Based on the Chinese Heart Failure Population Database. J. Clin. Med. 2023, 12, 870. [Google Scholar] [CrossRef] [PubMed]
  27. Psychogyios, K.; Ilias, L.; Ntanos, C.; Askounis, D. Missing Value Imputation Methods for Electronic Health Records. IEEE Access 2023, 11, 21562–21574. [Google Scholar] [CrossRef]
  28. Pereira, R.C.; Abreu, P.H.; Rodrigues, P.P. Partial Multiple Imputation with Variational Autoencoders: Tackling Not at Randomness in Healthcare Data. IEEE J. Biomed. Health Inform. 2022, 26, 4218–4227. [Google Scholar] [CrossRef]
Figure 1. XGBoost algorithm flowchart Z Zhang et al. [16].
Biomedinformatics 04 00118 g001
Figure 2. XGBoost-based model building flow diagram.
Biomedinformatics 04 00118 g002
Figure 3. The important points of an ROC curve.
Biomedinformatics 04 00118 g003
Figure 4. Cross-validation of each model: (A). Mean imputation; (B). MICE; (C). kNN-based imputation; (D). Random Forest-based imputation.
Biomedinformatics 04 00118 g004aBiomedinformatics 04 00118 g004b
Table 1. Model performance comparison.
Model 1AccuracyRecallPrecisionF1AUC
Default 10.5870.5120.3720.4320.60
Mean + Enc 2 + Std 3 0.5950.5250.3790.440.626
MICE + Enc 2 + Std 30.5920.5180.4320.4710.647
kNN + Enc 2 + Std 30.6140.5510.4440.4920.619
RF + Enc 2 + Std 30.5870.5110.4200.4610.625
1 Model without pre-processing; 2 Enc = Encoding; 3 Std = Standardization.
Table 2. Comparison to other related studies.
NoAuthorOverviewAlgorithmAUCF1Sensitivity
1Y. Zhang et al. [25]The study built an optimized SVM-based model, I2-SVMp+, to address missingness compared to various common imputation approaches.SVM0.5360.708
SVM + MeanImp0.5460.703
SVM + MultiImp0.5560.701
I2-SVMp+0.5960.714
2S. Chen et al. [26]The study implemented kNN imputation to address missing values and feature selection based on three different approaches: single- and multi-factor regression, LASSO, and Random Forest (RF) with various algorithms for building predictive models.LR0.634 0.324
CART0.594 0.486
XGBoost0.547 0.387
NB0.586 0.617
SVM0.562 0.189
RF0.575 0.293
3K. Psychogyios et al. [27]The study utilized various imputation techniques to address missingness and introduced an improved neighborhood aware autoencoder (I-NAA) and improved generative adversarial imputation networks (I-GAINs). They built predictive models using a simple random forest (RF) algorithm.RF + SimpleImp 0.4489
RF + kNN-Imp 0.4567
RF + MICE-Imp 0.4421
RF + MF-Imp 0.4553
RF + NAA 0.4632
RF + I-NAA 0.4799
RF + GAIN 0.4672
RF + I-GAIN 0.4755
4R. C. Pereira et al. [28]The study introduced the use of partial multiple imputation with a variational autoencoder (PMIVAE) and a denoising autoencoder (DAE) for missing values. They built predictive models using various algorithms.ANN + PMIVAE 0.539
kNN + kNN-Imp 0.481
RF + PMIVAE 0.534
SVM + DAE 0.538
5Our current studyThe study utilized various imputation techniques with coordinated encoding and standardization. We then built predictive models using XGBoost.XGBoost + MeanImp0.6260.43990.525
XGBoost + MICE0.6470.4550.545
XGBoost + kNN-Imp0.6190.4760.521
XGBoost + RF-Imp0.6240.4530.519
Disclaimer/Publisher’s Note: The statements, opinions and data contained in all publications are solely those of the individual author(s) and contributor(s) and not of MDPI and/or the editor(s). MDPI and/or the editor(s) disclaim responsibility for any injury to people or property resulting from any ideas, methods, instructions or products referred to in the content.

