Article

Drosophila Eye Gene Regulatory Network Inference Using BioGRNsemble: An Ensemble-of-Ensembles Machine Learning Approach

Department of Computer Science, Purdue University Fort Wayne, Fort Wayne, IN 46805, USA
*
Author to whom correspondence should be addressed.
BioMedInformatics 2024, 4(4), 2186-2200; https://doi.org/10.3390/biomedinformatics4040117
Submission received: 6 September 2024 / Revised: 21 October 2024 / Accepted: 23 October 2024 / Published: 29 October 2024
(This article belongs to the Section Applied Biomedical Data Science)

Abstract

Background: Gene regulatory networks (GRNs) are complex gene interactions essential for organismal development and stability, and they are crucial for understanding gene-disease links in drug development. Advances in bioinformatics, driven by genomic data and machine learning, have significantly expanded GRN research, enabling deeper insights into these interactions. Methods: This study proposes and demonstrates the potential of BioGRNsemble, a modular and flexible approach for inferring gene regulatory networks from RNA-Seq data. Integrating the GENIE3 and GRNBoost2 algorithms, the BioGRNsemble methodology focuses on providing trimmed-down sub-regulatory networks consisting of transcription and target genes. Results: The methodology was successfully tested on a Drosophila melanogaster Eye gene expression dataset. Our validation analysis using the TFLink online database yielded 3703 verified predicted gene links, out of 534,843 predictions. Conclusion: Although the BioGRNsemble approach presents a promising method for inferring smaller, focused regulatory networks, it encounters challenges related to algorithm sensitivity, prediction bias, validation difficulties, and the potential exclusion of broader regulatory interactions. Improving accuracy and comprehensiveness will require addressing these issues through hyperparameter fine-tuning, the development of alternative scoring mechanisms, and the incorporation of additional validation methods.

1. Introduction

Gene regulatory networks (GRNs) consist of thousands of genes interconnected with one another through transcriptional regulation. An organism’s body development, hormonal fluctuations, and stability are kept in order through such interactions. GRNs have been a source of intense research in the field of biology for years, serving as the key to understanding links between diseases and gene interactions for progress in drug development. With the age of computing bringing about an abundance of genomic data, the field of bioinformatics has pushed the boundaries of GRN research, primarily through the explosion of genomic data availability and machine learning technologies.
The Drosophila, commonly known as the fruit fly, is a remarkably well-studied species due to its low-cost maintenance, mass breeding ability, and a roughly 75% genetic resemblance to the human genome [1]. This similarity has inspired a significant amount of disease research by comparing the effects of gene interactions and mutations in the Drosophila with corresponding genetic interactions within humans. One such aspect of the human body being studied is the eye. Through GRN analysis of Drosophila optics, various genes implicated in human eye formation and eye diseases like Retinitis Pigmentosa can be better understood.
In recent years, artificial intelligence has become one of the most intensively studied areas in bioinformatics. Developments in information processing and computational power have allowed biologists to harness machine learning to study gene regulation easily and efficiently. Since their inception, classic mathematical learning algorithms have remained popular options for research till today, owing to their versatility and more resource-friendly properties. A support vector machine (SVM) model, called PILGRM, was developed by Kacsoh et al. (2017) [2] to predict genes associated with Drosophila’s memory using RNA-seq expression data. In a similar vein, Wang et al. (2019) [3] proposed the use of NetREX, a supervised prior-based algorithm that predicts gene regulatory networks based on its familiarity with previous networks of related organisms. GRADIS was another graph-based support vector machine developed by Razaghi-Moghdam and Nikoloski (2020) [4] to predict GRNs from expression data for the E. coli bacteria and S. cerevisiae fungi.
One of the primary inspirations for this research was Potier et al. (2014)’s [5] attempt to construct GRNs of the Drosophila eye. To unravel gene regulation within a tissue of the larval eye-antennal imaginal disc, it was observed that the tissue harbored different types of cells corresponding with the developmental stage of the larva. Throughout the experiment, 72 cell samples had their gene expression activity recorded and compiled into an RNA-seq dataset, which was utilized for this study. The experimentation yielded a list of more than 694 identified transcription factors and over 15,000 protein-coding genes, which were utilized for the construction of a complete regulatory network of the Drosophila Eye using the GENIE3 machine learning algorithm.
Despite the significant gene research on Drosophila species, studies involving Drosophila eye GRNs were found to be lacking. Apart from the contributions from Potier et al. [5], very little has been observed when it comes to utilizing classical machine learning algorithms for the inference of Drosophila eye regulatory networks. Moreover, deep learning models have come to dominate gene inference research, owing to generally more powerful inference capabilities compared to traditional machine learning algorithms. However, deep learning techniques also tend to be data-hungry and resource-intensive to train, proving inefficient for inferring smaller, focused regulatory networks.
In light of such research gaps, this study proposes BioGRNsemble: an ‘ensemble-of-ensembles’ machine learning methodology consisting of two supervised machine learning algorithms: GENIE3 and GRNBoost2. While much of computational GRN analysis involves heavy-scale deep learning that requires large amounts of multi-dimensional data, BioGRNsemble offers a lighter alternative for detecting smaller, narrowed-down sub-networks that are also scalable with additional machine learning algorithms. In this paper, the BioGRNsemble methodology will be tested on RNA-seq expression data of eye tissue from the Drosophila melanogaster’s eye.
The rest of the paper is organized as follows: Section 2 describes the tools, methods, and datasets used for training and validation. In Section 3, we discuss both the computational as well as the visualized results. Section 4 provides an analysis of the resultant GRNs, and we comment on some of the limitations of the proposed methodology in Section 5.

2. Materials and Methods

This section describes the main steps involved in the proposed BioGRNsemble methodology that uses an ensemble of machine learning algorithms. We will first discuss the dataset’s origins and features, along with its compilation and the steps taken for preprocessing. An overview of each machine learning algorithm will then be provided before concluding with the tools used to visualize the generated GRNs.

2.1. Dataset Information

2.1.1. RNA-Seq Dataset

Based on a methodology developed by Schena et al. (1995) [6], RNA-seq values represent the amount of ribonucleic acid (RNA) expressed as a result of transcription processes inside cells. The higher the number, the stronger the activity of the gene within the cell. As shown in Table 1, a typical RNA-seq dataset is structured as a gene expression matrix, with each cell type represented as a column, and rows being the RNA levels expressed by each gene across the cells.
For assessing the performance of the proposed GRN construction methodology, the Drosophila eye expression dataset, compiled by Potier et al. [5] through microarray experiments, served as the subject of focus. The dataset is a matrix consisting of 72 columns representing different cell types within a single Drosophila eye tissue and 15,344 rows, each containing a specific gene’s expression values across the 72 cells in RNA-seq format.

2.1.2. Dataset Exploration & Preprocessing

Dispersion graphs were used to visualize the distribution of the unnormalized gene expression dataset. As shown in Figure 1, the data was quite imbalanced before normalization, with points following a steep upward trend. Figure 2, on the other hand, shows that the highest and lowest gene expression values belonged to the wing and antennae development cells in the dataset, respectively.
In view of the wide expression range of the dataset values and the presence of noisy data, certain data-cleaning steps were taken to mitigate the prominence of certain features over others. Firstly, genes that were not expressed in any of the 72 cells were removed from the dataset. Secondly, a log transformation was applied for scaling the expression values based on (1), with ϵ being an epsilon parameter that is added to each data point at row i, column j of the gene expression matrix.
log   Data   i , j = log Data   i , j + ϵ

2.2. Machine Learning Algorithms

2.2.1. GENIE3

First developed by Huynh-Thu et al. [7], the GENIE3 algorithm rose to prominence when it outperformed its competitors in the DREAM4 and DREAM5 E. coli GRN prediction contests, establishing itself as a popular baseline for gene regulation analysis. Its easy interpretability, consistently good prediction performance, and time-efficient characteristics have anchored it as a relevant model even today. The model is essentially based on the random forest learning algorithm.
As shown in Figure 3, GENIE3 takes in a gene expression matrix as an input and outputs a list of the most likely transcription factor–target gene pairs, ranked by probability or a ‘correlation strength’. In each prediction cycle, one gene is seen as a ‘learning sample’. For the learning sample, multiple decision trees are generated to find the likeliest genes it may be in a regulatory relationship with, taking RNA expression values into account. A mathematical function is modeled to describe the relationship between the learning sample and other gene candidates, with each tree ensemble producing a set of weights for each gene to determine the final ranked list.

2.2.2. GRNBoost2

Based on a random forest regression algorithm akin to GENIE3, GRNBoost2 was developed by Moerman et al. (2018) [8] to outperform GENIE3 in performance and speed. Unlike its counterpart, GRNBoost2 is outfitted with an ‘early stopping’ feature that halts the prediction process in case of insufficient improvement in prediction performance. The majority of the prediction process is similar to that of GENIE3, except for the generation and addition of a decision tree every cycle, taking into consideration the mispredictions of previous decision trees to improve upon. As shown in Figure 4, each ‘weak learner’, or a decision tree in this scenario, is additively used in consideration of previous mispredictions performed by preceding trees. This decision tree ensemble, combined with a regulation value known as the ‘learning rate’, is used to gradually optimize the loss function. The learning rate hyperparameter of GRNBoost2 keeps the general prediction trend within a certain limit (also known as regularization) in an attempt to slowly improve the predictive performance of the model.

2.2.3. The BioGRNSemble

As depicted in Figure 5, the BioGRNSemble method uses an RNA-seq dataset as input to both GENIE3 and GRNBoost2 models. A list of known transcription factors is also fed separately into both models, which feature similar hyperparameter settings. Each model generates the output candidate transcription gene–target gene pairs along with an importance score that determines the likelihood of the interaction’s existence. The intersection of the resulting links from both models is then further filtered based on a minimum importance score threshold. This narrows down the results to links that have a high probability of existing according to the pipeline.
Furthermore, Cytoscape 3.10.1 [9], an open-source application, is utilized to create visualizations of the predicted gene regulatory networks. Cytoscape’s vast range of display modes and color customization options, along with its biology-oriented scope, makes it the best option for depicting gene regulatory networks. Within the software, the list of transcription factor genes was selected to be the ‘source’ from which arrows are directed to the ‘target’ genes to represent an instance of regulation.

3. Results

3.1. Tools and Libraries

In this study, all models were primarily implemented using the Python programming language in the Google Colab environment. We utilized several Python libraries for different purposes. Examples include the following:
  • Scikit-learn [10]: A machine learning library consisting of various supervised and unsupervised learning algorithms.
  • Pandas [11]: A library for Dataframe initialization and manipulation; utilized for reading the dataset.
  • Numpy [12]: A library for matrix manipulation.
  • Matplotlib [13] and Seaborn [14]: Libraries for data visualization.
  • Arboreto [8] and pySCENIC [15]: Bioinformatics-based libraries for GRN analysis.

3.2. Experimental Setup

  • The Potier et al. [5] RNA-seq dataset was used after data cleaning, noise-filtering, and bias reduction.
  • A list of 652 known transcription factors of the Drosophila was fed into GENIE3 and GRNBoost2 separately with similar hyperparameter settings.
  • The resulting intersection of common links was then filtered further based on a minimum importance score threshold of 0.25.
  • TFLink [16], an online database containing regulatory interactions between over 18,000 target genes and 527 transcription factor genes, was used to validate the GRN prediction accuracy. TFLink consists of genes present in organisms commonly used for research, among them being mice, E. coli, Homo sapiens, and Drosophila melanogaster.

3.3. Key Metrics

As part of the process of interpreting the results, several metrics were considered:
  • Number of estimators: Also known as the number of trees to be generated for predictions, this hyperparameter can quickly become computationally intensive as it is increased. Through trial and error, we set the number of estimators for both GRNBoost2 and GENIE3 to be 25 to balance time efficiency and prediction performance.
  • Correlation/Importance score: The probability or significance of a regulatory link’s existence between the transcription factor and target gene, represented by a float value between 0.0 and 1.0. For output by both GENIE3 and GRNBoost2, a higher correlation score indicates a ‘likelier’ regulatory link.
  • Average correlation/importance score: The value produced by averaging the correlation scores generated by GENIE3 and GRNBoost2. The BioGRNSemble pipeline utilizes this methodology to yield a pruned, smaller regulatory network for further analysis.
  • Minimum Correlation/Importance threshold: The minimum correlation score, a value between 0.0 and 1.0, was used filter out links deemed ‘weak’ by the machine learning algorithms. For example, a minimum correlation score of 0.25 considers links with correlation scores only above that value.

3.4. GRN Prediction Performance

Table 2 presents the number of gene regulatory relationships identified by GENIE3, GRNBoost2, and the proposed BioGRNsemble. There is a noticeable disparity in the number of links initially generated by GENIE3 and GRNBoost2, which, when averaged in BioGRNsemble, resulted in 534,843 common links containing about 3703 verified links that existed in the TFLink database (The full list is given in Supplementary Table S1). However, applying a minimum correlation score as a threshold to narrow down relevant links led to a faster reduction in the number of strongly correlated links within the GRNBoost2 network compared to GENIE3. This suggests that GRNBoost2 predicted a large number of disconnected, sparse gene-gene pairs. More interestingly, only 30 common links were predicted, with an average correlation score exceeding 50%.
A visualized representation of the initial GRN predictions for each approach is depicted in Figure 6. Each white dot represents a gene. Line lengths are based on the magnitude of the correlation/importance score. It can be observed that the BioGRNsemble approach yields a less dense, smaller set of regulatory networks as shown in (c).

3.5. Top Paired Genes

In this set of experiments, we closely investigated the top 10 regulation pairs predicted by each model.

3.5.1. GENIE3

Table 3 showcases the top 10 regulation pairs predicted by the GENIE3 with the highest correlation scores. According to the predicted results, GENIE3 considered the following transcription factors to be the most active regulators based on the number of target genes linked:
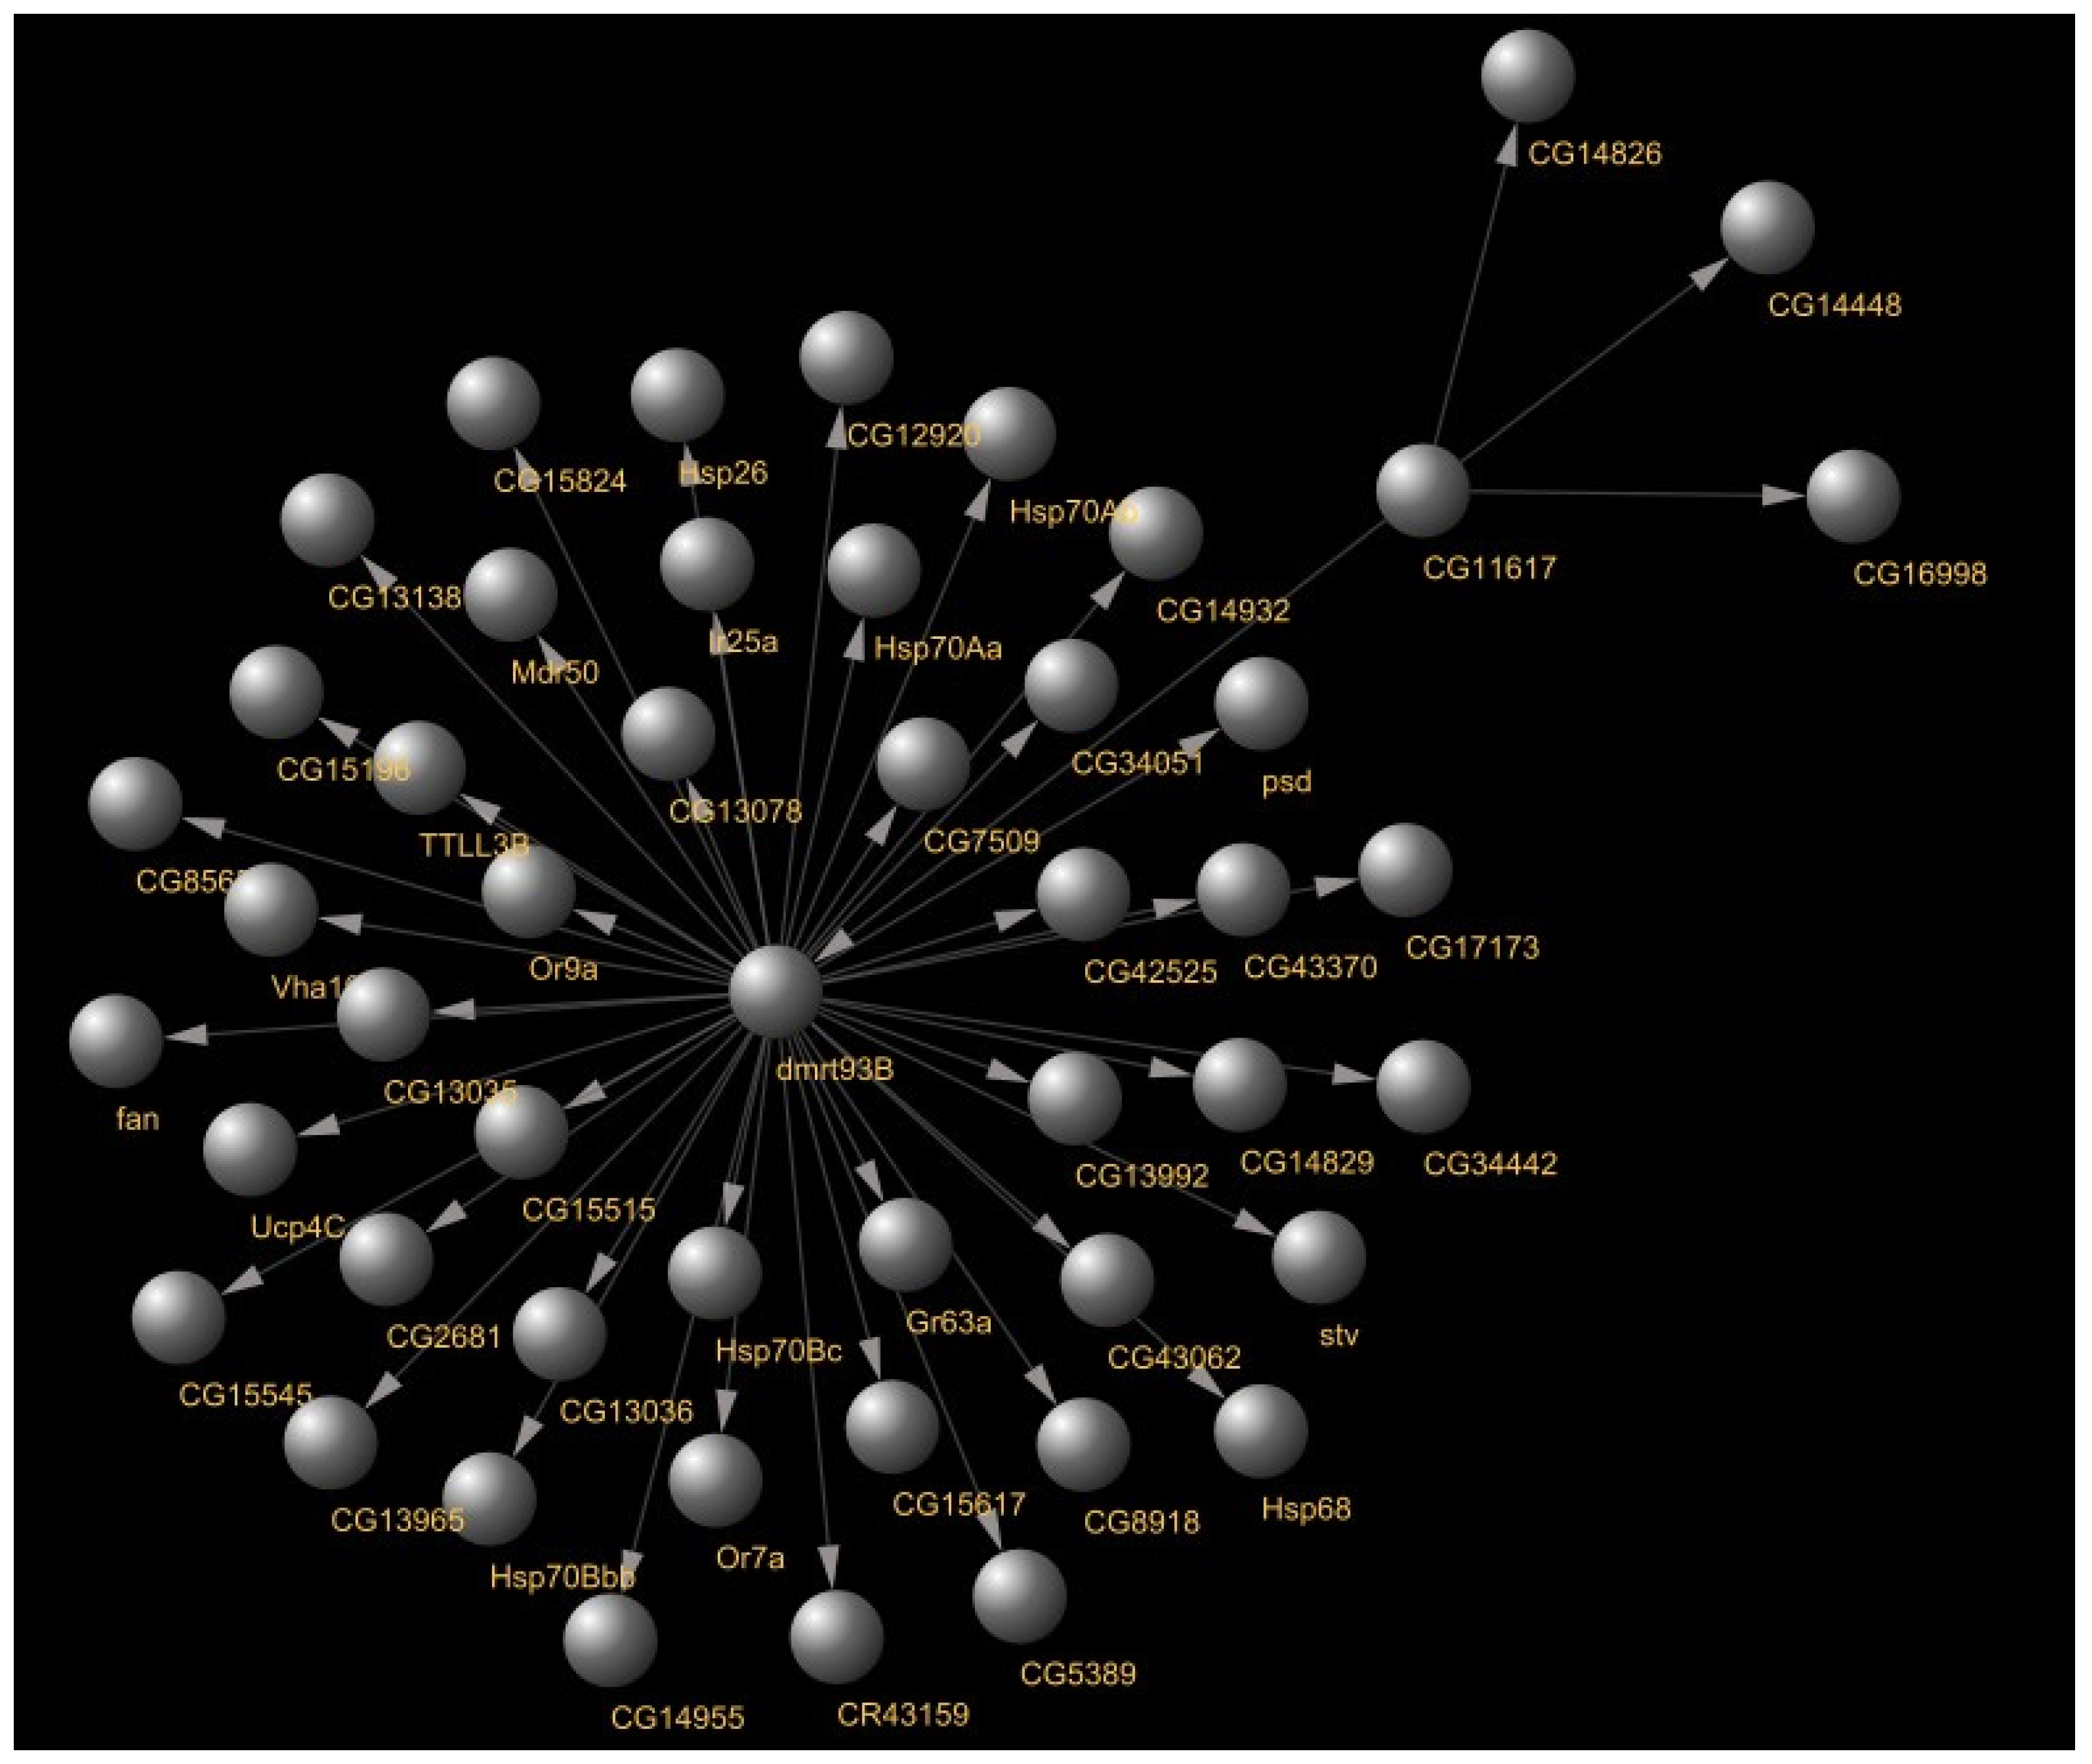
  • Dmrt93B: A transcription factor gene responsible for sex configuration of the Drosophila [17] expressed in the frontal ganglion region of the Drosophila brain. It was predicted to be regulated by CG11617, another transcription gene expressed in the larval muscle system, in wing cells, responsible for muscle development [18]. Figure 7 showcases dmrt93B regulatory gene links as predicted by GENIE3.
  • GATAe: A transcription factor gene involved in stem cell maintenance and is expressed in the endoderm region [19].
  • Fkh: A gene responsible for regulating DNA replication, insulin signals, and programmed cell death [20]. Figure 8 displays an interesting interaction between fkh and Poxm genes regulating one another, according to GENIE3’s predictions.
  • Shn: A transcription factor involved in gut development and wing imaginal disc structuring [21].
  • CG13510: A gene that regulates zinc ion binding. Usually present in the head region of adult Drosophila [22].

3.5.2. GRNBoost2

Table 4 displays the top links predicted by GRNBoost2. The resulting gene regulatory network was significantly different from that of GENIE3, with the majority of links being simplistic, one-to-one pairs. The most active transcription factors according to GRNBoost2, depicted in Figure 9, are as follows:
  • TFAM: A transcription factor involved in mitochondrial regulation. The variations within this gene are often implicated in diseases like Alzheimer’s and Parkinson’s disease [23].
  • CG2116: A transcription factor playing a role in dendrite formation [24].
  • CG10979: Usually expressed in gut and germline cells, plays a role in zinc production [25].

3.5.3. BioGRNSemble

In this experiment, we set the correlation score threshold at 0.5, meaning that any links with an average correlation score below 0.5 were excluded from the network generated by the BioGRNsemble methodology. Table 5 displays the top 10-ranked gene pairs identified by the BioGRNsemble pipeline, with GATAe and drmt93B emerging as the most connected transcription factor genes, although there were fewer predicted connections than those identified by GENIE3, as shown in Figure 10. In addition to the transcription factor genes mentioned in earlier subsections, a few others of interest include the following:
  • Srp [26]: Known as the “Serpent” gene, this transcription factor plays a role in nervous system maintenance and muscle formation.
  • Pho [27]: This gene is involved in maintaining embryonic genes necessary for organ growth.
  • Ato [28]: Commonly expressed in reproductive gamete cells, this transcription factor is essential for maintaining egg cell expression and growth.

4. Discussion

4.1. Regulatory Network Analysis

When compared against each other, GENIE3 and GRNBoost2 had notably produced differing regulatory networks in terms of density and correlation strength. A drastic gap existed in the number of generated links between GENIE3 and GRNBoost2; upon reducing the threshold to a score of 25% and above, it became apparent that this gap was a result of GRNBoost2 predicting millions of gene pair links with very low correlation scores. As the minimum threshold was raised gradually, a greater reduction was observed in the number of ‘strong’ links within the GRNBoost2 network compared to GENIE3, suggesting that the former had predicted an extremely sparse regulatory network with one-to-one gene pairs.
The BioGRNSemble pipeline, which involved the averaging of GENIE3 and GRNBoost2’s common predictions, resulted in a network more skewed towards GENIE3’s predictions due to its generally higher correlation scores. Due to the significant amount of trimming and narrowing down predictions with a score of at least 0.5, it was expected that the final network would be much smaller than the previous networks. This size difference can, however, prove to be a great boon in terms of convenience for those who want to zero in on specific subsets of large RNA-seq datasets.

4.2. TFLink Validation Analysis

In order to attain a better picture of the model performances, the TFLink online database was used as a suitable validation source based on its comprehensive compilation of transcription and target genes. Figure 11 depicts just how little of the BioGRNsemble predictions have been verified by TFLink, either leaving room for improvement or for discovering unfamiliar regulatory interactions through future research. The predictions obtained by each of the three approaches were compared against TFLink to observe the number of predictions that were verifiable.
In terms of pure quantity, it was GRNBoost2 that identified the highest number of verified links, as shown in Table 6, in part due to generating more than 4 million interactions. The BioGRNSemble approach seemed to produce the lowest number of verified links but had achieved the highest accuracy proportion because of a more narrowed number of total links. Overall, the accuracy of each model’s networks was too small, falling below 1%. Two key insights could be inferred from this observation: The algorithms involved in the BioGRNSemble pipeline need to be better fine-tuned to improve accuracy metrics, or that further research needs to be conducted to potentially discover new, unknown regulatory links. Our approach of trimming down gene links through commonalities between ensemble models can potentially make BioGRNsemble a suitable methodology for inferring smaller, more specific sub-networks.

4.3. Limitations

While we have successfully generated a few verifiable GRNs using our BioGRNSemble methodology, there are significant limitations that could be rectified in the future, either by us or by other aspiring researchers:
  • The GRNBoost2 algorithm is sensitive to hyperparameter settings and may need to be further tuned to provide consistent results and denser regulatory networks comparable to those of GENIE3.
  • Due to the drastic differences between GENIE3 and GRNBoost2 correlation scores, averaging may not be sufficient to prevent the skewing of scores towards either model’s output, as seen in the BioGRNsemble results being very similar to those of GENIE3. An alternative method can involve extracting the top n gene links with the highest scores from each model, merging them, and then performing an averaging for the rest of the common links to produce the final, intersected output.
  • Without a gold standard ground truth network, it can be labor-intensive to verify the accuracy of each predicted connection. Unfortunately, there is yet to be such a network for the Drosophila eye, and the closest we have is the network constructed by Potier et al. [5], which does not seem to be available publicly. While TFLink is extremely helpful for verification, additional literature may need to be studied to discover more transcription gene–target gene links that may or may not have been established.

5. Conclusions and Future Extension

By leveraging machine learning, we have developed an ensemble approach that combines the strengths of both GENIE3, known for its predictive performance and time efficiency, and GRNBoost2, which excels in rapid predictions and includes an ‘early stopping’ feature to prevent overfitting. The intersection of their predictions yields a more focused and potentially more accurate gene regulatory network. Our tool, BioGRNsemble, offers a lightweight alternative to resource-intensive deep learning models for inferring small-scale gene regulatory networks. By concentrating on smaller, more targeted sub-networks, BioGRNsemble is highly scalable, making it particularly useful for researchers studying specific subsets within large RNA-seq datasets. Additionally, we have integrated Cytoscape for visualization, providing an intuitive platform for interpreting the predicted networks.
On the other hand, the BioGRNsemble approach faces specific challenges related to algorithm sensitivity, prediction skewing, validation difficulties, and the potential exclusion of broader regulatory interactions. Addressing these issues can provide opportunities for future research to expand upon this work:
  • Exploring alternative scoring systems, fine-tuning hyperparameters, and employing more advanced data preprocessing techniques.
  • Integrating convolutional neural network-based deep learning models alongside GENIE3 and GRNBoost2.
  • Testing BioGRNsemble on additional species, such as mice, zebrafish, and E. coli.
  • Validating unknown gene regulatory links through established literature or wet lab experiments.
This study provides just a glimpse into the potential of combining bioinformatics and artificial intelligence. The field of gene networks is an uncharted territory, rich with discoveries waiting to be made. We hope this paper inspires others to develop novel machine learning methodologies for inferring regulatory networks.

Supplementary Materials

The following supporting information can be downloaded at: https://www.mdpi.com/article/10.3390/biomedinformatics4040117/s1, Table S1. Validated RegulatoryLinks.

Author Contributions

Conceptualization, A.J.M. and A.K.; methodology, A.J.M. and A.K.; software, A.J.M.; validation, A.J.M.; formal analysis, A.J.M.; investigation, A.J.M. and A.K.; resources, A.K. and A.J.M.; data curation, A.J.M.; writing—original draft preparation, A.J.M.; writing—review and editing, A.K.; visualization, A.J.M.; supervision, A.K.; project administration, A.K.; funding acquisition, A.K. All authors have read and agreed to the published version of the manuscript.

Funding

This research received no external funding.

Institutional Review Board Statement

Not applicable.

Informed Consent Statement

Not applicable.

Data Availability Statement

The raw gene expression dataset used can be found here: https://www.ncbi.nlm.nih.gov/geo/query/acc.cgi?acc=GSE59059 (accessed on 25 September 2024). The code is available on GitHub at: https://github.com/abbaddon1001/BioGRNSemble-GRN-Identification (accessed on 25 September 2024).

Acknowledgments

The authors would like to give thanks to the financial support provided by the Computer Science department at Purdue University Fort Wayne to cover the CoLab subscription. The authors would also like to thank Rebecca Palu for providing her expertise and knowledge in gene regulation.

Conflicts of Interest

The authors declare no conflicts of interest. The funders had no role in the design of the study; in the collection, analyses, or interpretation of data; in the writing of the manuscript; or in the decision to publish the results.

References

  1. Reiter, L.T.; Potocki, L.; Chien, S.; Gribskov, M.; Bier, E. A systematic analysis of human disease-associated gene sequences in Drosophila melanogaster. Genome Res. 2001, 11, 1114–1125. [Google Scholar] [CrossRef] [PubMed]
  2. Kacsoh, B.; Greene, C.S.; Bosco, G. Machine Learning Analysis Identifies Drosophila Grunge/Atrophin as an Important Learning and Memory Gene Required for Memory Retention and Social Learning. G3 2017, 7, 3705–3718. [Google Scholar] [CrossRef] [PubMed]
  3. Wang, Y.; Cho, D.-Y.; Lee, H.; Fear, J.; Oliver, B.; Przytycka, T.M. Reprogramming of regulatory network using expression uncovers sex-specific gene regulation in Drosophila. Nat. Commun. 2019, 9, 4061. [Google Scholar] [CrossRef] [PubMed]
  4. Razaghi-Moghadam, Z.; Nikoloski, Z. Supervised learning of gene-regulatory networks based on graph distance profiles of transcriptomics data. NPJ 2020, 6, 21. [Google Scholar] [CrossRef] [PubMed]
  5. Potier, D.; Davie, K.; Hulselmans, G.; Sanchez, M.N.; Haagen, L.; Huynh-Thu, V.A.; Koldere, D.; Celik, A.; Geurts, P.; Christiaens, V.; et al. Mapping Gene Regulatory Networks in Drosophila Eye Development by Large-Scale Transcriptome Perturbations and Motif Inference. Cell Rep. 2014, 9, 2290–2303. [Google Scholar] [CrossRef] [PubMed]
  6. Schena, M.; Shalon, D.; Davis, R.W.; Brown, P.O. Quantitative Monitoring of Gene Expression Patterns with a Complementary DNA Microarray. Science 1995, 270, 5235. [Google Scholar] [CrossRef] [PubMed]
  7. Huynh-Thu, V.A.; Irrthum, A.; Wehenkel, L.; Geurts, P. Inferring Regulatory Networks from Expression Data Using Tree-Based Methods. PLoS ONE 2010, 5, e12776. [Google Scholar] [CrossRef] [PubMed]
  8. Moerman, T.; Santos, S.A.; Gonzalez-Blas, C.B.; Simm, J.; Moreau, Y.; Aerts, J.; Aerts, S. GRNBoost2 and Arboreto: Efficient and scalable inference of gene regulatory networks. Bioinformatics 2019, 35, 2159–2161. [Google Scholar] [CrossRef] [PubMed]
  9. Cytoscape. Available online: https://cytoscape.org (accessed on 10 February 2024).
  10. Pedregosa, F.; Varoquaux, G.; Gramfort, A.; Michel, V.; Thirion, B.; Grisel, O.; Blondel, M.; Prettenhofer, P.; Weiss, R.; Dubourg, V.; et al. Scikit-learn: Machine Learning in Python. J. Mach. Learn. Res. 2011, 12, 2825–2830. [Google Scholar]
  11. McKinney, W. Data structures for statistical computing in Python. In Proceedings of the 9th Python in Science Conference, Austin, TX, USA, 28 June–3 July 2010; pp. 51–56. [Google Scholar] [CrossRef]
  12. Harris, C.R.; van der Walt, S.J.; Gommers, R.; Virtanen, P.; Cournapeau, D.; Wieser, E.; Taylor, J.; Berg, S.; Smith, N.J.; Kern, R.; et al. Array programming with NumPy. Nature 2020, 585, 357–362. [Google Scholar] [CrossRef] [PubMed]
  13. Hunter, J.D. Matplotlib: A 2D graphics environment. Comput. Sci. Eng. 2007, 9, 90–95. [Google Scholar] [CrossRef]
  14. Waskom, M.L. Seaborn: Statistical data visualization. J. Open Source Softw. 2021, 6, 3021. [Google Scholar] [CrossRef]
  15. Aibar, S.; Gonzalez-Blas, C.B.; Moerman, T.; Huynh-Thu, V.A.; Imrichova, H.; Hulselmans, G.; Rambow, F.; Marine, J.-C.; Geurts, P.; Aerts, J.; et al. SCENIC: Single-cell regulatory network inference and clustering. Nat. Methods 2017, 14, 1083–1086. [Google Scholar] [CrossRef] [PubMed]
  16. TFLink. Available online: https://tflink.net (accessed on 20 April 2024).
  17. Casado-Navarro, R.; Serrano-Saiz, E. DMRT Transcription Factors in the Control of Nervous System Sexual Differentiation. Front. Neuroanat. 2022, 16, 937596. [Google Scholar] [CrossRef] [PubMed]
  18. NIH. CG11617. Available online: https://www.ncbi.nlm.nih.gov/gene/33183 (accessed on 21 April 2024).
  19. NIH. GATAe [Drosophila Melanogaster]. Available online: https://www.ncbi.nlm.nih.gov/gene?Db=gene&Cmd=DetailsSearch&Term=41945 (accessed on 21 April 2024).
  20. NIH. Fkh Fork Head [Drosophila Melanogaster (Fruit Fly)]. Available online: https://www.ncbi.nlm.nih.gov/gene/43383 (accessed on 21 April 2024).
  21. FlyBase. Dmel\shn. Available online: https://flybase.org/reports/FBgn0003396.htm (accessed on 22 April 2024).
  22. Alliance of Genome Resources. CG13510 Gene. Available online: https://www.alliancegenome.org/gene/FB:FBgn0034758 (accessed on 22 April 2024).
  23. NCBI. TFAM. Available online: https://www.ncbi.nlm.nih.gov/gene/7019 (accessed on 22 April 2024).
  24. NCBI. CG2116. Available online: https://www.ncbi.nlm.nih.gov/gene/31735 (accessed on 23 April 2024).
  25. NCBI. CG10979. Available online: https://www.ncbi.nlm.nih.gov/gene/40720 (accessed on 23 April 2024).
  26. SDB. Serpent. Available online: https://www.sdbonline.org/sites/fly/gene/serpent.htm (accessed on 23 April 2024).
  27. UniProt. Pho_Drome. Available online: https://www.uniprot.org/uniprotkb/Q8ST83/entry (accessed on 23 April 2024).
  28. TAIR. AT5G06160. Available online: https://www.arabidopsis.org/servlets/TairObject?type=locus&name=At5g06160 (accessed on 23 April 2024).
Figure 1. Visual depiction of numerical data imbalance within the dataset. (a) shows the unnormalized trend of data, and (b) depicts a more stable and leveled trend after normalization.
Biomedinformatics 04 00117 g001
Figure 2. Scatter plots of gene expression activity within the most and least active cell types found in the dataset respectively. A brighter color is associated with a higher expression value, with a red line bounding the most expressed genes. (a) shows gene expression values within the eye anternnal cell, while (b) shows the expression data within the wing imaginal disc cell.
Biomedinformatics 04 00117 g002
Figure 3. The GENIE3 procedure for generating a ranked list of predicted gene regulatory network links from merging ranked candidate genes predicted by different learning samples (shown in different colors) [7].
Biomedinformatics 04 00117 g003
Figure 4. The GRNBoost2 model structure.
Biomedinformatics 04 00117 g004
Figure 5. The BioGRNSemble pipeline methodology. Two machine learning algorithms are used to generate their own predictions on an RNA-seq dataset, and in turn, their outputs undergo an intersection to extract a more targeted group of regulatory interactions consisting of predictions that are present in both models.
Biomedinformatics 04 00117 g005
Figure 6. A visual representation of the three networks generated by (a) GENE3, (b) GRNBoost2, and (c) BioGRNsemble.
Biomedinformatics 04 00117 g006
Figure 7. Predicted gene regulation links associated with the dmrt93B gene, represented as a circle roughly at the center.
Biomedinformatics 04 00117 g007
Figure 8. Predicted regulatory network associated with the fkh transcription factor gene, shown to be regulated by the Poxm gene.
Biomedinformatics 04 00117 g008
Figure 9. Three of the most active regulatory networks as predicted by GRNBoost2.
Biomedinformatics 04 00117 g009
Figure 10. The most actively connected transcription factor genes according to the BioGRNsemble approach, from left to right: dmrt93B, GATAe, and CG13510.
Biomedinformatics 04 00117 g010
Figure 11. The proportion of BioGRNsemble predictions that have been verified in the TFLink online database, ignoring correlation/importance scores.
Biomedinformatics 04 00117 g011
Table 1. An example of a gene expression matrix containing expression data in RNA-seq format. Each row is an array of a gene’s recorded expression level within each cell type.
GeneCell 1Cell 2Cell 3Cell 4
Gene 11.05.07.02.0
Gene 20.03.02.01.0
Gene 310.00.02.012.0
Gene 42.01.00.00.0
Table 2. Comparison of GRN prediction performance for each method using different threshold values.
AlgorithmMinimum
Threshold (0.0 to 1.0)
No. of LinksNo. of Transcription Factors
GENIE30.0579,908548
GENIE30.252141395
GENIE30.40494147
GENIE30.5021062
GENIE30.655721
GENIE30.75186
GRNBoost20.04,879,738548
GRNBoost20.259818465
GRNBoost20.40873267
GRNBoost20.50138103
GRNBoost20.6533
GRNBoost20.7511
BioGRNsemble0.0534,843131
BioGRNsemble0.503016
Table 3. The 10 highest-ranked regulatory links predicted by GENIE3 based on the correlation/importance score.
Transcription Factor GeneTarget GeneCorrelation Score
dmrt93BCG149320.85471
dmrt93BGr63a0.84326
dmrt93BCG149550.83637
dmrt93BHsp70Aa0.83425
dmrt93BHsp70Bc0.83026
GATAePH4alphaPV0.82495
fkhMRE230.82274
shnCG144710.81887
dmrt93BHsp70Bbb0.81283
CG13510CG135110.79432
Table 4. The 10 highest-ranked regulatory links predicted by GRNBoost2 based on the correlation/importance score.
Transcription Factor GeneTarget GeneCorrelation Score
TFAMExo700.833288
Tsf2CG96340.671760
Atf-2CG238150.663000
herCG8130.647054
CncCG150990.612437
emsHsp600.612328
CG1024Vir0.611803
CG12219Wdn0.610983
MBD-likeCG97970.600319
B-H2so0.598897
Table 5. The 10 highest-ranked regulatory links predicted by BioGRNSemble based on the correlation/importance score.
Transcription Factor GeneTarget GeneCorrelation Score
CG13510CG135110.672
Dmrt93BCG131380.658
SalmSalr0.641
Dmrt93BGr63a0.635
FkhMRE230.616
ShnCG144710.615
Dmrt93BCG149320.607
JraCG142070.604
SrpCG300460.593
Dmrt93BHsp70Aa0.593
Table 6. A comparison of the number of links verified in the TFLink database for each approach. Although BioGRNsemble had produced the lowest number of links due to a trimmed-down output, its more accurate, small-scale results can be beneficial for focusing on more specific sub-networks.
Model/ApproachNo. of
Validated Links
Total Predicted LinksNo. of
Transcription Factors
% of Prediction Dataset
GENIE33846579,9081320.66%
GRNBoost228,9574,879,7382110.59%
BioGRNsemble3703534,8431310.69%
Disclaimer/Publisher’s Note: The statements, opinions and data contained in all publications are solely those of the individual author(s) and contributor(s) and not of MDPI and/or the editor(s). MDPI and/or the editor(s) disclaim responsibility for any injury to people or property resulting from any ideas, methods, instructions or products referred to in the content.

