Article

Bioinformatics-Based Identification of Human B-Cell Receptor (BCR) Stimulation-Associated Genes and Putative Promoters

by
Ethan Deitcher
1,2,
Kirk Trisler
2,
Branden S. Moriarity
2,3,
Caleb J. Bostwick
4,
Fleur A. D. Leenen
5 and
Steven R. Deitcher
2,*
1
The Nueva School, San Mateo, CA 94403, USA
2
Bespoke Biotherapeutics, San Mateo, CA 94402, USA
3
Department of Pediatrics, The University of Minnesota–Twin Cities, Minneapolis, MN 55455, USA
4
BISC Global, San Francisco, CA 94080, USA
5
Voredos SRL, 1367 Ramillies, Belgium
*
Author to whom correspondence should be addressed.
BioMedInformatics 2024, 4(2), 1384-1395; https://doi.org/10.3390/biomedinformatics4020076
Submission received: 5 April 2024 / Revised: 7 May 2024 / Accepted: 14 May 2024 / Published: 20 May 2024
(This article belongs to the Section Applied Biomedical Data Science)

Abstract

:
Genome engineered B-cells are being developed for chronic, systemic in vivo protein replacement therapies and for localized, tumor cell-actuated anticancer therapeutics. For continuous systemic engineered protein production, expression may be driven by constitutively active promoters. For actuated payload delivery, B-cell conditional expression could be based on transgene alternate splicing or heterologous promotors activated after engineered B-cell receptor (BCR) stimulation. This study used a bioinformatics-based approach to identify putative BCR-stimulated gene promoters. Gene expression data at four timepoints (60, 90, 210, and 390 min) following in vitro BCR stimulation using an anti-IgM antibody in B-cells from six healthy donors were analyzed using R (4.2.2). Differentially upregulated genes were stringently defined as those with adjusted p-value < 0.01 and a log2FoldChange > 1.5. The most upregulated and statistically significant genes were further analyzed to find those with the lowest unstimulated B-cell expression. Of the 46 significantly upregulated genes at 390 min post-BCR stimulation, 6 had average unstimulated expression below the median unstimulated expression at 390 min for all 54,675 gene probes. This bioinformatics-based identification of 6 relatively quiescent genes at baseline that are upregulated by BCR-stimulation (“on-switch”) provides a set of promising promotors for inclusion in future transgene designs and engineered B-cell therapeutics development.

1. Introduction

Genome editing technologies have played a critical role in the discovery and ongoing development of advanced immune cell therapies including chimeric antigen receptor (CAR) T cells, CAR natural killer (NK) cells, and, most recently, genome engineered B-cell therapeutics [1]. Genomic modifications that may be involved in the design and function of these cellular immune-therapies include: (i) engineering of antigen-specific receptors such as synthetic CARs and transgenic B-cell receptors (BCR); (ii) revision or utilization of intracellular signaling pathways and promotors that modulate cellular proliferation, activation, and endogenous gene expression; and (iii) introduction of heterologous transgene cargo that imparts new function(s) to the immune cells such as expression and secretion of novel protein payload(s). Due to their native sensing of cognate antigen via BCR and copious soluble immunoglobulin (Ig) protein production capability, B-cells are particularly attractive and suitable for genomic modification categories (i) and (iii) above [2]. Such engineered B-cells could serve as long-lived in vivo protein replacement factories or actuatable cancer therapeutics.
While naïve B-cells can be activated by T follicular helper cell (Tfh) co-stimulation via the ubiquitous tumor necrosis factor receptor superfamily member 5 (TNFRSF5; CD40), and Toll-like receptor 9 (TLR9) engagement with unmethylated CpG-motif containing single stranded DNA, only activation via BCR stimulation by a unique cognate antigen promotes antigen presenting cell (APC) functions and production of soluble Ig against the cognate antigen, itself [2,3,4,5,6,7,8,9]. Introduction of an exogenous, transgenic BCR designed to recognize a specific cancer-associated or virus-associated antigen could serve as a means to localize and concentrate cytotoxic anticancer or neutralizing antiviral antibody production and limit any potential systemic toxicity, respectively.
For the most part, engineered B-cell therapeutics are anticipated to be designed and built as a means for the chronic and constitutive replacement of deficient enzymes or cofactors in persons with select inherited lysosomal storage diseases or blood coagulation factor deficiencies. For these product candidates, B-cells are expected to be first engineered to express and secrete a specific protein payload and then differentiated in ex vivo culture into plasmablasts prior to any patient injection [10,11]. Such engineered plasma cells are envisioned to function as long-lasting “living drug factories” that, like native plasma cells, mostly lack BCR and primarily reside in bone marrow. When clinically and commercially available, such terminally differentiated engineered B-cells, in the form of engineered plasma cells, would require cell product re-dosing if there were a need or desire to ever increase (i.e., boost) or restore declining engineered payload production.
For more innovative uses, such as the treatment of solid tumor cancers, prophylaxis against infectious diseases, and “boostable” chronic protein replacement therapy, B-cells may be engineered to have a common exogenous BCR that is specific to a particular disease-associated or readily-available injectable cognate antigen. In response to exogenous BCR stimulation by cognate antigen, the B-cells express and secrete an exogenous therapeutic protein payload [12,13]. These engineered B-cell therapeutics will utilize their exogenous BCR as an “on-switch” that actuates (i.e., induces) the production of payload. Such actuation has been accomplished using spatiotemporal conditional expression transgenes based on alternate splicing and polyadenylation of a single pre-mRNA that support exogenous BCR (i.e., membrane-anchored Ig protein) expression in resting B-cells and, subsequently, soluble Ig production after BCR stimulation by cognate antigen [12]. The potential for an expression system utilizing differential splicing to experience premature termination of translation at cryptic stop codons and attendant nonsense-mediated decay warrants exploration for alternative conditional expression approaches [12].
As an alternative to spatiotemporal conditional expression based on alternate splicing, we were interested in identifying native B-cell gene promoters that are activated by BCR stimulation. Ideally, we sought gene promoters for genes that are minimally expressed in resting B-cells and markedly up-regulated following BCR stimulation as a potentially more direct strategy for cognate antigen (e.g., tumor-associated antigen)-triggered B-cell payload expression. The primary objective of this study was to identify genes, and associated gene promoters, that are significantly up-regulated following healthy human BCR stimulation and whose baseline expression is as low as possible in resting B-cells. Any such putative gene promoters would be candidates for further evaluation.

2. Materials and Methods

The microarray data used in this study is from the National Center for Biotechnology Information (NCBI) Gene Expression Omnibus (GEO) database (Accession number GSE39411) [14]. B-cell samples from six adult donors were stimulated in vitro with a cross-linked goat F(ab’)2 anti-human IgM, activating the B-cell receptor (BCR). Gene expression profiling was performed at four time points (60, 90, 210, and 390 min) following BCR stimulation using Affymetrix GeneChip Human Genome U133 Plus 2.0 microarrays. Gene expression was evaluated in stimulated and unstimulated B-cells at each time point. B-cells were negatively selected from fresh blood samples using the Rosettesep B-cell enrichment cocktail (StemCell Technologies, Vancouver, BC, Canada) and isolated by Ficoll-Paque PLUS density gradient centrifugation (Pharmacia, Uppsala, Sweden). Cells were serum starved for 4 h at 37 °C and 5% CO2 in RPMI 1640 media supplemented with 2 nM L-glutamine and 24 μg/mL gentamicin, as previously described [15].
We performed quality control checks and normalization of the dataset utilizing the Robust Multichip Average (RMA) pre-processing methodology from the oligo (version 1.63.1) package (Bioconductor/R v4.2.2) [16]. This strategy allowed background subtraction to remove local artifacts and noise, quantile normalization to ensure that the expression distributions of each sample are similar across the entire experiment, and summarization (via the median-polish algorithm) to combine probe intensities across arrays. To assess the inter-sample relation and detect potential outliers when comparing their (pairwise) gene expression patterns, we constructed a multidimensional scaling (MDS) plot and a Pearson correlation heatmap with a standard range from 0 to 1.
The microarray probes (n = 54,675) were annotated using the affycoretools (version 1.70.0) package (Bioconductor/R) function: annotateEset [17]. This method also tests for validity automatically (e.g., that annotation data match up correctly with the expression data). We used the ChipDb object: hgu133plus2.db (Bioconductor/R) based on the University of California Santa Cruz Genome Bioinformatics Homo sapiens hg38 genome build from February 2021 as our annotation dataset.
We compared differential gene expression in stimulated versus unstimulated B-cells at each of the four time points (60, 90, 210, and 390 min). We used the package limma (Bioconductor/R) that utilizes linear models to analyze microarray experiments [18]. For statistical analysis and assessing differential gene expression, limma uses an empirical Bayes method to moderate the standard errors of the estimated log-fold changes. This results in more stable inference and improved power, especially for experiments with small numbers of arrays. Differentially expressed genes were defined as those with an adjusted p-value less than 0.01 and a log2FoldChange less than or greater than 1.5. The Benjamini & Hochberg adjustment method was used to control the false discovery rate, the expected proportion of false discoveries amongst the rejected hypotheses [19]. Volcano plots were generated to display the results of the differential gene expression analyses.

3. Results

3.1. Gene Expression Analyses Revealed Several BCR Stimulation-Associated Upregulated Genes

A Pearson correlation heatmap is a graphical tool that displays the correlation between multiple variables as a color-coded matrix. Each variable is represented by a row and a column, and the cells show the correlation between them. In this study, the matrix was constructed to evaluate for inter-sample correlation prior to generating differential gene expression (i.e., Volcano) plots. The Pearson correlation heatmap in Figure 1 illustrates higher correlation between the samples colored red and relatively lower correlation between the samples colored blue. Overall, the data demonstrate that study sample gene expression correlation appears to be high with Pearson correlation coefficients ranging between 0.92 and 1 for all comparisons. The samples associated with the lowest observed, but still highly significant, correlation coefficients with other samples were from donor #2 stimulated B-cells at 60 min post-stimulation and donor #3 stimulated B-cells at 210 min post-stimulation.
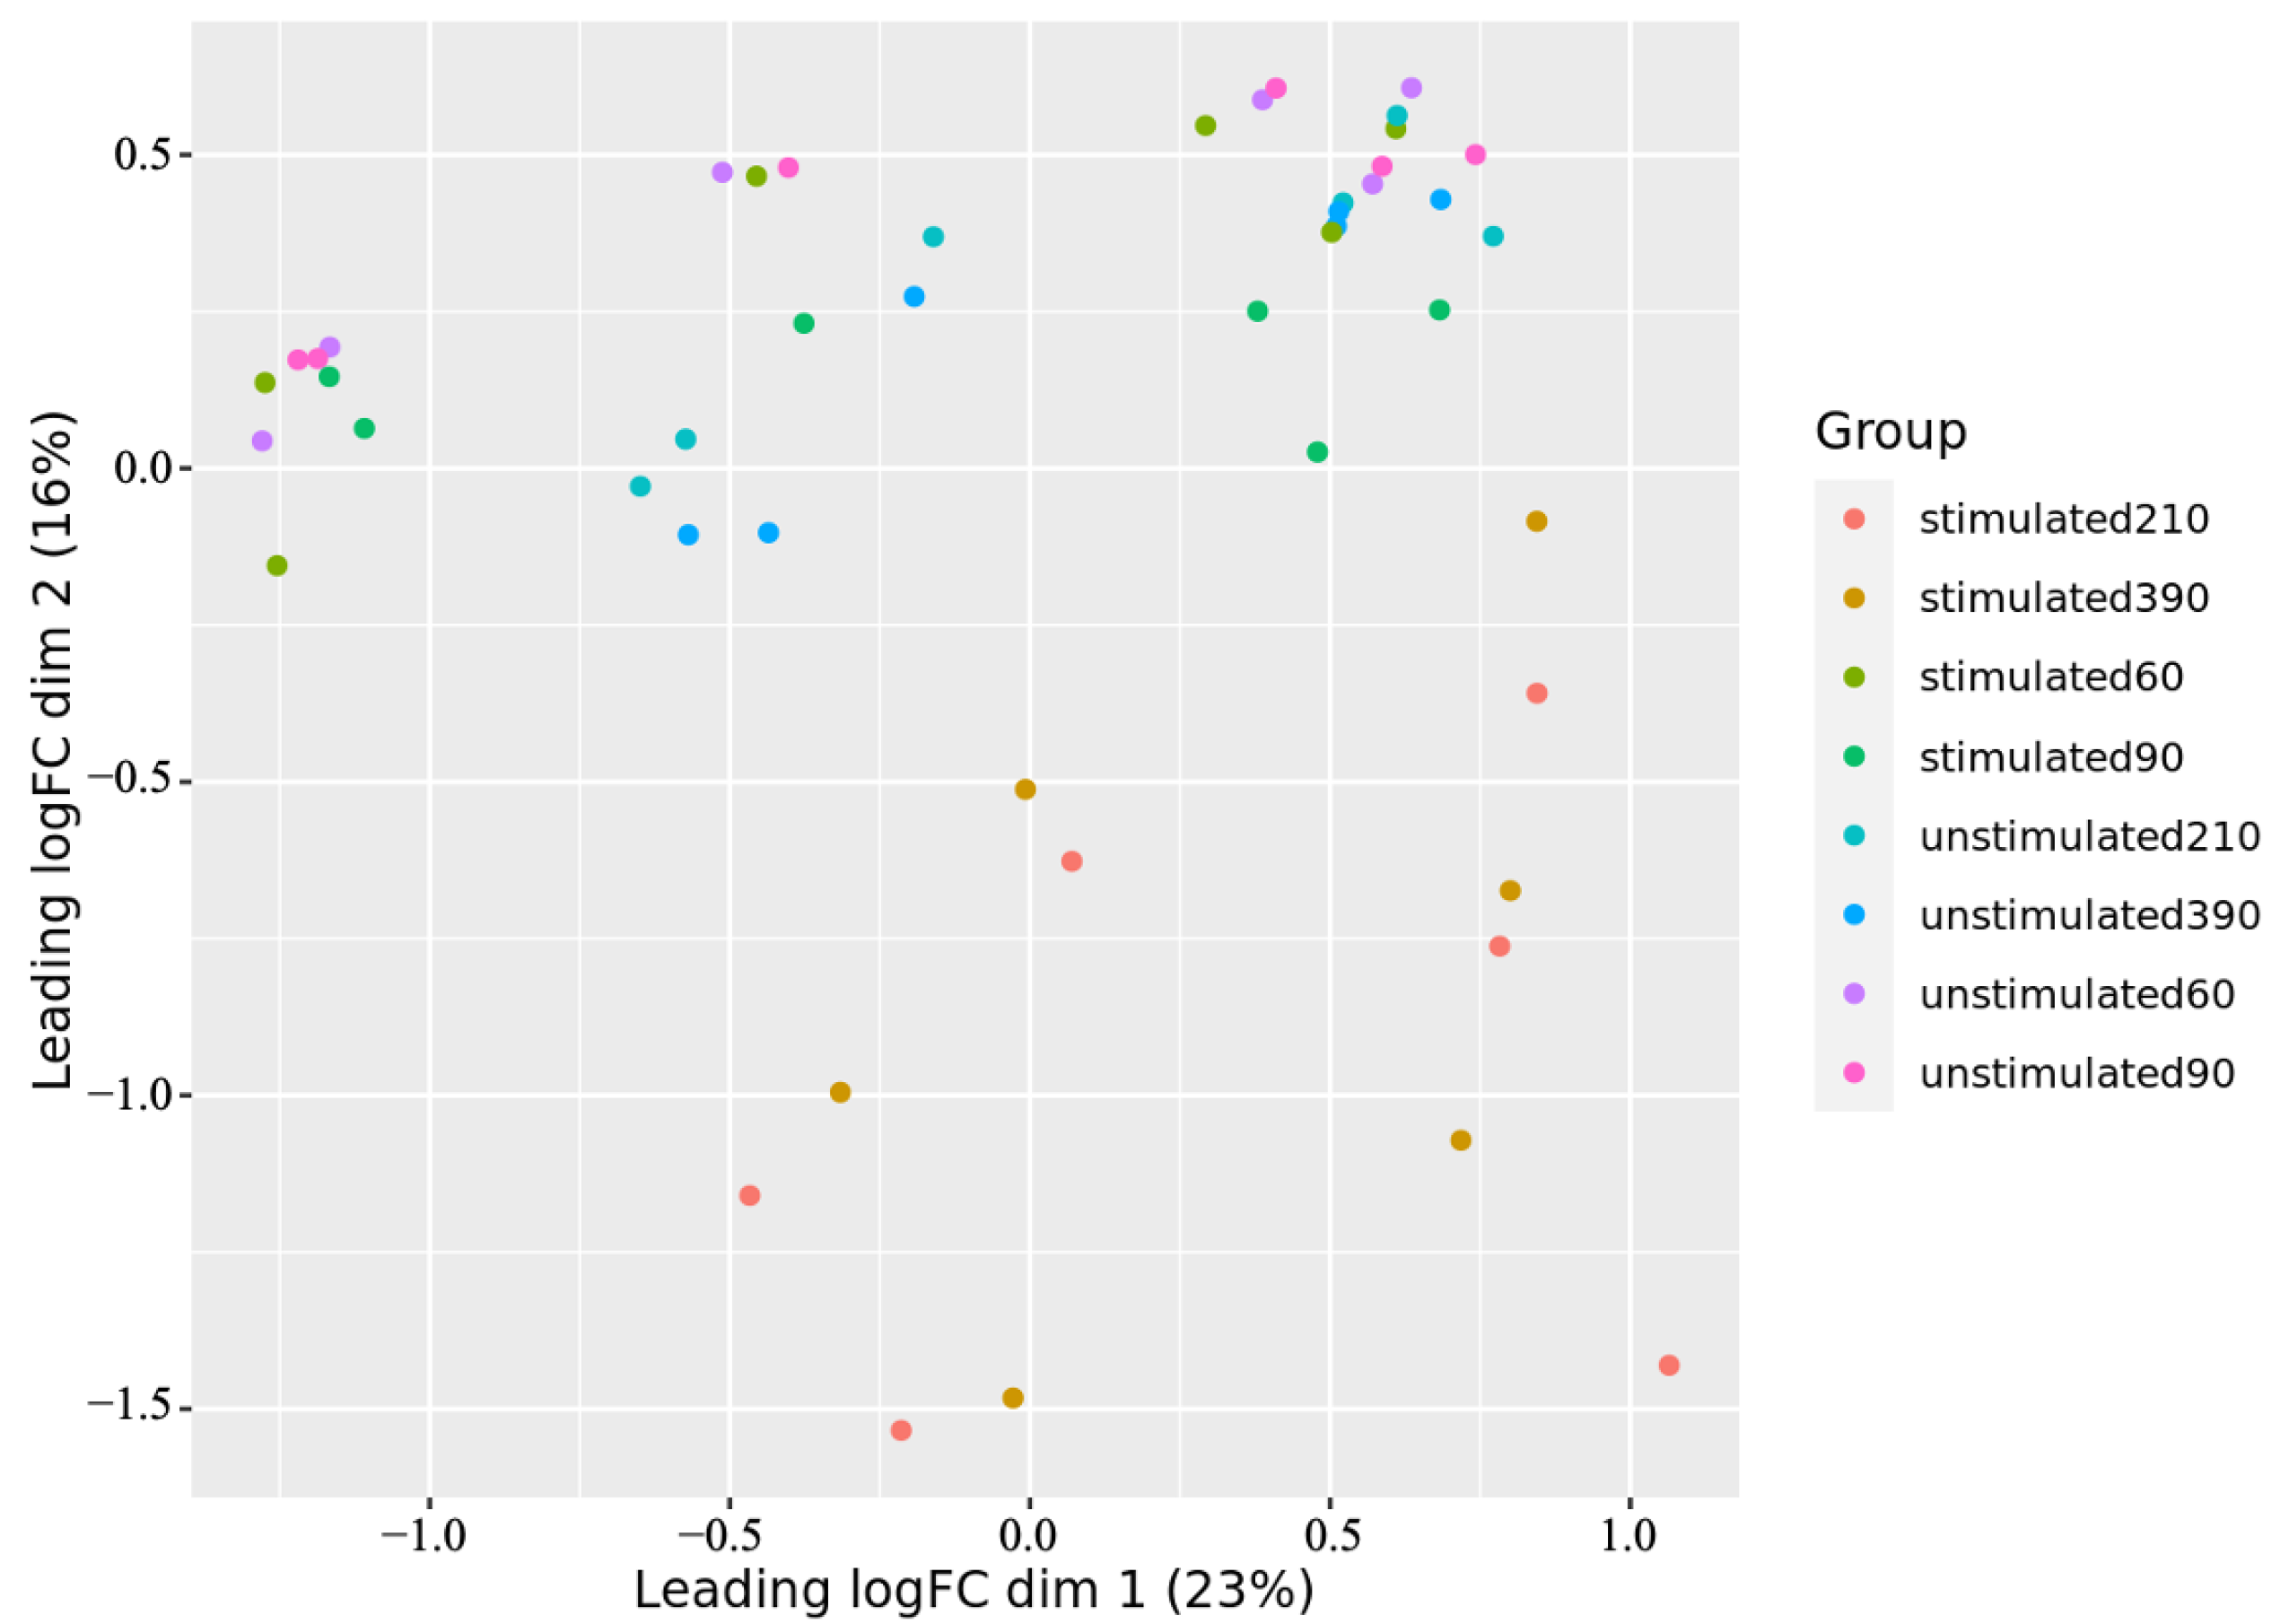
Similar to principal component analysis (PCA) plots, classical MDS plots visually display the relationships between sample expression profiles. MDS is a means of visualizing the level of similarity of individual cases of a dataset. It attempts to model similarity or dissimilarity of data points by distances in a geometric space. Samples that are grouped closer together are more similar. The MDS plot in Figure 2 did not reveal any outliers.
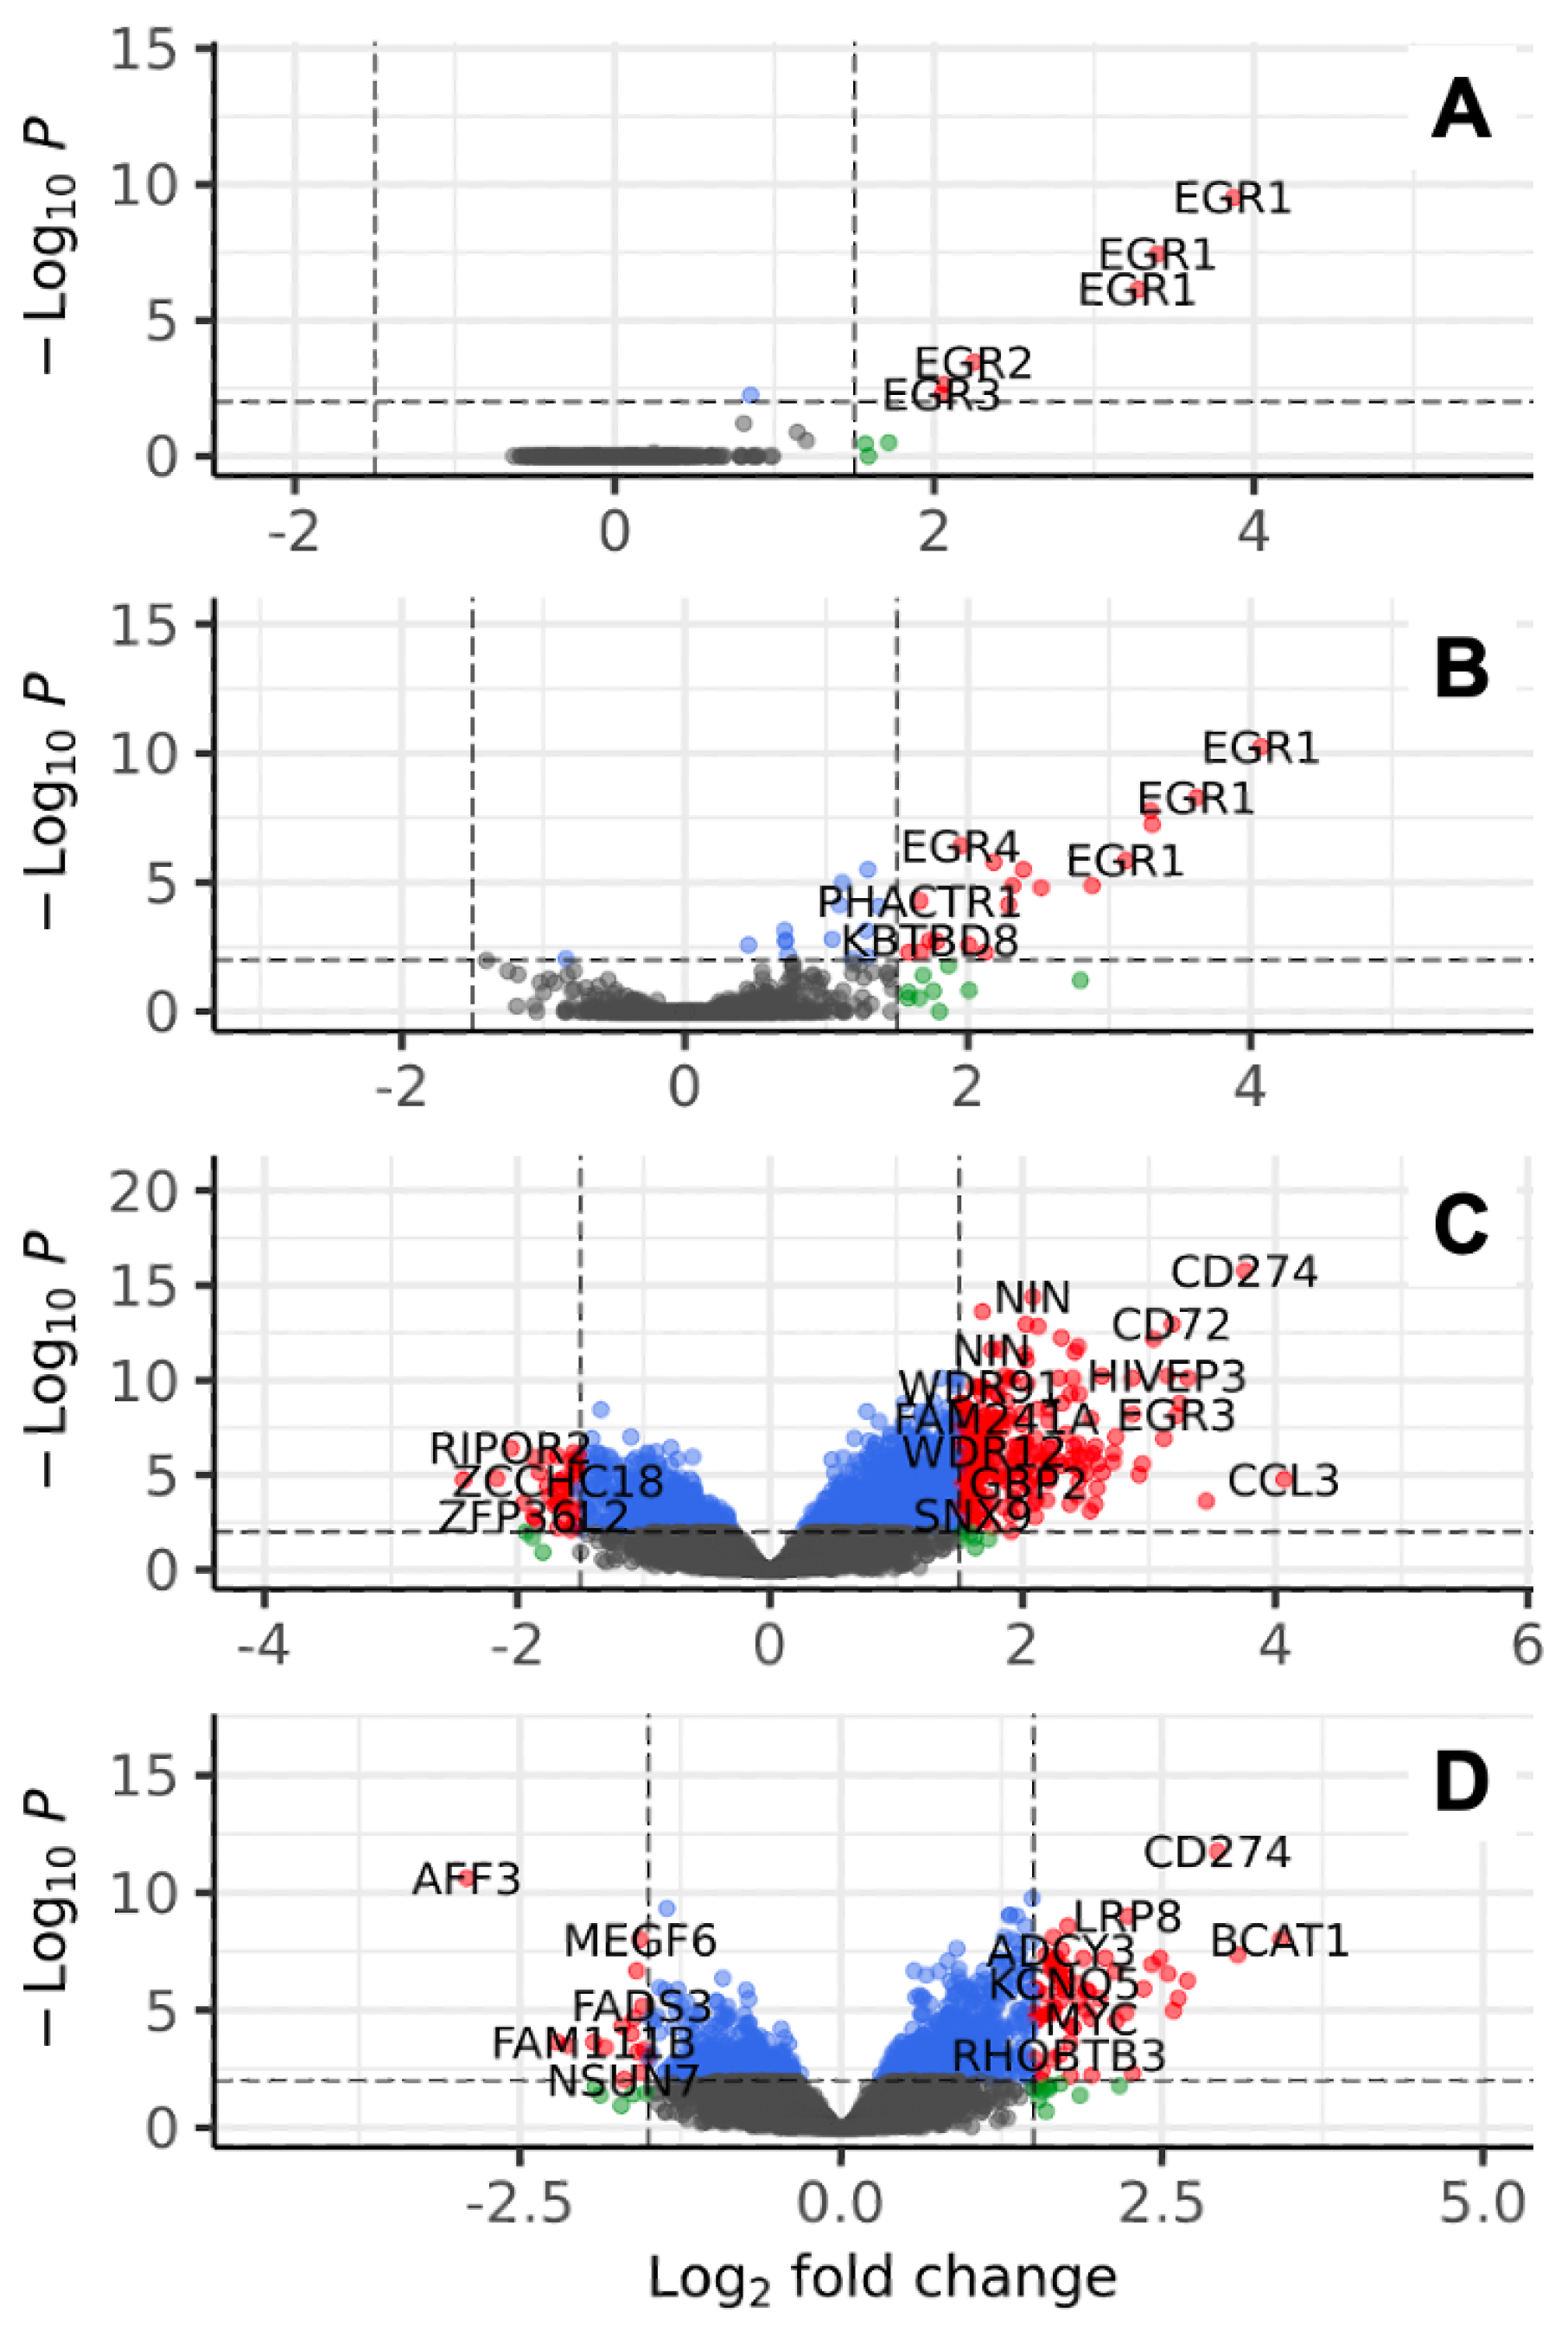
Volcano plots are a type of scatterplot that displays statistical significance (adjusted p-value) versus magnitude of change (log2FoldChanges). They enable rapid visual identification of genes with large Fold Changes that are also statistically significant. In volcano plots, the most highly upregulated genes are located towards the right side of the plot, the most downregulated genes are found towards the left side of the plot, and the most statistically significant genes are located towards the top. We generated volcano plots for this study showing the adjusted p-values and log2FoldChanges when comparing stimulated versus unstimulated donor B-cells at the 60, 90, 210, and 390-min time points.
Volcano plots for the 60, 90, 210, and 390-min time points are presented in Figure 3A–D. In each panel (A–D), gene expression for stimulated B-cells at a particular time point following BCR stimulation are compared to unstimulated B-cells at the same time point, with unstimulated B-cells as the reference. The plots indicate the stimulated B-cell genes that are up/down-regulated compared to unstimulated B-cells at a particular time point. Each plot includes 44,662 variables. The log2FoldChange thresholds of ≥1.5 and ≤−1.5 identify genes whose expression has increased or decreased by a factor of 2.83 or more, respectively. For this study, we concentrated on genes in the upper right sector, representing significant (adjusted p-value < 0.01) fold change increases in gene expression greater than or equal to 2.83-fold (red dots) (Supplemental Data). At the 60-min time point (Figure 3A), there were 4 upregulated unique genes of interest. At the 90-min time point (Figure 3B), there were 16 total upregulated unique genes of interest, including the 4 identified at the 60-min time point. At the 210-min time point (Figure 3C), there were 155 total upregulated unique genes of interest, including the 4 identified at the 60-min time point and 14 identified at the 90-min time point. At the 390-min time point (Figure 3D), there were 46 total upregulated unique genes of interest, including 1 (i.e., Myc) identified at the 90-min time point and 34 identified at the 210-min time point. Genes whose up-regulated expression dissipated prior to the 390-min time point were not analyzed further due to our focus on genes with persistent, significant above threshold expression. These data demonstrate that there were 46 total and 34 persistently and significantly upregulated genes of interest at the 390-min time point post-BCR stimulation that deserve further analysis.

3.2. Identification of Putative Gene Promoters for BCR Stimulation-Induced Payload Production

To function most effectively as an “on-switch” for engineered payload production, engineered BCR stimulation should activate promoters that are relatively quiescent prior to BCR stimulation. To identify such genes and their promotors, the 46 total upregulated genes of interest at the 390-min time point were further analyzed to identify those with particularly low levels of unstimulated, baseline expression. We were not interested in genes that were highly active at baseline and modestly upregulated after BCR stimulation. Expression was calculated based on the average expression at 390 min from multiple probes for a single gene. The 46 upregulated genes of interest were plotted with log2FC (y-axis) versus average baseline expression (x-axis) (Figure 4). Six genes had unstimulated expression at 390 min well below the median unstimulated expression at 390 min for all 54,675 probes measured. The median unstimulated expression was used for reference and not as an absolute criteria for gene of interest selection.
The 6 identified genes of interest are BCAR3 adaptor protein (BCAR3), branched chain amino acid transaminase 1 (BCAT1), human immunodeficiency virus type 1 enhancer-binding protein 3 (HIVEP3), LDL receptor related protein 8 (LRP8), neuropilin and tolloid-like 1 (NETO1), and potassium voltage-gated channel subfamily Q member 5 (KCNQ5). These genes are described in greater detail, including their primary distribution in peripheral blood mononuclear cells (PBMC), in Table 1.
Qualitative reference-based single-cell analysis using the Human PBMC Reference Explorer from Azimuth (National Institutes of Health [NIH] Human Biomolecular Atlas Project [HuBMAP] Consortium) was used to identify in which PBMC the 6 genes of interest are primarily expressed [20,21]. BCAR3 and NETO1 are primarily expressed in B-cells. BCAT1 is expressed primarily in B-cells and monocytes. KCNQ5 is expressed in B-cells and T cells. HIVEP3 and LRP8 are expressed in most PBMC subtypes. These data demonstrate that there are multiple candidate promotors for further analysis in engineered B-cell therapeutics.

4. Discussion

High throughput tools such as gene expression profiling enable scientists to examine specific changes in gene expression of B-cells after surface receptor stimulation. These B-cell surface receptors may be ubiquitous, such as CD40 and TLR9, or unique to an individual or small group of B-cells such as native (i.e., endogenous) BCR. It is this BCR individuality amongst a healthy person’s approximately 10 billion B-cells that contributes to broad immunologic diversity [2]. Several B-cell gene expression datasets and analyses are described in the literature and readily available from public repositories (Table 2). The datasets from Helmholtz Zentrum München, CRO Aviano [22], Strasbourg University Hospital [23], and Radboud University [24] did evaluate B-cell gene expression following BCR stimulation, but focused on virally-immortalized cell lines, chronic lymphocytic leukemia, or Burkitt lymphoma cells instead of healthy B-cells. The studies from investigators at the Dana-Farber Cancer Institute did evaluate healthy B-cells, but only after stimulation of CD40 [6]. The Singapore Immunology Network generated data from B-cells co-stimulated via BCR and TLR-9 [25]. Only the dataset used for this study (GSE39411) involved B-cells specifically from healthy humans, without a B-cell malignancy, stimulated exclusively via their BCR [6,15,23,24,26]. Readily available datasets amenable to combination with GSE39411, in order to enhance the robustness of our analysis, are lacking.
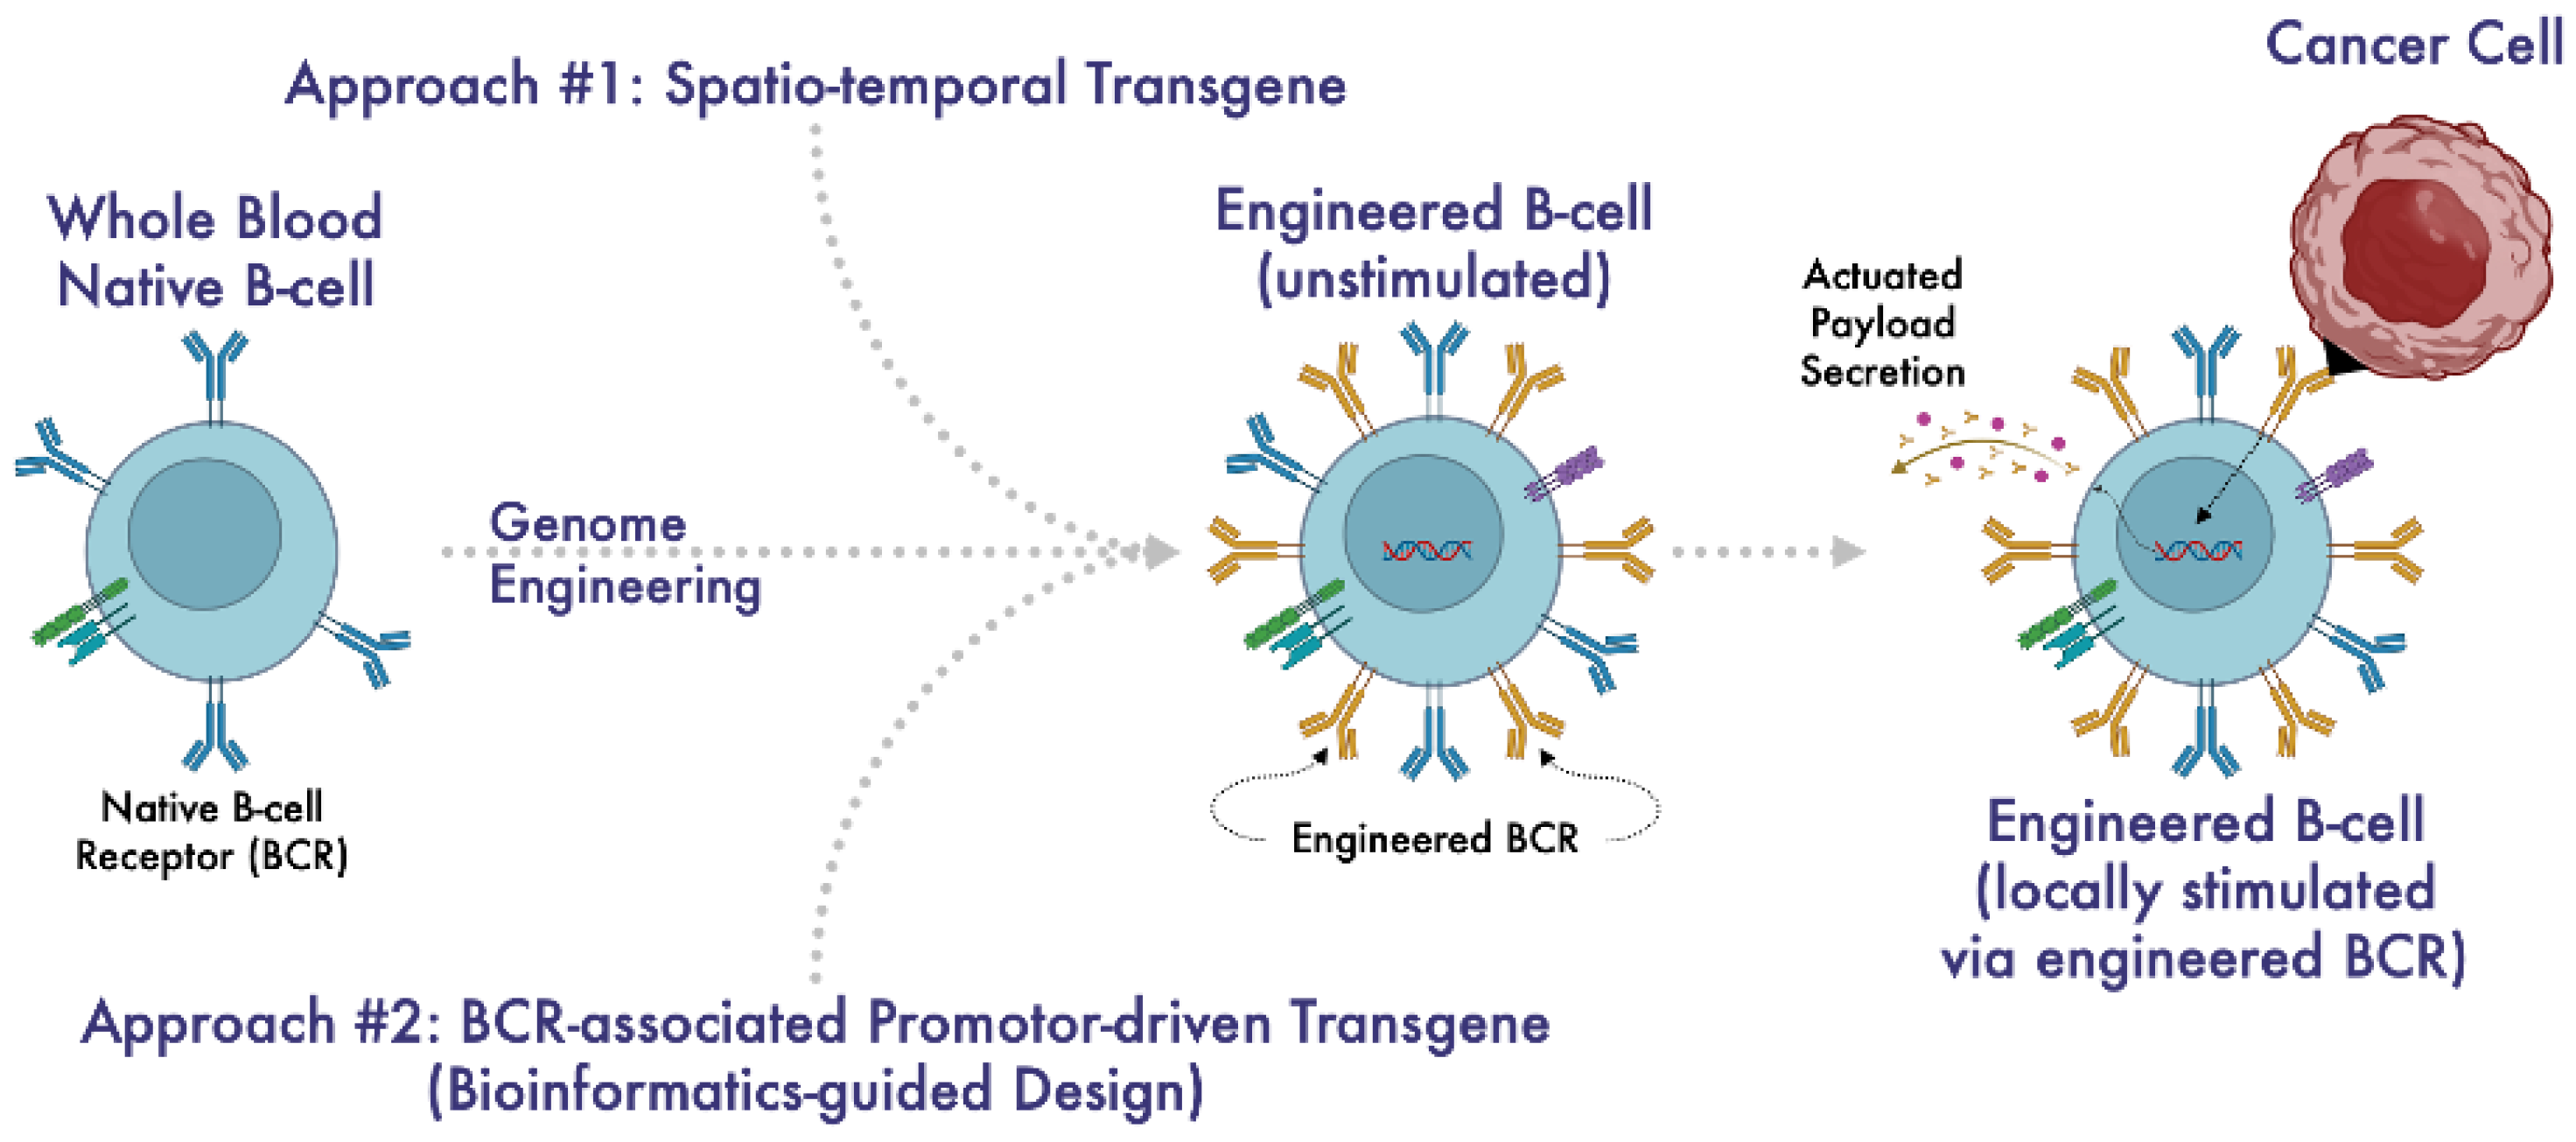
Genome engineered B-cell therapeutics may involve the isolation of several million blood-derived B-cells, presumably each with different endogenous BCR and cognate antigens, followed by engineering into an army of cells with a common, additional, engineered, exogenous BCR, plus the capacity to express and secrete engineered protein payload(s). The common, engineered, exogenous BCR may be designed to recognize a common, specific cognate antigen of a user’s choice, such as a tumor-specific or tumor-associated antigen. These exogenous BCR, upon stimulation by the cognate antigen, are intended to trigger the downstream expression and secretion of soluble engineered payload such as cancer-targeted antibodies, immunomodulatory cytokines, enzymes, or protein cofactors (Figure 5). Linking the BCR “on-switches” with soluble payload production may be facilitated by incorporation of a gene promoter that is relatively quiescent in resting, engineered B-cells and highly active specifically following BCR stimulation.
A brief look at the overall complexity of BCR signaling highlights some of the challenges to creating gene promoter-mediated BCR “on-switches” that trigger downstream engineered soluble payload expression and secretion [2,27,28,29,30,31,32,33,34]. Both endogenous and exogenous BCR are composed of membrane Ig molecules and associated transmembrane Igα/Igβ (CD79a/CD79b) heterodimers [2,30,32,33]. The membrane Ig subunits bind cognate antigen, resulting in receptor aggregation, while the Igα/Igβ subunits transduce signals to the B-cell cytoplasm. BCR aggregation activates the Src family kinases Lyn, Blk, and Fyn as well as the Syk and Btk tyrosine kinases [30,32,33]. This initiates the formation of a large supramolecular protein complex (i.e., signalosome) composed of the BCR, the previously mentioned tyrosine kinases, adaptor proteins such as BLNK, and signaling enzymes such as PLCγ2, PI3K, and Vav [28,30,33]. Signals emanating from this signalosome activate multiple signaling cascades that involve kinases, GTPases, and transcription factors. This may result in changes in B-cell metabolism, cytoskeletal structure, and gene expression. The complexity of BCR signaling allows for several disparate outcomes, including B-cell survival, apoptosis, proliferation, and differentiation into plasma cells or memory B-cells [29,31,34]. The outcome of BCR response is determined by the B-cell maturation state, the nature of the cognate antigen, the strength of the BCR signaling, and signals from other receptors such as CD40 and BAFF-R [29,31,34]. Other transmembrane proteins and receptors, including CD19, CD22, PIR-B, and CD32, can modulate specific elements of BCR signaling [32,33]. The magnitude and duration of BCR signaling are limited by negative feedback loops including those involving the Lyn/CD22/SHP-1 pathway, the Cbp/Csk pathway, SHIP, Cbl, Dok-1, Dok-3, FcγRIIB1, PIR-B, and internalization of the BCR [27,28,29,30,31,32,33,34]. Internalization of BCR and cognate antigen complexes leads to antigen digestion into fragments that subsequently can be displayed on the B-cell surface in complex with major histocompatibility complex (MHC) class I or II as a means of antigen presentation to T cells [2]. The exact sequence of molecular connections between the BCR and genes of interest identified in this study is not known.
This current study successfully identified at least 6 genes, and associated gene promotors, in normal human donor B-cells that had relatively low baseline expression levels and significantly increased expression at 390 min post-BCR stimulation. Four of these 6 (BCAR3, BCAT1, HIVEP3, and NETO1) genes also had significantly increased expression at 210 min post-BCR stimulation. None of the 6 genes had increased expression detected at 60 min and 90 min post-BCR stimulation. This delayed response may reflect either protein (e.g., transcription factor) synthesis-dependent induction of downstream response genes or a delayed primary response due to delayed transcription initiation [35]. Unfortunately, expression profile data beyond 390 min does not seem to have been collected and were not uploaded to NCBI GEO.
The promoters for these 6 genes may be able to be isolated and serve as BCR-induced transducers for engineered protein payload (i.e., effector molecule) production. Transcription factor binding sites in the gene promoters from these genes, based on QIAGEN (www.qiagen.com) provided samples and assay technologies, are available from GeneCards®—The Human Gene Database (www.genecards.org accessed on 22 April 2024). Top transcription factor binding sites for the 6 gene promotors are reported as follows:
BCAR3: AREB6, CBF-A, CBF-B, CBF-C, CP1A, HNF-3beta, Ik-2, NF-Y, and STAT5A.
BCAT1: AML1a, FOXO1, FOXO1a, and IRF-7A.
HIVEP3: AP-1, AREB6, ATF-2, c-Jun, c-Myc, Hlf, Max, Max1, Sox5, and SREBP-1b.
KCNQ5: AhR, aMEF-2, Arnt, c-Myb, Cart-1, MEF-2, NF-κB, NF-κB1, and RelA.
LRP8: RORalpha1, USF1, and USF2.
NETO1: AML1a, CP2, FOXJ2, and Nkx2-5.
Only BCAT1 and NETO1 share a top transcription factor binding site, namely AML1a.
We believe that B-cell receptor stimulation most likely signals downstream production of transcription factors that bind to gene promoters and regulate target gene expression. However, epigenetic mechanisms of gene expression regulation must be considered. Epigenetic gene expression control mechanisms, involving alterations in chromosomes rather than DNA sequence, include DNA base methylation, histone post-translational modification, chromatin superstructure remodeling, and noncoding ribonucleic acid (ncRNA) [36,37,38,39]. DNA methylation involves the enzymatic modification of DNA, such that a methyl group is transferred to the fifth carbon of the cytosine to generate 5-methylcytosine [38]. DNA demethylation is achieved by enzymatic demethylation or passive replication-dependent dilution of methylation [38]. While high levels of DNA methylation in the promoter region of genes are associated with transcriptional silencing, DNA demethylation intermediates in promoter regions are associated with activation of gene expression [39]. Negatively charged DNA, in 146-147 base pair lengths, is packaged around a positively charged histone protein octamer to form the nucleosome basic unit of chromatin [38]. Histone modifications can cause a structurally loose and open euchromatin conformation that facilitates transcription factor and enzyme access to DNA, resulting in increased transcriptional activity [39]. NcRNAs are functional RNA molecules without protein-coding ability [38]. NcRNAs interact with nuclear proteins like histone-remodeling complexes or DNA methyltransferases to regulate gene expression [38]. Other genetic and non-genetic factors, including diet, tobacco use, exercise, and aging, can interact with epigenetic mechanisms and jointly affect gene expression. In the event that promoters from our 6 genes of interest are found to not be activated by BCR stimulation, we will need to consider these alternative mechanisms of gene expression induction.
Page and colleagues recently reported that the NR4A1 gene, which is primarily expressed in monocytes, is also induced in B-cells by BCR stimulation [40]. In the current study, NR4A1 was significantly upregulated at the 90-min and 210-min timepoints, but without persistence at the 390-min timepoint. Based on multiple gene probes, the average log2FC in expression of NR4A1 at 390 min was only 0.1876 with p-values > 0.01. Therefore, based on our analysis, the NR4A1 promoter does not support sustained NR4A1 upregulation past 210 min. Interstudy methodological differences may have contributed to the observed differences in gene expression profiles. Our study and that performed by Page et al. do differ in their B-cell isolation and handling methodologies. The gene expression data analyzed here was generated from B-cells isolated using negative selection and that were serum starved for 4 h in culture media prior to BCR stimulation for 20 min. Page et al. studied B-cells isolated by positive selection with anti-CD19-conjugated magnetic beads and cultured in fetal calf serum-containing media prior to anti-human IgM BCR stimulation for 1 to 24 h. These differences highlight the potential impact of experimental conditions on gene expression profiling. We believe that the B-cell gene expression data used for our analysis was less confounded by the possible effects of unwanted CD19 stimulation and fetal calf serum on B-cell expansion, differentiation, and gene expression.

5. Conclusions

We identified 6, and possibly more, gene promoters that may link BCR stimulation by cognate antigen with delayed downstream gene expression. Of the 6 identified genes and associated promoters, NETO1 and BCAR3 are of particular interest because of their low-level, normal expression almost exclusively in B-cells. The NETO1 and BCAR3 promoters are strong candidates for the future spatiotemporal conditional expression of transgenes without the need for differential splicing. We hope that this synthetic immunobiology approach can be used for future genome engineered B-cell therapeutic product candidate design and building.

Supplementary Materials

The following supporting information can be downloaded at https://www.mdpi.com/article/10.3390/biomedinformatics4020076/s1, Table S1: Significantly (Adjusted p < 0.01) Upregulated (Log2FoldChange) Human B-cell Genes Following B-cell Receptor (BCR) Stimulation.

Author Contributions

Authors contributed in the following ways: Conceptualization, E.D., K.T., B.S.M. and S.R.D.; methodology, E.D., C.J.B., F.A.D.L. and S.R.D.; formal analysis, E.D., C.J.B., F.A.D.L. and S.R.D.; data curation, S.R.D.; writing—original draft preparation, E.D. and S.R.D.; writing—review and editing, K.T., B.S.M., C.J.B., F.A.D.L. and S.R.D.; and supervision, S.R.D. All authors have read and agreed to the published version of the manuscript.

Funding

This research was sponsored by Bespoke Biotherapeutics LLC.

Data Availability Statement

Gene expression data supporting the reported results can be found at the United States National Institutes of Health, National Library of Medicine, National Center for Biotechnology Information, Gene Expression Omnibus, Accession Display found at https://www.ncbi.nlm.nih.gov/geo/query/acc.cgi?acc=GSE39411 (accessed on 1 December 2022).

Acknowledgments

B.S.M. is supported by the following NIH grants (R01AI146009, R01AI161017, P01CA254849, P50CA136393, U24OD026641, U54CA232561, P30CA077598, U54CA268069), and received support from Children’s Cancer Research Fund, the Fanconi Anemia Research Fund, and the Randy Shaver Cancer Research and Community Fund.

Conflicts of Interest

Trisler, Moriarity, and Deitcher are founders and equity holders in Bespoke Biotherapeutics.

References

  1. Irvine, D.J.; Maus, M.V.; Mooney, D.J.; Wong, W.W. The future of engineered immune cell therapies. Science 2022, 378, 853–858. [Google Scholar] [CrossRef] [PubMed]
  2. Cyster, J.G.; Allen, C.D.C. B cell responses—Cell interaction dynamics and decisions. Cell 2019, 177, 524–540. [Google Scholar] [CrossRef] [PubMed]
  3. Banchereau, J.; Bazan, F.; Blanchard, D.; Briè, F.; Galizzi, J.P.; Van Kooten, C.; Liu, Y.J.; Rousset, F.; Saeland, S. The CD40 antigen and its ligand. Ann. Rev. Immunol. 1994, 12, 881–922. [Google Scholar] [CrossRef]
  4. Pullen, S.S.; Dang, T.T.; Crute, J.J.; Kehry, M.R. CD40 signaling through tumor necrosis factor receptor-associated factors (TRAFs). Binding site specificity and activation of downstream pathways by distinct TRAFs. J. Biol. Chem. 1999, 274, 14246–14254. [Google Scholar] [CrossRef] [PubMed]
  5. Ranheim, E.A.; Kipps, T.J. Activated Tcells induce expression of B7/BB1 on normal or leukemic B cells through a CD40-dependent signal. J. Exp. Med. 1993, 177, 925–935. [Google Scholar] [CrossRef]
  6. Gricks, C.S.; Zahrieh, D.; Zauls, A.J.; Gorgun, G.; Drandi, D.; Mauerer, K.; Neuberg, D.; Gribben, J.G. Differential regulation of gene expression following CD40 activation of leukemic compared to healthy B cells. Blood 2004, 104, 4002–4009. [Google Scholar] [CrossRef]
  7. Ruprecht, C.R.; Lanzavecchia, A. Toll-like receptor stimulation as a third signal required for activation of human naive B cells. Eur. J. Immunol. 2006, 36, 810–816. [Google Scholar] [CrossRef]
  8. Capolunghi, F.; Cascioli, S.; Giorda, E.; Rosado, M.M.; Plebani, A.; Auriti, C.; Seganti, G.; Zuntini, R.; Ferrari, S.; Cagliuso, M.; et al. CpG drives human transitional B cells to terminal differentiation and production of natural antibodies. J. Immunol. 2008, 180, 800–808. [Google Scholar] [CrossRef] [PubMed]
  9. Aranburu, A.; Ceccarelli, S.; Giorda, E.; Lasorella, R.; Ballatore, G.; Carsetti, R. TLR ligation triggers somatic hypermutation in transitional B cells inducing the generation of IgM memory B cells. J. Immunol. 2010, 185, 7293–7301. [Google Scholar] [CrossRef]
  10. Hung, K.L.; Meitlis, I.; Hale, M.; Chen, C.Y.; Singh, S.; Jackson, S.W.; Miao, C.H.; Khan, I.F.; Rawlings, D.J.; James, R.G. Engineering protein-secreting plasma cells by homology-directed repair in primary human B cells. Mol. Ther. 2018, 26, 456–467. [Google Scholar] [CrossRef]
  11. Moffett, H.F.; Harms, C.K.; Fitzpatrick, K.S.; Tooley, M.R.; Boonyaratanakornkit, J.; Taylor, J.J. B cells engineered to express pathogen-specific antibodies protect against infection. Sci. Immunol. 2019, 4, eaax0644. [Google Scholar] [CrossRef] [PubMed]
  12. Fusil, F.; Calattini, S.; Amirache, F.; Mancip, J.; Costa, C.; Robbins, J.B.; Douam, F.; Lavillette, D.; Law, M.; Defrance, T.; et al. A lentiviral vector allowing physiologically regulated membrane-anchored and secreted antibody expression depending on B-cell maturation status. Mol. Ther. 2015, 23, 1734–1747. [Google Scholar] [CrossRef]
  13. Huang, D.; Tran, J.T.; Olson, A.; Vollbrecht, T.; Tenuta, M.; Guryleva, M.V.; Fuller, R.P.; Schiffner, T.; Abadejos, J.R.; Couvrette, L.; et al. Vaccine elicitation of HIV broadly neutralizing antibodies from engineered B cells. Nat. Commun. 2020, 11, 5850. [Google Scholar] [CrossRef] [PubMed]
  14. National Institutes of Health, National Library of Medicine, National Center for Biotechnology Information, Gene Expression Omnibus. Available online: https://www.ncbi.nlm.nih.gov/geo/query/acc.cgi?acc=GSE39411 (accessed on 1 April 2024).
  15. Vallat, L.D.; Park, Y.; Li, C.; Gribben, J.G. Temporal genetic program following B-cell receptor cross-linking: Altered balance between proliferation and death in healthy and malignant B cells. Blood 2007, 109, 3989–3997. [Google Scholar] [CrossRef] [PubMed]
  16. Carvalho, B.S.; Irizarry, R.A. A framework for oligonucleotide microarray preprocessing. Bioinformatics 2010, 26, 2363–2367. [Google Scholar] [CrossRef] [PubMed]
  17. MacDonald, J.W. affycoretools: Functions Useful for Those Doing Repetitive Analyses with Affymetrix GeneChips. R Package Version 1.74.0. 2023. Available online: https://bioconductor.org/packages/affycoretools (accessed on 1 December 2022).
  18. Ritchie, M.E.; Phipson, B.; Wu, D.I.; Hu, Y.; Law, C.W.; Shi, W.; Smyth, G.K. limma powers differential expression analyses for RNA-sequencing and microarray studies. Nucleic Acids Res. 2015, 43, e47. [Google Scholar] [CrossRef] [PubMed]
  19. Benjamini, Y.; Hochberg, Y. Controlling the false discovery rate: A practical and powerful approach to multiple testing. J. R. Statist Soc. B 1995, 57, 289–300. [Google Scholar] [CrossRef]
  20. Azimuth: App for Reference-Based Single-Cell Analysis. Available online: https://azimuth.hubmapconsortium.org/references/human_pbmc/ (accessed on 1 February 2024).
  21. Hao, Y.; Hao, S.; Andersen-Nissen, E.; Mauck, W.M.; Zheng, S.; Butler, A.; Lee, M.J.; Wilk, A.J.; Darby, C.; Zager, M.; et al. Integrated analysis of multimodal single-cell data. Cell 2021, 184, 3573–3587. [Google Scholar] [CrossRef]
  22. Dal Bo, M.; D’Agaro, T.; Gobessi, S.; Zucchetto, A.; Dereani, S.; Rossi, D.; Zaja, F.; Pozzato, G.; Di Raimondo, F.; Gaidano, G.; et al. The SIRT1/TP53 axis is activated upon B-cell receptor triggering via miR-132 up-regulation in chronic lymphocytic leukemia cells. Oncotarget 2015, 6, 19102–19117. [Google Scholar] [CrossRef]
  23. Schleiss, C.; Carapito, R.; Fornecker, L.M.; Muller, L.; Paul, N.; Tahar, O.; Pichot, A.; Tavian, M.; Nicolae, A.; Miguet, L.; et al. Temporal multiomic modeling reveals a B-cell receptor proliferative program in chronic lymphocytic leukemia. Leukemia 2021, 35, 1463–1474. [Google Scholar] [CrossRef] [PubMed]
  24. Rivello, F.; van Buijtenen, E.; Matuła, K.; van Buggenum, J.A.; Vink, P.; van Eenennaam, H.; Mulder, K.W.; Huck, W.T. Single-cell intracellular epitope and transcript detection reveals signal transduction dynamics. Cell Rep. Methods 2021, 27, 100070. [Google Scholar] [CrossRef] [PubMed]
  25. Lin, W.; Cerny, D.; Chua, E.; Duan, K.; Yi, J.T.J.; Shadan, N.B.; Lum, J.; Maho-Vaillant, M.; Zolezzi, F.; Wong, S.C.; et al. Human regulatory B cells combine phenotypic and genetic hallmarks with a distinct differentiation fate. J. Immunol. 2014, 193, 2258–2266. [Google Scholar] [CrossRef]
  26. Vallat, L.; Kemper, C.A.; Jung, N.; Maumy-Bertrand, M.; Bertrand, F.; Meyer, N.; Pocheville, A.; Fisher, J.W., III; Gribben, J.G.; Bahram, S. Reverse-engineering the genetic circuitry of a cancer cell with predicted intervention in chronic lymphocytic leukemia. Proc. Natl. Acad. Sci. USA 2013, 110, 459–464. [Google Scholar] [CrossRef] [PubMed]
  27. Kwak, K.; Akkaya, M.; Pierce, S.K. B cell signaling in context. Nat. Immunol. 2019, 20, 963–969. [Google Scholar] [CrossRef] [PubMed]
  28. Tolar, P.; Sohn, H.W.; Liu, W.; Pierce, S.K. The molecular assembly and organization of signaling active B-cell receptor oligomers. Immunol. Rev. 2009, 232, 34–41. [Google Scholar] [CrossRef] [PubMed]
  29. Shinnakasu, R.; Kurosaki, T. Regulation of memory B and plasma cell differentiation. Curr. Opin. Immunol. 2017, 45, 126–131. [Google Scholar] [CrossRef] [PubMed]
  30. Dal Porto, J.M.; Gauld, S.B.; Merrell, K.T.; Mills, D.; Pugh-Bernard, A.E.; Cambier, J. B cell antigen receptor signaling 101. Mol. Immunol. 2004, 41, 599–613. [Google Scholar] [CrossRef]
  31. Goodnow, C.C.; Vinuesa, C.G.; Randall, K.L.; Mackay, F.; Brink, R. Control systems and decision making for antibody production. Nat. Immunol. 2010, 11, 681–688. [Google Scholar] [CrossRef] [PubMed]
  32. Harwood, N.E.; Batista, F.D. Early events in B cell activation. Annu. Rev. Immunol. 2010, 28, 185–210. [Google Scholar] [CrossRef]
  33. Harwood, N.E.; Batista, F.D. New insights into the early molecular events underlying B cell activation. Immunity 2008, 28, 609–619. [Google Scholar] [CrossRef]
  34. Kurosaki, T.; Shinohara, H.; Baba, Y. B cell signaling and fate decision. Annu. Rev. Immunol. 2010, 28, 21–55. [Google Scholar] [CrossRef] [PubMed]
  35. Tullai, J.W.; Schaffer, M.E.; Mullenbrock, S.; Sholder, G.; Kasif, S.; Cooper, G.M. Immediate-early and delayed primary response genes are distinct in function and genomic architecture. J. Biol. Chem. 2007, 282, 23981–23995. [Google Scholar] [CrossRef] [PubMed]
  36. Sproul, D.; Gilbert, N.; Bickmore, W.A. The role of chromatin structure in regulating the expression of clustered genes. Nat. Rev. Genet. 2005, 6, 775–781. [Google Scholar] [CrossRef] [PubMed]
  37. Reményi, A.; Schöler, H.R.; Wilmans, M. Combinatorial control of gene expression. Nat. Struct. Mol. Biol. 2004, 11, 812–815. [Google Scholar] [CrossRef] [PubMed]
  38. Retis-Resendiz, A.M.; González-García, I.N.; León-Juárez, M.; Camacho-Arroyo, I.; Cerbón, M.; Vázquez-Martínez, E.R. The role of epigenetic mechanisms in the regulation of gene expression in the cyclical endometrium. Clin. Epigenetics 2021, 13, 116. [Google Scholar] [CrossRef] [PubMed]
  39. Jones, P.A. Functions of DNA methylation: Islands, start sites, gene bodies and beyond. Nat. Rev. Genet. 2012, 13, 484–492. [Google Scholar] [CrossRef]
  40. Page, A.; Delles, M.; Negre, D.; Costa, C.; Fusil, F.; Cosset, F.-L. Engineering B cells with customized therapeutic responses using a synthetic circuit. Mol. Ther. Nucleic Acids 2023, 33, 1–14. [Google Scholar] [CrossRef]
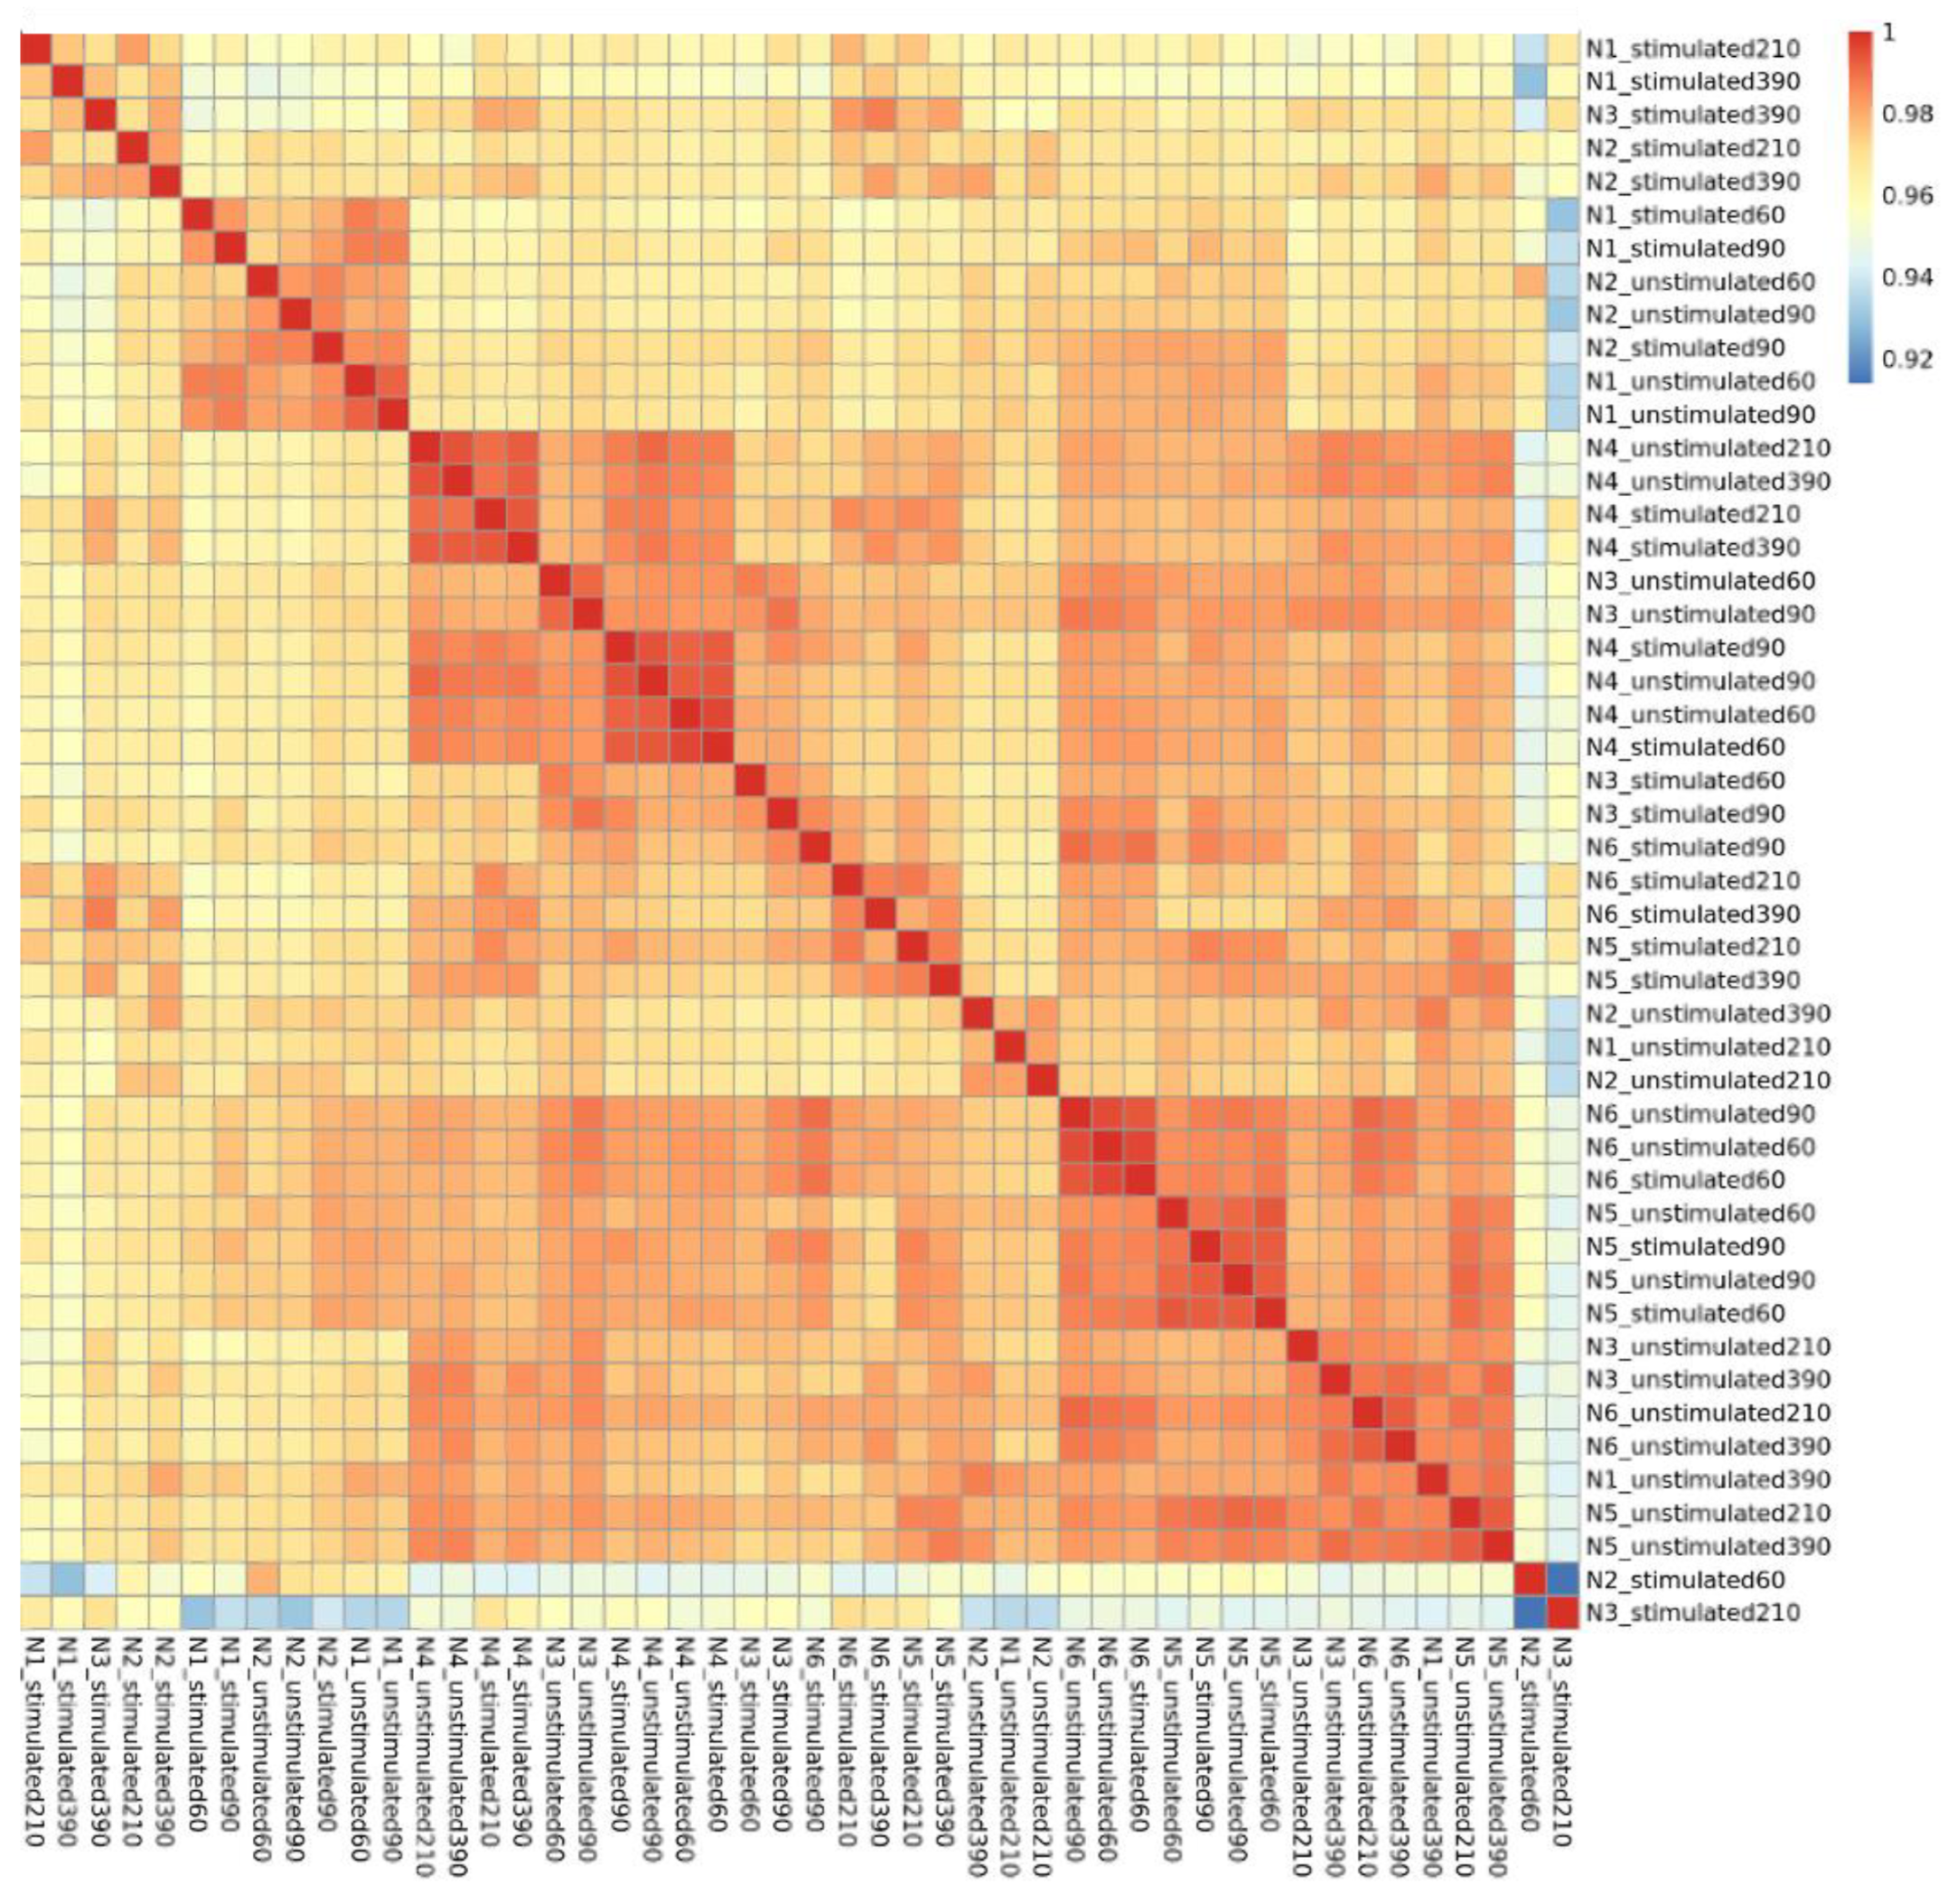
Figure 1. Pearson Correlation Heatmap representing overall inter-sample gene expression correlation. The correlation coefficient legend is in the upper right-hand corner. The correlation coefficients for all comparisons were ≥0.92, indicating overall gene expression correlation is high.
Biomedinformatics 04 00076 g001
Figure 2. Multidimensional Scaling Plot displaying the distance between samples. Groups, colored by condition, that are closer together are more similar. Outliers were not detected.
Biomedinformatics 04 00076 g002
Figure 3. Volcano plots of BCR stimulated vs. unstimulated B-cells at the 60, 90, 210, and 390-min time points post-stimulation. Panel (A): 60 min; Panel (B): 90 min; Panel (C): 210 min; Panel (D): 390 min. The adjusted p-value threshold is <0.01 and represented by the horizontal dashed line in each panel. The vertical dashed lines represent the FC thresholds of 1.5 and −1.5. not significant log2FC significant  p-value significant log2FC & p-value significant.
Biomedinformatics 04 00076 g003
Figure 4. Comparison of Fold Change (FC) gene upregulation vs. unstimulated (baseline) gene expression. Of 46 significantly upregulated genes at 390 min post-BCR stimulation, 6 genes (BCAT1, LRP8, NETO1, HIVEP3, KCNQ5, and BCAR3) also had relatively low baseline expression levels near the lower limit of all unstimulated gene expression levels.
Biomedinformatics 04 00076 g004
Figure 5. Schematic of approaches to engineering actuated payload secretion triggered by engineered BCR stimulation by a selected cognate antigen. Whole blood-derived B-cells undergo genome engineering that introduces new DNA (i.e., transgene cargo) into the B-cell genomes. These transgenes code for engineered BCR and soluble, therapeutic payload that is expressed and secreted in response to BCR stimulation by cognate antigen. This “on-switch” triggering mechanism is mediated by an alternate splicing transgene design (i.e., spatiotemporal transgene) or, theoretically, via a BCR-associated promotor coded for by the transgene. Created in BioRender.com.
Biomedinformatics 04 00076 g005
Table 1. Genes whose expression is low in resting, healthy B-cells and significantly upregulated 390-min following BCR stimulation.
Gene NameGene Description, Product,
and/or Function
PBMC Predominant
Distribution
BCAR3BCAR3 adaptor protein is a putative suppressor of breast cancer progression by inhibiting prometastatic TGFbeta/Smad signalingB-cells
BCAT1Branched chain amino acid transaminase 1
(cytosolic form)
B-cells and Monocytes
HIVEP3HIVEP zinc finger 3 is a transcription factor that binds to Rss heptamer for somatic recombination of immunoglobulin and T cell receptor gene segmentsMost PBMC
KCNQ5Potassium voltage-gated channel subfamily Q member 5 is expressed in subregions of the brain and in skeletal muscleB-cells and T cells
LRP8LDL receptor-related protein 8 is a receptor for the cholesterol transport protein apolipoprotein EMost PBMC
NETO1Neurolipin and talloid like 1 encodes a transmembrane protein containing two extracellular CUB domains followed by an LDL class A domainB-cells
TGF: transforming growth factor; Smad: suppressor of mothers against decapentaplegic; Rss: recombination signal sequences; LDL: low-density lipoprotein; CUB: complement C1r/C1s, Uegf, Bmp1; PBMC: peripheral blood mononuclear cells.
Table 2. Published and publicly available B-cell gene expression data.
Organization NameInitial
Submission to NCBI GEO
NCBI GEO
Accession
Number(s)
B-Cell
Stimulation
Human Cell Type
Dana-Farber Cancer Institute [6]N/AN/ACD40Healthy and B-cell CLL cells
Helmholtz Zentrum München2010GSE25434BCR or inducible LMP2AEBV immortalized
lymphoblastoid cell lines
Strasbourg University Hospital [15,26]2012GSE39411BCRHealthy and B-cell CLL cells
Singapore Immunology Network [25]2013GSE50895BCR and TLR9IL-10− and IL-10+ B-cells
CRO Aviano [22]2013GSE52774
GSE52775
BCRB-cell CLL
Strasbourg University Hospital [23]2019GSE130385BCRB-cell CLL
Radboud University [24]2020GSE162461BCRBurkitt lymphoma cells
BCR: B-cell receptor; LMP2A: latent membrane protein 2A; EBV: Epstein Barr virus; TLR9: toll-like receptor 9; IL-10: interleukin-10; CLL: chronic lymphocytic leukemia.
Disclaimer/Publisher’s Note: The statements, opinions and data contained in all publications are solely those of the individual author(s) and contributor(s) and not of MDPI and/or the editor(s). MDPI and/or the editor(s) disclaim responsibility for any injury to people or property resulting from any ideas, methods, instructions or products referred to in the content.