Article

Design and Modelling of an Induction Heating Coil to Investigate the Thermal Response of Magnetic Nanoparticles for Hyperthermia Applications

1
Faculty of Life Sciences, University of Bradford, Bradford BD7 1DP, UK
2
Faculty of Engineering and Digital Technologies, University of Bradford, Bradford BD7 1DP, UK
3
Department of Communication and Informatics Engineering, Basra University of Science and Technology, Basrah 61004, Iraq
*
Author to whom correspondence should be addressed.
BioMedInformatics 2024, 4(2), 1006-1018; https://doi.org/10.3390/biomedinformatics4020056
Submission received: 12 February 2024 / Revised: 6 March 2024 / Accepted: 25 March 2024 / Published: 2 April 2024
(This article belongs to the Special Issue Feature Papers in Clinical Informatics Section)

Abstract

:
Magnetic Field Hyperthermia is a technique where tumours are treated through an increase in local temperature upon exposure to alternating magnetic fields (AMFs) that are mediated by magnetic nano-particles (MNPs). In an AMF, these particles heat-up and kill the cells. The relationship between an AMF and the heating-rate is complex, leading to confusion when comparing data for different MNP and AMF conditions. This work allows for the thermal-response to be monitored at multiple AMF amplitudes while keeping other parameters constant. An induction-heating coil was designed based on a Zero-Voltage-Zero-Current (ZVZC) resonant circuit. The coil operates at 93 kHz with a variable DC drive-voltage (12–30 V). NEC4 software was used to model the magnetic field distribution, and MNPs were synthesised by the coprecipitation method. The magnetic field was found to be uniform at the centre of the coil and ranged from 1 kAm−1 to 12 kAm−1, depending on the DC drive-voltage. The MNPs were found to have a specific absorption rate (SAR) of 1.37 Wg−1[Fe] and 6.13 Wg−1[Fe] at 93 kHz and 2.1 kAm−1 and 12.6 kAm−1, respectively. The measured SAR value was found to be directly proportional to the product of the frequency and field-strength (SARα f Ho). This leads to the recommendation that, when comparing data from various groups, the SAR value should be normalized following this relationship and not using the more common relationship based on the square of the field intensity (SARα f Ho2).

1. Introduction

Cancer is a global problem, with 20 million new cases expected to be annually reported by 2025 [1]. Ahmad et al. suggested that one in two people in the UK will suffer from cancer at some point in their lives [2], and although great strides have been made in combating this disease, there is still work to be undertaken to prevent the impact that cancer has on communities [3]. For this reason, there is a need to develop new therapies, with one such option being Magnetic Field Hyperthermia (MH) [4]. MH has been recently trialled in human clinical studies that have demonstrated the safety and feasibility of it as an approach to treating several different cancers [5,6], including metastatic tumours [7,8]. During MH, magnetic nanoparticles (MNPs) are injected into a tumour site [9] or delivered through intravenous injection (IV). Both delivery methods have their advantages and disadvantages. IV injection requires the MNPs to have a long circulatory half-life in the blood to allow for their accumulation in the tumour and to reach a therapeutically active concentration [10]. In contrast, direct injection allows for a therapeutic dose to be delivered directly to the tumour [11]. In the presence of an alternating magnetic field (AMF), the MNPs act as mediators by coupling to the AMF. Within this magnetic field, these particles produce localized heat. The MNPs passively target cancer cells due to the enhanced permeability and retention effect [12], as well as the increased uptake of nanoparticulate material in the tumour microenvironment [13]. Other active targeting options are available, such as anti-bodies [14], peptides, nucleic acids [15] and small molecules such as folate and galactose [16]. These active targeting options are based on specific binding to receptors overexpressed in the tumour cells [17]. MH has repeatedly shown tumour regression in animal and human models, making it a strong candidate to become a front-line cancer therapy [18,19].
Despite the fact that the outcomes of clinical trials appear to be favourable, the approach lacks the capacity to fully comprehend both the mode-of-action (MoA) and the dose–heat connection [20]. It is necessary to create methods that can comprehend these in order to further enhance the therapy as well as the subsequent generation of MNPs that have higher heating rates and superior therapeutic responses [21].
One of the important MNP parameters to measure in MH is the Specific Absorption Rate (SAR) [22]. This gives a measure of thermal power produced when the MNPs couple to an AMF. The greater the SAR, the greater the temperature increase in the surroundings per unit mass of the MNPs in the presence of an AMF. The SAR value is usually quoted in units of Watts per gram of Fe (Wg−1[Fe]) [23]. In the system, all the energy is provided by the AMF, so this represents the coupling and energy conversion (magnetic-to-thermal) of the MNPs. The greater the SAR value for a given MNP composition, the less mass (and therefore the lower the concentration) of these MNPs needed inside the tumour cell in order to induce cell death through MH [23]. It is important to know the SAR value for a given MNP and to be able to predict how this will change with different AMF parameters (as used by different research groups). The SAR is dependent on several physical parameters associated with the AMF as well as the chemical and material properties of the MNPs and the solution they are dispersed in [24]. With respect to the AMF, the SAR value has been shown to be related to the frequency (f) and the field strength (Ho). Hergt et al. showed that, within certain limits, the SAR value is proportional to the square of the field strength and directly proportional to the frequency (SAR α f Ho2) [25]. Using this relationship, the SAR value for various MNPs measured by different groups working with different AMF parameters has routinely been ‘Normalised’ to 1 MHz and 100 Oe (7958 Am−1) for comparison. However, the magnetic properties of the MNPs also change with the AMF frequency and field strength, as shown by Etheridge [26]. The magnetic susceptibility of the MNPs tends to decrease with increased field strength and plateau with increased frequency [26]. This complex relationship leads to a prediction that the SAR value is directly proportional to the product of the frequency and field strength (SAR α f Ho). These two relationships lead to different predicted SAR values for a given material, leading to confusion in the literature [26]. In this work, we detail the design, modelling and build of an induction heating circuit (IHC) for measuring the SAR value of MNPs with a view to supporting one of these statements and to aid in the optimization of the next generation of MNPs for application in MH. The circuit is operated with a coil made from hollow copper tubing (5 mm external diameter and 4.1 mm internal diameter) that operates at a frequency of 93 kHz and a maximum field strength (Ho) ranging from 1 kAm−1 to 12 kAm−1 depending on the drive voltage.
The work documented involves the analysis and modelling of complex systems. Advanced computer modelling is used to investigate the resonant frequency of the IHC with respect to the circuit components. Further computer modelling is used to accurately predict the magnetic field intensity generated by the IHC. This depends on the current and AC voltage used, as well as on the physical shape of the coil. The 3D model of the coil is entered into CAD software using MATLAB 2021a for an accurate prediction of the magnetic field generated. Further computer modelling is then used to map the magnetic field intensity in three dimensions. This addresses one of the current issues with the published data on MH, namely poorly characterized magnetic fields and unknown field intensities. We add experimental data to show how the SAR varies with the applied magnetic field intensity. The modelling will feed into future IHC design and help develop an IHC that can be used to investigate the heating potential of MNPs in live cancer cells.

2. Induction Coil Circuit Design

It is necessary to have an understanding of the interaction between the AMF and thermal heating in solution in order to be able to build the next generation of MNPs for use in medicinal chemistry. The operational conditions that are necessary for the most effective application of MH in cancer therapy will be significantly improved as a result of this knowledge. In order to begin this procedure, the first step is to design the electronics necessary for an IHC that is operational. Recently, there has been a resurgence in interest regarding the designing of a laboratory-scale IHC system that can be accomplished by the use of a smooth switching electronics device. We used software to simulate, construct, and comprehend the circuit, as well as to ascertain the ideal values for the parts and components so that we could create a system that was compatible with our needs, and it was found that different approaches can be utilised to achieve the IHC function. For example, Zero Voltage Zero Current (ZVZC) switches used in power electronics can force the voltage or current in a switch to zero using a resonant frequency [27]. This can achieve a reduction in switching losses [28]. The ZVZC technique was found to be the most cost-effective option, as it negates the need for a more complex control system [29]. When activated, the system generates unwanted electrical heating in the circuit and coil. With the coil fabricated from hollow copper tubing, water can be pumped through the coil to cool the component. This is an important consideration, as uncontrolled thermal heating will adversely affect the data produced.
The basic principle for using the IHC is a resonance between an inductor and a capacitor to create a tank circuit or resonance circuit. This consists of an inductor and capacitor connected either in series or in parallel [30]. Some studies have exploited combining a half-bridge circuit with a tank circuit [31,32] where the half-bridge is involved in switching electronic power in the tuned circuit.

3. Methods and Results

In this study, a push−pull circuit was developed to obtain the resonant frequency in the inductor coil. A circuit diagram can be seen in Figure 1. The circuit converts DC to AC with a high operating frequency (93 kHz with the coil fitted). The operating frequency was determined experimentally by measuring the frequency of the AC current using an oscilloscope and an AC/DC Current Clamp meter (Model name Hantek CC-650, Manufacturer Hantek Electronic Co., Ltd., Qingdao, China. Sourced online). If the same drive circuit is used, but with a different induction coil, the resonant frequency would change as the inductance and resistance of the coil would change. The push−pull circuit was connected to a DC power supply that provides a variable drive voltage (0–40 V).

3.1. MATLAB and LTspice Modelling of Circuit

To investigate the resonant frequency of the circuit along with the variation in elements, such as the inductor and capacitor, a model was developed in a MATLAB script. The quasi-resonant modulation helps to reduce the ringing and the losses during turn-off and turn-on switches. Therefore, less energy will be circuited, and we can consider this circuit as soft switching to reduce the losses. The magnetizing inductance is assumed to be infinite, and the inductor current ripple is neglected. The MATLAB script code is written based on the following equations:
C e q = ( C os s + C s ) / n 2
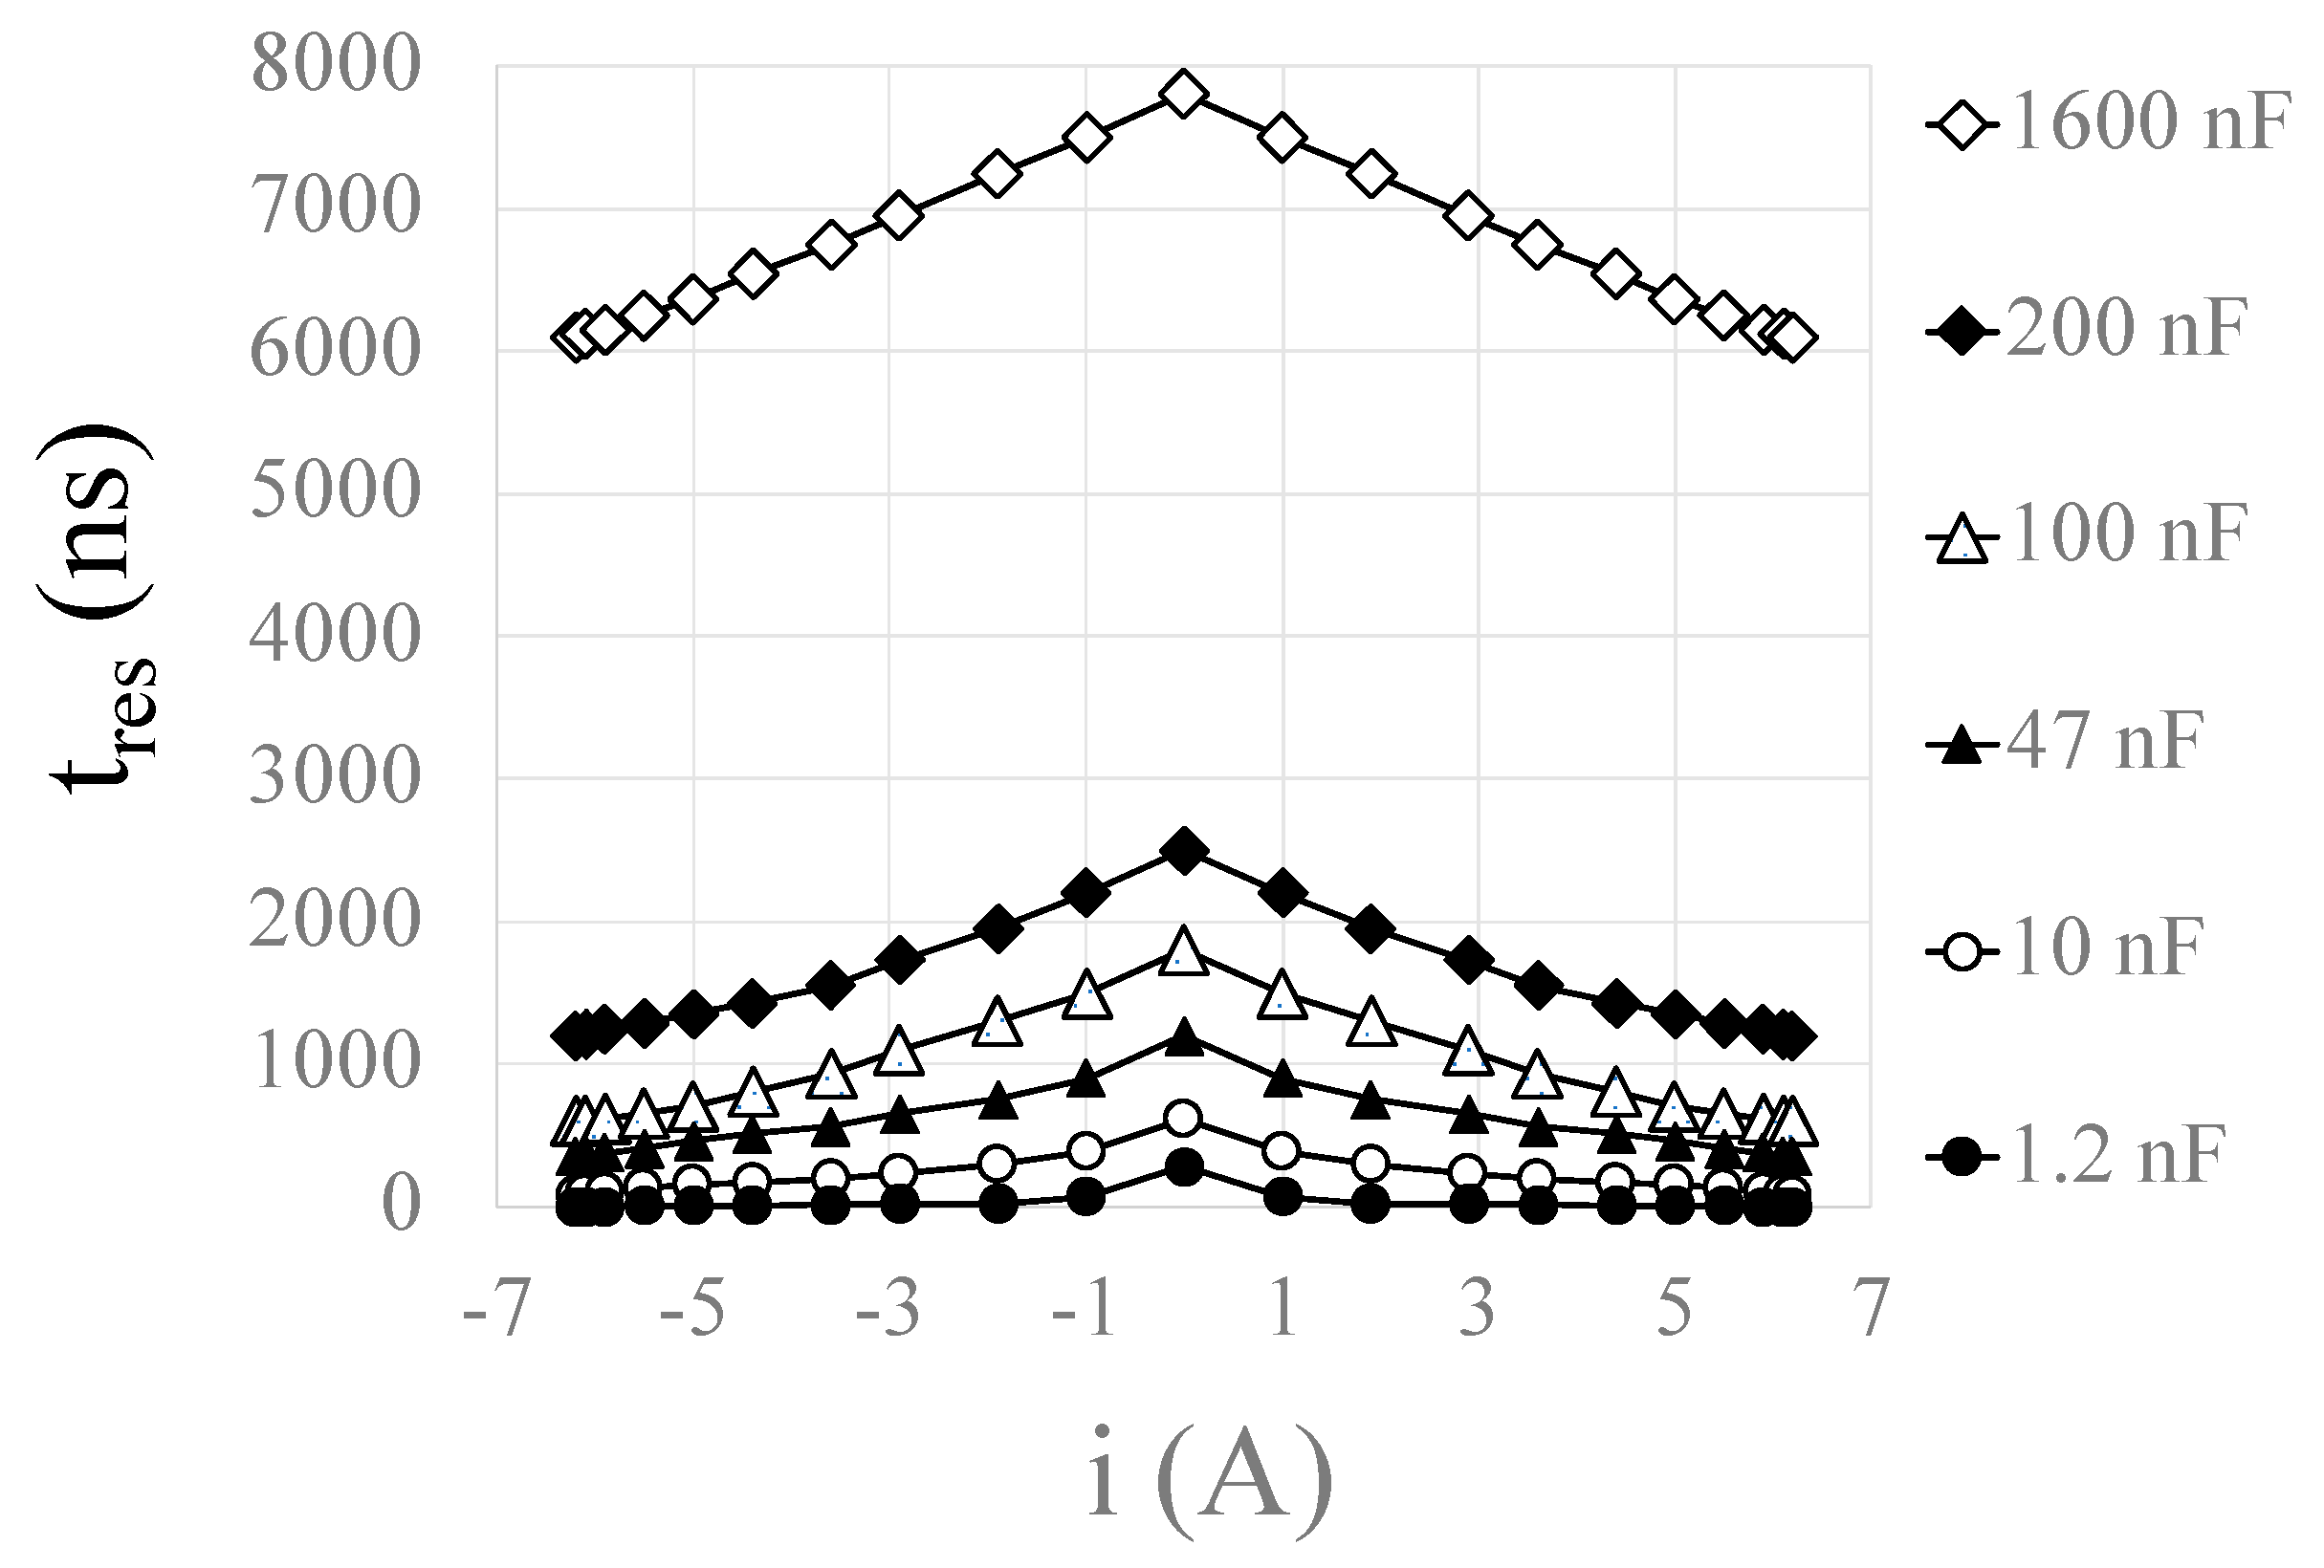
t r e s = π 2 tan 1 n i A C Z r V D C π f r ( C os s + C s ) / n 2
where Z r = L e q / C e q and f r = 1 / 2 π L e q / C e q .
Cs is the snubber capacitor across the active device used to reduce their dv/dt during the turn-OFF transient and, as a result, turn-OFF losses; Coss is the output capacitance of the DC-side transistors; n is the transformer turns ratio; VDC is the DC side voltage; Leq is the transformer leakage inductance. The rest of the other parameters of Figure 1 and their values are discussed by Blinov et al. [33]. The outcome of this simulation can be seen in Figure 2. The impact of varying the capacitor value on the circuit resonant frequency was investigated by using MATLAB 2021a software. As expected, when the capacitance increased, the resonant frequency decreased. We can select the resonant frequency by changing the value of the capacitor. The optimal capacitance for the current system is around 1.6 µF, as seen in Figure 2.
In order to model the resonant frequency of the induction heating circuit, LTspice (a SPICE-based analog electronic circuit simulator) computer software was used. LTspice is a high-performance spice simulation program with schematic capture and a waveform viewer that allows for the advanced analysis of the circuit. Firstly, the variation in the voltage with time was measured at L1. The results of this simulation can be seen in Figure 3a, while the frequency domain can be seen in Figure 3b. These show that the circuit will function as planned, giving a resonance frequency of 1400 Hz with this set-up (the main peak in Figure 3b). The resonance frequency is dependent on the properties of the induction coil fitted to the circuit and will vary depending on the size and shape of the coil used (inductance and resistance).

3.2. Testing the Circuit with Copper Coil Attached

The circuit was built and connected to a coil made from hollow copper tubing (5 mm external diameter); a CAD representation of the coil can be seen in Figure 4. The coil was a cylinder approximately 50 mm in diameter and 55 mm in depth with 6 turns. This is now referred to as the complete IHC. Once connected, the IHC was supplied with a variable DC drive voltage and the current flowing in the coil was measured with an oscilloscope and an AC/DC Current Clamp meter (Hantek CC-650). The waveform of the voltage and current can be seen in Figure 5, as measured across the coil operating with a drive voltage of 15 V. It can be seen that the AC current and voltage all follow the expected sinewave pattern, featuring a time period of 11 μs each. The peak voltage measured was 80 V and the peak current 40 A. The IV curve can be seen in Figure 6. The resonance frequency was found to be 93 kHz.
The magnetic field generated by the coil was modelled using NEC4 (Numerical Electromagnetic Code Version 4) software for a 12 V DC supply to the IHC. This gives an AC frequency of 93 kHz and an Irms current of 10 A in the coil. The results of the model can be seen in Figure 7. They show that a uniform magnetic field is generated in the coil with an average magnetic field intensity at the centre of the coil of around 1000 Am−1 increasing to 1100 Am−1 close to the internal edge of the coil. The modelled magnetic field was in good agreement with a hand-held Gauss meter reading (Model name GQ EMF-390, manufactured by GQ Electronics LLC, Seattle, USA. Purchased online) [34]. This estimated the field to be around 250 Am−1 at a distance of 1 cm above the coil and 0.6 Am−1 at a distance of 5 cm from the centre edge away from the coil.
The Ampère–Maxwell law states that the magnetic field intensity is directly proportional to the current generating that field [35,36]. Since the current flowing in the coil is dependent on the drive voltage, this allows the IHC to have a variable magnetic field intensity dependent on the input DC voltage. The average magnetic field intensity at the centre of the coil for a given drive voltage can be seen in Figure 8. This shows that the IHC is capable of delivering magnetic field intensities from 1 kAm−1 to 12.5 kAm−1. During the application of MH, the AMF can cause discomfort to the patient [37]. It was estimated that the product of the field intensity and field frequency (Ho × f) should be kept below 5.0 × 10⁹ Am−1s−1 to avoid discomfort [38]. Given an operating frequency of 93 kHz, the maximum operating condition for our coil is 1.2 × 10⁹ Am−1s−1, and so is below this biomedical limit.

3.3. Using the IHC to Heat Magnet Nanoparticles

Magnetic nanoparticles (MNPs) were synthesised using the pH precipitation method from iron (II) and iron (III) chloride [39]. The iron-oxide nanoparticles (MNPs) were synthesized under a nitrogen atmosphere. FeCl2 (8.5 mmoles), FeCl3 (17.5 mmoles) and deionized water (75 mL) were combined in a reaction flask and mixed until fully dissolved. NaOH (4 mol dm−3) was added dropwise to adjust the pH of the mixture to pH > 10, giving a final volume of 100 mL. The solution was subjected to continuous stirring for 1 h during the reaction. It can be seen that a black precipitate forms upon addition of the NaOH, and this is the final product. The reaction mixture was left to cool to room temperature while the product was allowed to sediment. The black precipitate formed was washed by centrifugation and magnetic precipitation with deionized water until pH 7. Finally, the precipitate was redispersed in distilled water to give a final concentration of 60 mg mL−1. Through the process of drying a known volume of the final solution to a fixed mass, the mass concentration of the MNP was identified and determined. For the purpose of collecting all of the magnetic solid, 1 mL of the MNP solution was dispersed in 2 mL of ethanol, and then the mixture was magnetically precipitated. After decanting the clear liquid into a separate container, the solid was cleaned with a mixture of acetone and ethanol. Following the washing process, the material was dried in a nitrogen stream until it reached a consistent mass. As a result, the mass concentration of the MNP in the main sample was determined. This process was repeated in triplicate to find the average mass of MNPs per mL of solution.
The MNPs (3 mL) of known concentration were placed at the centre of the IHC coil in a glass test-tube fitted with a stopper. An alcohol thermometer was placed in the centre of the solution and used to record the temperature rise with time upon activating the AMF. As expected, the temperature of the sample increased over time. With a 15 V drive voltage, this was a steady increase from room temperature (298 K) to a maximum of 316 K. This heating curve is consistent with those reported in the literature [39] and confirms that the IHC was working as expected. A control experiment was also conducted where pure, deionized water (3 mL) was placed in the glass test-tube and the IHC activated. As expected, this control showed no change in temperature after 60 min, confirming that the uncontrolled heating from the current flowing in the coil was removed by the cooling liquid. The heating was repeated with the same MNP sample but with the drive voltage increased to 30 V.
Figure 9 shows the heating curves for the MNPs in solution. It can be seen that, for the 30 V drive voltage, the temperature increase in the water was around 25 K in the first 500 s. This dropped to around 5 K in the first 500 s, with a drive voltage of 15 V. This is as expected, as a high MNP concentration was used for the experiment (60 mg mL−1). During medical application, it is common practice to use much lower MNP concentrations of around 1–10 mg mL−1 [40]. The heating curves shown in Figure 9 can be described in terms of energy flow and the heat capacity of water (Cw) [41]. As the AMF was activated, the MNPs coupled to the field and generated energy. The energy went into the system and produced a temperature change in the water that is related to the specific heat capacity of water (Cw = 4.184 JK−1g−1). This gave rise to the initial linear increase in temperature seen in the system. If the system was fully insulated, with no heat flow out, then the temperature would rise at a constant rate proportional to Cw; however, the system was not ideal and heat was lost to the surroundings so that, at some point, the energy in equalled the energy out and the system reached equilibrium. This is the plateau seen at about 15 K after 2186 s for the 15 V drive voltage. The plateau region is dependent on the heat loss to the soundings and is of no interest here; the important feature is the gradient of the initial linear region (see Figure 10). This gradient was proportional to the heat capacity of water (Cw) and the energy produced by the MNPs. As the same MNPs were used in both cases, this was related to the magnetic field intensity generated by the coil. The initial linear region of the heating curves, seen in Figure 10, can be used to calculate the SAR for the two coil conditions (15 V and 30 V drive voltage).
S A R = C w m ( d T ) [ F e ] t
where Cw is the heat capacity of water (4.184 J K−1 g−1), m is the total mass of water (g), dT is the temperature change (K), t is the time (s) and [Fe] is the mass of Fe present in the sample (g). Additionally, dT/t is the gradient of the linear portion of the heating curve taken in the first 300 s (see Figure 10).
Using Equation (3), the SAR can be calculated for the two different AMF field strengths, SAR15 = 1.37 Wg−1[Fe] and SAR30 = 6.13 Wg−1[Fe]. These two values are measured with the same AMF frequency (93 kHz) but with different maximum AMF field intensities. From Figure 8, it is possible to estimate the field intensities generated by these drive voltages to be 2.1 kAm−1 for a drive voltage of 15 V and 12.6 kAm−1 for a drive voltage of 30 V. It can be seen that this data supports the assumptions made by Etheridge et al. [26] and that the SAR value is directly proportional to the product of the frequency and field strength (SAR α f Ho). The reported SAR values for the MNPs used by other groups range from 1 to 20 Wg−1[Fe] [42] and compare well with our estimates.

4. Conclusions

In conclusion, an IHC was designed and built that has the capability to operate at a range of different AMF intensities dependent on the drive voltage (1 kAm−1–12.5 kAm−1 with a drive voltage of 10–30 V, respectively). The IHC was modelled using MATLAB and LTspice and confirmed experimentally. The AMF generated in the coil was mapped using NEC4 software and shown to be uniform at the centre of the coil. MNPs were synthesised, with their magnetic-thermal response and SAR values being determined at two different AMF intensities. These were shown to be SAR15 = 1.37 Wg−1[Fe] and SAR30 = 6.13 Wg−1[Fe] at 2.1 kAm−1 and 12.6 kAm−1, respectively, both at the same resonant frequency of 93 kHz and the same MNP concentration (60 mg mL−1). This showed that the SAR value is directly proportional to the product of the frequency and field strength (SAR α f Ho), supporting the theory discussed by Etheridge et al. The heating coil design work contained in this manuscript outlines the guiding principles for the development of future AMF systems necessary for MNP therapy.
In the future, research will concentrate on using other methods of MNP synthesis in order to gain a better understanding of the interaction between the size, shape, chemical composition and surface coatings of MNPs and the SAR values with a view to maximise the heating potential and to generate high-heating MNPs. The work that was undertaken to model the magnetic field will be used to optimize the coil shape and size before being included into the design of future coil systems. This will allow for a better understanding of how the shape and size of the coil affects the magnetic field intensities and distribution. A heating coil that can be used with cancer cell culture and cell culture plates is being designed. This future coil will be used for the purpose of conducting research on cell death mechanisms and optimizing the AMF−MNP coupling and energy flow. Additionally, the IHC coil system will be incorporated into a fluorescence spectrometer for determining the rotational diffusion properties of the MNPs.

Author Contributions

Conceptualization, P.D. and A.A.; methodology, R.A.A.-A.; software, R.A.A.-A.; validation, T.S. and P.D.; formal analysis, A.A.; investigation, P.D.; resources, R.A.A.-A. and P.D.; writing—original draft preparation, A.A. and P.D.; writing—review and editing, R.A.A.-A. and T.S. All authors have read and agreed to the published version of the manuscript.

Funding

This research received no external funding.

Institutional Review Board Statement

Not applicable.

Informed Consent Statement

Not applicable.

Data Availability Statement

On request from the authors.

Acknowledgments

This work is partially supported by the UK Engineering and Physical Sciences Research Council (EPSRC) under grant EP/X039366/1, and HORIZON-MSCA-RISE ID: 101086492, Marie Skłodow-ska-Curie, Research and Innovation Staff Exchange (RISE), titled: FractuRe Orthopaedic Rehabilita-tion: Ubiquitous eHealth Solution (Robust). Authors also acknowledge the support given by both faculties of Life Science and Engineering of Bradford Universities.

Conflicts of Interest

The authors declare no conflicts of interest.

References

  1. Ferlay, J.; Soerjomataram, I.; Dikshit, R.; Eser, S.; Mathers, C.; Rebelo, M.; Parkin, D.M.; Forman, D.; Bray, F. Cancer incidence and mortality worldwide: Sources, methods and major patterns in GLOBOCAN 2012. Int. J. Cancer 2015, 136, E359–E386. [Google Scholar] [CrossRef] [PubMed]
  2. Ahmad, A.S.; Ormiston-Smith, N.; Sasieni, P.D. Trends in the lifetime risk of developing cancer in Great Britain: Comparison of risk for those born from 1930 to 1960. Br. J. Cancer 2015, 112, 943–947. [Google Scholar] [CrossRef] [PubMed]
  3. American Cancer Society. Cancer Facts & Figures 2023; American Cancer Society: Atlanta, GA, USA, 2023. [Google Scholar]
  4. Raouf, I.; Khalid, S.; Khan, A.; Lee, J.; Kim, H.S.; Kim, M.H. A review on numerical modeling for magnetic nanoparticle hyperthermia: Progress and challenges. J. Therm. Biol. 2020, 91, 102644. [Google Scholar] [CrossRef] [PubMed]
  5. Maier-Hauff, K.; Ulrich, F.; Nestler, D.; Niehoff, H.; Wust, P.; Thiesen, B.; Orawa, H.; Budach, V.; Jordan, A. Efficacy and safety of intratumoral thermotherapy using magnetic iron-oxide nanoparticles combined with external beam radiotherapy on patients with recurrent glioblastoma multiforme. J. Neuro-Oncol. 2011, 103, 317–324. [Google Scholar] [CrossRef]
  6. Study of Focal Ablation of the Prostate with NanoTherm® Therapy System for Intermediate-Risk Prostate Cancer. ClinicalTrials.gov Identifier: NCT05010759, Start Date 30 November 2021, Completion Date October 2025. Available online: https://classic.clinicaltrials.gov/ct2/show/NCT05010759 (accessed on 15 December 2023).
  7. Kraus, S.; Tal, C.; Shalev, B.; Eltanani, M.; Rukenstein, P.; Arbib, S.; Eck, M.; Khandadash, R.; Atar, S.; Cyjon, A.; et al. Initial safety and feasibility results from a first-in-human clinical trial evaluating a novel magnetic hyperthermia approach for the treatment of metastatic solid tumors. Cancer Res. 2023, 83 (Suppl. 8), CT170. [Google Scholar] [CrossRef]
  8. Rouni, M.A.; Shalev, B.; Tsanidis, G.; Markakis, I.; Kraus, S.; Rukenstein, P.; Suchi, D.; Shalev, O.; Samaras, T. A Validated Methodological Approach to Prove the Safety of Clinical Electromagnetic Induction Systems in Magnetic Hyperthermia. Cancers 2024, 16, 621. [Google Scholar] [CrossRef] [PubMed]
  9. Salloum, M.; Ma, R.; Zhu, L. An in-vivo experimental study of temperature elevations in animal tissue during magnetic nanoparticle hyperthermia. Int. J. Hyperth. 2008, 24, 589–601. [Google Scholar] [CrossRef] [PubMed]
  10. Caro, C.; Guzzi, C.; Moral-Sánchez, I.; Urbano-Gámez, J.D.; Beltrán, A.M.; García-Martín, M.L. Smart Design of ZnFe and ZnFe@Fe Nanoparticles for MRI-Tracked Magnetic Hyperthermia Therapy: Challenging Classical Theories of Nanoparticles Growth and Nanomagnetism. Adv. Healthc. Mater. 2024, e2304044. [Google Scholar] [CrossRef] [PubMed]
  11. Paez-Muñoz, J.M.; Gámez, F.; Fernández-Afonso, Y.; Gallardo, R.; Leal, M.P.; Gutiérrez, L.; de la Fuente, J.M.; Caro, C.; García-Martín, M.L. Optimization of iron oxide nanoparticles for MRI-guided magnetic hyperthermia tumor therapy: Reassessing the role of shape in their magnetocaloric effect. J. Mater. Chem. B 2023, 11, 11110–11120. [Google Scholar] [CrossRef]
  12. Islam, W.; Niidome, T.; Sawa, T. Enhanced Permeability and Retention Effect as a Ubiquitous and Epoch-Making Phenomenon for the Selective Drug Targeting of Solid Tumors. J. Pers. Med. 2022, 12, 1964. [Google Scholar] [CrossRef]
  13. Bromma, K.; Banister, A.; Kowalewski, A.; Cicon, L.; Chithrani, D.B. Elucidating the fate of nanoparticles among key cell components of the tumor microenvironment for promoting cancer nanotechnology. Cancer Nanotechnol. 2020, 11, 8. [Google Scholar] [CrossRef]
  14. Wathoni, N.; Puluhulawa, L.E.; Joni, I.M.; Muchtaridi, M.; Mohammed, A.F.A.; Elamin, K.M.; Milanda, T.; Gozali, D. Monoclonal antibody as a targeting mediator for nanoparticle targeted delivery system for lung cancer. Drug Deliv. 2022, 29, 2959–2970. [Google Scholar] [CrossRef]
  15. Kamaly, N.; Xiao, Z.; Valencia, P.M.; Radovic-Moreno, A.F.; Farokhzad, O.C. Targeted polymeric therapeutic nanoparticles: Design, development and clinical translation. Chem. Soc. Rev. 2012, 41, 2971–3010. [Google Scholar] [CrossRef]
  16. Attia, M.F.; Anton, N.; Wallyn, J.; Omran, Z.; Vandamme, T.F. An overview of active and passive targeting strategies to improve the nanocarriers efficiency to tumour sites. J. Pharm. Pharmacol. 2019, 71, 1185–1198. [Google Scholar] [CrossRef]
  17. Oroojalian, F.; Beygi, M.; Baradaran, B.; Mokhtarzadeh, A.; Shahbazi, M.A. Immune Cell Membrane-Coated Biomimetic Nanoparticles for Targeted Cancer Therapy. Small 2021, 17, 2006484. [Google Scholar] [CrossRef]
  18. Gupta, D.; Roy, P.; Sharma, R.; Kasana, R.; Rathore, P.; Gupta, T.K. Recent nanotheranostic approaches in cancer research. Clin. Exp. Med. 2024, 24, 8. [Google Scholar] [CrossRef]
  19. Fernandes, S.; Fernandez, T.; Metze, S.; Balakrishnan, P.B.; Mai, B.T.; Conteh, J.; De Mei, C.; Turdo, A.; Di Franco, S.; Stassi, G.; et al. Magnetic Nanoparticle-Based Hyperthermia Mediates Drug Delivery and Impairs the Tumorigenic Capacity of Quiescent Colorectal Cancer Stem Cells. ACS Appl. Mater. Interfaces 2021, 13, 15959–15972. [Google Scholar] [CrossRef]
  20. Liu, X.; Wang, Y.; Zhu, W.; Li, G.; Ma, X.; Zhang, Y.; Chen, S.; Tiwari, S.; Shi, K.; Zhang, S.; et al. Comprehensive understanding of magnetic hyperthermia for improving antitumor therapeutic efficacy. Theranostics 2020, 10, 3793–3815. [Google Scholar] [CrossRef]
  21. Farzanegan, Z.; Tahmasbi, M. Evaluating the applications and effectiveness of magnetic nanoparticle-based hyperthermia for cancer treatment: A systematic review. Appl. Radiat. Isot. 2023, 198, 110873. [Google Scholar] [CrossRef] [PubMed]
  22. Andreu, I.; Natividad, E. Accuracy of available methods for quantifying the heat power generation of nanoparticles for magnetic hyperthermia. Int. J. Hyperth. 2013, 29, 739–751. [Google Scholar] [CrossRef]
  23. Lee, J.-H.; Kim, B.; Kim, Y.; Kim, S.-K. Ultra-high rate of temperature increment from superparamagnetic nanoparticles for highly efficient hyperthermia. Sci. Rep. 2021, 11, 4969. [Google Scholar] [CrossRef] [PubMed]
  24. Jiang, P.S.; Drake, P.; Cho, H.J.; Kao, C.H.; Lee, K.F.; Kuo, C.H.; Lin, X.Z.; Lin, Y.J. Tailored nanoparticles for tumour therapy. J. Nanosci. Nanotechnol. 2012, 12, 5076–5081. [Google Scholar] [CrossRef] [PubMed]
  25. Hergt, R.; Andra, W.; D’Ambly, C.; Hilger, I.; Kaiser, W.; Richter, U.; Schmidt, H.-G. Physical limits of hyperthermia using magnetite fine particles. IEEE Trans. Magn. 1998, 34, 3745–3754. [Google Scholar] [CrossRef]
  26. Etheridge, M.L. Understanding the Benefits and Limitations of Magnetic Nanoparticle Heating for Improved Applications in Cancer Hyperthermia and Biomaterial Cryopreservation. Ph.D. Thesis, University of Minnesota, Minneapolis, MN, USA, 2013. Available online: https://hdl.handle.net/11299/171091 (accessed on 27 July 2021).
  27. Mohan, N.; Undeland, T.M.; Robbins, W.P. Power Electronics: Converters, Applications, and Design, 3rd ed.; Wiley: Hoboken, NJ, USA, 2002; ISBN 13 978-0471226932. [Google Scholar]
  28. Ashique, R.H.; Salam, Z.; Maruf, H.; Shihavuddin, A.; Islam, T.; Rahman, F.; Kotsampopoulos, P.; Fayek, H.H. A Comparative Analysis of Soft Switching Techniques in Reducing the Energy Loss and Improving the Soft Switching Range in Power Converters. Electronics 2022, 11, 1062. [Google Scholar] [CrossRef]
  29. Cho, J.-G.; Baek, J.-W.; Jeong, C.-Y.; Rim, G.-H. Novel zero-voltage and zero-current-switching full-bridge PWM converter using a simple auxiliary circuit. IEEE Trans. Ind. Appl. 1999, 35, 15–20. [Google Scholar] [CrossRef]
  30. Kwon, Y.-S.; Yoo, S.-B.; Hyun, D.-S. Half-bridge series resonant inverter for induction heating applications with load-adaptive PFM control strategy. In Proceedings of the APEC ′99. Fourteenth Annual Applied Power Electronics Conference and Exposition. 1999 Conference Proceedings (Cat. No.99CH36285), Dallas, TX, USA, 14–18 March 1999; Volume 1, pp. 575–581. [Google Scholar] [CrossRef]
  31. Tong, S.; Quinto, C.A.; Zhang, L.; Mohindra, P.; Bao, G. Size-Dependent Heating of Magnetic Iron Oxide Nanoparticles. ACS Nano 2017, 11, 6808–6816. [Google Scholar] [CrossRef] [PubMed]
  32. Attar, M.M.; Amanpour, S.; Haghpanahi, M.; Haddadi, M.; Rezaei, G.; Muhammadnejad, S.; HajiAkhoundzadeh, M.; Barati, T.; Sadeghi, F.; Javadi, S. Thermal analysis of magnetic nanoparticle in alternating magnetic field on human HCT-116 colon cancer cell line. Int. J. Hyperth. 2016, 32, 858–867. [Google Scholar] [CrossRef] [PubMed]
  33. Blinov, A.; Korkh, O.; Chub, A.; Vinnikov, D.; Peftitsis, D.; Norrga, S.; Galkin, I. High Gain DC–AC High-Frequency Link Inverter with Improved Quasi-Resonant Modulation. IEEE Trans. Ind. Electron. 2021, 69, 1465–1476. [Google Scholar] [CrossRef]
  34. Algaddafi, A.E. Designing and Building a Novel Magnetic Heating System to Investigate the Dependence of the Magnetic System on the Optical Emission from Nanoparticles. Ph.D. Thesis, University of Bradford, Bradford, UK, 2022. [Google Scholar]
  35. Maxwell, J.C. A Treatise on Electricity and Magnetism; Oxford University Press: Oxford, UK, 1873. [Google Scholar]
  36. Raff, S.J. Ampere’s Law and the Vector Potential. Am. J. Phys. 1958, 26, 454–460. [Google Scholar] [CrossRef]
  37. Atkinson, W.J.; Brezovich, I.A.; Chakraborty, D.P. Usable frequencies in hyperthermia with thermal seeds. IEEE Trans. Biomed. Eng. 1984, BME-31, 70–75. [Google Scholar] [CrossRef]
  38. Hergt, R.; Dutz, S. Magnetic particle hyperthermia—Biophysical limitations of a visionary tumour therapy. J. Magn. Magn. Mater. 2007, 311, 187–192. [Google Scholar] [CrossRef]
  39. Drake, P.; Cho, H.-J.; Shih, P.-S.; Kao, C.-H.; Lee, K.-F.; Kuo, C.-H.; Lin, X.-Z.; Lin, Y.-J. Gd-doped iron-oxide nanoparticles for tumour therapy via magnetic field hyperthermia. J. Mater. Chem. 2007, 17, 4914–4918. [Google Scholar] [CrossRef]
  40. Le Fèvre, R.; Durand-Dubief, M.; Chebbi, I.; Mandawala, C.; Lagroix, F.; Valet, J.-P.; Idbaih, A.; Adam, C.; Delattre, J.-Y.; Schmitt, C.; et al. Enhanced antitumor efficacy of biocompatible magnetosomes for the magnetic hyperthermia treatment of glioblastoma. Theranostics 2017, 7, 4618–4631. [Google Scholar] [CrossRef] [PubMed]
  41. Pucci, C.; Degl’Innocenti, A.; Gümüş, M.B.; Ciofani, G. Superparamagnetic iron oxide nanoparticles for magnetic hyperthermia: Recent advancements, molecular effects, and future directions in the omics era. Biomater. Sci. 2022, 10, 2103–2121. [Google Scholar] [CrossRef] [PubMed]
  42. Nain, S.; Kumar, N.; Chudasama, B.; Avti, P.K. The SLP estimation of the nanoparticle systems using size-dependent magnetic properties for the magnetic hyperthermia therapy. J. Magn. Magn. Mater. 2023, 565, 170219. [Google Scholar] [CrossRef]
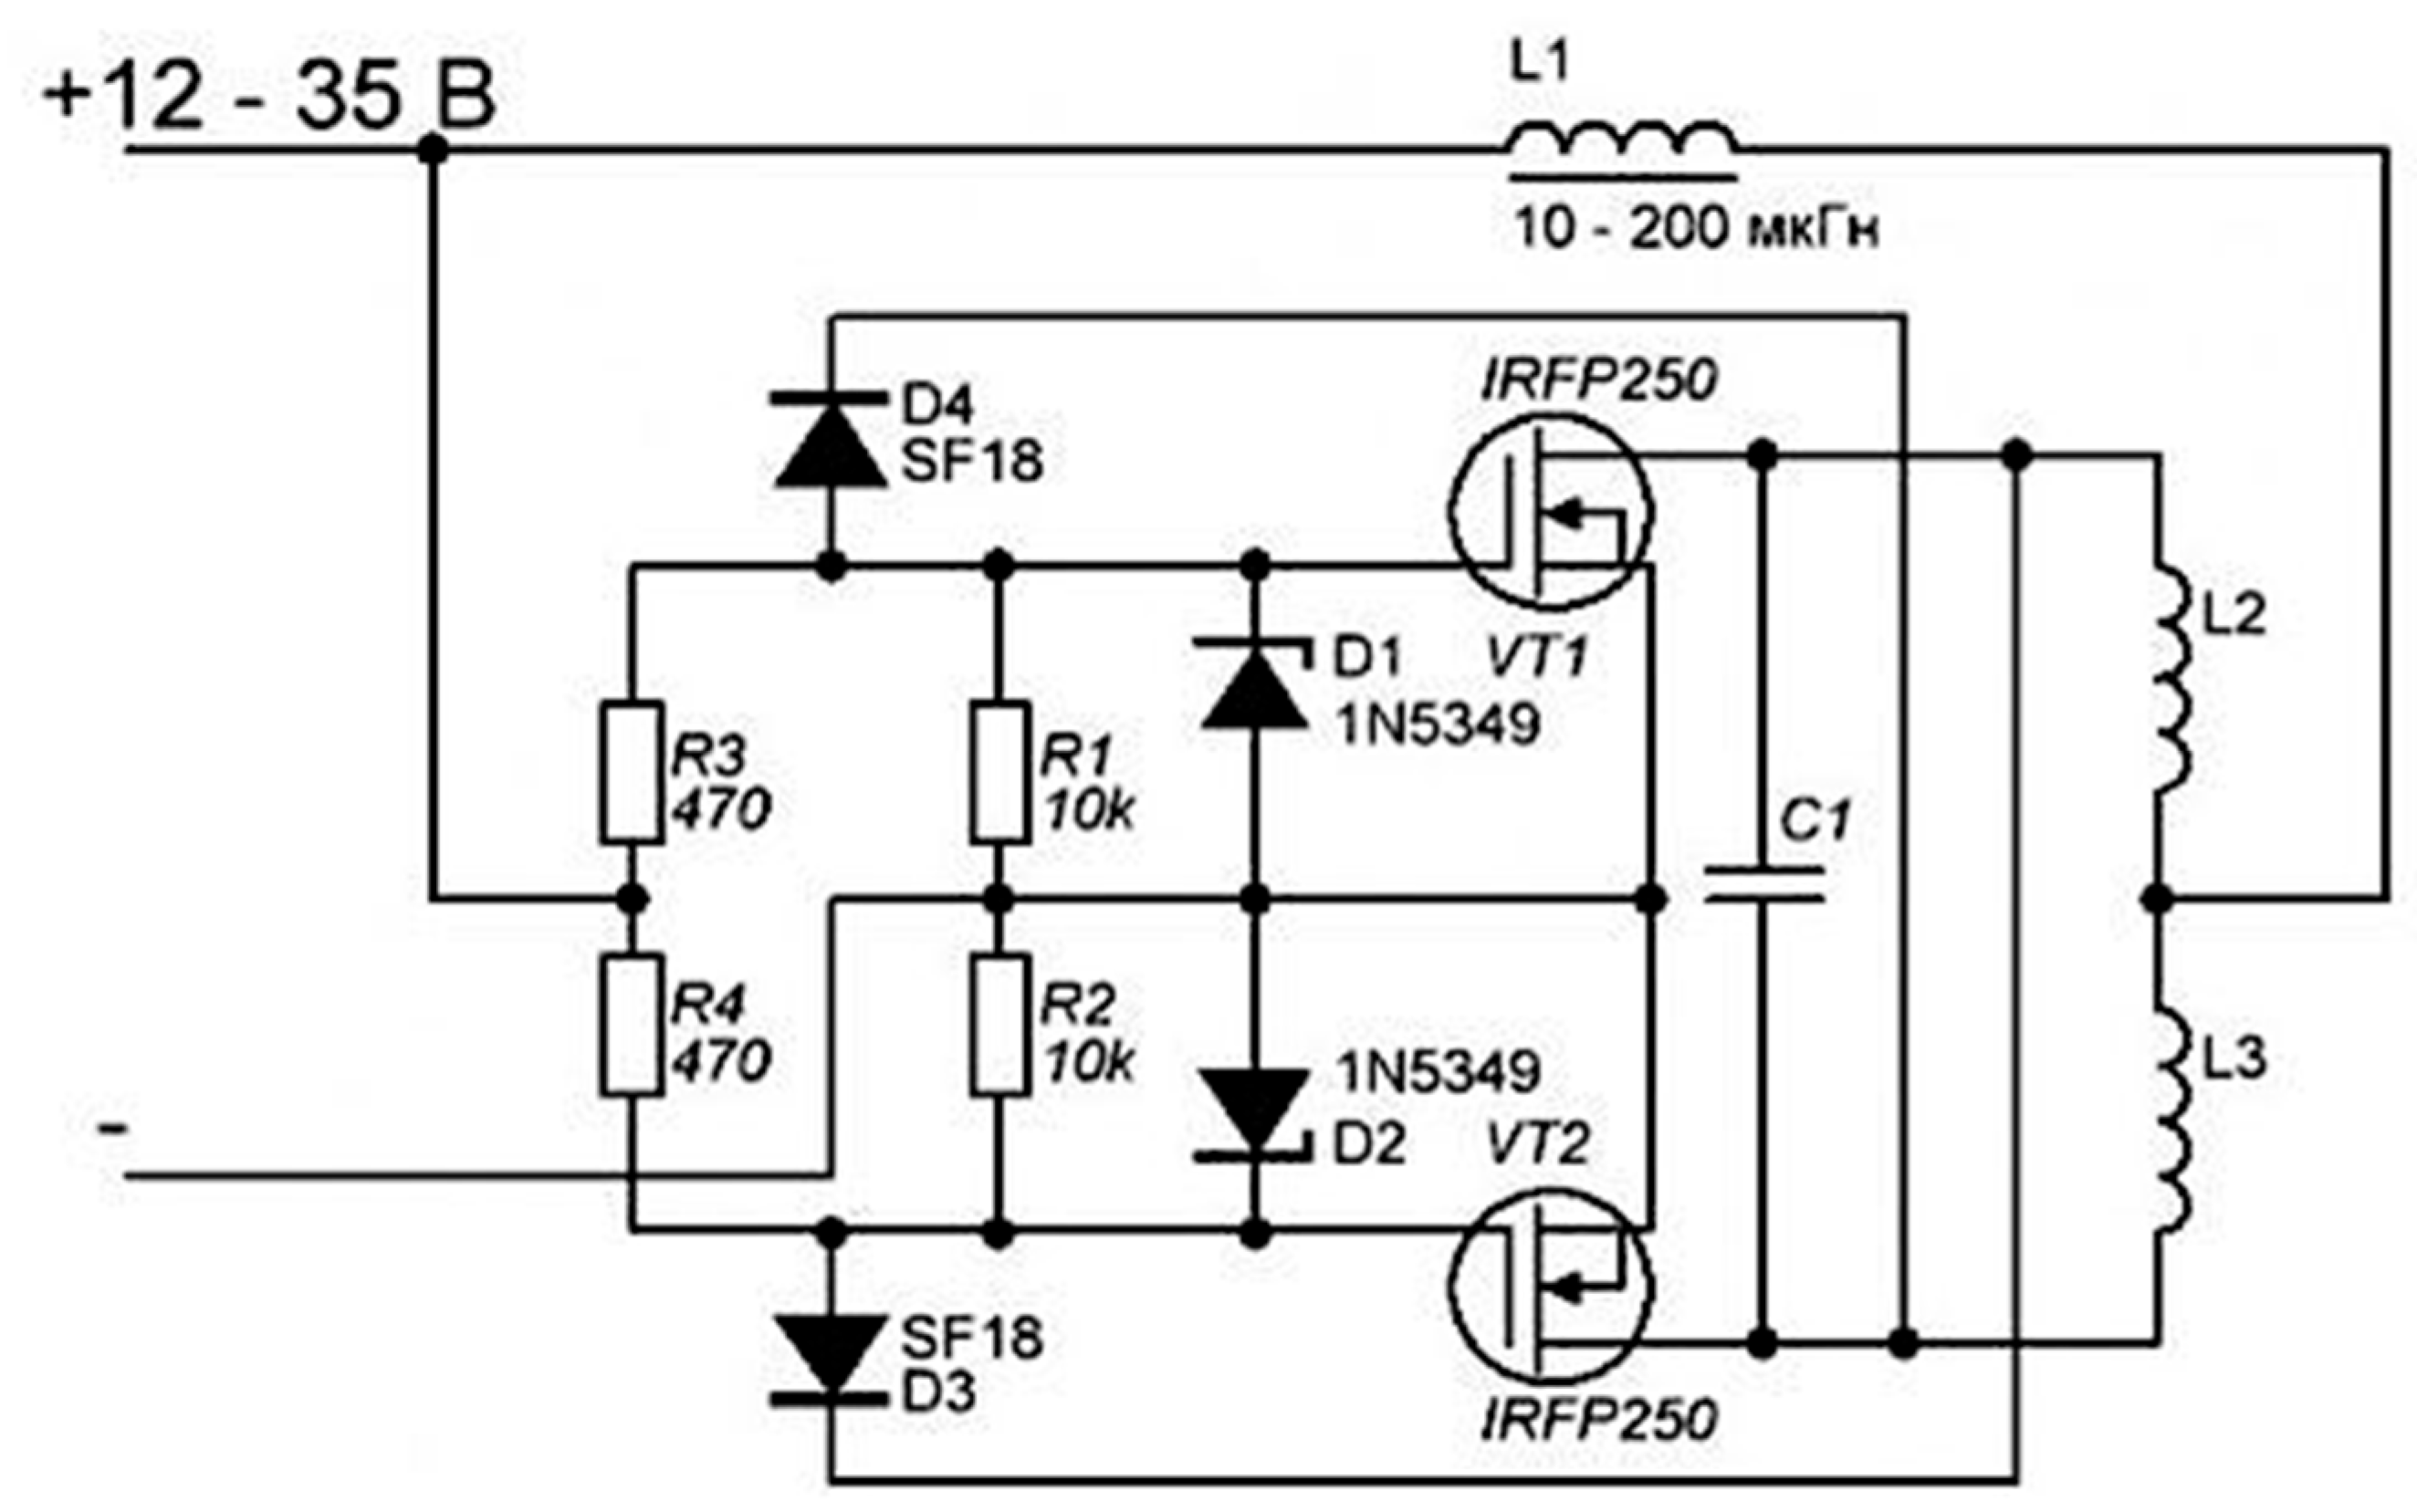
Figure 1. Induction heating circuit diagram zero voltage switching adopted in this work.
Biomedinformatics 04 00056 g001
Figure 2. Duration of the resonant interval tres against current I (A) for different values of capacitance Cs.
Biomedinformatics 04 00056 g002
Figure 3. Analysis of voltage and frequency across L1. (a) Variation in voltage as modelled by LTspice. (b) Frequency analysis showing resonance at approximately 1400 Hz.
Biomedinformatics 04 00056 g003
Figure 4. Helix model; (a) 3D representation of the IHC coil, (b) side view, (c) top view; all dimensions are in metres.
Biomedinformatics 04 00056 g004
Figure 5. The V/t and I/t plots for the circuit as measured across the coil with a 15 V DC drive voltage.
Biomedinformatics 04 00056 g005
Figure 6. The Irms AC-current measured in the coil for different DC drive voltages for the IHC, as measured by the current clamp meter.
Biomedinformatics 04 00056 g006
Figure 7. The H-field generated in the IHC coil, operating with an AC-current at 93 kHz and Irms 10 A. The image is a slice through the centre of the coil in the XY direction. The dimensions on the left and base are in metres. For the top image, the colour chart on the right ranges from 200 Am−1 to 1200 Am−1. For the bottom image, the colour chart on the right ranges from 40 dB to 60 dB.
Biomedinformatics 04 00056 g007aBiomedinformatics 04 00056 g007b
Figure 8. The average magnetic field intensity (Am−1) at the centre of the IHC coil, as calculated from the NEC-4 model with an AC frequency of 93 kHz.
Biomedinformatics 04 00056 g008
Figure 9. The temperature change in Kelvin (K) recorded in 3 mL of water with an MNP concentration of 60 mg mL−1 for the IHC using two different DC drive voltages (30 V and 15 V). The starting temperature was 298 K in both cases.
Biomedinformatics 04 00056 g009
Figure 10. The linear portion of the heating curve taken for the first 300 s.
Biomedinformatics 04 00056 g010
Disclaimer/Publisher’s Note: The statements, opinions and data contained in all publications are solely those of the individual author(s) and contributor(s) and not of MDPI and/or the editor(s). MDPI and/or the editor(s) disclaim responsibility for any injury to people or property resulting from any ideas, methods, instructions or products referred to in the content.