Article

An Open-Access Dataset of Hospitalized Cardiac-Arrest Patients: Machine-Learning-Based Predictions Using Clinical Documentation

by
Lahiru Theekshana Weerasinghe Rajapaksha
1,*,†,
Sugandima Mihirani Vidanagamachchi
1,†,
Sampath Gunawardena
2,† and
Vajira Thambawita
3,*,†
1
Department of Computer Science, University of Ruhuna, Matara 81000, Sri Lanka
2
Department of Physiology, Faculty of Medicine, University of Ruhuna, Galle 80000, Sri Lanka
3
Department of Holistic Systems, SimulaMet, 0167 Oslo, Norway
*
Authors to whom correspondence should be addressed.
These authors contributed equally to this work.
BioMedInformatics 2024, 4(1), 34-49; https://doi.org/10.3390/biomedinformatics4010003
Submission received: 20 August 2023 / Revised: 30 September 2023 / Accepted: 19 December 2023 / Published: 27 December 2023
(This article belongs to the Section Methods in Biomedical Informatics)

Abstract

:
Cardiac arrest is a sudden loss of heart function with serious consequences. In developing countries, healthcare professionals use clinical documentation to track patient information. These data are used to predict the development of cardiac arrest. We published a dataset through open access to advance the research domain. While using this dataset, our work revolved around generating and utilizing synthetic data by harnessing the potential of synthetic data vaults. We conducted a series of experiments by employing state-of-the-art machine-learning techniques. These experiments aimed to assess the performance of our developed predictive model in identifying the likelihood of developing cardiac arrest. This approach was effective in identifying the risk of cardiac arrest in in-patients, even in the absence of electronic medical recording systems. The study evaluated 112 patients who had been transferred from the emergency treatment unit to the cardiac medical ward. The developed model achieved 96% accuracy in predicting the risk of developing cardiac arrest. In conclusion, our study showcased the potential of leveraging clinical documentation and synthetic data to create robust predictive models for cardiac arrest. The outcome of this effort could provide valuable insights and tools for healthcare professionals to preemptively address this critical medical condition.

1. Introduction

Dysfunction in the heart’s conduction system frequently leads to cardiac arrest, which results in the heart’s inability to pump blood efficiently. Ventricular fibrillation is the primary cause of cardiac arrest in 65–80% of cases [1]. Numerous heart-related conditions can lead to cardiovascular complications, including coronary artery disease, cardiomyopathy, inherited conditions, congenital heart disease, heart valve disease, acute myocarditis, and conduction disorders, such as long QT syndrome. However, many patients may not recognize or ignore symptoms, with chest pain being the most common indicator of potential cardiac issues.
Ischemic coronary illness causes over 70% of cardiac arrests and is the leading cause of cardiac dysfunction. Risk factors include hypertension, hyperlipidemia, diabetes, smoking, age, and a family history of coronary disease [2]. In Sri Lanka, cardiovascular diseases (CVD) accounted for a high mortality rate of 534 deaths per 100,000 [3]. The risk of cardiac arrest within the first 24 h after a heart attack was 20–30%, and the survival rate was around 25%, even with proper medical treatment.
Timely help and treatment are crucial for survival in sudden cardiac arrest cases. Early warning systems (EWSs) could help identify patients at an increased risk of deterioration and subsequent death due to cardiac arrest [4]. Patients admitted to the intensive care unit (ICU) due to sudden cardiac arrest have frequently exhibited symptoms of clinical deterioration hours prior to the event, which could have been detected early using an early warning system (EWS). A study carried out by Marinkovic [5] demonstrated that patients who had higher EWS scores before having a cardiac arrest experienced the worst outcomes. This highlighted the need for an EWS for the early detection and treatment of cardiac arrest in order to reduce the mortality rate of this condition. Therefore, an EWS was designed based on patients’ vital signs to aid this process [6].
According to previous studies, single parameter and aggregate weighted track and trigger systems (AWTTS) were used by multiple EWSs [7]. Many EWSs have been developed using statistical methods and linking observations. Some have been developed based on clinical consensus, and there has been no common ground of agreement regarding whether one EWS’s performance was better than another EWS’s [8].
In machine-learning and deep-learning domains, the deep-learning–based early warning system (DEWS) model was stated as the first model, which was developed using a deep-learning technique to predict cardiac arrest [9]. When exploring further, it was observed that machine learning and AI technology have played a pivotal role in the early prediction of cardiac arrest [9,10,11,12,13,14,15,16,17,18,19,20].
In low- to middle-income countries (LMIC), The effectiveness of using an EWS developed in high-income countries (HIC) may be compromised, as the algorithms may not be sufficiently sensitive and specific to identify patients at risk of deterioration [21]. Furthermore, most of the risk algorithms have been based on European populations, and it was unclear whether they would be valid for South Asian populations [22]. Although all the previously mentioned machine-learning models utilized electronic medical records, it is essential to note that LMIC countries like Sri Lanka remain unfamiliar with electronic medical records (EMR) beyond clinical documentation, making it challenging to find data and models that can meet their specific requirements.
Therefore, the research aim of this study was to develop a model that considered these unique needs and limitations by making several important contributions:
  • Publishing an open-access bed-head-ticket dataset.
  • Introducing a machine-learning model that could predict the risk of fatal cardiac arrest and showed improved results.
  • Analyzing the dataset with machine-learning models to compare the usability of the dataset.
Repository links

2. Materials and Methods
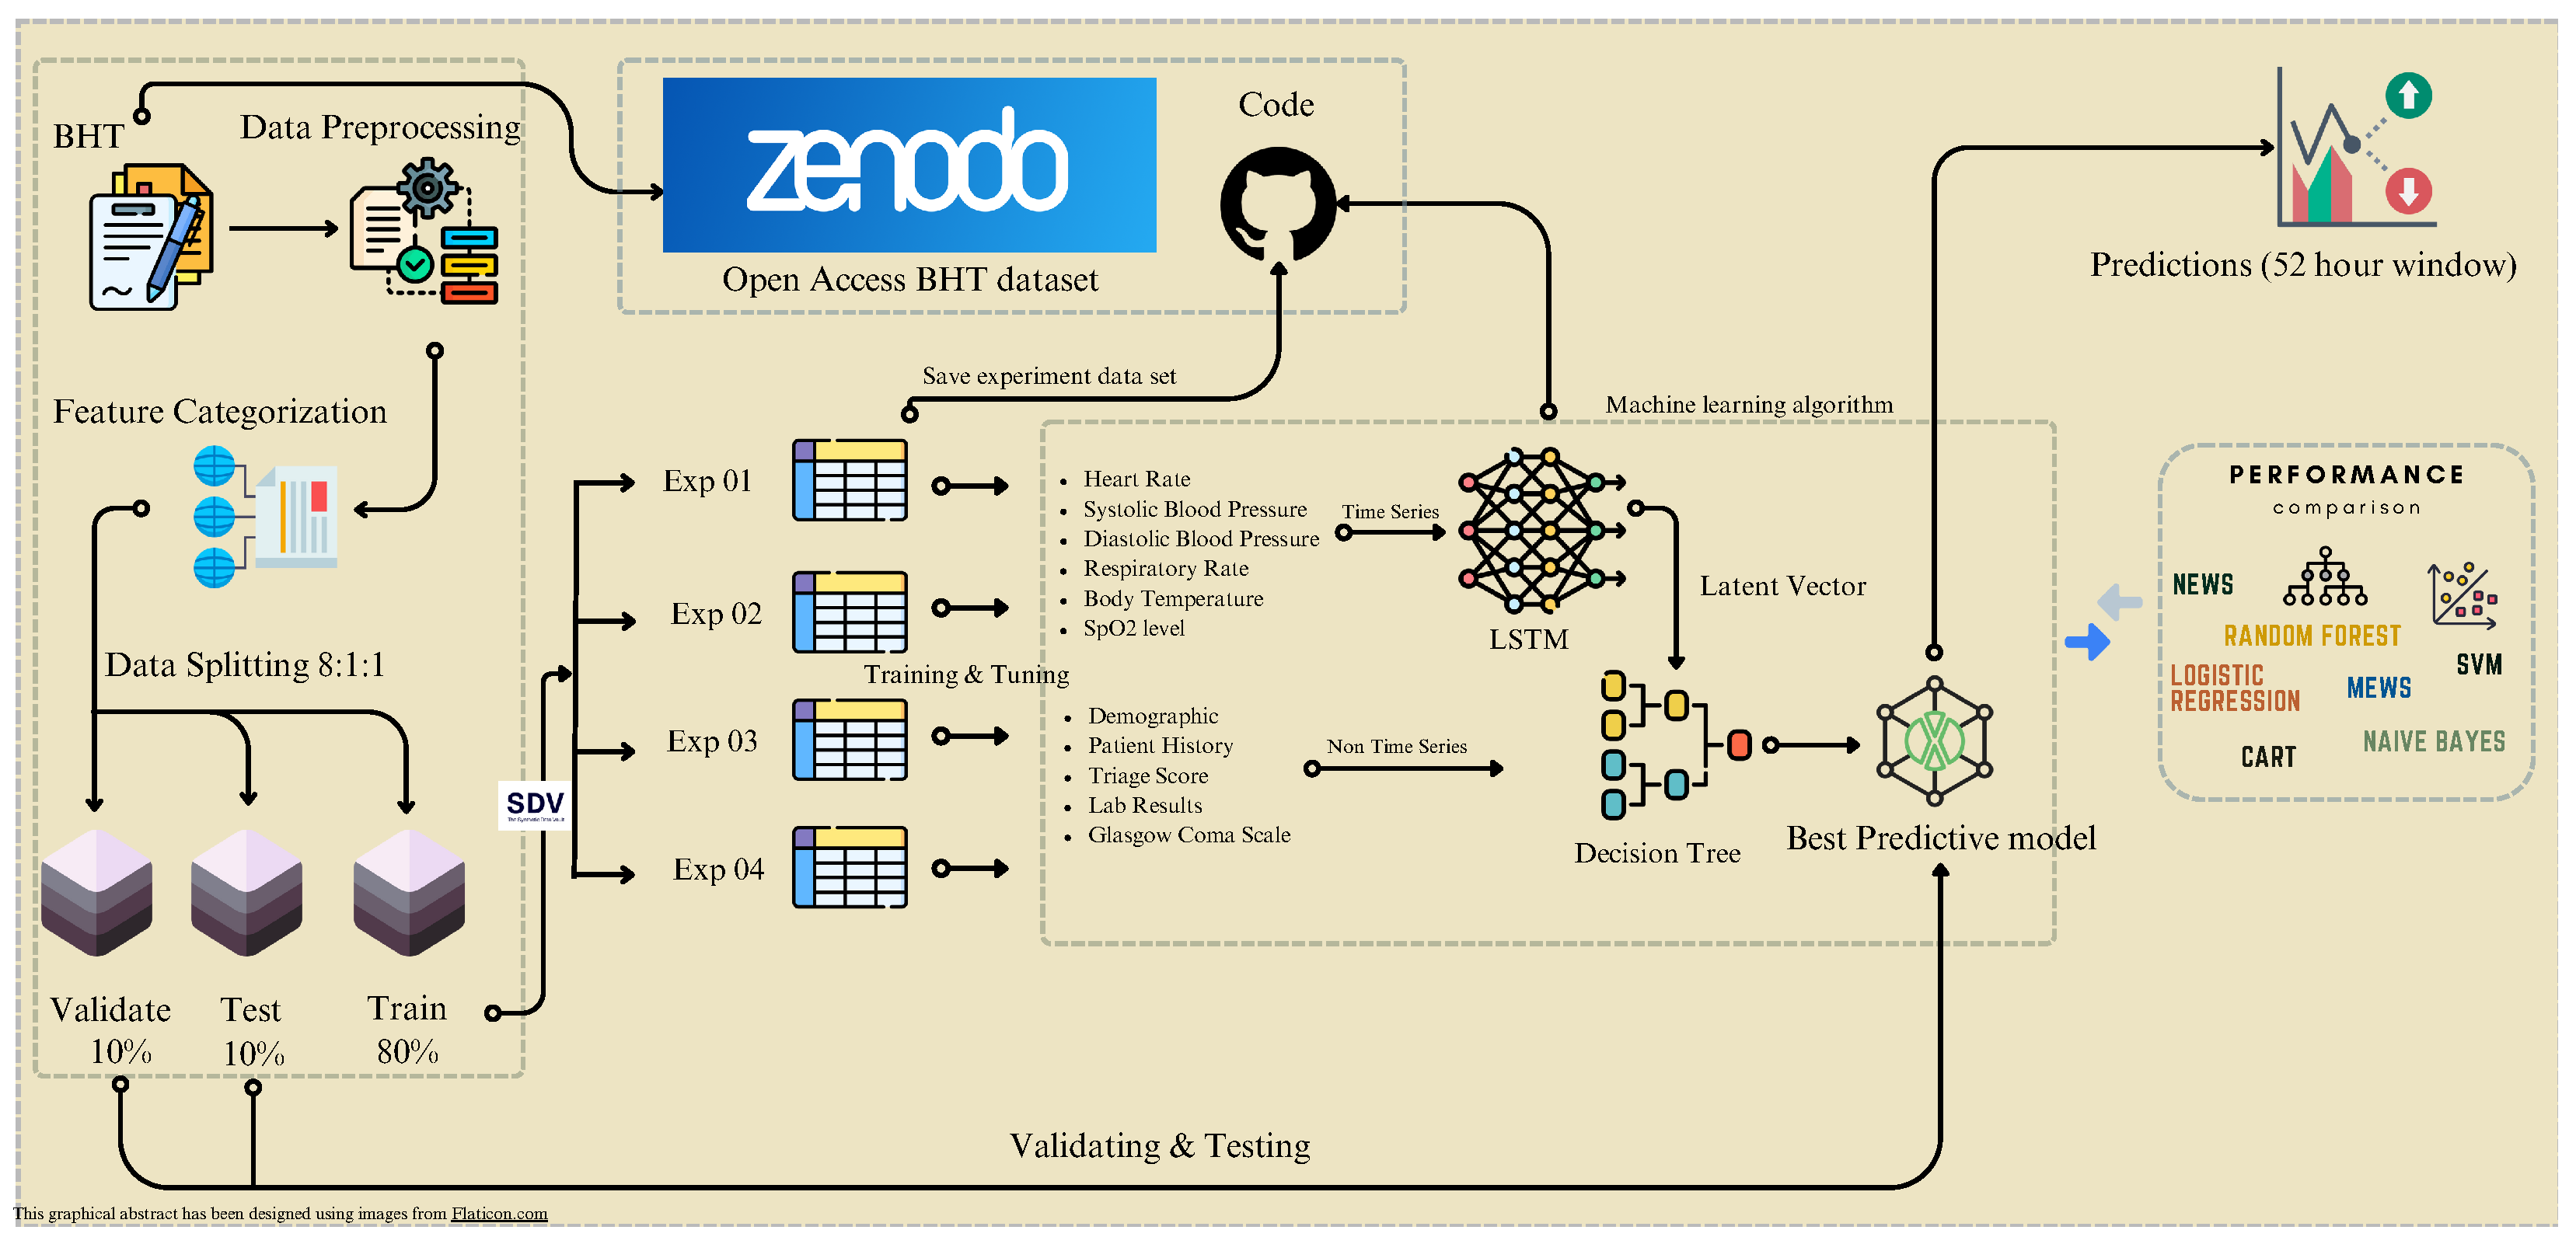
2.1. Methodology

To begin, Figure 1 illustrates a detailed workflow that explains different stages and procedures undertaken during our study. The research was designed as a retrospective cohort study, focusing on patients admitted to the cardiac ward between 13 August 2018 and 6 February 2020, at the Teaching Hospital, Karapitiya (THK), Galle, Sri Lanka. The study population included patients who had been transferred to the cardiac ward from the emergency treatment unit (ETU), excluding pediatric patients. A total of 112 patients, aged 15–89 years, were included in the study, with 82 male patients and 30 female patients. The bed head ticket (BHT) dataset is available at Zenodo (https://zenodo.org/record/7603772), licensed as Creative Commons Attribution 4.0 International (CC BY 4.0) [23].
Ethical clearance was obtained from the Ethics Review Committee of the Faculty of Medicine, University of Ruhuna, Galle, Sri Lanka, and the study adhered to the relevant guidelines and regulations established by the committee. Permission to access data was granted by the Director of the Teaching Hospital, Karapitiya. As this was a retrospective study, obtaining informed consent from all subjects was not applicable.
Data collection involved extracting information from the BHTs in the hospital’s record room. Due to the absence of electronic clinical data, each BHT was manually examined to collect the necessary data. The BHTs contained information on the patient’s health status, clinical history, management actions, investigations, treatments, progress, and diagnosis.
The extracted BHT data were categorized into five main categories: demographic features, examinations, lab reports, patient histories, and outcomes (Figure 2). The extracted features, observed at a rate of over 60% (Figure 3) within the study group, were selected for model development.

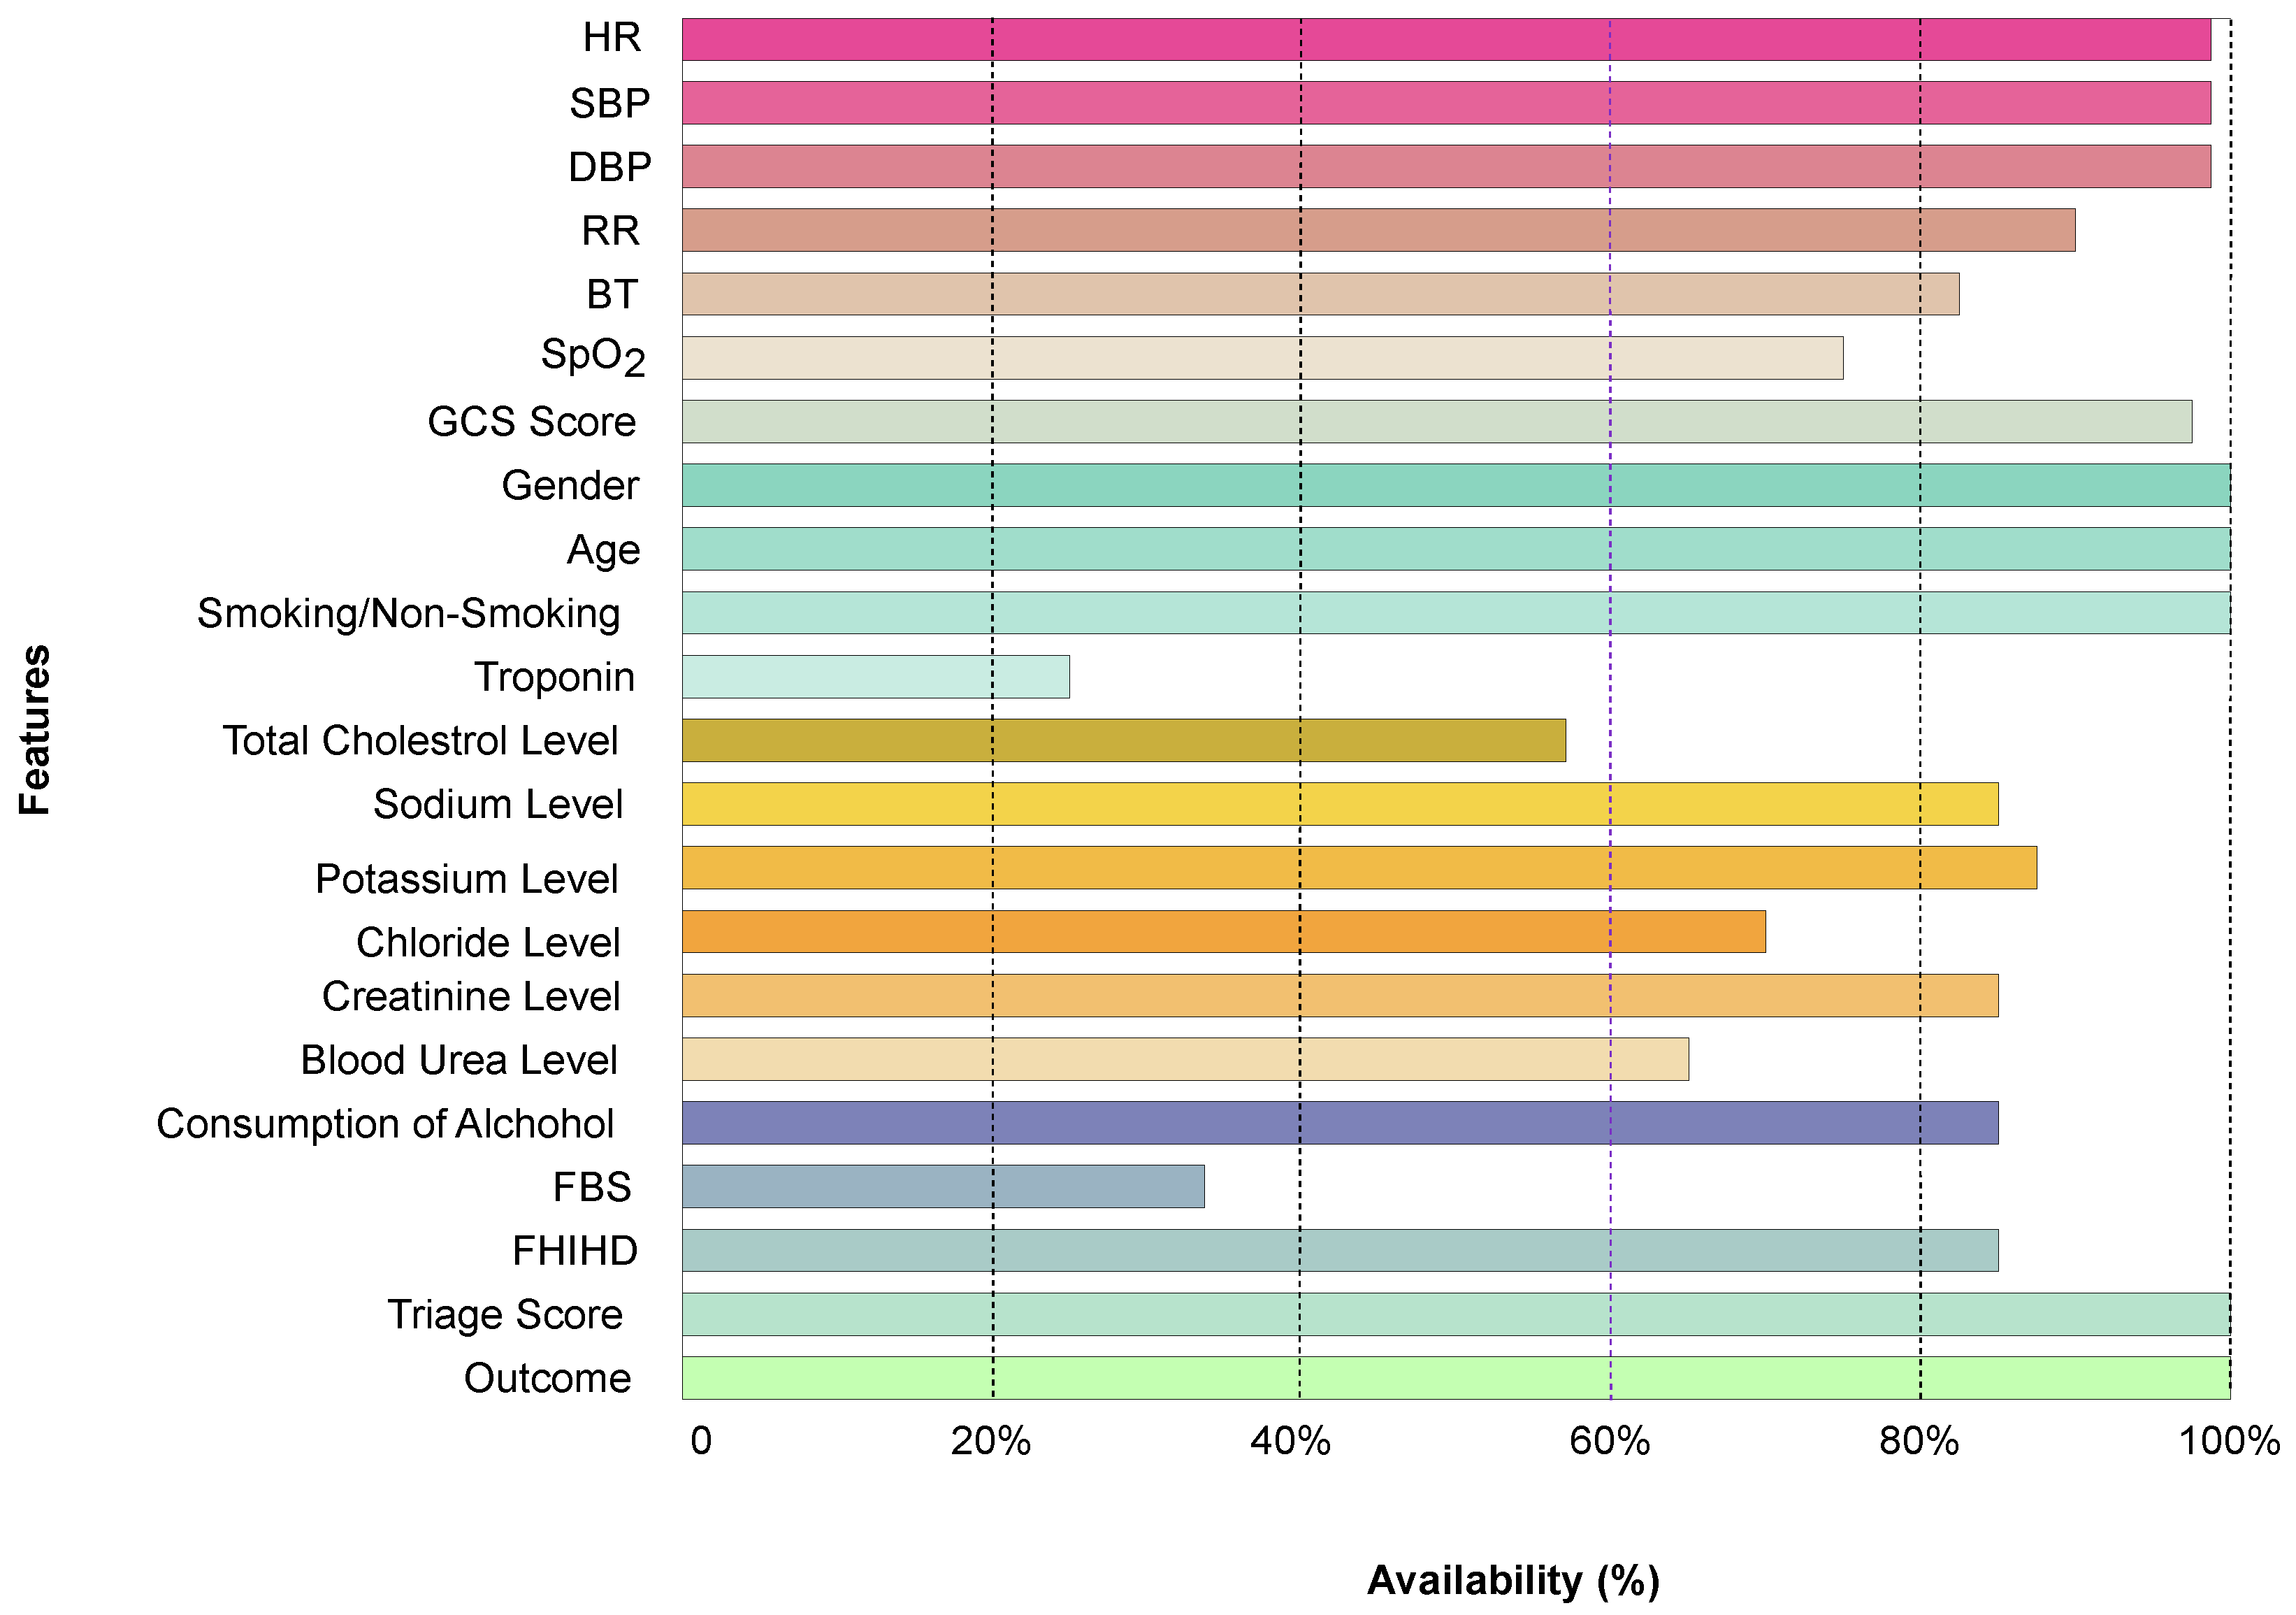
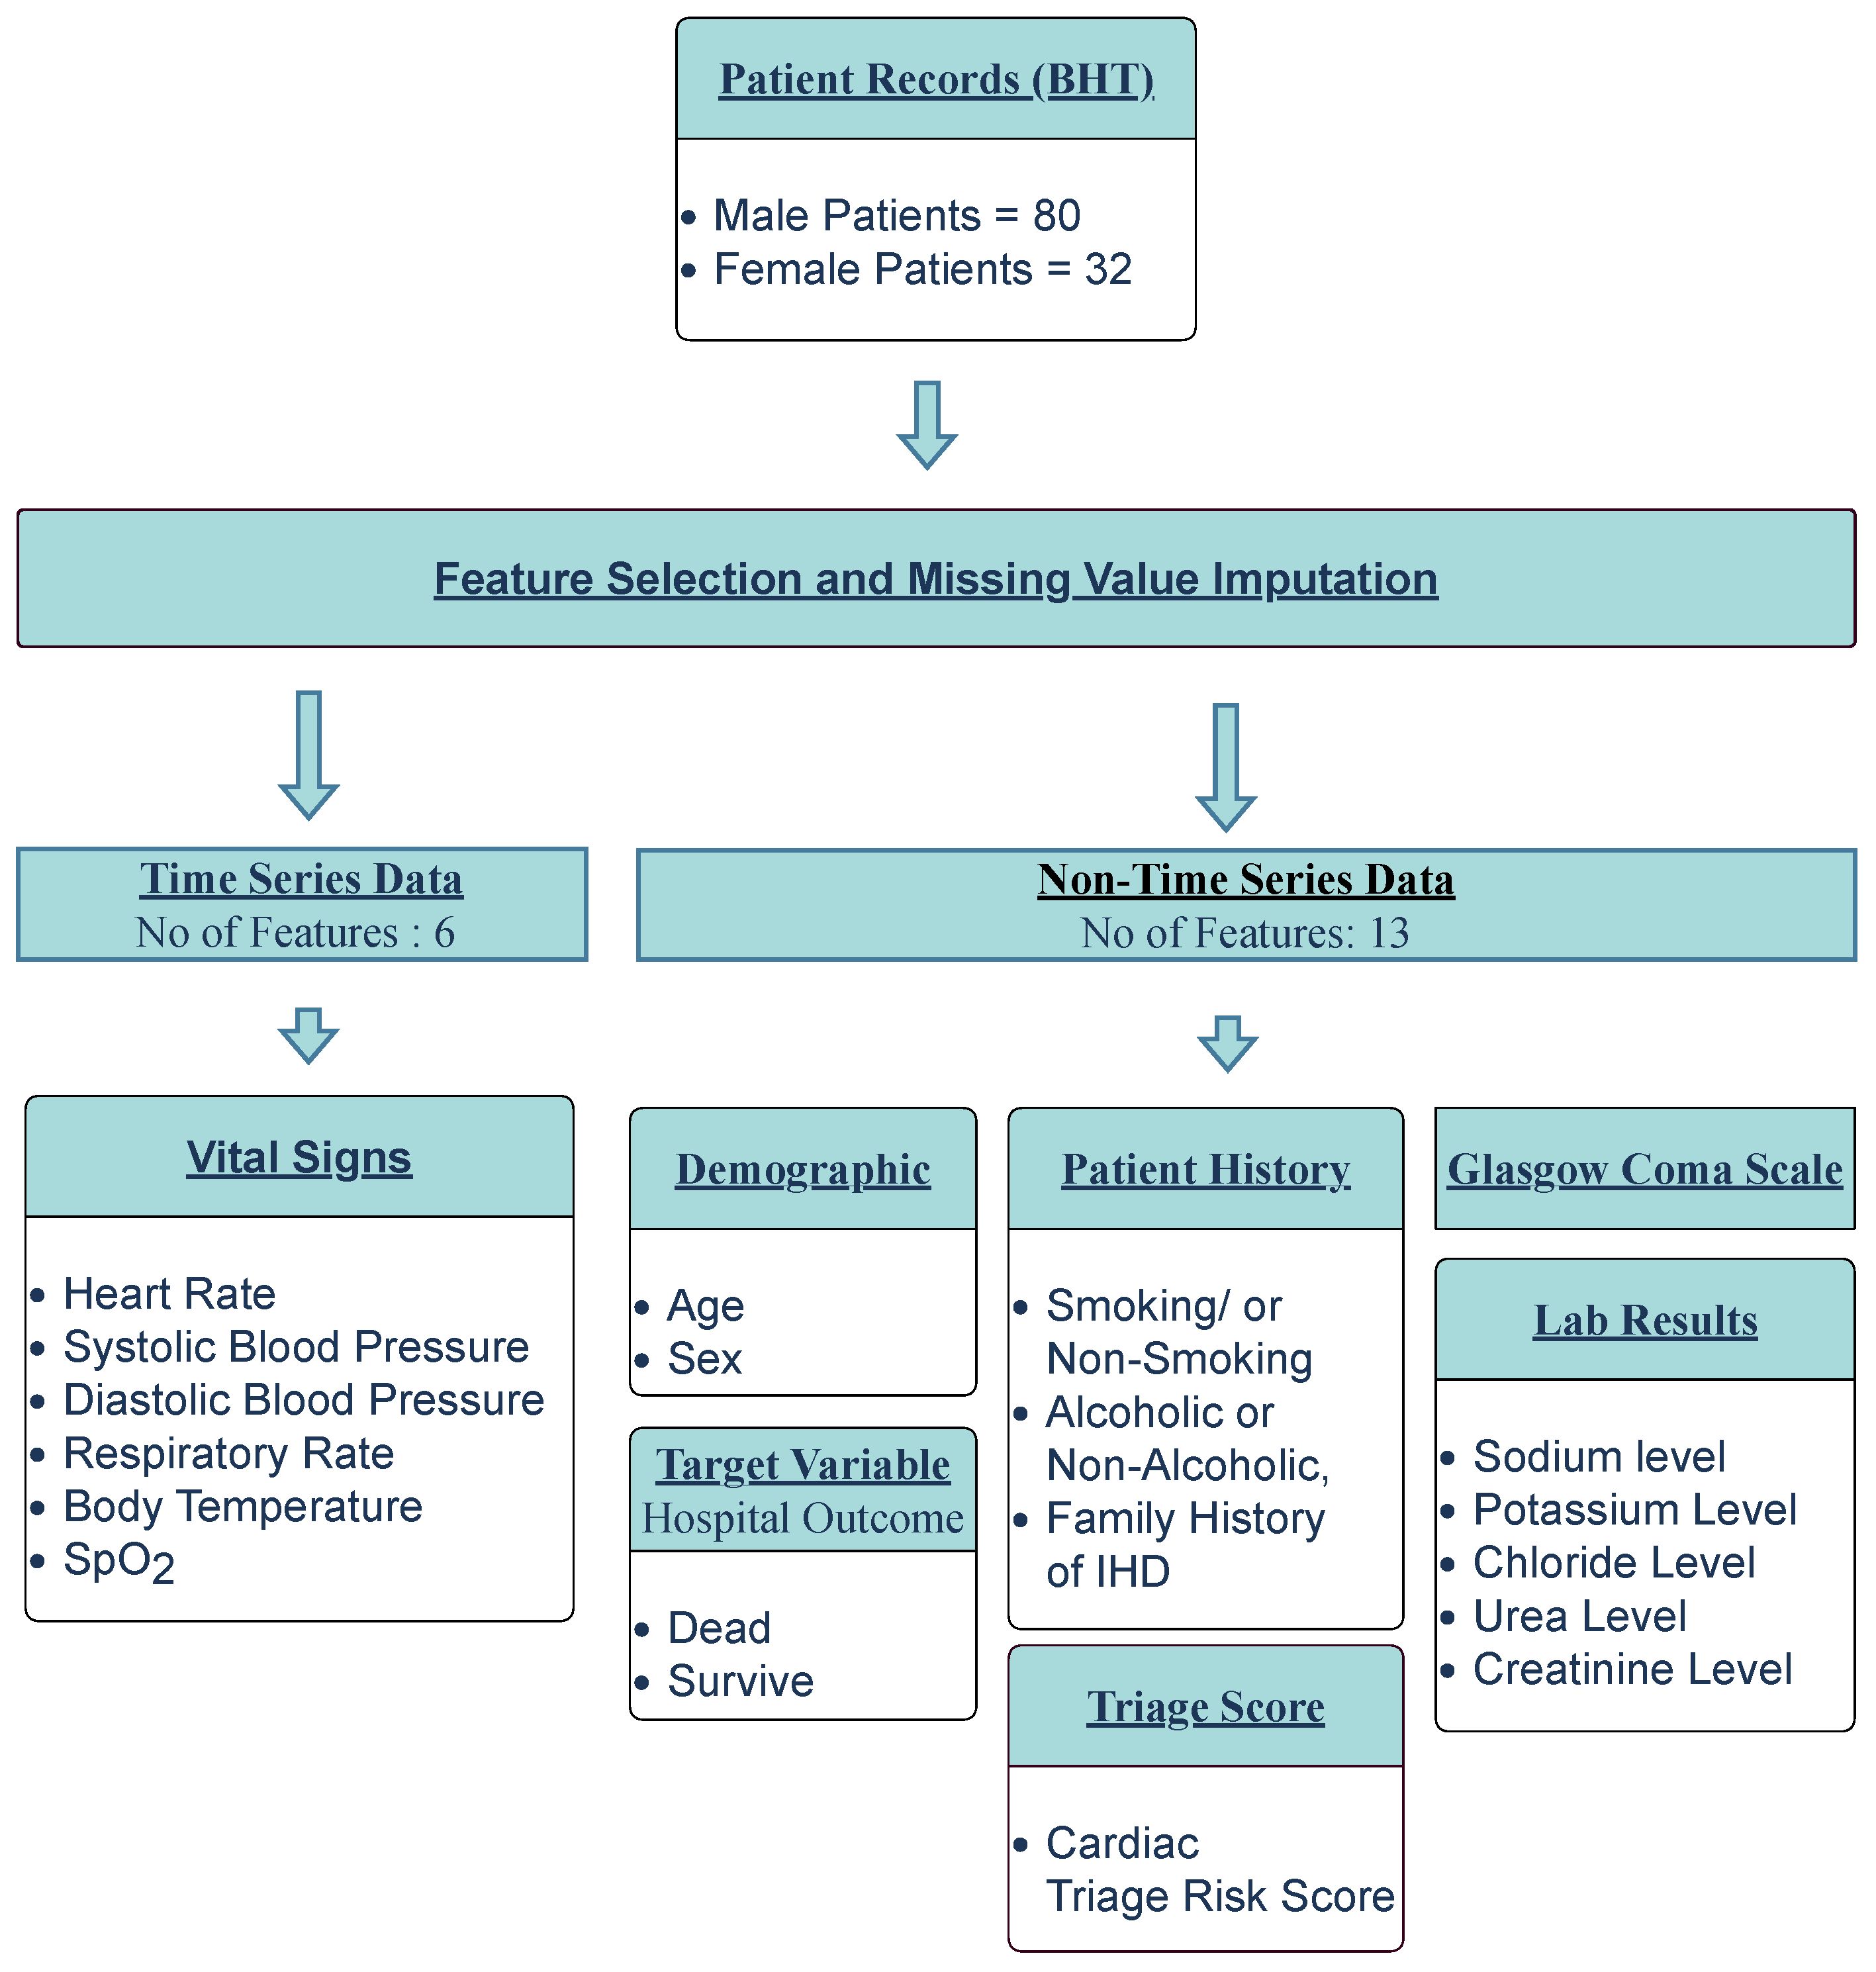
2.2. Data Pre-Processing

As illustrated in Figure 4, the extracted clinical data were primarily divided into two categories: time-series data and non-time-series data. The time-series data consisted of patient information recorded in relation to time, while non-time-series data encompassed the remaining data. The clinical dataset contained 21 features: age, heart rate (HR), systolic blood pressure (SBP), diastolic blood pressure (DBP), respiratory rate (RR), body temperature (BT), blood oxygen saturation level (SpO2), level of consciousness, troponin level, total cholesterol level, fasting blood sugar (FBS), serum electrolytes (sodium, potassium, chloride), urea level, creatinine level, triage score (risk score upon admission), alcohol consumption, smoking status, family history of ischemic heart diseases (FHIHD), and hospital outcome.
Of the 21 features, 19 were selected for inclusion, while 3 were excluded from the final feature list. Troponin level, total cholesterol level, and fasting blood sugar level, which could be used to detect co-morbidities in patients, were excluded due to insufficient records in the BHTs for the majority of patients. Data pre-processing consisted of two steps. First, 19 common features were selected, including the patient hospital outcome (target variable). Second, missing value imputation was performed for the selected features. In cases of missing data for a particular feature in a patient, the data value obtained most recently to that missing value was considered, or, if not available, the median value of the data was used.
When considering time-series data (SBP, DBP, HR, RR, BT, SpO2), patients were monitored hourly throughout their hospital stay. In the selected dataset, patients were monitored for at least 1 h and a maximum of 266 h (11 days). A suitable time step (time window) for observation was chosen within this range. The time step was determined based on the average observation time of a patient (52 h). This 52-hour observational time window was considered the prediction window of the model. For the non-time-series data, results from the patient’s lab tests on the hospital admission date were also considered.

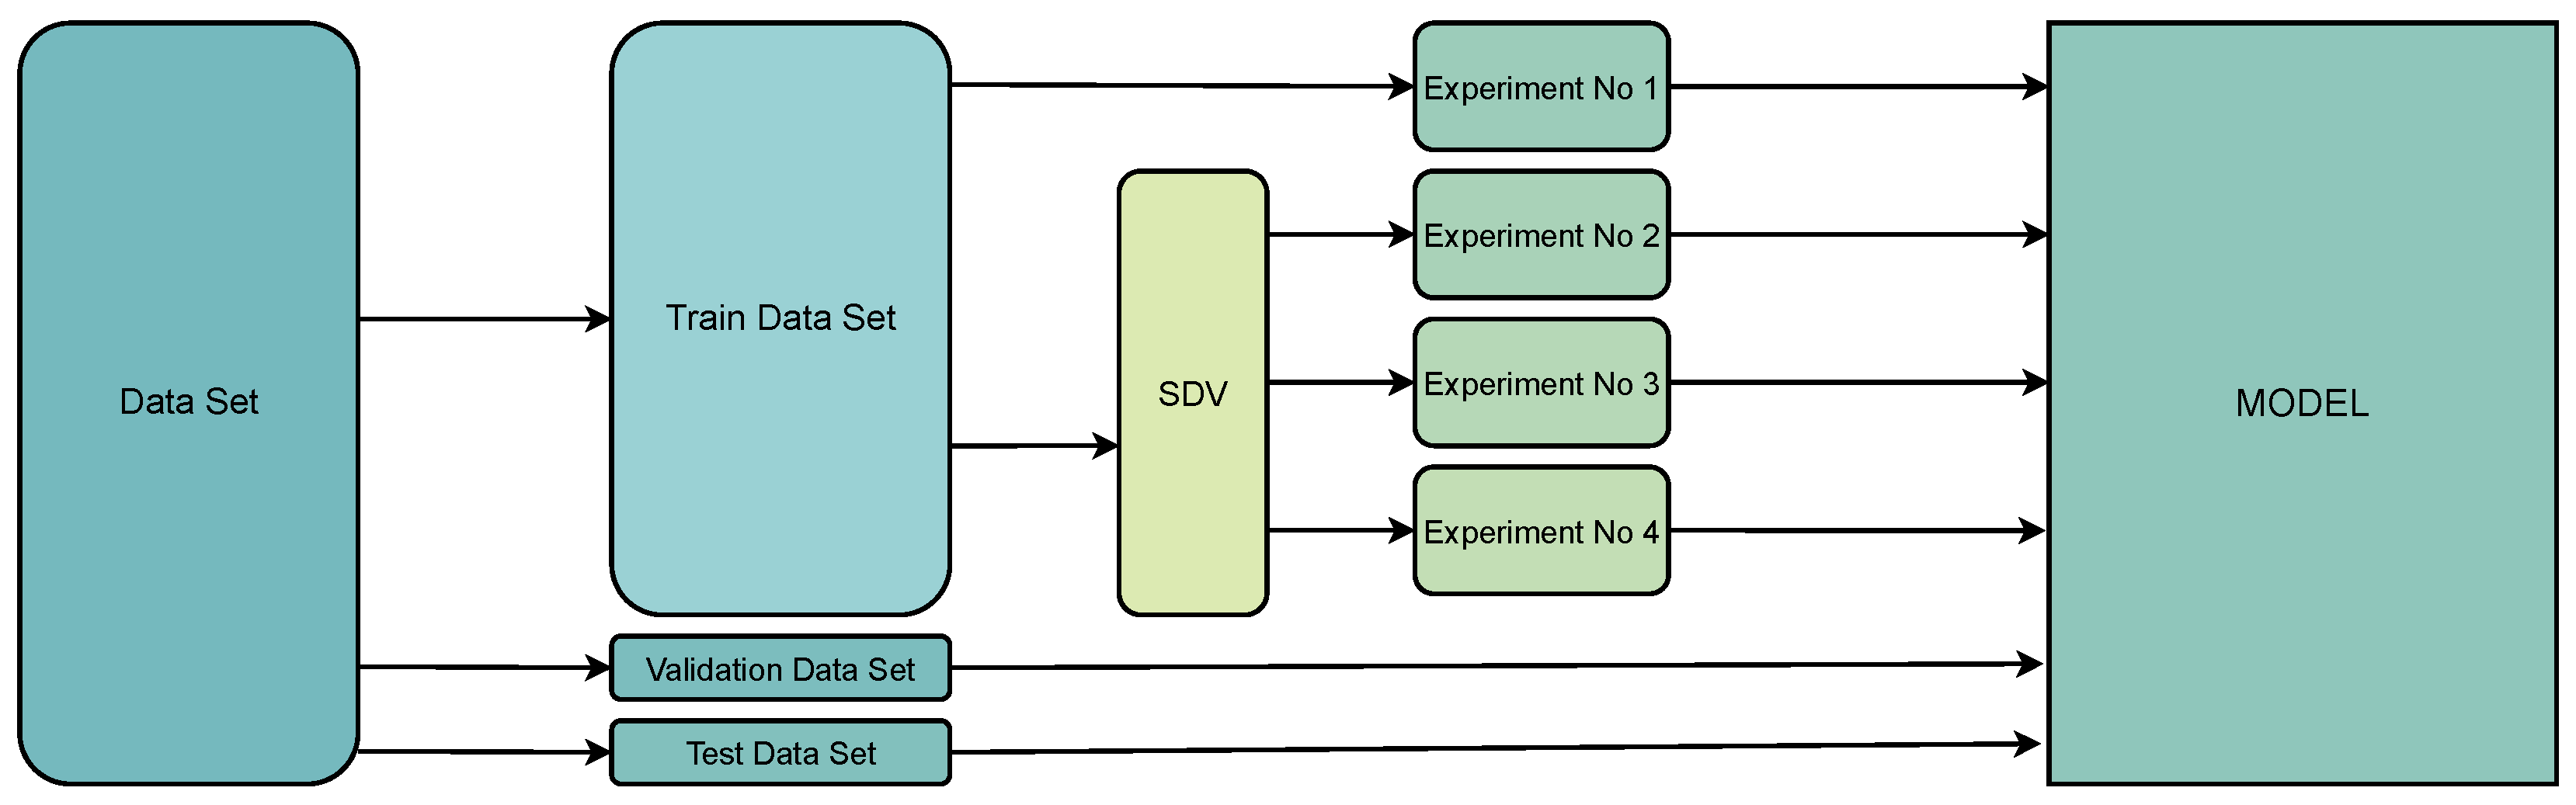
2.3. Data Division and Preparation

After pre-processing the dataset, we partitioned the dataset into three distinct subsets at a ratio of 8:1:1, namely the training set, testing set, and validation set. Then, the training dataset was further enhanced through the infusion of synthetic data generated by the SDV (Figure 5). The goal of the SDV was to build generative models of relational databases [24]. By incorporating its capability of creating artificial instances that could mimic the statistical properties of the original dataset, we expanded our training data, fostering greater diversity and aiding the model’s ability to capture complex patterns.
When generating the synthetic data for experiments 2–4, our consistent aim was to achieve a balanced ratio of survived-patient data to dead-patient data at 1:1, ensuring equal representation (Table 1).

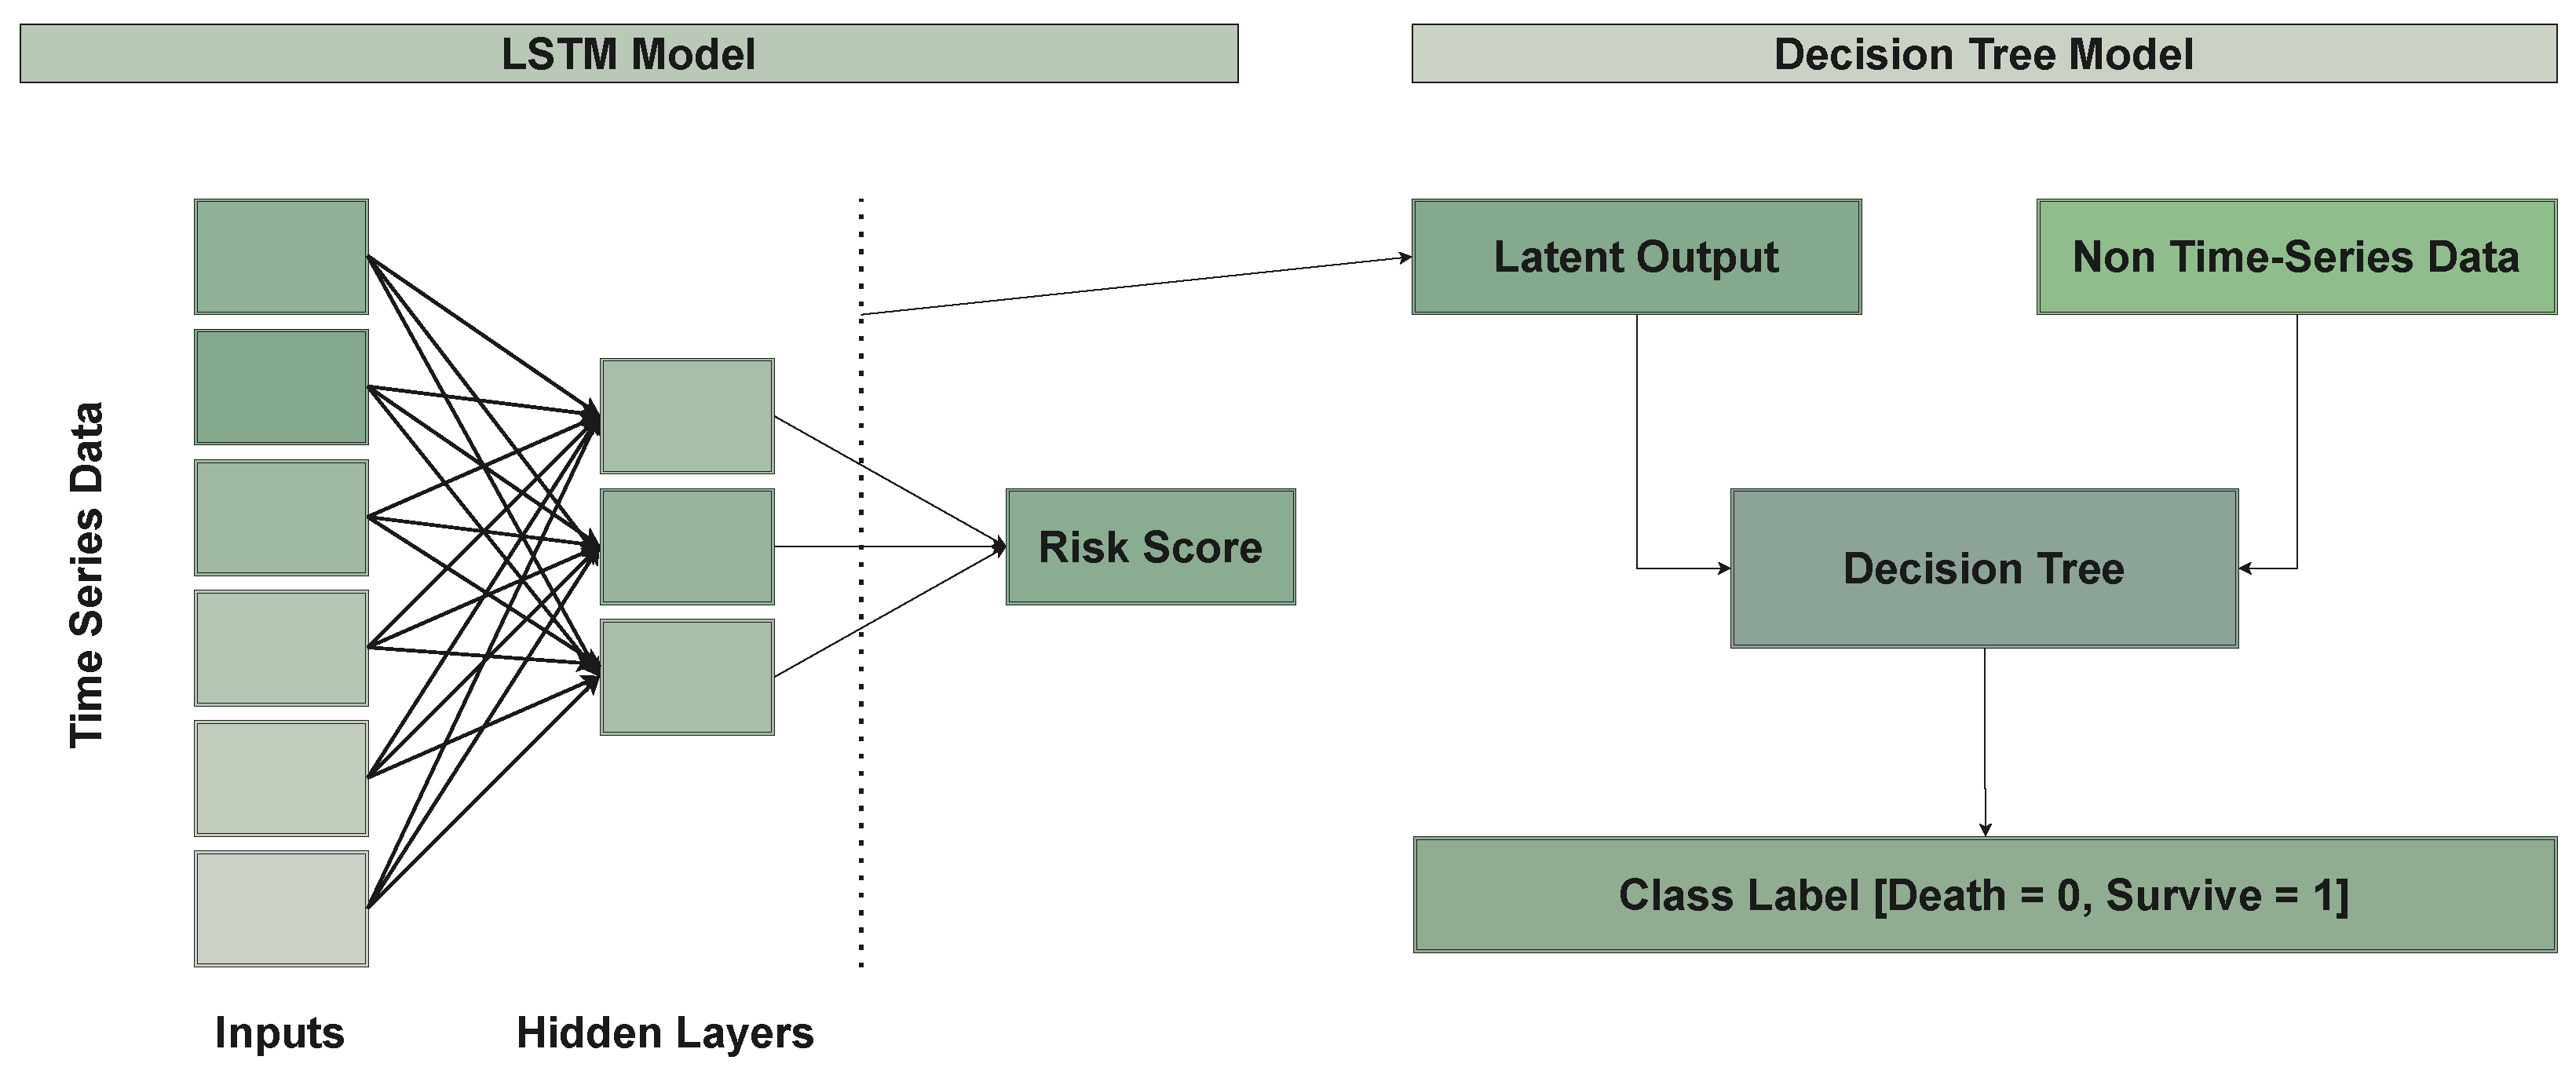
2.4. Model Architecture

Integrating artificial intelligence into clinical practice has led to numerous studies focused on predicting adverse events, such as cardiac arrest, before they occur. Evidence from these studies suggested that deep-learning models were more efficient at identifying high-risk patients than existing EWSs [25]. The Recurrent neural network (RNN) models were particularly well-suited for handling temporal sequence data. Among the RNN variants, long short-term memory (LSTM) demonstrated remarkable performance among various sequence-based tasks [26]. Recent studies have also shown that deep-learning models employing RNN architectures with LSTM outperformed clinical prediction models developed using logistic regression [27,28]. Consequently, we chose the LSTM structure to model the temporal relationships within the data extracted from the BHTs.

2.4.1. LSTM Model

The deep-learning cardiac arrest prediction model (DLCAPM) consisted of a LSTM model that was designed to handle time-series data, followed by a dense layer. During the model’s development, we employed a sigmoid activation function for the dense layer, the Adam optimizer with default parameters, and binary-cross entropy as the loss function. The complete dataset was divided into 20% for validation and testing and 80% for training. Inputs to the LSTM model included SBP, DBP, HR, RR, BT, and SpO2 levels. The input data fed into the LSTM comprised a three-dimensional array as no. of patients × time step × no. of input features (5030, 6798, 9572, and 15,159 patient record sequences, respectively), as illustrated in Figure 6. The first phase of the model handled temporal data, while the second phase combined the results of the time-series data with the non-time-series data. The combined data were then input into the decision-tree model to predict the final outcome based on the model’s results.

2.4.2. Decision-Tree Model

In the medical domain, the clinical practice involves continuous decision-making, where optimal decision-making strives to maximize effectiveness and minimize loss [29]. Clinical decision analysis (CDA) highlighted the significant role of decision trees in this process [30]. Among the five methodologies employed for decision-making, designing a decision tree was considered one [31]. Due to their reliability, effectiveness, and high accuracy in decision-making, decision trees have been widely utilized in various medical decision-making studies [32]. These factors led us to select the decision tree as the model to handle non-time-series data, including the LSTM outcome. The LSTM model was designed to generate a risk score based on time-series data acquired within a time window of 52 h.

2.4.3. Latent Vector Space

Latent vector space was employed in machine learning to analyze data that could be mapped to a latent space, where similar data points were in close proximity. In simpler terms, it could be described as a representation of compressed data. This latent space representation retained all the essential information required to represent the original data points, thereby facilitating data analysis. Latent space representations have been utilized to transform more complex forms of raw data, such as images and videos, into simpler representations, a concept implemented in representation learning.
In the context of the LSTM model, the latent vector space served as an input parameter for the decision-tree model. The decision-tree inputs were a combination of non-time-series data, including demographic information, lab results, triage score, Glasgow-coma-scale (GCS) values, and patient histories, as well as the latent output of the LSTM model (Figure 7). This approach allowed for a more comprehensive analysis by integrating both time-series and non-time-series data, enhancing the model’s decision-making capabilities.

2.4.4. Handling the Data-Imbalance Problem
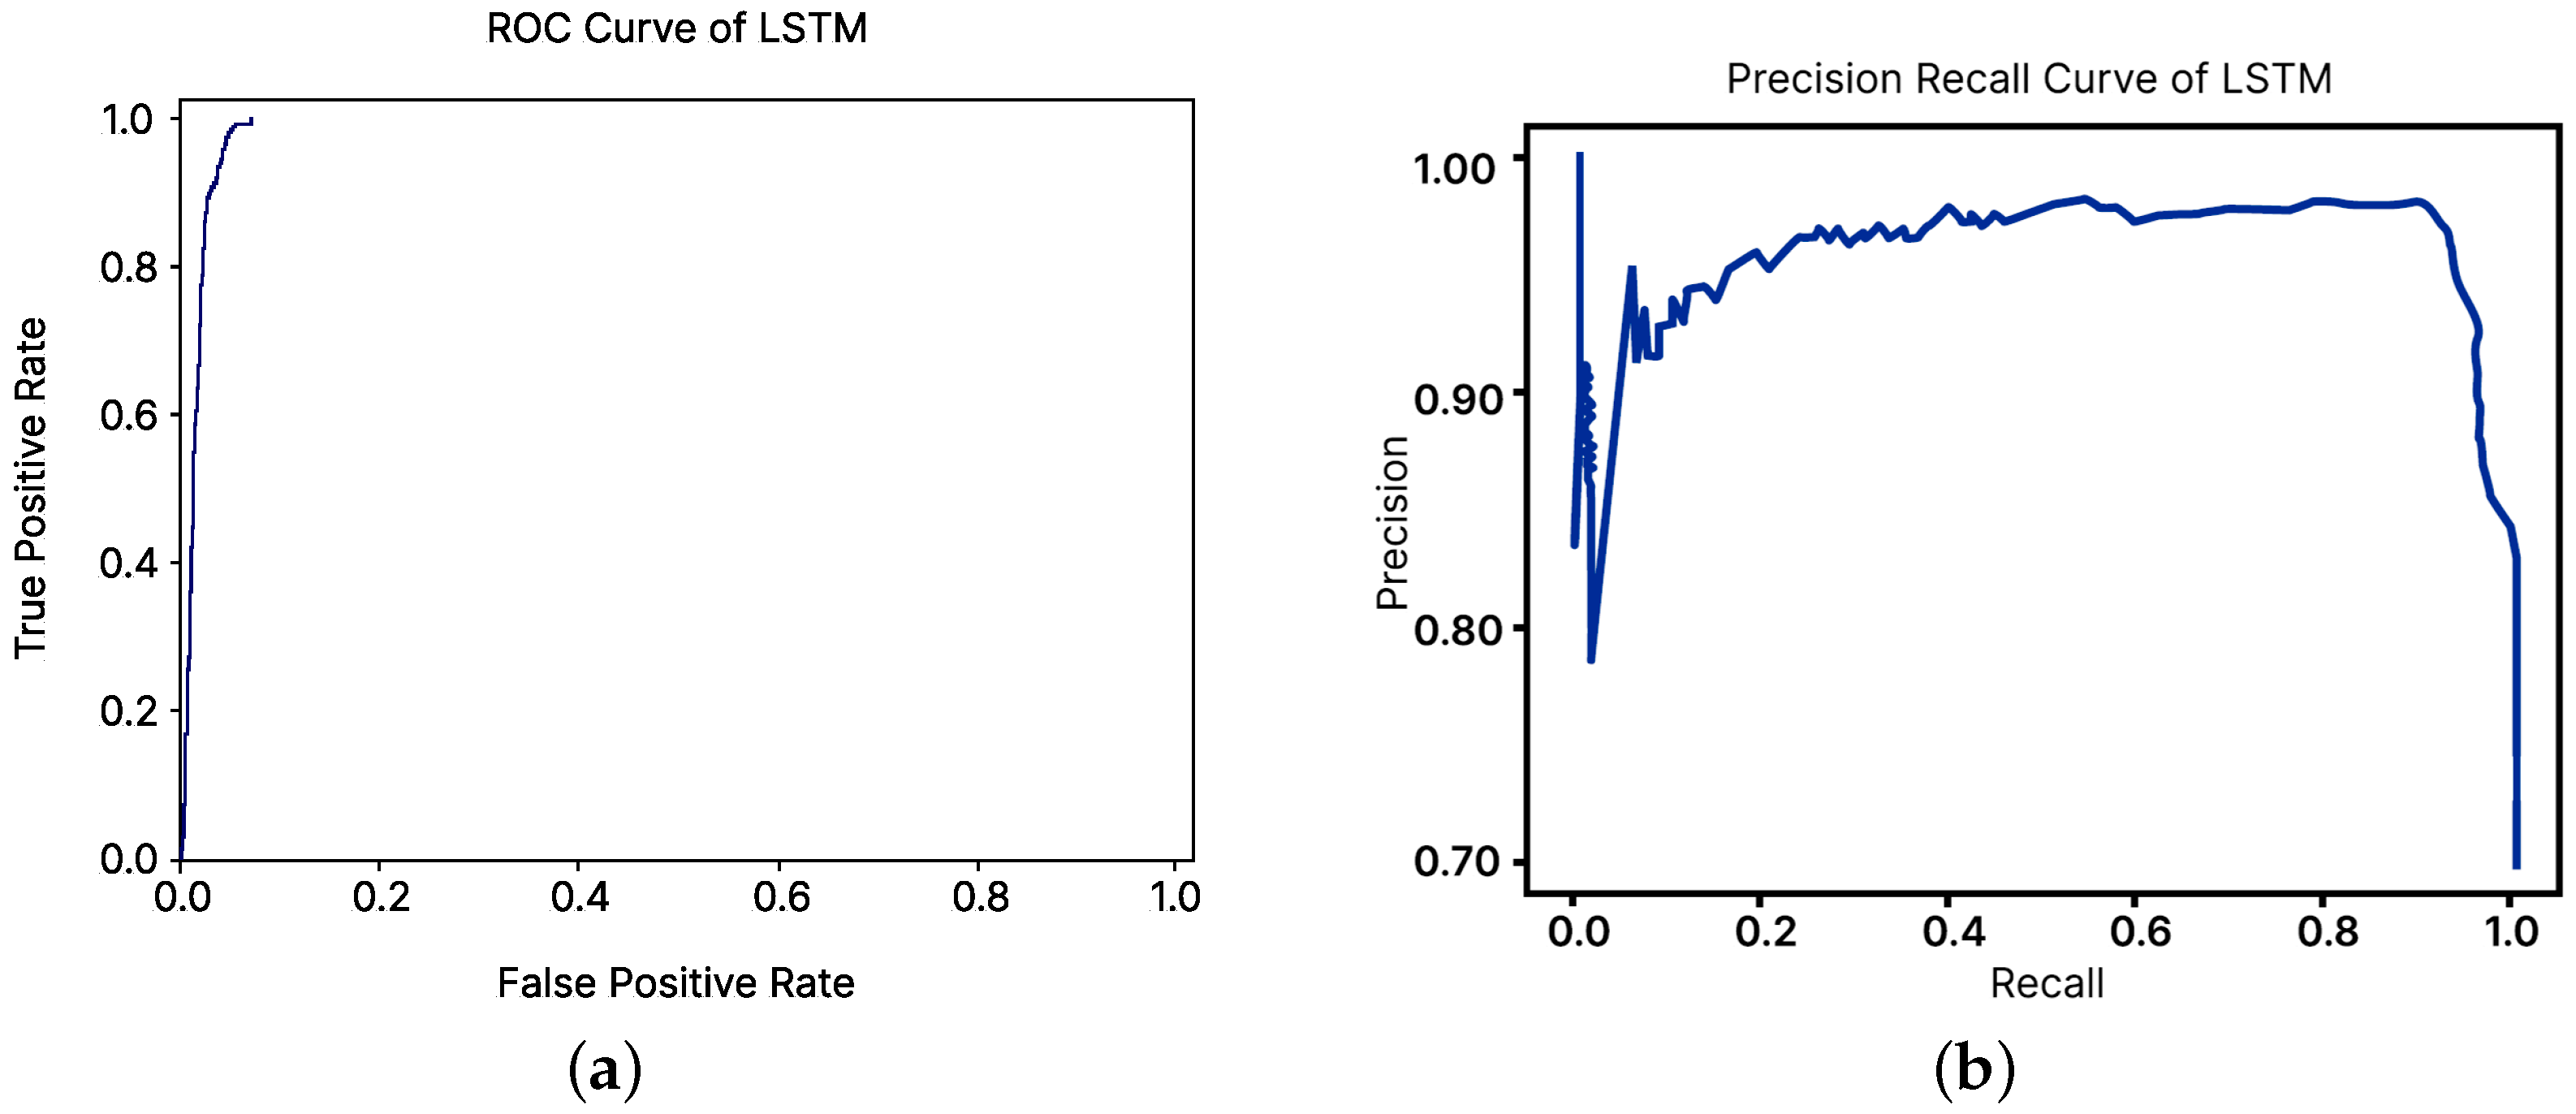
Class imbalance has been a common challenge in real-world data, particularly in medical fields, making it difficult to optimize machine-learning algorithm performance. In this study, there were 93 majority-class (survived) and 19 minority-class (dead) patients, yielding a 1:5 ratio.
To address the class imbalance, the synthetic minority over-sampling technique (SMOTE) was used first to over-sample the minority class, generating synthetic data and achieving a 1:1 class ratio. However, as was recently demonstrated by Van den Goorbergh, SMOTE did not improve discrimination but, instead, led to significantly miscalibrated models [33]. Due to this reason, we moved forward with a SDV to address the data-imbalance problem.

3. Results

In this result section, we present the results of a series of comprehensive experiments conducted to assess the performance of the deep-learning cardiac arrest prediction model. To enhance the robustness of our experiments, we incorporated an SDV to generate synthetic data, permitting us to thoroughly assess the predictive capabilities of the model. (Table 2).
After executing the designed experiments, we were able to achieve peak accuracy through experiment 4, where the experiment encompassed a dataset of 296 patient records. The hyper-parameters were optimized according to Table 3.
The creatinine levels were the most critical predictor, followed by the sodium and blood-urea levels. Studies have suggested that these markers were related to renal function, which was linked to cardiovascular diseases [34]. Additionally, potassium levels, FHIHD, and age played key roles in classifying cardiac patients, supporting the association between cardiovascular diseases and decreased potassium levels [35].
FHIHD was recognized as a well-established risk factor for cardiovascular diseases [36]. In the study’s findings, the risk factor FHIHD emerged as one of the most reliable predictive features for cardiac arrest. (Figure 8) displays the probabilistic prediction window for six randomly selected patients (three from each of the two classes). The LSTM model was proficient in providing predictions from admission up to 52 h later. In other words, the model’s prediction window spanned 52 h. The model demonstrated a prediction accuracy of 96% with a confidence interval from 95.01% to 95.85%.

3.1. Comparison with Existing Models

We assessed the performance of the developed deep-learning cardiac arrest prediction model (DLCAPM) by comparing it with well-established machine-learning algorithms, such as logistic regression, random forest, naïve Bayes, and support vector machine (SVM). The evaluation used all the features incorporated in the DLCAPM model. Table 4 presents the performance metrics, including accuracy, sensitivity, specificity, positive predictive value (PPV), negative predictive value (NPV), and F-score, for each of the compared models. The results demonstrated that the LSTM component of the DLCAPM model exhibited superior performance in comparison to the selected models.

3.2. Correlation Analysis

The correlation analysis evaluated the relationships among the model’s input features. Pearson’s and Spearman’s coefficients have commonly been used: The former was for normally distributed variables, and the latter for skewed or ordinal variables. A coefficient near ±1 indicated a strong correlation, either positive or negative [37]. In this study, Spearman’s rank correlation was used due to the Gaussian distribution, and Figure 9 shows the heat map of the correlational coefficients. A high positive correlation existed between systolic and diastolic blood pressure values.

3.3. Characteristics of the Study Population

In the cohort study, patient data were analyzed to assess the observed characteristics of the study population, as shown in Table 5. From these observations, we could infer that males may be more susceptible to cardiovascular diseases and cardiac arrests. This study also examined the impact of various risk factors that could potentially contribute to developing CVD. Among these risk factors, alcohol consumption, smoking, and an FHIHD were identified as the most significant contributors. Of the total population (males and females), 37% of individuals reported having an FHIHD. Notably, none of the female patients were documented to consume alcohol or smoke. Among the male patients, 73% (81 patients) were found to engage in at least one of these behaviors, with 69% (55 patients) consuming alcohol, 63% (51 patients) smoking, and 26% (21 patients) engaging in both alcohol consumption and smoking.

4. Discussion

The model’s performance was assessed using two optimization algorithms, Adam and Admax. Multiple iterations were performed, and hyper-parameter combinations were used to identify the four most optimal configurations, which yielded the highest accuracy. Table 6 presents the evaluation metrics for each of these four selected runs. Among these experiments, the best results were achieved in experiment 04 for training the model.
In a study related to ours, researchers had utilized a dataset comprised of 15 electronic-medical-record (EMR) data parameters [38]. Interestingly, eight of these parameters, namely age, gender, diastolic blood pressure (DBP), systolic blood pressure (SBP), body temperature, respiratory rate (RR), blood pressure (BP), and creatinine, were also a part of our study. However, their research had a more extensive dataset of 34,452 patients, whereas our study had a limited sample of 112 patients. Due to the limited size of our dataset and the class-imbalance issue, we employed the synthetic data vault to generate a training dataset, while the other previous study had utilized the SMOTE technique. Nonetheless, considering the datasets of both studies, it might be beneficial to explore cross-validation approaches for the models.
Table 7 shows the sensitivity, specificity, positive predictive value (PPV), negative predictive value (NPV), and accuracy measures for the outperformed LSTM and the decision-tree models in experiment 04, respectively.
The receiver-operating characteristic (ROC) curve is a graphical representation that demonstrates the diagnostic ability of binary classifiers by plotting sensitivity against specificity. A better-performing classifier would have a curve closer to the top-left corner. To compare classifier performances, a common approach has been to calculate the area under the ROC curve. Figure 10a presents the ROC curve for the LSTM model.
However, the visual interpretations and comparisons of ROC curves could be misleading for imbalanced datasets. To address this issue, precision–recall curves were utilized. Figure 10b illustrates the precision–recall curve for the LSTM model, and the supplementary figure shows the curve for the decision-tree classifier model.
The confusion matrix, which is crucial for statistical classifications in machine learning, is a table describing a classification model’s performance and identifying class confusion. Figure 11a,b displays the confusion matrices for the LSTM and decision-tree models, respectively.

4.1. Comparison with Existing EWSs

DLCAPM was evaluated against existing cardiac arrest early warning scores, including the modified early warning score (MEWS), the cardiac arrest risk triage score (CART), and the National Early Warning Score (NEWS), based on research by [10,16,39,40]. MDCalc (https://www.mdcalc.com/ accessed on 26 August 2023), which has been referred to as the most broadly used clinical decision tool by medical professionals, was used to calculate risk scores for CART, MEWS, and NEWS, using collected data (RR, SpO2, BT, SBP, DBP, HR, age, triage score). Table 8 displays the results for each score.

4.2. Limitations

The record room at the Teaching Hospital, Karapitiya (THK) utilized Microsoft Excel to store limited data from bed head tickets, making it necessary to manually review each patient’s record in order to obtain the required information for this study, which was time-consuming. The small sample size, the potential patient heterogeneity, and the focus on a specific patient population within a single hospital unit limited the research’s generalizability, potentially rendering it inapplicable nationwide. These limitations stemmed from the legacy methods of maintaining patient data and the difficulties in retrieval.
Due to limited resources, only 112 patient records were extracted, which prevented reaching the desired sample size for the model. To address this limitation, a SDV was employed to increase the minority sample size. Furthermore, the study faced constraints due to the scarcity of local research on the development of cardiac arrest EWSs in Sri Lanka [21,41]. While the FHIHD feature provided a high-level understanding of a patient’s family history and whether they had any heart-related conditions, it only offered a limited view of the patient’s generational tree. Recent studies have revealed that sudden cardiac deaths have occurred in completely asymptomatic individuals who carried pathogenic variants in genes linked to sudden cardiac death [42]. However, this study did not collect any genetic data, which was another limitation.

5. Conclusions

An efficient deep-learning cardiac risk prediction model was developed using clinical features based on the BHTs of THK cardiac patients. This simple model used accessible patient data and could offer bedside support for healthcare workers and assist the decision-making process. An open-access dataset was published to encourage further research.
Early and accurate predictions can aid in timely interventions and prevent cardiac events. Despite the model’s high accuracy, addressing data limitations could further improve the model. Additional research is needed to explore its applicability in other healthcare settings and its integration with existing patient monitoring tools for enhanced predictions.

6. Future Work

To enhance the development of more generalized models, we aim to conduct future studies with overlapping datasets, as we have a substantial amount of published clinical data that share similar information. Furthermore, we plan to complement our existing datasets by including this dataset in cross-validations with diverse geographical populations.

Author Contributions

L.T.W.R. Study concept and design; acquisition of data; analysis and interpretation of data; drafting of the manuscript; statistical analysis. S.M.V.: Study concept and design; Critical revision of the manuscript; Drafting of the manuscript. V.T.: Study concept and design; Critical revision of the manuscript; Drafting of the manuscript; Supervision. S.G.: Study concept and design; Critical revision of the manuscript; Drafting of the manuscript; Supervision. All authors have read and agreed to the published version of the manuscript.

Funding

This research received no external funding.

Institutional Review Board Statement

The study was conducted in accordance with the Ethics Committee of the Faculty of Medicine, University of Ruhuna, Sri Lanka (protocol code 2019/P/063 and date of approval 27 November 2019).

Informed Consent Statement

Since this study was carried out as a retrospective study, obtaining informed consent from all subjects was not applicable.

Data Availability Statement

The dataset used for all experiments is publicly available at https://zenodo.org/record/7603772.

Acknowledgments

The authors express their gratitude for the support provided by Susitha Amarasinghe, Sarasi M Munasinghe, S.G.H. Uluwaduge, Bhashithe Abeysinghe, Samadhi Rajapaksha, Poornima Nayanani, Lihini Rajapaksha, Yasas R Mendis, Imalsha Madushani, Sandaruwan Lakshitha, Pabodi Jayathilake, Udani Imalka, Dulanjana Madushan, Kasun Thenuwara and the Ethics Review Committee of the Faculty of Medicine, University of Ruhuna.

Conflicts of Interest

The authors declare no conflicts of interest.

Abbreviations

The following abbreviations are used in this manuscript:
LSTMLong Short-Term Memory
CVDCardiovascular Diseases
EWSEarly Warning System
RRTRapid Response Teams
DRTDedicated Resuscitation Teams
LMICLow- to Middle-Income Countries
HICHigh-Income Countries
BHTBed Head Ticket
THKTeaching Hospital, Karapitiya
ETUEmergency Treatment Unit
HRHeart Rate
SBPSystolic Blood Pressure
DBPDiastolic Blood Pressure
RRRespiratory Rate
BTBody Temperature
SpO2Blood Oxygen Saturation Level
FBSFasting Blood Sugar
FHIHDFamily History of Ischemic Heart Diseases
DLCAPMDeep-Learning Cardiac Arrest Prediction Model
RNNRecurrent Neural Network
CDAClinical Decision Analysis
SMOTESynthetic Minority Over-sampling Technique
GCSGlasgow Coma Scale
SVMSupport Vector Machine
PPVPositive Predictive Value
NPVNegative Predictive Value
TPRTrue-Positive Rate
FPRFalse-Positive Rate
ROCReceiver-Operating Characteristic
MEWSModified Early Warning Score
CARTCardiac Arrest Risk Triage Score
NEWSNational Early Warning Score
MD CALCMedical Calculator
GRUGated Recurrent Unit
CNNConvolutional Neural Networks
EMRElectronic Medical Records
ICUIntensive Care Unit
AWTTSAggregate Weighted Track and Trigger Systems
DEWSDeep-Learning-Based Early Warning System
SMOTESynthetic Minority Over-Sampling Technique
SDVSynthetic Data Vault

References

  1. Tang, W.; Weil, M. Cardiac Arrest and Cardiopulmonary Resuscitation. In Critical Care Medicine; Springer: Berlin/Heidelberg, Germany, 2008. [Google Scholar] [CrossRef]
  2. Beane, A.; Ambepitiyawaduge, P.D.S.; Thilakasiri, K.; Stephens, T.; Padeniya, A.; Athapattu, P.; Mahipala, P.G.; Sigera, P.C.; Dondorp, A.M.; Haniffa, R. Practices and perspectives in cardiopulmonary resuscitation attempts and the use of do not attempt resuscitation orders: A cross-sectional survey in Sri Lanka. Indian J. Crit. Care Med.-Peer-Rev. Off. Publ. Indian Soc. Crit. Care Med. 2017, 21, 865. [Google Scholar]
  3. Abeywardena, M.Y. Dietary fats, carbohydrates and vascular disease: Sri Lankan perspectives. Atherosclerosis 2003, 171, 157–161. [Google Scholar] [CrossRef]
  4. Ye, C.; Wang, O.; Liu, M.; Zheng, L.; Xia, M.; Hao, S.; Jin, B.; Jin, H.; Zhu, C.; Huang, C.J.; et al. A real-time early warning system for monitoring inpatient mortality risk: Prospective study using electronic medical record data. J. Med. Internet Res. 2019, 21, e13719. [Google Scholar] [CrossRef]
  5. Marinkovic, O.; Sekulic, A.; Trpkovic, S.; Malenkovic, V.; Pavlovic, A. The importance of early warning score (EWS) in predicting in-hospital cardiac arrest—Our experience. Resuscitation 2013, 84, S85. [Google Scholar] [CrossRef]
  6. Nishijima, I.; Oyadomari, S.; Maedomari, S.; Toma, R.; Igei, C.; Kobata, S.; Koyama, J.; Tomori, R.; Kawamitsu, N.; Yamamoto, Y.; et al. Use of a modified early warning score system to reduce the rate of in-hospital cardiac arrest. J. Intensive Care 2016, 4, 12. [Google Scholar] [CrossRef]
  7. Smith, G.B.; Prytherch, D.R.; Schmidt, P.E.; Featherstone, P.I.; Higgins, B. A review, and performance evaluation, of single-parameter “track and trigger” systems. Resuscitation 2008, 79, 11–21. [Google Scholar] [CrossRef]
  8. Gerry, S.; Birks, J.; Bonnici, T.; Watkinson, P.J.; Kirtley, S.; Collins, G.S. Early warning scores for detecting deterioration in adult hospital patients: A systematic review protocol. BMJ Open 2017, 7, e019268. [Google Scholar] [CrossRef]
  9. Kwon, J.m.; Lee, Y.; Lee, Y.; Lee, S.; Park, J. An algorithm based on deep learning for predicting in-hospital cardiac arrest. J. Am. Heart Assoc. 2018, 7, e008678. [Google Scholar] [CrossRef]
  10. Kim, J.; Park, Y.R.; Lee, J.H.; Lee, J.H.; Kim, Y.H.; Huh, J.W. Development of a real-time risk prediction model for in-hospital cardiac arrest in critically ill patients using deep learning: Retrospective study. JMIR Med. Inform. 2020, 8, e16349. [Google Scholar] [CrossRef]
  11. Tonekaboni, S.; Mazwi, M.; Laussen, P.; Eytan, D.; Greer, R.; Goodfellow, S.D.; Goodwin, A.; Brudno, M.; Goldenberg, A. Prediction of cardiac arrest from physiological signals in the pediatric ICU. In Proceedings of the Machine Learning for Healthcare Conference, PMLR, Palo Alto, CA, USA, 17–18 August 2018; pp. 534–550. [Google Scholar]
  12. Alamgir, A.; Mousa, O.; Shah, Z. Artificial intelligence in predicting cardiac arrest: Scoping review. JMIR Med. Inform. 2021, 9, e30798. [Google Scholar] [CrossRef]
  13. Dumas, F.; Bougouin, W.; Cariou, A. Cardiac arrest: Prediction models in the early phase of hospitalization. Curr. Opin. Crit. Care 2019, 25, 204–210. [Google Scholar] [CrossRef] [PubMed]
  14. Somanchi, S.; Adhikari, S.; Lin, A.; Eneva, E.; Ghani, R. Early prediction of cardiac arrest (code blue) using electronic medical records. In Proceedings of the 21th ACM SIGKDD International Conference on Knowledge Discovery and Data Mining, Sydney, NSW, Australia, 10–13 August 2015; pp. 2119–2126. [Google Scholar]
  15. Ong, M.E.H.; Lee Ng, C.H.; Goh, K.; Liu, N.; Koh, Z.X.; Shahidah, N.; Zhang, T.T.; Fook-Chong, S.; Lin, Z. Prediction of cardiac arrest in critically ill patients presenting to the emergency department using a machine learning score incorporating heart rate variability compared with the modified early warning score. Crit. Care 2012, 16, R108. [Google Scholar] [CrossRef] [PubMed]
  16. Churpek, M.M.; Yuen, T.C.; Park, S.Y.; Meltzer, D.O.; Hall, J.B.; Edelson, D.P. Derivation of a cardiac arrest prediction model using ward vital signs. Crit. Care Med. 2012, 40, 2102. [Google Scholar] [CrossRef] [PubMed]
  17. Liu, N.; Lin, Z.; Cao, J.; Koh, Z.; Zhang, T.; Huang, G.B.; Ser, W.; Ong, M.E.H. An intelligent scoring system and its application to cardiac arrest prediction. IEEE Trans. Inf. Technol. Biomed. 2012, 16, 1324–1331. [Google Scholar] [CrossRef] [PubMed]
  18. Chae, M.; Han, S.; Gil, H.; Cho, N.; Lee, H. Prediction of in-hospital cardiac arrest using shallow and deep learning. Diagnostics 2021, 11, 1255. [Google Scholar] [CrossRef] [PubMed]
  19. Murukesan, L.; Murugappan, M.; Iqbal, M.; Saravanan, K. Machine learning approach for sudden cardiac arrest prediction based on optimal heart rate variability features. J. Med. Imaging Health Inform. 2014, 4, 521–532. [Google Scholar] [CrossRef]
  20. Ueno, R.; Xu, L.; Uegami, W.; Matsui, H.; Okui, J.; Hayashi, H.; Miyajima, T.; Hayashi, Y.; Pilcher, D.; Jones, D. Value of laboratory results in addition to vital signs in a machine learning algorithm to predict in-hospital cardiac arrest: A single-center retrospective cohort study. PLoS ONE 2020, 15, e0235835. [Google Scholar] [CrossRef] [PubMed]
  21. De Silva, A.P.; Sujeewa, J.A.; De Silva, N.; Rathnayake, R.M.D.; Vithanage, L.; Sigera, P.C.; Munasinghe, S.; Beane, A.; Stephens, T.; Athapattu, P.L.; et al. A retrospective study of physiological observation-reporting practices and the recognition, response, and outcomes following cardiopulmonary arrest in a low-to-middle-income country. Indian J. Crit. Care Med.-Peer-Rev. Off. Publ. Indian Soc. Crit. Care Med. 2017, 21, 343. [Google Scholar] [CrossRef]
  22. Ranawaka, U.; Wijekoon, C.; Pathmeswaran, A.; Kasturiratne, A.; Gunasekera, D.; Chackrewarthy, S.; Kato, N.; Wickramasinghe, A. Risk Estimates of Cardiovascular Diseases in a Sri Lankan Community. Ceylon Med. J. 2016, 61, 11–17. [Google Scholar] [CrossRef]
  23. Rajapaksha, L.; Vidanagamachchi, S.; Gunawardena, S.; Thambawita, V. Cardiac Patient Bed Head Ticket Dataset; Zenodo: Geneva, Switzerland, 2023. [Google Scholar] [CrossRef]
  24. Patki, N.; Wedge, R.; Veeramachaneni, K. The synthetic data vault. In Proceedings of the 2016 IEEE International Conference on Data Science and Advanced Analytics (DSAA), Montreal, QC, Canada, 17–19 October 2016; pp. 399–410. [Google Scholar]
  25. Kim, J.; Chae, M.; Chang, H.J.; Kim, Y.A.; Park, E. Predicting cardiac arrest and respiratory failure using feasible artificial intelligence with simple trajectories of patient data. J. Clin. Med. 2019, 8, 1336. [Google Scholar] [CrossRef]
  26. Choi, E.; Schuetz, A.; Stewart, W.F.; Sun, J. Using recurrent neural network models for early detection of heart failure onset. J. Am. Med. Inform. Assoc. 2017, 24, 361–370. [Google Scholar] [CrossRef] [PubMed]
  27. Ge, W.; Huh, J.W.; Park, Y.R.; Lee, J.H.; Kim, Y.H.; Turchin, A. An Interpretable ICU Mortality Prediction Model Based on Logistic Regression and Recurrent Neural Networks with LSTM units. AMIA Annu. Symp. Proc. 2018, 2018, 460–469. [Google Scholar] [PubMed]
  28. Aczon, M.; Ledbetter, D.; Ho, L.; Gunny, A.; Flynn, A.; Williams, J.; Wetzel, R. Dynamic mortality risk predictions in pediatric critical care using recurrent neural networks. arXiv 2017, arXiv:1701.06675. [Google Scholar]
  29. Aleem, I.S.; Schemitsch, E.H.; Hanson, B.P. What is a clinical decision analysis study? Indian J. Orthop. 2008, 42, 137. [Google Scholar] [CrossRef]
  30. Bae, J.M. The clinical decision analysis using decision tree. Epidemiol. Health 2014, 36, e2014025. [Google Scholar] [CrossRef] [PubMed]
  31. Myers, J.; McCabe, S.J. Understanding medical decision making in hand surgery. Clin. Plast. Surg. 2005, 32, 453–461. [Google Scholar] [CrossRef] [PubMed]
  32. Podgorelec, V.; Kokol, P.; Stiglic, B.; Rozman, I. Decision trees: An overview and their use in medicine. J. Med. Syst. 2002, 26, 445–463. [Google Scholar] [CrossRef] [PubMed]
  33. van den Goorbergh, R.; van Smeden, M.; Timmerman, D.; Van Calster, B. The harm of class imbalance corrections for risk prediction models: Illustration and simulation using logistic regression. J. Am. Med. Inform. Assoc. 2022, 29, 1525–1534. [Google Scholar] [CrossRef]
  34. Kurniawan, L.B.; Bahrun, U.; Mangarengi, F.; Darmawati, E.; Arif, M. Blood urea nitrogen as a predictor of mortality in myocardial infarction. Universa Med. 2013, 32, 172–178. [Google Scholar]
  35. Kughapriya, P.; Evangeline, J. Evaluation of serum electrolytes in Ischemic Heart Disease patients. Natl. J. Basic Med. Sci. 2016, 6, 1–14. [Google Scholar]
  36. Tan, B.Y.; Judge, D.P. A clinical approach to a family history of sudden death. Circ. Cardiovasc. Genet. 2012, 5, 697–705. [Google Scholar] [CrossRef] [PubMed]
  37. Mukaka, M.M. A guide to appropriate use of correlation coefficient in medical research. Malawi Med. J. 2012, 24, 69–71. [Google Scholar] [PubMed]
  38. Chae, M.; Gil, H.W.; Cho, N.J.; Lee, H. Machine learning-based cardiac arrest prediction for early warning system. Mathematics 2022, 10, 2049. [Google Scholar] [CrossRef]
  39. Subbe, C. Modified Early Warning Score (MEWS) for Clinical Deterioration; MDCalc: San Francisco, CA, USA, 2020. [Google Scholar]
  40. Smith, G.; Redfern, O.; Pimentel, M.; Gerry, S.; Collins, G.; Malycha, J.; Prytherch, D.; Schmidt, P.; Watkinson, P. The national early warning score 2 (NEWS2). Clin. Med. 2019, 19, 260. [Google Scholar] [CrossRef]
  41. Beane, A.; De Silva, A.P.; De Silva, N.; Sujeewa, J.A.; Rathnayake, R.D.; Sigera, P.C.; Athapattu, P.L.; Mahipala, P.G.; Rashan, A.; Munasinghe, S.B.; et al. Evaluation of the feasibility and performance of early warning scores to identify patients at risk of adverse outcomes in a low-middle income country setting. BMJ Open 2018, 8, e019387. [Google Scholar] [CrossRef]
  42. Brlek, P.; Pavelić, E.S.; Mešić, J.; Vrdoljak, K.; Skelin, A.; Manola, Š.; Pavlović, N.; Ćatić, J.; Matijević, G.; Brugada, J.; et al. State-of-the-art Risk-modifying Treatment of Sudden Cardiac Death in an Asymptomatic Patient with a Mutation in the SCN5A Gene and Review of the Literature. Front. Cardiovasc. Med. 2023, 10, 1193878. [Google Scholar] [CrossRef]
Figure 1. Comprehensive workflow chart. We divided data into training, testing, and validation sets, starting with collecting and pre-processing data. Additionally, we used a synthetic data vault (SDV) to augment our training dataset for four experiments. The figure depicts the model’s development process, which included training and prediction. It also highlights the significance of comparing our model’s performance with existing models.
Biomedinformatics 04 00003 g001
Figure 2. Categorization of extracted features into groups. The features were divided into five main groups: Demographic, Examinations, Lab Reports, Patient History, and Hospital Outcome (whether the person died or survived the event).
Biomedinformatics 04 00003 g002
Figure 3. The frequency of recorded features among the 112 patient records.
Biomedinformatics 04 00003 g003
Figure 4. Data pre-processing workflow.
Biomedinformatics 04 00003 g004
Figure 5. Data division and preparation for the model. After splitting the pre-processed dataset into the training dataset, testing dataset, and validation dataset, we used an SDV to generate three additional training datasets, bringing the total number of training datasets to four. (SDV = Synthetic Data Vault).
Biomedinformatics 04 00003 g005
Figure 6. Data reshaping. This figure demonstrates an example scenario using experiment 01, where there were 89 patients and a total of 5030 patient sequences. The average observation time for a patient was approximately 56 h per time step. Based on this, the data for experiment 01 were reshaped into a 3D array with dimensions 89 × 56 × 6, where 89 represents the number of patients, 56 denotes the average observation time in hours per time step, and 6 signifies the number of features.
Biomedinformatics 04 00003 g006
Figure 7. Model architecture.
Biomedinformatics 04 00003 g007
Figure 8. Prediction of the risk score within 52 h. We randomly selected three patients from each of the two classes (class: dead, survived) to make a probabilistic prediction about the occurrence of cardiac arrest.
Biomedinformatics 04 00003 g008
Figure 9. Correlational heat map between time-series inputs SBP = Systolic Blood Pressure, DBP = Diastolic Blood Pressure, HR = Heart Rate, RR = Respiratory Rate, BT = Body Temperature, SpO2 = Blood Oxygen Saturation Level.
Biomedinformatics 04 00003 g009
Figure 10. ROC curve and precision–recall curve of the LSTM model. (a) ROC curve. (b) Precision-Recall curve.
Biomedinformatics 04 00003 g010
Figure 11. Confusion matrices for (a) LSTM model and (b) decision-tree model.
Biomedinformatics 04 00003 g011
Table 1. Summary of the number of patient records and sequences contained in training datasets. Except for experiment 01, we maintained the survived/dead-patient ratio as 1:1.
Training Dataset 01Training Dataset 02Training Dataset 03Training Dataset 04
No. of SequencesNo. of RecordsNo. of SequencesNo. of RecordsNo. of SequencesNo. of RecordsNo. of SequencesNo. of Records
Real Survived-Patient Data42877442877400428774
Synthetic Survived-Patient Data0000487074487074
Real Dead-Patient Data74315743150074315
Synthetic Dead-Patient Data001768594702745259133
Total5030896798148957214815,159296
Table 2. Experiments performed by incorporating synthetic data in order to evaluate the results of the combined model. RS = Real Survived, RD = Real Dead, SS = Synthetic Survived, SD = Synthetic Dead. The survived/dead ratio of the patients was maintained at 1:1.
Experiment No.RSRDSSSDAccuracy
017415--0.954
027415-590.954
03--74740.964
047415741330.967
Table 3. Hyper-parameter values.
No. of EpochsLearning RateBatch SizeLSTM NodesOptimizer
1000.001102Adam
Table 4. Performance comparison with existing machine-learning models (The Bolded entries of LSTM & decision tree were the two models used in the deep-learning cardiac arrest prediction model (DLCAPM)).
ModelAccuracySensitivitySpecificityPPVNPVF-Score
LSTM0.960.950.930.980.810.86
Decision Tree0.760.690.810.720.790.80
SVM0.890.840.820.810.820.84
Logistic Regression0.880.930.810.920.810.87
Random Forest0.880.890.900.870.810.91
Naïve Bayes0.850.890.800.820.880.91
Table 5. Characteristics of the study population.
CharacteristicData
Study period13 August 2018–6 February 2020
HospitalTeaching Hospital Karapitiya, Galle, Sri Lanka
Total patients112
Input vectors19
Age group59–76 years
Male (%)73%
Symptoms before admissionChest pain on the left side (1/2 h before the admission),
Tightening of the chest, Vomiting, Sweating, Nausea, Cough, Fever
Patients with FHIHD (%)37%
Consume alcohol, Male (%)69%
Smoking, Male (%)63%
Smoking & use alcohol, Male (%)26%
Table 6. Performance of the model on four experimental datasets. Note that we tested the LSTM and the decision-tree models separately.
MetricLSTMDecision Tree
Experiment NumberExperiment Number
0102030401020304
Accuracy0.930.850.940.960.800.830.800.76
Precision0.900.880.900.980.680.700.660.72
Recall0.910.850.910.950.650.680.630.69
F-Score0.810.860.810.860.820.850.820.80
AUC score0.970.950.970.980.790.830.790.75
Table 7. Evaluation metrics of LSTM and decision-tree models of the deep-learning cardiac arrest prediction model.
StatisticValue95% CI
LSTM ModelDecision-Tree ModelLSTM ModelDecision-Tree Model
Sensitivity95.83%69.57%95.37% to 96.25%47.08% to 86.79%
Specificity93.42%81.82%92.07% to 94.61%64.54% to 93.02%
Positive Predictive Value98.71%72.73%98.44% to 98.93%55.19% to 85.24%
Negative Predictive Value81.04%79.41%79.37% to 82.60%67.07% to 87.96%
Table 8. Performance comparison of DLCAPM (deep-learning cardiac arrest prediction model, a combination of LSTM and decision-tree models) against CART (cardiac arrest risk triage score), MEWS (modified early warning score), and NEWS (National Early Warning Score) models. Bolded entries are the results of the DLCAPM.
ModelAccuracySensitivitySpecificityPPVNPVF-Score
LSTM0.960.950.930.980.810.86
Decision Tree0.760.690.810.720.790.80
CART0.600.500.750.750.750.60
MEWS0.800.930.400.820.40.50
NEWS0.800.840.660.940.660.66
Disclaimer/Publisher’s Note: The statements, opinions and data contained in all publications are solely those of the individual author(s) and contributor(s) and not of MDPI and/or the editor(s). MDPI and/or the editor(s) disclaim responsibility for any injury to people or property resulting from any ideas, methods, instructions or products referred to in the content.

