

Weighted Rank Difference Ensemble: A New Form of Ensemble Feature Selection Method for Medical Datasets


Abstract
1. Introduction
- (i)
- This paper proposes a new form of ensemble FS method termed weighted rank difference ensemble (WRD-Ensemble). This WRD-Ensemble method is developed by aggregating the weight of each feature of stand-alone FS methods and then selecting a subset of features by using the rank difference of each feature. In this paper, WRD-Ensembple is shown by combining the PCC, relief, and GR methods;
- (ii)
- The proposed WRD-Ensemble method is tested on chronic kidney disease (CKD), lung cancer, and heart disease datasets, which are widely used datasets for medical data analytics;
- (iii)
- The proposed WRD-Ensemble scheme is compared with the existing stand-alone PCC, GR, and reliefF methods. Finally, its performance is compared with several existing research works on CKD and lung cancer datasets using the proposed method.
2. Related Works
3. Materials and Methods
3.1. Existing FS Methods
3.2. The Proposed WRD-Ensemble Method
| Algorithm 1 WRD-Ensemble method |
| Input: Dataset D with n features. Output: An array, E, with selected features. 1. Feature Ranking using PCC FS Method Generate L1 using the Pearson Correlation Coefficient Feature Selection (PCC FS) method, and assign ranks and weights to two arrays: Rank and W. for j = 0 to n − 1 do row = L1[j][0] Rank[row][1] = j + 1 W[row][1] = L1[j][1] end for 2. Feature Ranking using ReliefF FS Method Generate L2 using ReliefF Feature Selection (ReliefF FS) method, and assign ranks and weights to two arrays: Rank and W. for j = 0 to n − 1 do row = L2[j][0] Rank[row][2] = j + 1 W[row][2] = L2[j][1] end for 3. Feature Ranking using GR FS Method Generate L3 using Gini Ratio Feature Selection (GR FS) method, and assign ranks and weights to two arrays: Rank and W. for j = 0 to n − 1 do row = L3[j][0] Rank[row][3] = j + 1 W[row][3] = L3[j][1] end for 4. Calculate Mean Weight and Absolute Rank Difference Calculate and assign the mean weight and absolute rank difference of each feature to arrays F and Rank. for j = 0 to n − 1 do F[j][0] = j + 1 F[j][1] = (W[j][1] + W[j][2] + W[j][3])/3 F[j][2] = abs(Rank[j][1] − Rank[j][2]) + abs(Rank[j][2] − Rank[j][3]) + abs(Rank[j][3] − Rank[j][1]) end for 5. Normalize Rank Differences Normalize the rank difference of each feature. for j = 0 to n − 1 do F[j][2] = (F[j][2] − R_min)/(R_max − R_min) // Normalization of rank difference end for 6. Sort the features in F based on their mean weight. 7. Remove features from F with mean weight <= Wτ. 8. Remove features from F with rank difference >= Rτ and do not have a rank equal to the last one-fourth of the rank in any three rank lists. 9. Selected Features_Array, E ← F to E. 10. Return Features_Array, E 11. End |
4. Results and Discussion
4.1. Results for CKD Dataset
4.2. Results for Lung Cancer Dataset
4.3. Results for Heart Disease Dataset
5. Conclusions and Future Work
Author Contributions
Funding
Institutional Review Board Statement
Informed Consent Statement
Data Availability Statement
Conflicts of Interest
Abbreviations
| Abbreviations | Elaboration |
| FS | Feature selection |
| WRD-Ensemble | weighted rank difference ensemble |
| GR | Gain Ratio |
| PCC | Pearson’s correlation coefficient |
| CKD | chronic kidney disease |
| LR | logistic regression |
| DFS | Density-based FS |
| uEFS | univariate ensemble-based feature selection |
| FES | forward exhaustive selection |
| HWFFS | hybrid wrapper and filter-based FS |
| IG | Information Gain |
| CFS | Correlation Based FS |
References
- Kononenko, I. Machine learning for medical diagnosis: History, state of the art and perspective. Artif. Intell. Med. 2001, 23, 89–109. [Google Scholar] [CrossRef]
- Ahmmed, S.; Podder, P.; Mondal, M.R.H.; Rahman, S.M.A.; Kannan, S.; Hasan, M.J.; Rohan, A.; Prosvirin, A.E. Enhancing Brain Tumor Classification with Transfer Learning across Multiple Classes: An In-Depth Analysis. BioMedInformatics 2023, 3, 1124–1144. [Google Scholar] [CrossRef]
- Rahman, S.M.; Ibtisum, S.; Bazgir, E.; Barai, T. The Significance of Machine Learning in Clinical Disease Diagnosis: A Review. arXiv 2023, arXiv:2310.16978. [Google Scholar] [CrossRef]
- Manonmani, M.; Balakrishnan, S. An Ensemble Feature Selection Method for Prediction of CKD. In Proceedings of the 2020 International Conference on Computer Communication and Informatics (ICCCI), Coimbatore, India, 22–24 January 2020; pp. 1–6. [Google Scholar]
- Hoque, N.; Singh, M.; Bhattacharyya, D.K. EFS-MI: An ensemble feature selection method for classification. Complex Intell. Syst. 2018, 4, 105–118. [Google Scholar] [CrossRef]
- Wang, H.; Khoshgoftaar, T.M.; Napolitano, A. Software measurement data reduction using ensemble techniques. Neurocomputing 2012, 92, 124–132. [Google Scholar] [CrossRef]
- Saeys, Y.; Abeel, T.; Peer, Y.V.D. Robust feature selection using ensemble feature selection techniques. In Joint European Conference on Machine Learning and Knowledge Discovery in Databases, Antwerp, Belgium, 14–18 September 2008; Springer: Berlin/Heidelberg, Germany, 2008; pp. 313–325. [Google Scholar]
- Osanaiye, O.; Cai, H.; Choo, K.K.R.; Dehghantanha, A.; Xu, Z.; Dlodlo, M. Ensemble-based multi-filter feature selection method for DDoS detection in cloud computing. EURASIP J. Wirel. Commun. Netw. 2016, 1, 130. [Google Scholar] [CrossRef]
- Liu, L.; Tang, S.; Wu, F.X.; Wang, Y.P.; Wang, J. An ensemble hybrid feature selection method for neuropsychiatric disorder classification. IEEE/ACM Trans. Comput. Biol. Bioinform. 2021, 19, 1459–1471. [Google Scholar] [CrossRef] [PubMed]
- Wang, J.; Xu, J.; Zhao, C.; Peng, Y.; Wang, H. An ensemble feature selection method for high-dimensional data based on sort aggregation. Syst. Sci. Control Eng. 2019, 7, 32–39. [Google Scholar] [CrossRef]
- Ali, M.; Ali, S.I.; Kim, D.; Hur, T.; Bang, J.; Lee, S.; Kang, B.H.; Hussain, M. uEFS: An efficient and comprehensive ensemble-based feature selection methodology to select informative features. PLoS ONE 2018, 13, e0202705. [Google Scholar] [CrossRef] [PubMed]
- Guan, D.; Yuan, W.; Lee, Y.K.; Najeebullah, K.; Rasel, M.K. A review of ensemble learning based feature selection. IETE Tech. Rev. 2014, 31, 190–198. [Google Scholar] [CrossRef]
- Wang, H.; Khoshgoftaar, T.M.; Napolitano, A. A comparative study of ensemble feature selection techniques for software defect prediction. In Proceedings of the 2010 9th International Conference on Machine Learning and Applications, Washington, DC, USA, 12–14 December 2010; pp. 135–140. [Google Scholar]
- Available online: https://archive.ics.uci.edu/ml/datasets/chronic_kidney_disease (accessed on 10 October 2022).
- Available online: https://www.kaggle.com/datasets/nancyalaswad90/lung-cancer (accessed on 25 November 2022).
- Polat, H.; Danaei Mehr, H.; Cetin, A. Diagnosis of chronic kidney disease based on support vector machine by feature selection methods. J. Med. Syst. 2017, 4, 1–11. [Google Scholar] [CrossRef]
- Sharma, S.; Sharma, V.; Sharma, A. Performance based evaluation of various machine learning classification techniques for chronic kidney disease diagnosis. arXiv 2016, arXiv:1606.09581. [Google Scholar]
- Chittora, P.; Chaurasia, S.; Chakrabarti, P.; Kumawat, G.; Chakrabarti, T.; Leonowicz, Z.; Bolshev, V. Prediction of chronic kidney disease-a machine learning perspective. IEEE Access 2021, 9, 17312–17334. [Google Scholar] [CrossRef]
- Abdullah, A.A.; Hafidz, S.A.; Khairunizam, W. Performance comparison of machine learning algorithms for classification of chronic kidney disease (CKD). J. Phys. Conf. Ser. 2020, 1529, 052077. [Google Scholar] [CrossRef]
- Sara, S.B.V.; Kalaiselvi, K. Ensemble swarm behaviour based feature selection and support vector machine classifier for chronic kidney disease prediction. Int. J. Eng. Technol. 2018, 7, 190. [Google Scholar] [CrossRef]
- Saidi, R.; Bouaguel, W.; Essoussi, N. Hybrid feature selection method based on the genetic algorithm and pearson correlation coefficient. In Machine Learning Paradigms: Theory and Application; Springer: Cham, Switzerland, 2019; pp. 3–24. [Google Scholar]
- Blessie, E.C.; Karthikeyan, E. Sigmis: A feature selection algorithm using correlation based method. J. Algorithms Comput. Technol. 2012, 6, 385–394. [Google Scholar] [CrossRef]
- Vaghela, V.B.; Vandra, K.H.; Modi, N.K. Information Theory Based Feature Selection for Multi-Relational Naïve Bayesian Classifier. J. Data Min. Genom. Proteom. 2014, 5, 1. [Google Scholar]
- Novaković, J. Toward optimal feature selection using ranking methods and classification algorithms. Yugosl. J. Oper. Res. 2016, 21, 1. [Google Scholar] [CrossRef]
- Yang, F.; Cheng, W.; Dou, R.; Zhou, N. An improved feature selection approach based on ReliefF and Mutual Information. In Proceedings of the International Conference on Information Science and Technology, Nanjing, China, 26–28 March 2011; pp. 246–250. [Google Scholar]
- Afef, B.B.; Mohamed, L. Ensemble feature selection for high dimensional data: A new method and a comparative study. In Advances in Data Analysis and Classification; Springer: Berlin/Heidelberg, Germany, 2017; Volume 12. [Google Scholar]
- Paplomatas, P.; Krokidis, M.G.; Vlamos, P.; Vrahatis, A.G. An ensemble feature selection approach for analysis and modeling of transcriptome data in alzheimer’s disease. Appl. Sci. 2023, 13, 2353. [Google Scholar] [CrossRef]
- Kolukisa, B.; Bakir-Gungor, B. Ensemble feature selection and classification methods for machine learning-based coronary artery disease diagnosis. Comput. Stand. Interfaces 2023, 84, 103706. [Google Scholar] [CrossRef]
- Manzoor, U.; Halim, Z. Protein encoder: An autoencoder-based ensemble feature selection scheme to predict protein secondary structure. Expert Syst. Appl. 2023, 213, 119081. [Google Scholar]
- Wang, A.; Liu, H.; Yang, J.; Chen, G. Ensemble feature selection for stable biomarker identification and cancer classification from microarray expression data. Comput. Biol. Med. 2022, 142, 105208. [Google Scholar] [CrossRef] [PubMed]
- Zhong, Y.; Chalise, P.; He, J. Nested cross-validation with ensemble feature selection and classification model for high-dimensional biological data. Commun. Stat.-Simul. Comput. 2023, 52, 110–125. [Google Scholar] [CrossRef]
- Classification Algorithms Logistic Regression. Available online: https://www.tutorialspoint.com/machine_learning_with_python/machine_learning_with_python_classification_algorithms_logistic_regression.htm (accessed on 6 September 2023).
- Available online: https://archive.ics.uci.edu/ml/datasets/Heart+Disease (accessed on 15 January 2024).


| FS Methods | Ranked List |
|---|---|
| PCC | 15, 3, 16, 4, 18, 19, 20, 10, 22, 23, 7, 11, 13, 5, 24, 12, 2, 6, 8, 21, 1, 17, 9, 14 |
| reliefF | 19, 20, 3, 22, 7, 23, 15, 16, 24, 4, 8, 6, 18, 21, 2, 10, 1, 12, 5, 11, 13, 9, 14, 17 |
| GR | 12, 16, 15, 19, 20, 18, 3, 4, 2, 22, 10, 11, 7, 23, 24, 6, 8, 13, 5, 21, 14, 9, 17, 1 |
| Proposed method | 19, 16, 15, 3, 20, 4, 18, 12, 22, 7, 23, 10, 24, 11, 2, 13, 6, 5, 8, 21, 1, 17, 9, 14 |
| Threshold Values | 22 Features | 20 Features | 18 Features | 16 Features | 14 Features | 12 Features | 10 Features |
|---|---|---|---|---|---|---|---|
| Wτ | 0.1062 | 0.117 | 0.158 | 0.158 | 0.168 | 0.2004 | 0.234 |
| Rτ | 1.0 | 1.0 | 1.0 | 0.4375 | 0.4375 | 0.4375 | 0.4375 |
| No. of Features | List of Features |
|---|---|
| 22 subset of features | 19, 16, 15, 3, 20, 4, 18, 12, 22, 7, 23, 10, 24, 11, 2, 13, 6, 5, 8, 21, 1, 17 |
| 20 subset of features | 19, 16, 15, 3, 20, 4, 18, 12, 22, 7, 23, 10, 24, 11, 2, 13, 6, 5, 8, 21 |
| 18 subset of features | 19, 16, 15, 3, 20, 4, 18, 12, 22, 7, 23, 10, 24, 11, 2, 13, 6, 5 |
| 16 subset of features | 19, 16, 15, 3, 20, 4, 18, 12, 22, 7, 23, 10, 24, 2, 6, 5 |
| 14 subset of features | 19, 16, 15, 3, 20, 4, 18, 12, 22, 7, 23, 10, 24, 2 |
| 12 subset of features | 19, 16, 15, 3, 20, 4, 18, 12, 22, 7, 23, 10 |
| 10 subset of features | 19, 16, 15, 3, 20, 4, 18, 12, 22, 7 |
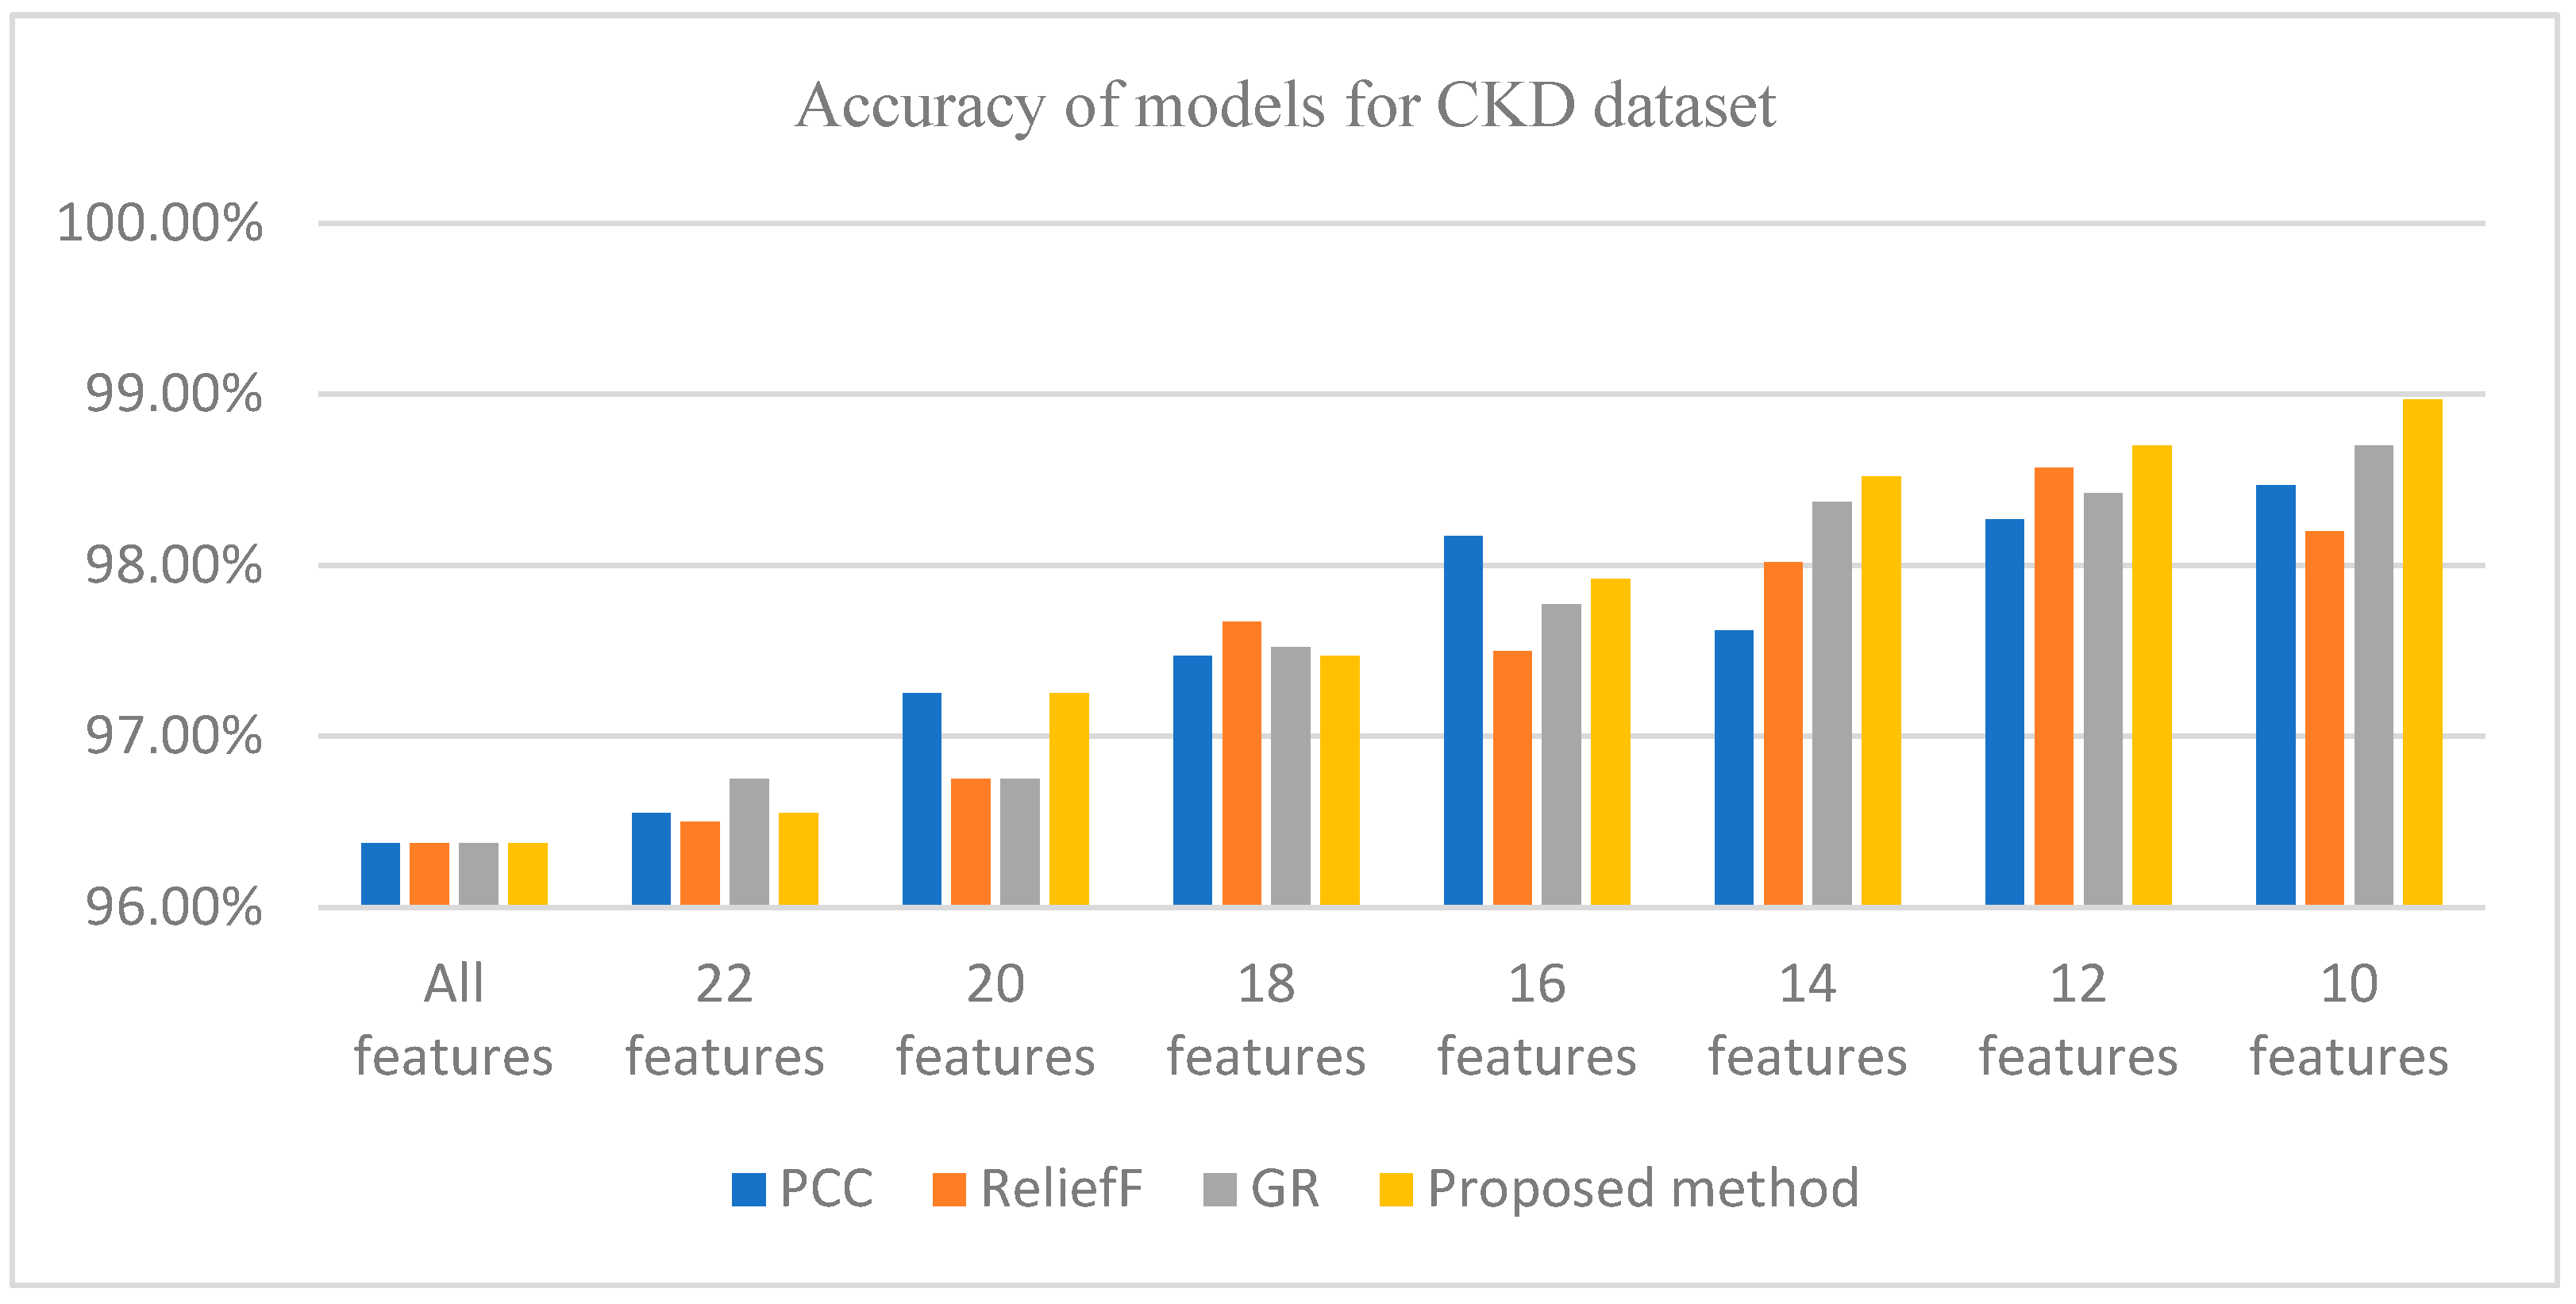
| FS Methods | All Features | 22 Features | 20 Features | 18 Features | 16 Features | 14 Features | 12 Features | 10 Features |
|---|---|---|---|---|---|---|---|---|
| PCC | 96.375% | 96.55% | 97.25% | 97.47% | 98.17% | 97.62% | 98.27% | 98.47% |
| ReliefF | 96.375% | 96.5% | 96.75% | 97.67% | 97.5% | 98.02% | 98.57% | 98.2% |
| GR | 96.375% | 96.75% | 96.75% | 97.52% | 97.77% | 98.37% | 98.42% | 98.7% |
| Proposedmethod | 96.375% | 96.55% | 97.25% | 97.47% | 97.92% | 98.52% | 98.7% | 98.97% |
| FS Methods | Accuracy | Precision | Recall | F Measure |
|---|---|---|---|---|
| PCC | 98.47% | 99.60% | 97.90% | 98.70% |
| ReliefF | 98.2% | 99.80% | 97.30% | 98.50% |
| GR | 98.7% | 99.30% | 98.60% | 98.90% |
| Proposed method | 98.97% | 99.40% | 98.90% | 99.10% |
| Methods | Preprocessing | FS Method | Type of FS Method | Classifier | Accuracy |
|---|---|---|---|---|---|
| Polate et al. [14] | - | Best first search based filter method | Single | SVM | 98.5% |
| Sharma et al. [15] | Missing values filling, rescaling | Not reported | Single | DT | 98.6% |
| Chittora et al. [16] | Rescaling and SMOTE | Not reported | Single | SVM | 98.86% |
| Abdullah et al. [17] | Missing values filling | RF FS | Single | RF | 98.8% |
| Manonmani et al. [9] | Missing values filling | DFS, ITLBO | Ensemble | ANN | 97.7% |
| Sara et al. [18] | - | Filter, Wrapper | Hybrid | SVM | 90.00% |
| Proposed method | Missing values filling | PCC, reliefF, GR | Ensemble | LR | 98.97% |
| FS Methods | Ranked List |
|---|---|
| PCC | 9, 11, 14, 10, 12, 15, 6, 4, 8, 5, 7, 2, 1, 13, 3 |
| ReliefF | 9, 11, 6, 14, 5, 4, 12, 10, 15, 8, 3, 1, 7, 13, 2 |
| GR | 9, 11, 14, 10, 12, 15, 6, 4, 8, 5, 1, 2, 7, 13, 3 |
| Proposed method | 9, 11, 14, 12, 6, 10, 4, 15, 5, 8, 7, 1, 3, 13, 2 |
| Threshold Values | 13 Features | 11 Features | 9 Features | 7 Features |
|---|---|---|---|---|
| Wτ | 0.03076 | 0.0587 | 0.0817 | 0.1313 |
| Rτ | 1.0 | 0.8 | 0.6 | 0.4 |
| No of Features | List of Features |
|---|---|
| 13 subset of features | 9, 11, 14, 12, 6, 10, 4, 15, 8, 7, 1, 3, 13 |
| 11 subset of features | 9, 11, 14, 12, 6, 10, 4, 15, 8, 7, 1 |
| 9 subset of features | 9, 11, 14, 12, 6, 10, 4, 15, 8 |
| 7 subset of features | 9, 11, 14, 12, 6, 10, 4 |
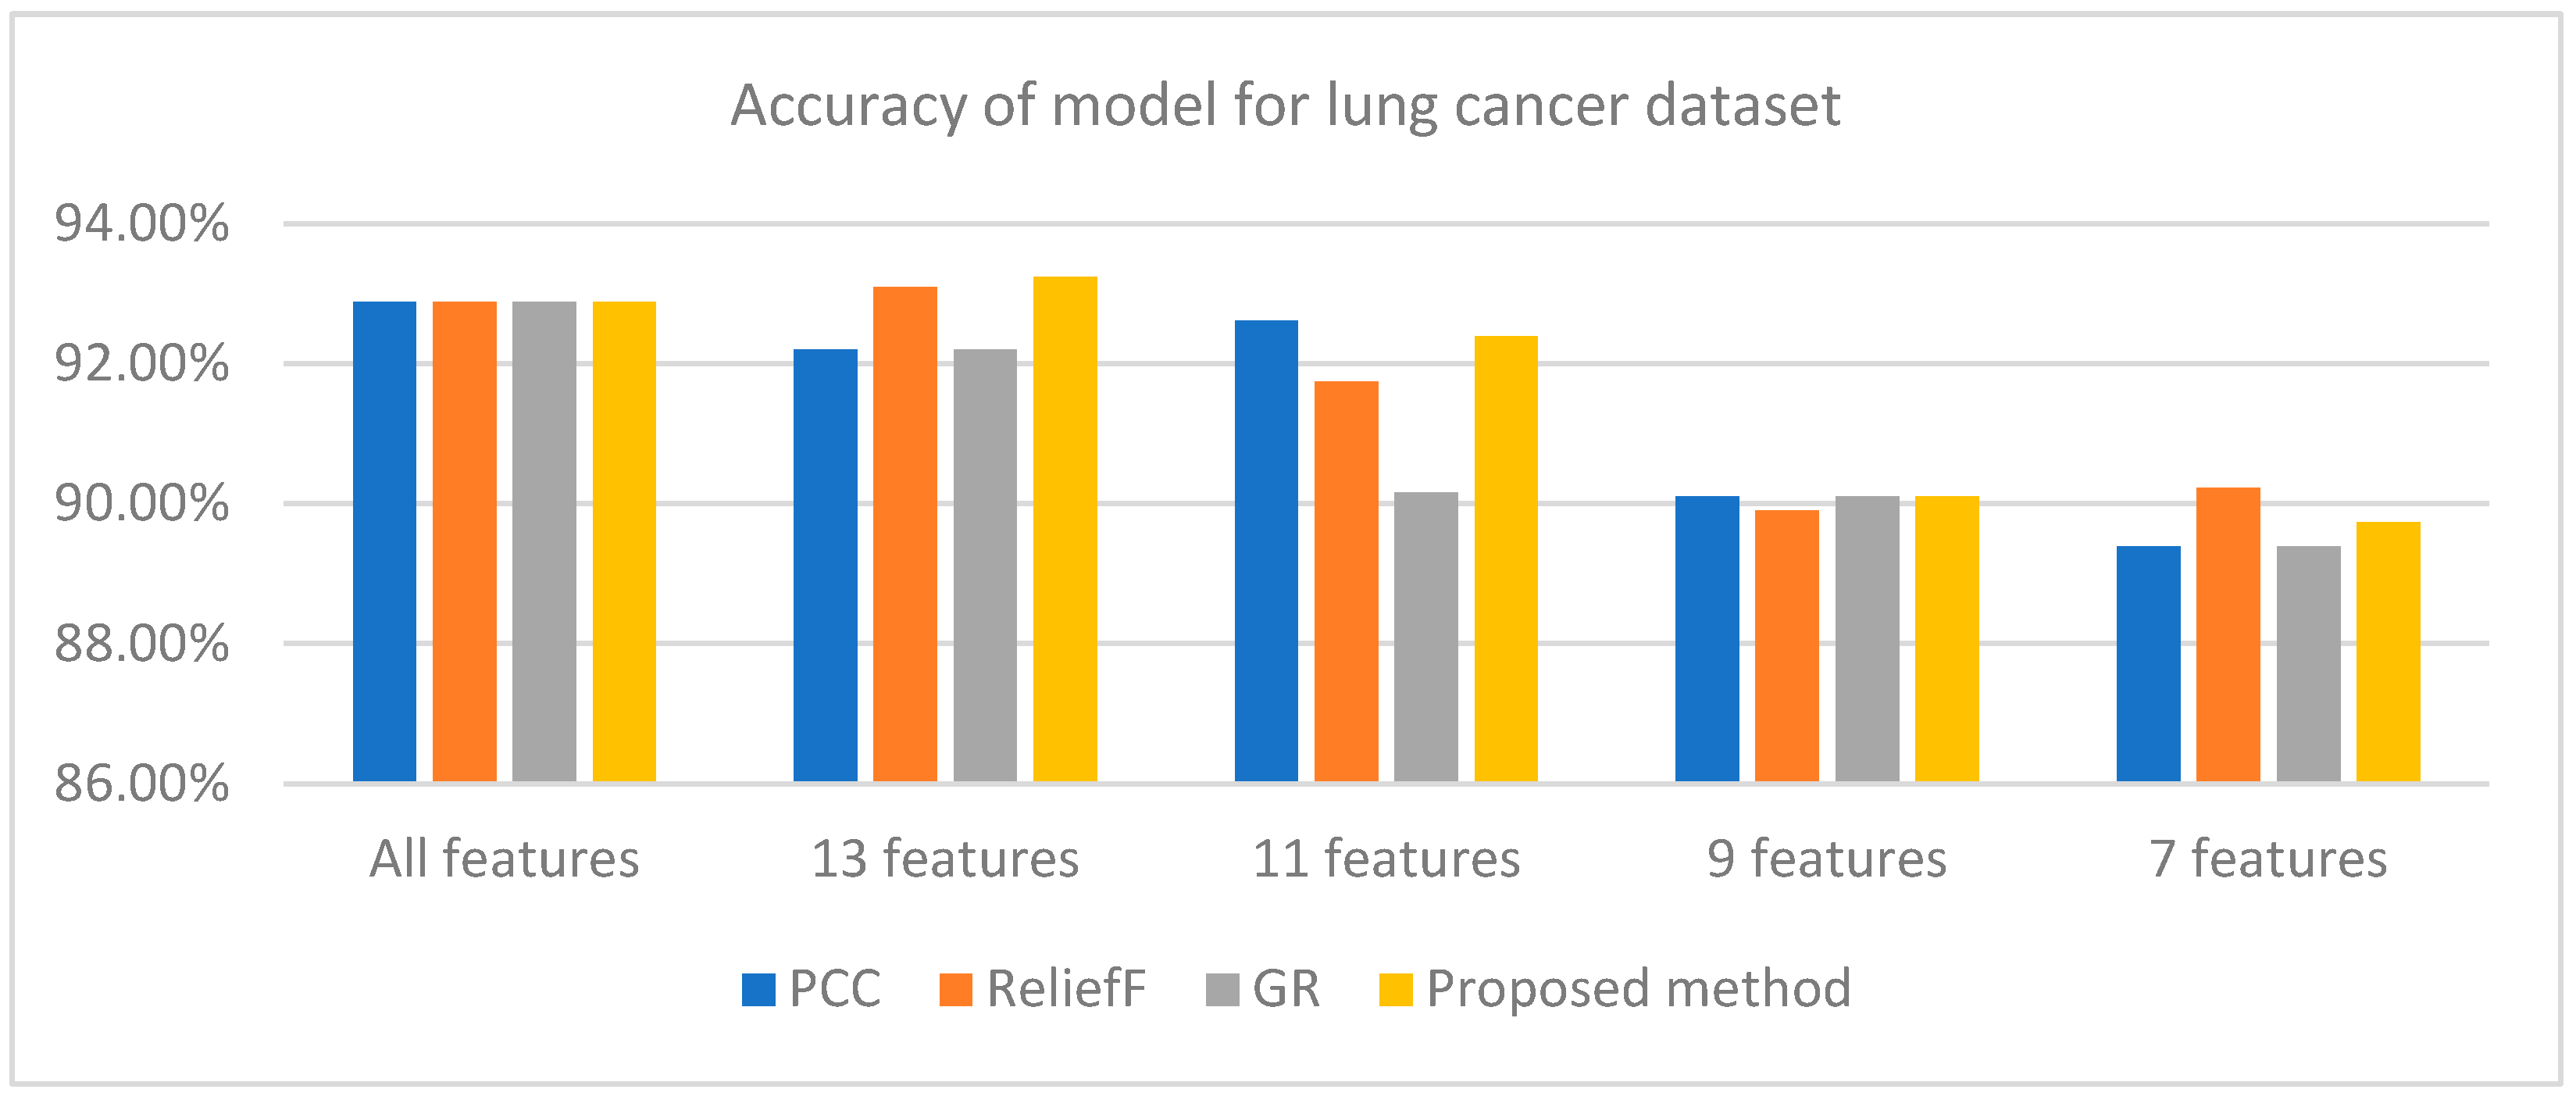
| FS Methods | All Features | 13 Features | 11 Features | 9 Features | 7 Features |
|---|---|---|---|---|---|
| PCC | 92.88% | 92.20% | 92.62% | 90.10% | 89.39% |
| ReliefF | 92.88% | 93.10% | 91.74% | 89.90% | 90.23% |
| GR | 92.88% | 92.20% | 90.16% | 90.10% | 89.39% |
| Proposed method | 92.88% | 93.24% | 92.39% | 90.10% | 89.74% |
| FS Methods | Accuracy | Precision | Recall | F Measure |
|---|---|---|---|---|
| PCC | 92.20% | 94.80% | 96.40% | 95.60% |
| reliefF | 93.10% | 95.10% | 97.10% | 96.09% |
| GR | 92.20% | 94.80% | 96.40% | 95.60% |
| Proposed method | 93.24% | 95.50% | 96.80% | 96.15% |
Disclaimer/Publisher’s Note: The statements, opinions and data contained in all publications are solely those of the individual author(s) and contributor(s) and not of MDPI and/or the editor(s). MDPI and/or the editor(s) disclaim responsibility for any injury to people or property resulting from any ideas, methods, instructions or products referred to in the content. |
© 2024 by the authors. Licensee MDPI, Basel, Switzerland. This article is an open access article distributed under the terms and conditions of the Creative Commons Attribution (CC BY) license (https://creativecommons.org/licenses/by/4.0/).
Share and Cite
Begum, A.M.; Mondal, M.R.H.; Podder, P.; Kamruzzaman, J. Weighted Rank Difference Ensemble: A New Form of Ensemble Feature Selection Method for Medical Datasets. BioMedInformatics 2024, 4, 477-488. https://doi.org/10.3390/biomedinformatics4010027
Begum AM, Mondal MRH, Podder P, Kamruzzaman J. Weighted Rank Difference Ensemble: A New Form of Ensemble Feature Selection Method for Medical Datasets. BioMedInformatics. 2024; 4(1):477-488. https://doi.org/10.3390/biomedinformatics4010027
Chicago/Turabian StyleBegum, Arju Manara, M. Rubaiyat Hossain Mondal, Prajoy Podder, and Joarder Kamruzzaman. 2024. "Weighted Rank Difference Ensemble: A New Form of Ensemble Feature Selection Method for Medical Datasets" BioMedInformatics 4, no. 1: 477-488. https://doi.org/10.3390/biomedinformatics4010027
APA StyleBegum, A. M., Mondal, M. R. H., Podder, P., & Kamruzzaman, J. (2024). Weighted Rank Difference Ensemble: A New Form of Ensemble Feature Selection Method for Medical Datasets. BioMedInformatics, 4(1), 477-488. https://doi.org/10.3390/biomedinformatics4010027