Article

Enhancing Brain Tumor Classification with Transfer Learning across Multiple Classes: An In-Depth Analysis

1
Institute of ICT, Bangladesh University of Engineering and Technology, Dhaka 1205, Bangladesh
2
Department of Industrial, Manufacturing and Systems Engineering, University of Texas at EL PASO, El Paso, TX 79968, USA
3
School of Engineering, Robert Gordon University, Aberdeen AB10 7AQ, UK
4
National Subsea Centre, Robert Gordon University, Aberdeen AB21 0BH, UK
5
Independent Researcher
*
Authors to whom correspondence should be addressed.
BioMedInformatics 2023, 3(4), 1124-1144; https://doi.org/10.3390/biomedinformatics3040068
Submission received: 7 August 2023 / Revised: 8 November 2023 / Accepted: 23 November 2023 / Published: 6 December 2023
(This article belongs to the Special Issue Advances in Quantitative Imaging Analysis: From Theory to Practice)

Abstract

:
This study focuses on leveraging data-driven techniques to diagnose brain tumors through magnetic resonance imaging (MRI) images. Utilizing the rule of deep learning (DL), we introduce and fine-tune two robust frameworks, ResNet 50 and Inception V3, specifically designed for the classification of brain MRI images. Building upon the previous success of ResNet 50 and Inception V3 in classifying other medical imaging datasets, our investigation encompasses datasets with distinct characteristics, including one with four classes and another with two. The primary contribution of our research lies in the meticulous curation of these paired datasets. We have also integrated essential techniques, including Early Stopping and ReduceLROnPlateau, to refine the model through hyperparameter optimization. This involved adding extra layers, experimenting with various loss functions and learning rates, and incorporating dropout layers and regularization to ensure model convergence in predictions. Furthermore, strategic enhancements, such as customized pooling and regularization layers, have significantly elevated the accuracy of our models, resulting in remarkable classification accuracy. Notably, the pairing of ResNet 50 with the Nadam optimizer yields extraordinary accuracy rates, reaching 99.34% for gliomas, 93.52% for meningiomas, 98.68% for non-tumorous images, and 97.70% for pituitary tumors. These results underscore the transformative potential of our custom-made approach, achieving an aggregate testing accuracy of 97.68% for these four distinct classes. In a two-class dataset, Resnet 50 with the Adam optimizer excels, demonstrating better precision, recall, F1 score, and an overall accuracy of 99.84%. Moreover, it attains perfect per-class accuracy of 99.62% for ‘Tumor Positive’ and 100% for ‘Tumor Negative’, underscoring a remarkable advancement in the realm of brain tumor categorization. This research underscores the innovative possibilities of DL models and our specialized optimization methods in the domain of diagnosing brain cancer from MRI images.

1. Introduction

There are approximately 200 different kinds of aberrant tissue growths that can occur in humans, and among these are tumors, which can be either malignant or benign. In particular, brain tumors are a dangerous condition that involves abnormal growths in brain tissue that impede the brain’s ability to operate. The fact that there has been a 300 percent increase in the number of deaths attributable to brain tumors over the past three decades demonstrates how critical it is to find a cure for this illness. Brain tumors have the potential to be lethal if they are not treated, highlighting the significance of early diagnosis and treatment in order to enhance patient survival rates. Despite the fact that biopsies of brain tumors can be difficult to perform because of the intricacy of the brain, magnetic resonance imaging (MRI) is frequently utilized as a diagnostic tool [1,2,3,4,5,6,7,8,9,10].
The majority of brain tumors, known as gliomas, begin in the glial cells of the brain. Gliomas are the most frequent type of brain tumor. They are responsible for approximately 30% of all tumors that can be found in the brain and central nervous system, and they account for 80% of all malignant brain tumors [11]. According to the categorization used by the World Health Organization (WHO), gliomas can be broken down into one of four classes, ranging from grade I all the way up to grade IV. Grade I tumors are considered benign and have a texture that is very similar to that of normal glial cells, whereas grade II tumors have a texture that is only slightly different. Grade III tumors are malignant and have an aberrant look to the tissue, whereas grade IV tumors are the most severe stage of gliomas and have apparent tissue abnormalities [11,12]. Grade III tumors are malignant and have an abnormal appearance of tissue.
Meningiomas, on the other hand, form on the membranes inside the head that cover the brain and spinal cord. Meningiomas usually grow slowly, and most of them are harmless. Pituitary tumors come from the pituitary gland, which controls hormone output and the way the body works. These lumps can be harmless, harmless with bone growth, or cancerous. Pituitary tumors can cause problems that can lead to lasting hormone shortages and eye loss [13].
Based on what has been said so far, it is important to find and classify brain tumors early in order to make an accurate diagnosis and choose the best treatment options to save patients’ lives. When a case is complicated, the grading stage can be hard and take a long time for doctors and experts. In these situations, experts usually need to look at the tumor and figure out where it is. They may also need to compare the tumor’s cells with those of nearby areas, add image filters if needed to make the images clearer for humans to understand, and finally figure out if it is a tumor and, if possible, its type and grade. This can take a long time, which shows how important it is to have computer-aided diagnosis (CAD) tools that can find brain tumors at an early stage, shortening the time it takes to diagnose and lowering the need for human intervention [11,12]. Recent advances in machine learning (ML), especially Deep Learning (DL), have changed how medical image patterns are found and put into groups. Machine learning has shown promise in a number of medical areas, such as predicting and diagnosing diseases, classifying images, and separating tissues. Convolutional Neural Network (CNNs) have become useful tools for processing images because they can make accurate diagnoses from a large number of incoming images. For representation learning, independent learning methods such as autoencoders have also been used. Several studies have used different methods and models to look into how to find brain tumors. However, some of these studies have problems, such as the fact that they do not compare their results to those of traditional machine learning methods or that they require complicated calculations. The knowledge of radiologists is needed to diagnose tumors from medical medical X-ray or CT Scanned images, and mistakes can happen. Computer-assisted interventions and computational intelligence methods can help doctors find and describe brain tumors more correctly, so they do not have to rely on their own opinions as much. DL and ML techniques, in particular, can be very helpful for studying, segmenting, and classifying cancer pictures, including those of brain tumors. By using these methods, tumors can be found accurately and reliably, making it possible to tell those apart from other diseases that look similar. Although various studies have been conducted in the field of DL-based brain tumor diagnosis, the literature review section demonstrates that the performance of existing models varies depending on the datasets, and there is room for improvement in the frameworks.
In this study, we present a functional system that combines the skills of an accurate and automatic classification DL model to classify whether a brain MRI tumor image has a tumor present or not, as well as identify three types of tumors such as glioma, meningioma, or pituitary classification. At present, DL models have achieved good success in image classification. In the case of feature extraction, these models can identify essential features of the object in the layer of these models, which makes it much easier for the classifier to identify the different features.
The major contributions of this paper are listed below:
a.
The Resnet 50 and Inception V3 designs from CNN Architecture were selected to assess the effectiveness of DL models in the task of classifying tumors from brain MRI, as these designs have shown expertise in picture categorization.
b.
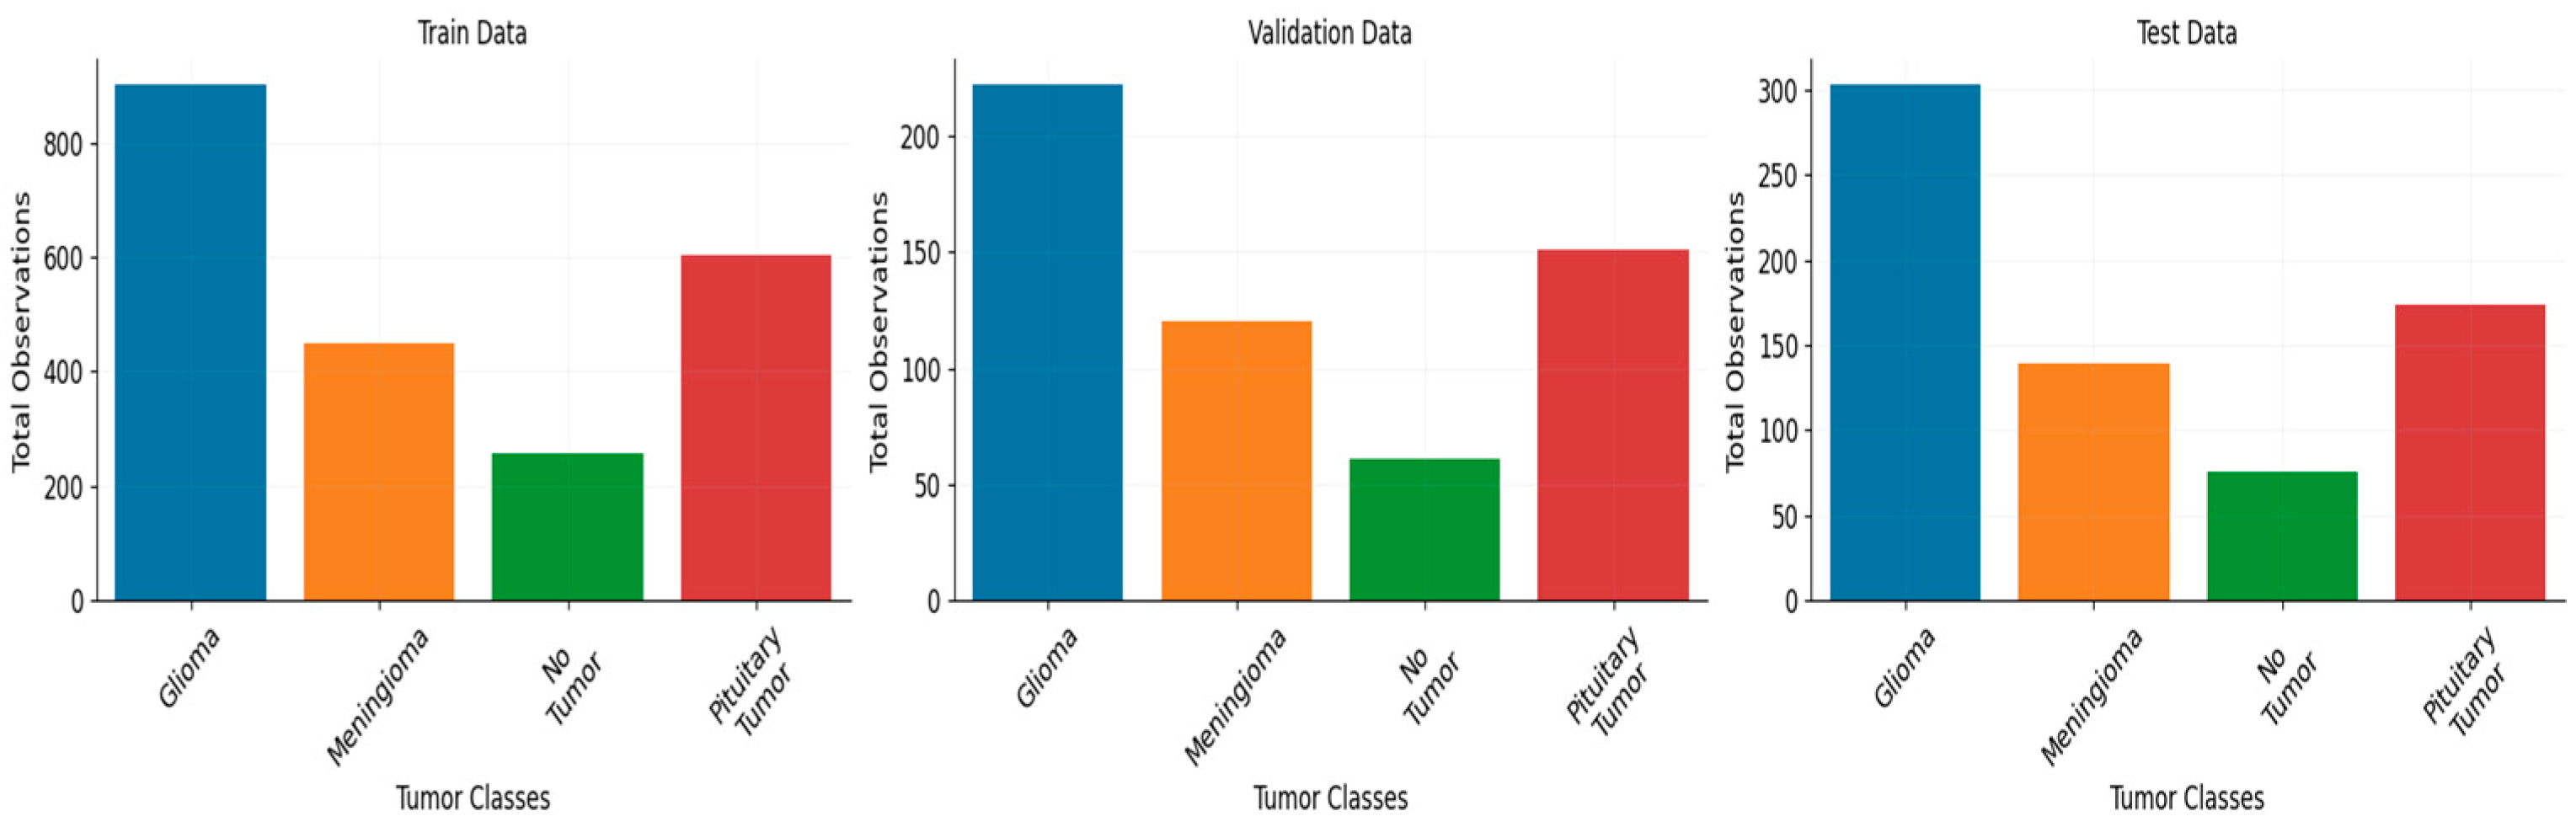
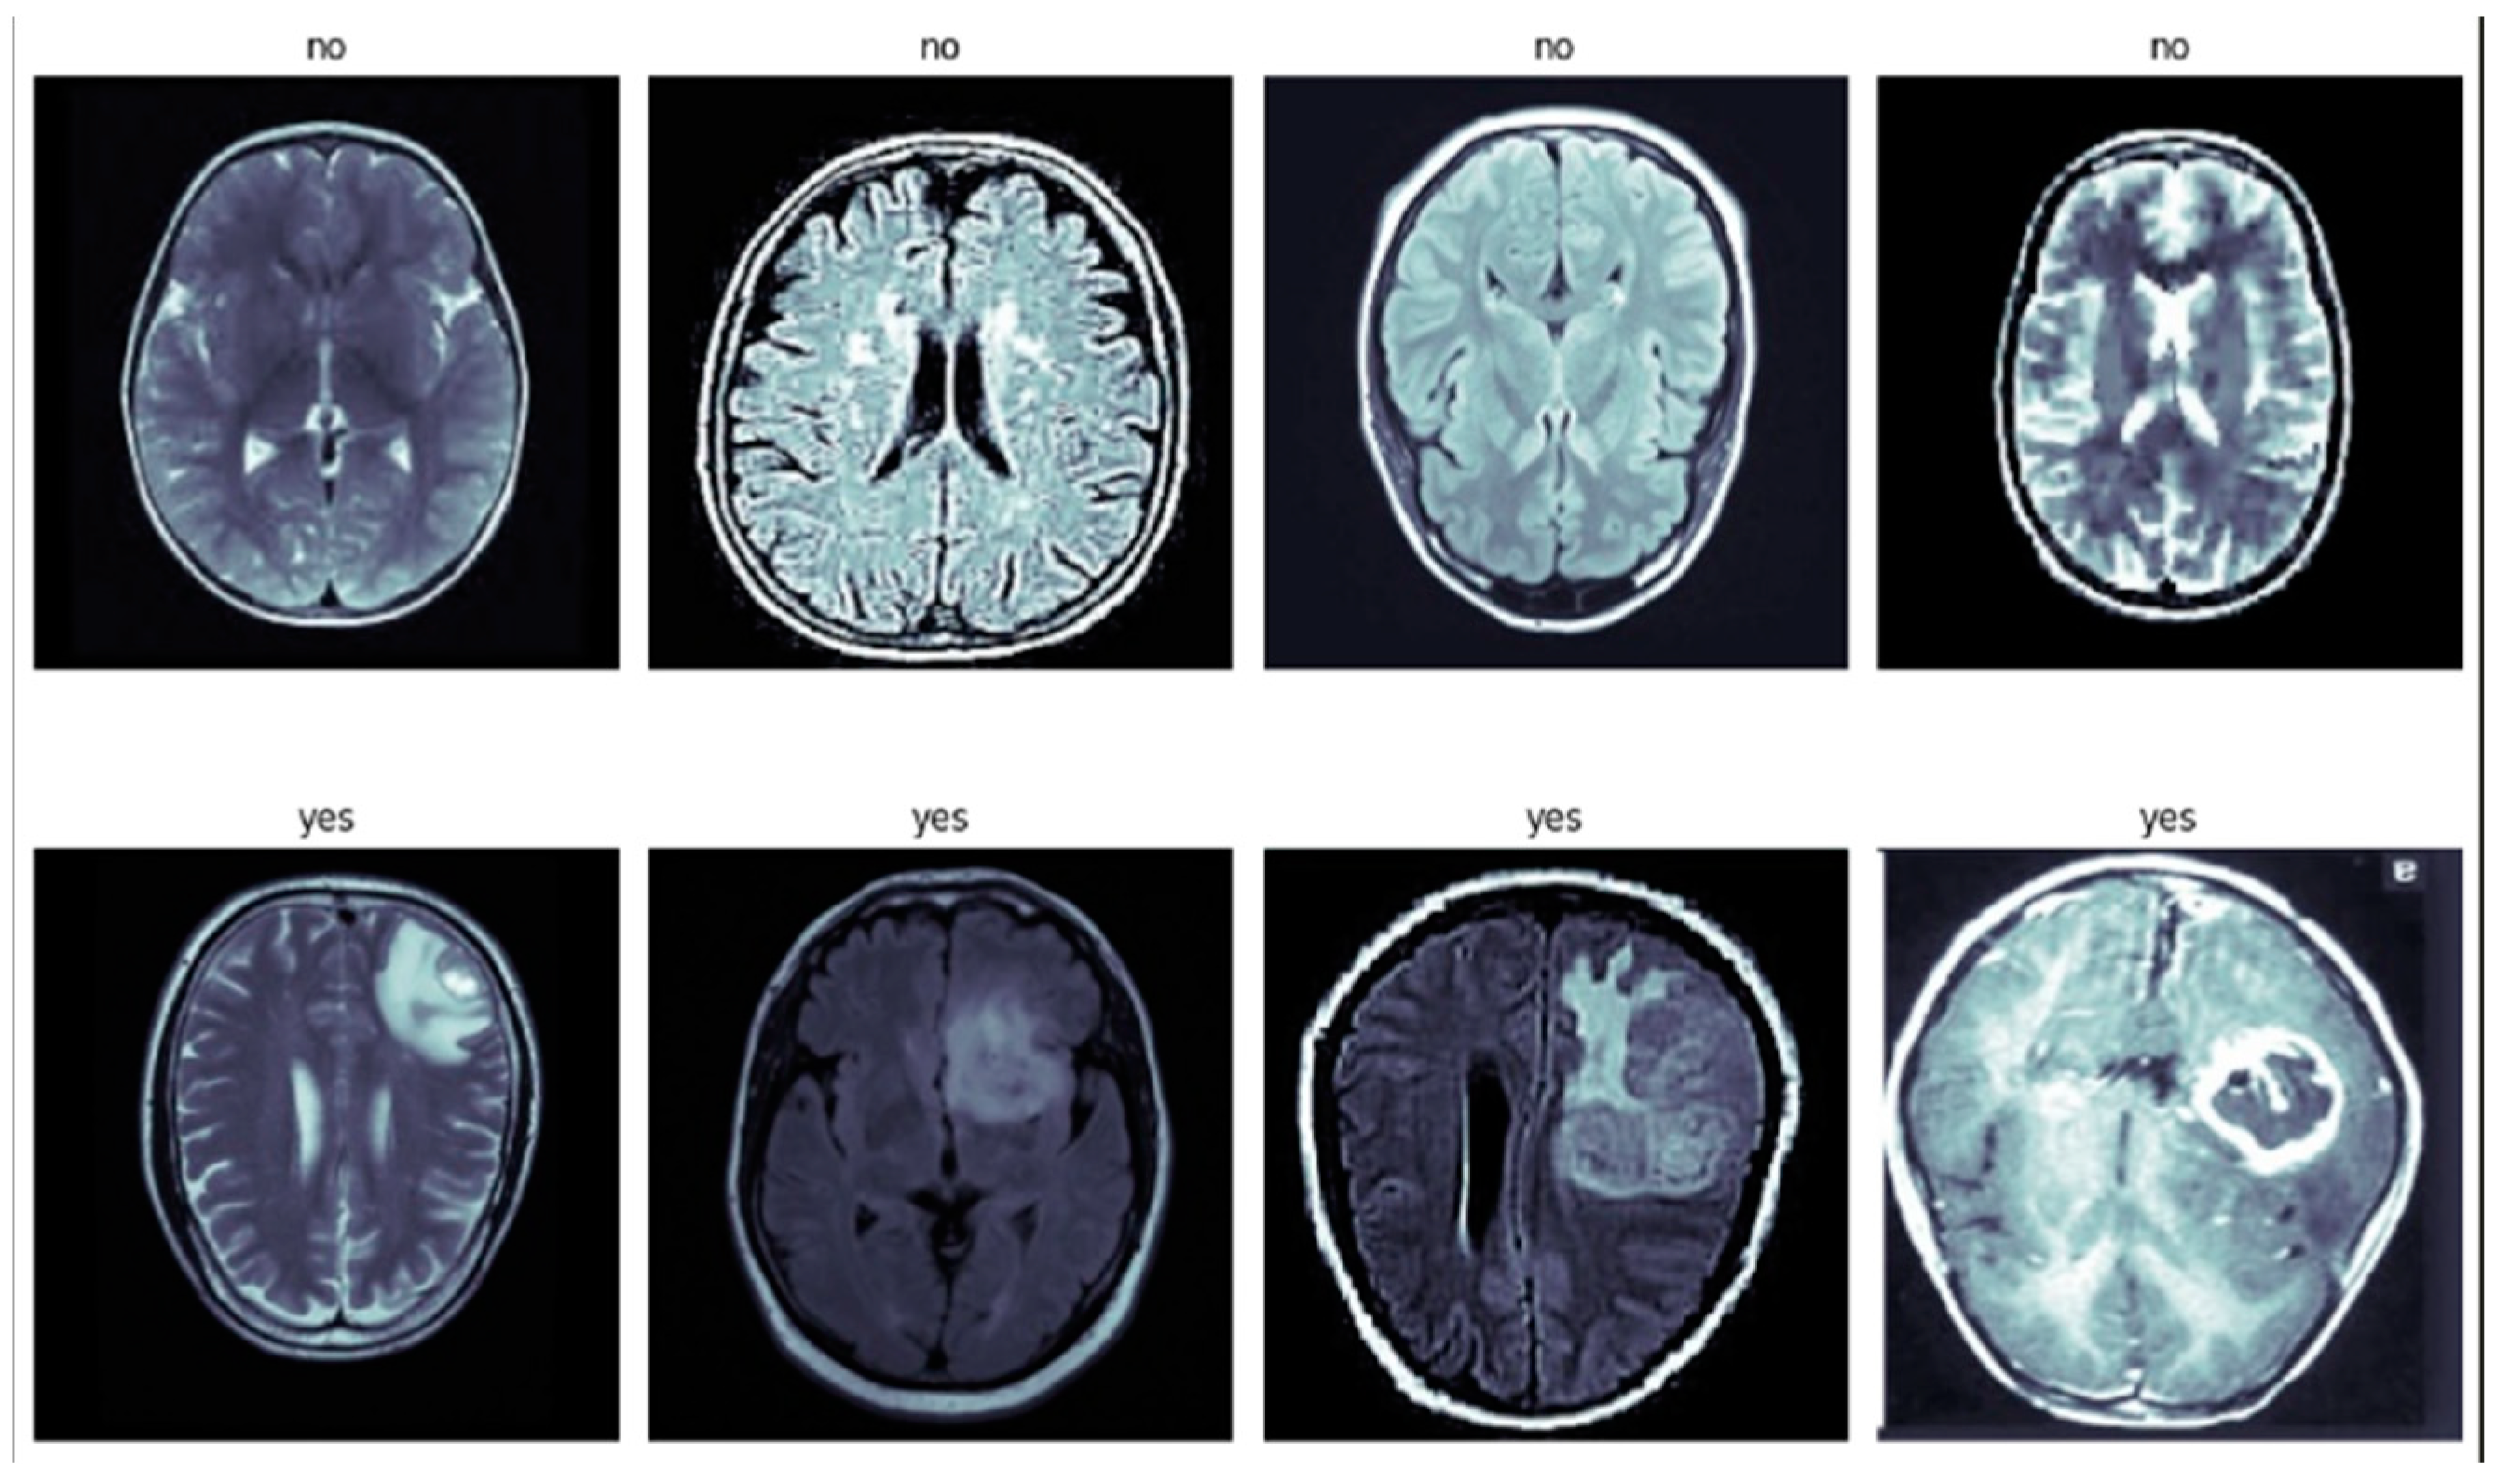
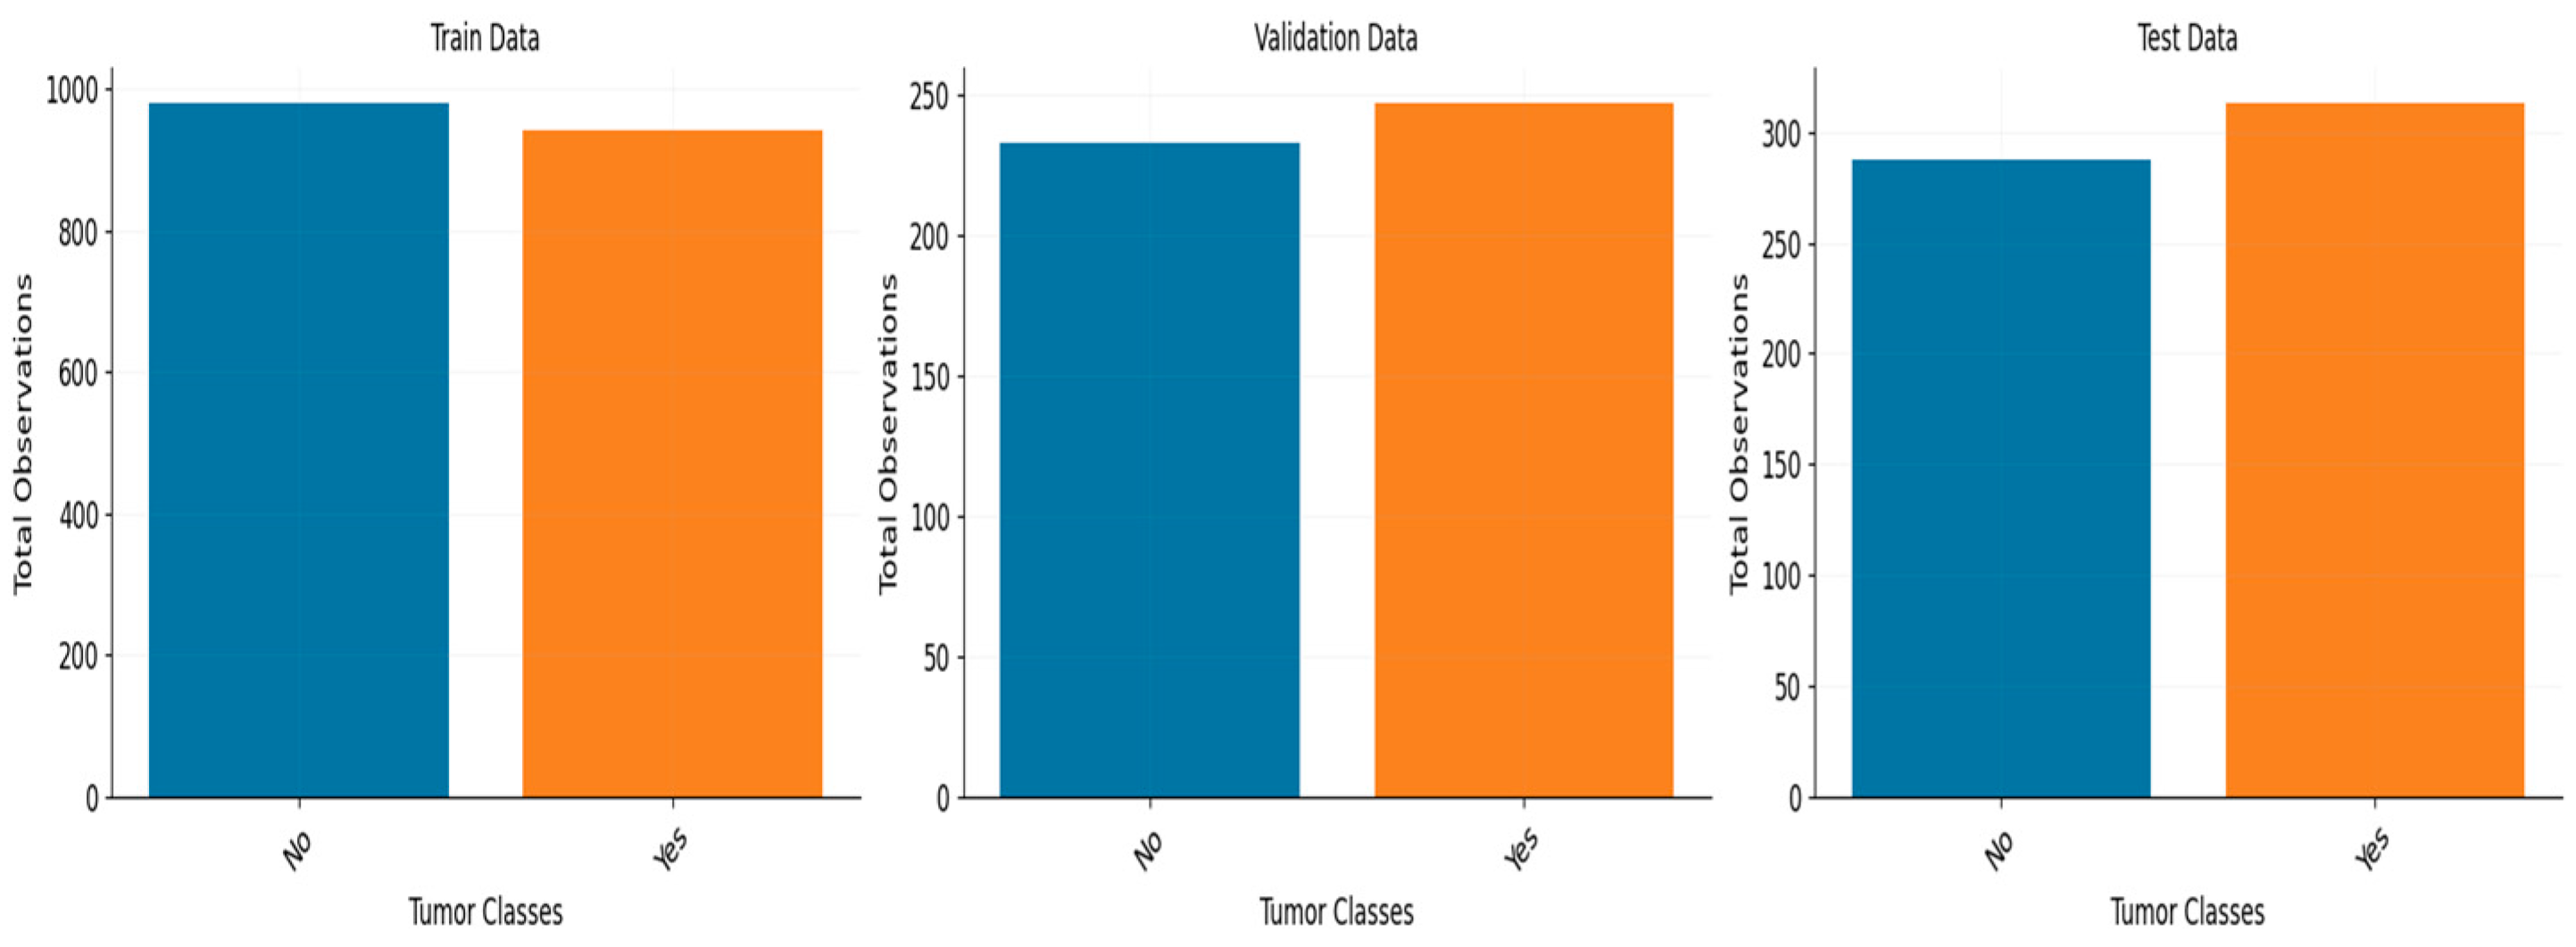
The performance of the model was assessed on two datasets. One dataset consists of 3459 MRI scans belonging to four distinct classes, while the second dataset has 3000 MRI images belonging to two distinct classes.
c.
In order to enhance the efficiency of the models in this particular task, various techniques were employed, including Early Stopping and ReduceLROnPlateau. These techniques were utilized to optimize the model through hyperparameter tuning, which involved incorporating additional layers, experimenting with different loss functions and learning rates, and implementing dropout layers and regularization to mitigate overfitting. In both datasets, we observed exceptional performance that is at the forefront of current advancements.
The subsequent sections of the paper are structured in the following manner: Section 2 of this study centers on the comprehensive analysis of the existing literature, while Section 3 provides a concise overview of the datasets utilized in this research. Section 5 provides a theoretical exposition of the models. Section 6 provides an overview of the methodology employed in this study, as well as the proposed architecture. Section 7 of the paper provides an in-depth analysis of the experimental findings, while Section 8 serves as the concluding section, summarizing the key points and implications of the study.

2. The Literature Review

Ghosal et al. [14] proposed a deep-neural-network-based approach using squeeze and excitation ResNet-101 for automatic brain tumor classification in MR images. The study focused on differentiating between the glioma, pituitary tumor, and meningioma. They employed zero-centering intensity normalization and data augmentation to improve performance. The experimental results showed significant improvements in precision, specificity, and sensitivity compared to other recent methods for brain tumor classification. Krishnapriya et al. [15] conducted a study to explore the capability of pre-trained deep convolutional neural network (DCNN) models, specifically VGG-19, VGG-16, ResNet 50, and Inception V3, for categorizing brain MR images. The researchers employed data augmentation and transfer learning techniques to enhance the performance of these models in the classification task. Diaz-Pernas et al. [16] introduced an algorithm for brain tumor segmentation and classification utilizing MRI scans of meningioma, glioma, and pituitary tumors that is fully automated. They employed CNN to operationalize the concept of a multi-scale strategy that is intrinsic to human cognitive processes. The researchers attained a 97% level of precision when analyzing a set of 3064-slice images obtained from a cohort of 233 patients. A CNN architecture was employed [17] that consisted of 16 convolution layers, pooling and normalization layers, and a dropout layer that preceded the fully connected layer. The study revealed a 96% precision level when 68% of the images were utilized for training purposes, while the remaining pictures were allocated for validation and testing. The study conducted by Abd et al. [18] involved the analysis of 25,000 MRI images of the brain using a differential (DCNN) for the purpose of identifying different types of brain tumors. They attained an exceptional overall performance, exhibiting a precision rate of 99.25% during the training phase. The study by Sajja and colleagues [19] utilized Brat’s dataset, consisting of 577 T1-weighted brain tumors, to classify malignant and benign tumors through the implementation of the VGG16 network. The performers exhibited a level of inaccuracy of 96.70 during their performance. A CNN was proposed in [20] to classify different types of brain cancers, including the glioma tumor, meningioma tumor, and pituitary tumor. The dataset consisted of 3064 T1-weighted contrast-enhanced MRI images. The CNN architecture underwent training to effectively employ multiple convolutional and pooling techniques. The researchers achieved a 94% accuracy rate through the implementation of a convolutional network that was resized based on convolutional filters/kernels of varying sizes. Abiwinanda et al. [21] utilized 64 fully connected neurons and two convolution layers. They did not use the entire dataset but instead selected 700 images from each form of brain tumor in order to balance the data. For training, a subset of 500 tumor images from each class was used, and for testing, a subset of 200 images was used. They did not utilize data enhancement. Their classification accuracy was 84.1%. The classification CNN model proposed by Pashaei et al. [22] consists of four convolution and normalization layers, three max-pooling layers, and a final completely connected layer. They utilized 70% of the dataset for training with no data augmentation and 30% for testing with 10-fold cross-validation. The accuracy of classification was 81.0%. Afshar et al. [23] proposed the Capsule network (CapsNet) classification model for brain tumors. To improve accuracy, they modified the feature mappings in the convolutional layer of CapsNet. Using 64 feature maps and one convolutional layer of CapsNet, the maximum accuracy of 86.56 percent was achieved. Table 1 summarizes the literature reviews. Ibrokhiov et al. [24], in response to the rising incidence of pneumonia, particularly in the wake of the COVID-19 pandemic, introduced an advanced DL-based computer-aided diagnostic system, leveraging transfer learning and parallel computing techniques with VGG19 and ResNet 50 models, achieving an impressive average classification accuracy of 96.6% on the COVID-QU-Ex dataset. Edgar M et al. [25] address the challenge of interpreting machine learning algorithms applied to medical image data, specifically in predicting brain tumor survival rates from MRI scans. By leveraging explainable AI techniques, such as Shapley overlays, in conjunction with CNN and the BraTS 2020 dataset, this research demonstrates the improved interpretability of key features, facilitating expert validation and enhancing the overall evaluation of predictive outcomes. Shokouhifar et al. [26] present THENDEL, a three-stage DL model embedded in a camera scanning tool for noninvasive and rapid lymphedema arm volume measurement. THENDEL combines various feature extractors and regressors, with hyperparameters optimized using a swarm intelligence algorithm. The study successfully measured arm volumes in 730 arms from 365 women, showing strong reliability with a mean absolute error of 36.65 mL, a mean percent error of 1.69%, and a 0.992 correlation with actual volumes. Veeraiah et al. [27] introduce MayGAN for Leukemia classification with 99.8% accuracy. Aryai et al. [28] present MDML-RP for efficient health monitoring in WBANs, achieving substantial performance gains. Ibtisum et al. [29] offer a comparative study on diverse Big Data tools, contributing to the evolving data analytics field.

3. Description of the Dataset

The research on brain tumor detection utilized two distinct datasets obtained from publicly accessible online data repositories, namely, figshare.com (accessed on 1 April 2023) [35] and Kaggle (accessed on 1 April 2023) [36]. Cheng et al. [4] focused on the problem of classifying 3-class brain tumors using T1-MRI data. This was the first significant classification study to employ the figshare dataset. Four-class mixed datasets were discovered in a GitHub repository [37]. The primary data source for the study was MRI images, as MRI is widely acknowledged as the most effective modality for detecting brain tumors. The first dataset was organized into four classes based on different types of brain tumors: glioma tumor, meningioma, absence of tumor, and pituitary tumor. It consisted of a total of 3459 MRI images. Specifically, there were 1426 images of glioma tumors, 708 images of meningioma tumors, 395 images showing an absence of tumor, and 930 images of pituitary tumors. The images were allocated into three distinct phases: training, validation, and testing, with 60% designated for training, 20% for validation, and another 20% for testing. Figure 1 shows the demonstration of the four-class dataset. Table 2 shows the distribution of the tumor dataset among four classes (glioma, meningioma, non-tumor, and pituitary) within these subsets. In the training phase, a total of 2213 MRI images were used, comprising 901 glioma tumor images, 449 meningioma images, 258 non-tumor images, and 605 pituitary tumor images. The validation phase included 554 images, with 222 glioma tumor images, 120 meningioma images, 61 non-tumor images, and 151 pituitary tumor images. Finally, the testing phase contained 692 images, with 303 glioma tumor images, 139 meningioma images, 76 non-tumor images, and 174 pituitary tumor images. In Figure 2, a bar plot depicting the distribution of the training, testing, and validation datasets for the four classes is displayed.
On the other hand, the second dataset was grouped into two classes: tumor present and tumor absent. This dataset contained a total of 3000 MRI images. There were 1500 images indicating the presence of a tumor and 1500 images showing the absence of a tumor. Similarly to the first dataset, these images were divided into training, validation, and testing sets using the same ratio. Figure 3 displays samples of MRI images from two class datasets.
Similarly, Table 3 provides the distribution of the tumor dataset among two classes: tumor present and tumor absent. Figure 4 provides a clear understanding of the distribution of training, testing, and validation for the two class datasets. In the training phase, there were 1920 images, with 940 indicating the presence of a tumor and 980 showing an absence of a tumor. The validation phase comprised 534 images, with 247 images of tumor present and 287 images of tumor absent. The testing phase had 546 images, with 313 images of tumor present and 233 images of tumor absent.

4. Deep Learning Frameworks

The utilization of transfer learning has been deemed advantageous in the context of the multiclass classification of brain MRI tumors for various reasons:
The availability of data is constrained. The process of gathering and annotating an extensive collection of brain MRI tumor images for individual tumor categories can present difficulties and consume a significant amount of time. The technique of transfer learning enables the utilization of pre-existing models that have been trained on extensive datasets from domains or tasks that are related. This approach effectively addresses the challenge of limited data availability and simplifies the process of training models.
The utilization of pre-trained models, particularly those that have undergone training on extensive image datasets such as ImageNet, has resulted in the acquisition of comprehensive and versatile features that prove advantageous for diverse image recognition endeavors. The acquired features encapsulate universal visual representations that possess versatility across various domains, such as the categorization of brain MRI tumors. Through the utilization of transfer learning, the model is capable of leveraging the extracted features, thereby reducing the need for manual design and extraction of pertinent features, resulting in a more efficient and effective process.
The initialization of a model can be achieved through transfer learning, whereby pre-trained weights are utilized. These weights have been optimized on a significant quantity of data. The present initialization offers a favorable point of departure for the purpose of training on the particular dataset of brain MRI tumors. The utilization of pre-trained weights facilitates the acquisition of both low-level and high-level features, thereby expediting the learning process and hastening the convergence of the model.
Transfer learning is a technique that can enhance the generalization capability of models by transferring knowledge from a pre-trained model in the source domain to a target domain, such as brain MRI tumor classification. The pre-existing model has acquired comprehensive representations from a variety of images, and this expertise can be efficiently applied to the task of categorizing tumors. Consequently, the model has the ability to apprehend pertinent patterns and features of diverse tumor categories, resulting in enhanced efficacy on unobserved data.
The phenomenon of overfitting poses a significant challenge when working with a limited amount of training data. In such cases, the model may tend to memorize the training examples rather than acquiring meaningful representations, thereby increasing the likelihood of overfitting. The utilization of pre-trained models’ regularization effects, learned weights, and generalization abilities through transfer learning serves as a means to alleviate overfitting. The utilization of this technique facilitates the model’s ability to effectively extrapolate to novel tumor images despite a restricted quantity of training samples.

5. Inception V3 and ResNet 50

5.1. Inception V3

The Inception V3 framework is an extension of the fundamental principles of the original InceptionNet, incorporating various improvements to enhance its overall performance. The integration of factorization into reduced convolutions is a significant breakthrough. Multiple convolution layers make up the Inception V3 model. This layer applies a set of learnable filters to the input brain MRI image and performs a convolution operation. The convolution operation consists of sliding the filters over the MRI input and computing the dot product between the filter weights and the respective input segment. The discrete time convolution method can be described by Equation (1):
r t = y w t = a = y a w ( t a )
Here, w is the kernel filter, is the input to the method, t is the time taken, and r is the results. In the case of 2D input data being taken, Equation (2) can be considered:
R i , j = I K i , j = m n I ( i , j ) K ( i m , j n )
The terms i and j show the areas of the desired matrix required after the DL convolution method
The Inception V3 employs factorized convolutions that involve the partitioning of 3 × 3 and 5 × 5 filters into a sequence of 1 × 3 and 3 × 1 convolutions, as opposed to the direct application of larger convolutions. The utilization of this factorization technique results in a reduction of the network’s parameters, while simultaneously preserving its representational capacity. This facilitates more effective training and inference processes, thereby enhancing the overall efficiency.
The utilization of batch normalization is a notable enhancement incorporated in Inception V3. The technique of batch normalization involves the normalization of layer activations across a batch of training samples, which results in a decrease in internal covariate shift and an acceleration of the training process. The utilization of this technique aids in the stabilization and acceleration of the training process for deep neural networks, such as Inception V3 [33,34].
The batch normalization process can be described by the following equations [10]:
Q i = P i μ B   σ β 2 + ε
α β = I M i = M M ( P i μ β ) 2
μ β = 1 N i = 1 M P i
where N is the total number of input data, P i = 1, …, N, μ β is the stack’s average value, σ β is the stack’s standard deviation, and Q i is the new values obtained as a result of the normalization procedure.
Moreover, the Inception V3 model integrates the method of “label smoothing” during the training phase. The technique of label smoothing pertains to the substitution of binary hard labels (0 or 1) with probabilistic soft labels that exhibit values marginally below 1 for affirmative classes and marginally above 0 for negative classes. The implementation of this regularization technique serves the purpose of preventing the model from exhibiting excessive confidence in its predictions, thereby potentially enhancing its generalization performance.
The final layer of Inceptiont V3 is a softmax layer that utilizes probability distribution to allocate probabilities to various categories of brain tumors. The classes offered may encompass a range of tumor types, including but not limited to gliomas, meningiomas, and pituitary tumors, as well as varying degrees of malignancy. The process of training Inception V3 for the purpose of brain tumor classification necessitates the provision of a substantial labeled dataset of brain tumor images to the network. The neural network acquires the ability to reduce a loss function, such as cross-entropy, by means of backpropagation. The optimization procedure involves the modification of the network’s parameters, with the aim of refining them to enhance the precision of tumor categorization.

5.2. ResNet 50

ResNet 50 is a residual network with 50 layers and 26 million parameters that was introduced by Kaiming He et al. at Microsoft Research in 2015 [35]. The term “residual” in the residual network architecture refers to feature subtraction, where instead of learning new features, the network learns from the subtracted features of each layer’s input. This novel training method makes ResNet 50 relatively easier to train than conventional deep (CNNs). The ResNet 50 model used in the study was trained on the ImageNet database, which is a large collection of labeled images frequently used to train DL models. By incorporating skip connections, also known as gated recurrent units or gated units, ResNet 50 overcomes the problem of declining image classification precision. These skip connections establish a direct connection between the input of the nth layer and the (n + xth) layer, allowing for the addition of additional layers to build a more complex neural network [36,37,38,39]. ResNet 50 has a lower time complexity than models such as VGG16 and VGG19, which is a significant benefit. In order to conduct their experiment, the researchers utilized a pretrained ResNet 50 model and customized it to fit their unique input image dataset. Figure 5 depicts the architecture of the pretrained Inception V3 and ResNet 50 model.

5.3. 2D Global Average Pooling Layer

To facilitate the transition from the convolutional layers to the fully connected layers in a DL model, the feature maps are often flattened into a vector using 2D global average pooling. However, 2D global average pooling is used instead of flattening the feature maps. In this pooling procedure, the output is the global average of all feature maps. Global average pooling preserves the feature maps’ spatial information, as opposed to standard pooling methods that down sample the feature maps. It aids in lowering the data’s dimensionality while keeping important features unaffected, which improves generalization and lessens the likelihood of overfitting.

5.4. Dropout Layer

Overfitting in DL models can be avoided with the use of the regularization method known as dropout. It does this by randomly setting some of the input units to zero at the beginning of each training cycle. This method increases the network’s robustness and resistance to overfitting by introducing noise and forcing it to learn redundant representations. Dropout is an efficient tool for decreasing neuronal dependency and nudging the model toward learning more transferable characteristics. It can be implemented after either convolutional or fully connected layers in the model and has been demonstrated to increase deep neural networks’ generalization capacity.

5.5. Dense Layer

It is also called the fully connected layer because each neuron in this layer communicates with its counterpart in the preceding layer. These layers are in charge of figuring out intricate nonlinear connections in the data. Dense layers are frequently added at the end of a DL model to complete the classification of brain MRIs. Depending on the difficulty of the classification task, the thick layer’s neuron count might change. In order to incorporate nonlinearity and enable the model to capture complicated patterns in the data, activation functions such as the rectified linear unit (ReLU) or sigmoid are generally applied to the outputs of dense layers.

5.6. L2 Regularization

Unlike dropout, L2 regularization does not involve deactivating neurons but rather adds a penalty term to the loss function. This penalty encourages the model’s weights to remain small, effectively reducing the complexity of the network. By doing so, L2 regularization prevents individual weights from becoming excessively large and dominating the training process. This regularization method promotes smoother weight distributions, which can lead to improved generalizations on unseen data. L2 regularization is often used in conjunction with other techniques to enhance a deep neural network’s ability to generalize while maintaining the model’s capacity to learn important features from the training data.

6. Methodology and Proposed Architecture

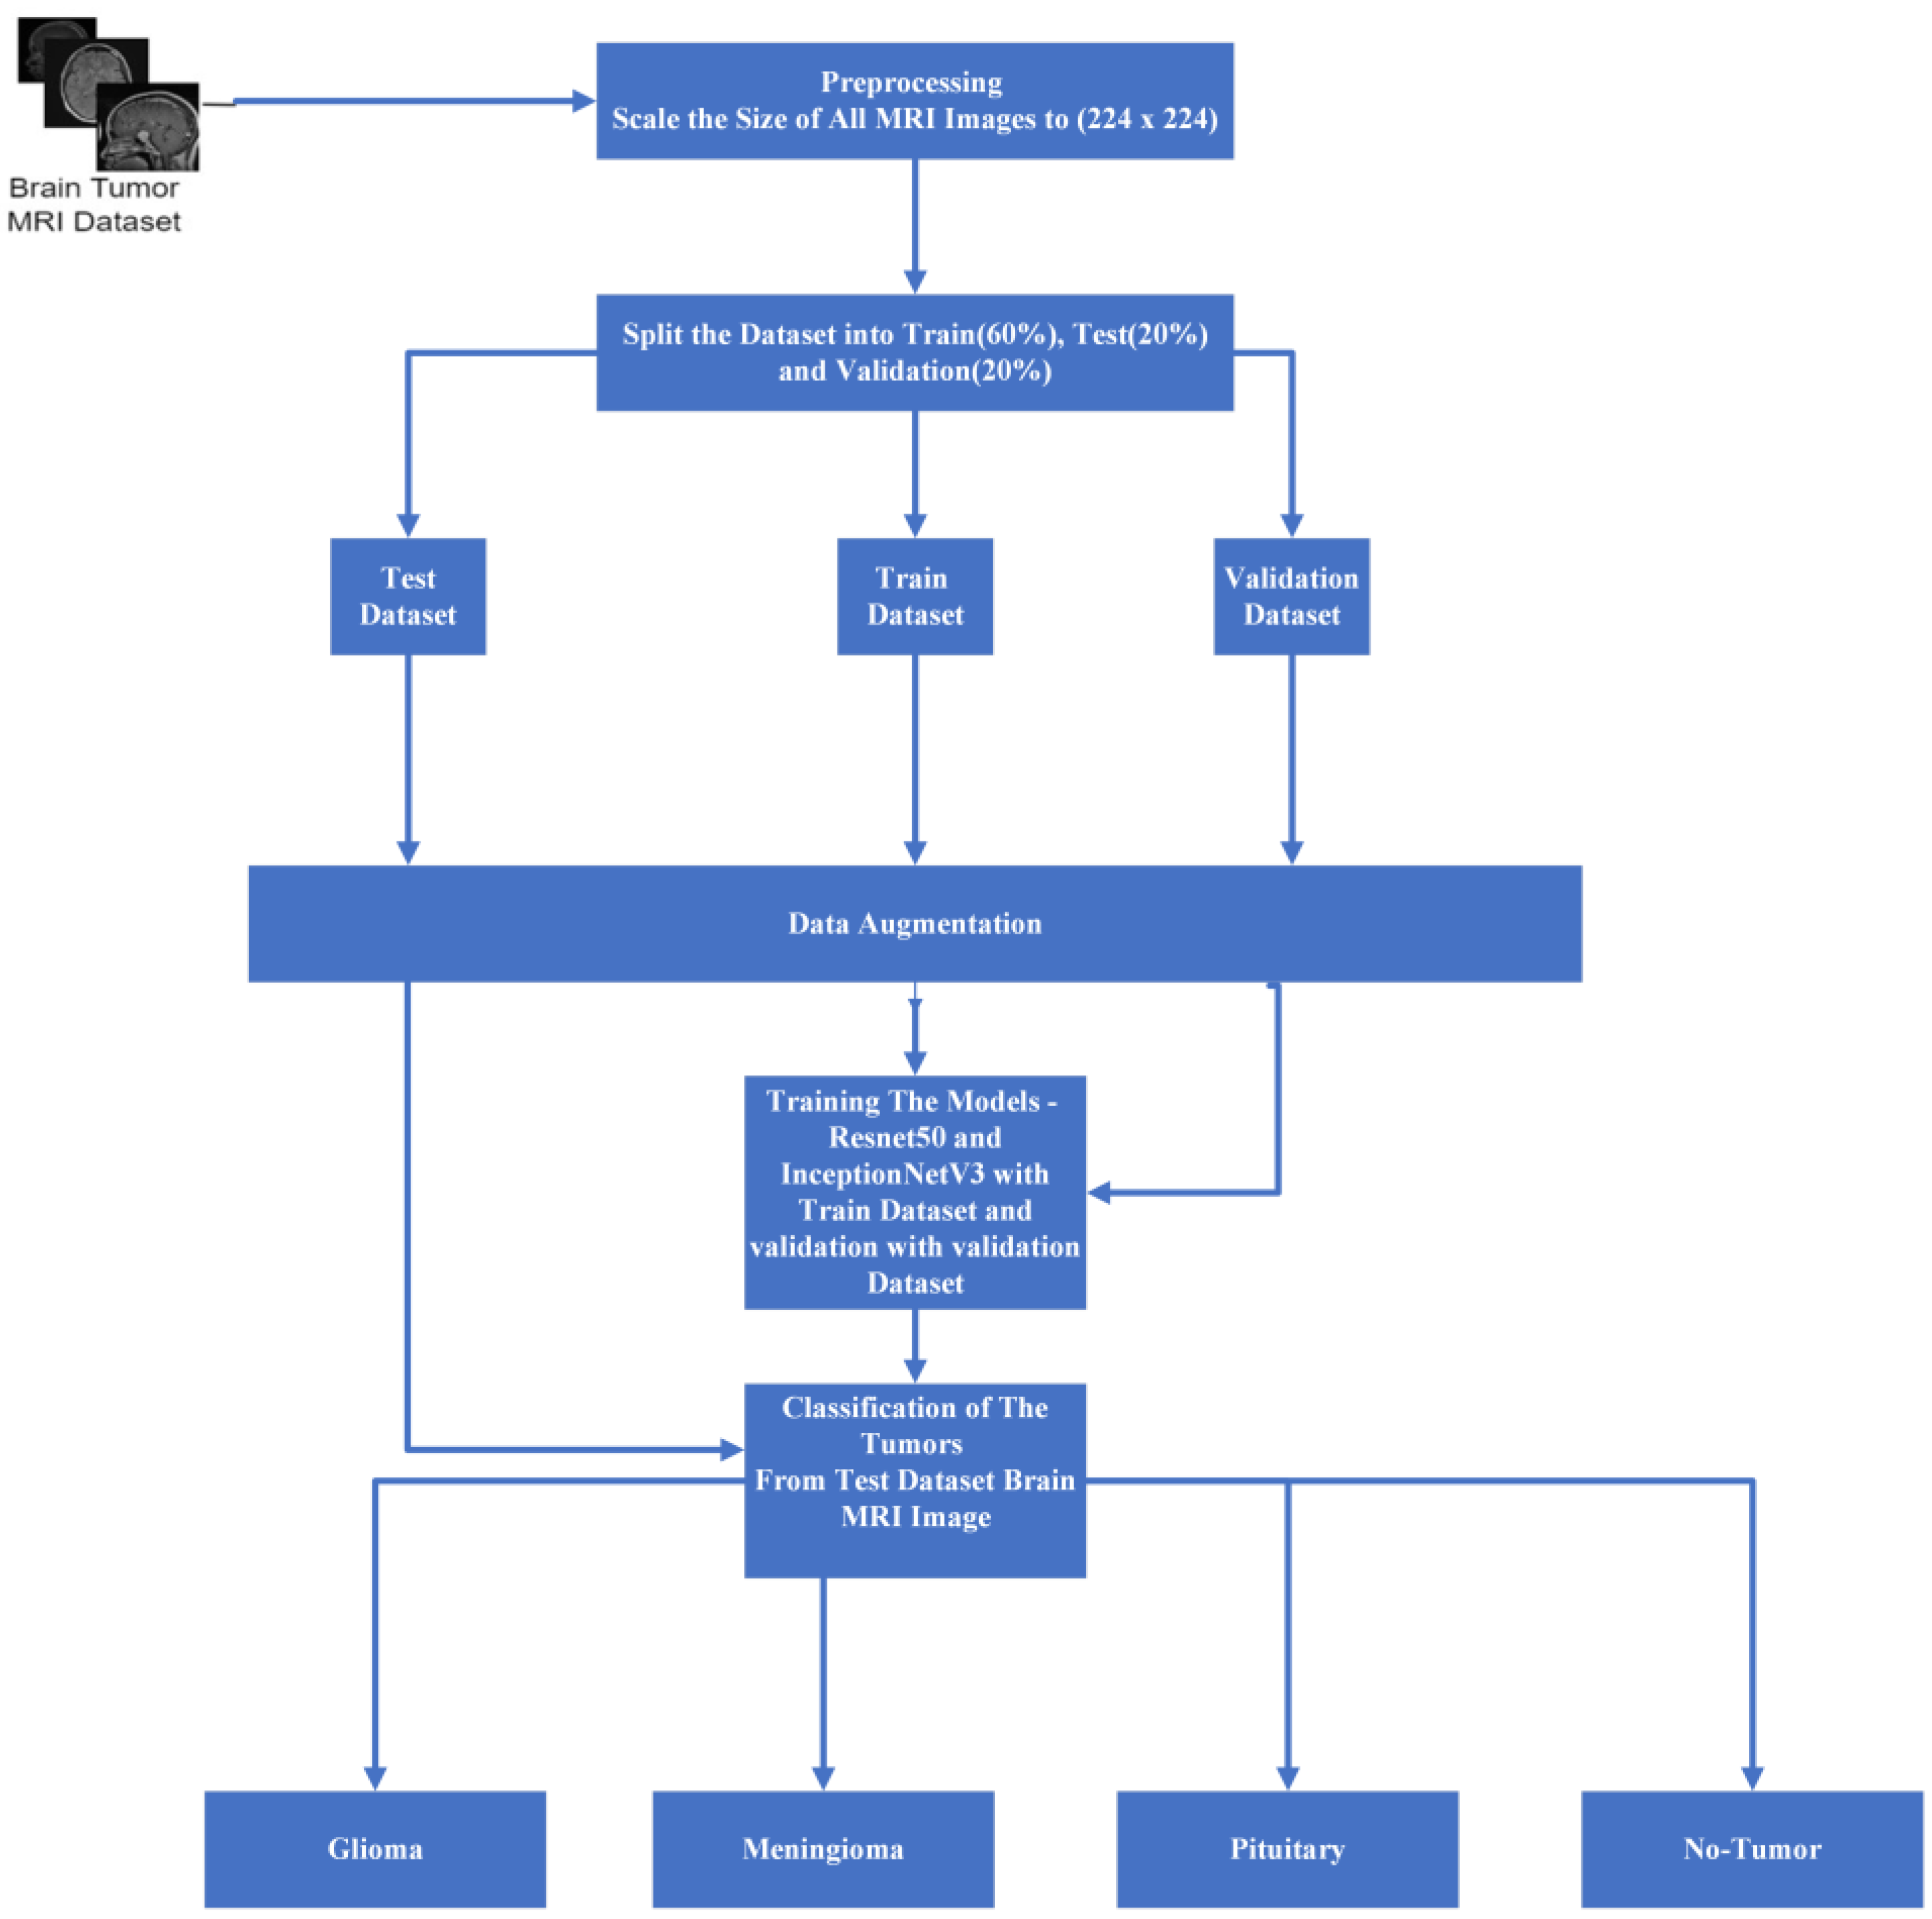
Figure 6 illustrates the comprehensive architecture of our proposed system, which encompasses multiple stages in our experimental process. Upon dataset extraction, we maintained a consistent size of 224 × 224 to ensure uniformity. To alleviate RAM constraints within the training, testing, and validation folders, we meticulously divided the data in accordance with the previously mentioned ratios. The data generation process, orchestrated within the data model, employs diverse data augmentation techniques aimed at mitigating model overfitting. After experimenting with various batch sizes during the loading phase, we settled on a batch size of 16 for optimal performance.
Our data has been trained with ResNet 50 and Inception V3 model optimization. Then, for the purpose of the experiment, we trained our data for up to thirty epochs. Several performance metrics were utilized to evaluate the system as a whole.
Our dataset underwent extensive training, with each model (ResNet 50 and Inception V3) being trained for up to 30 epochs. During this training period, we conducted experiments with three different optimizers: Adam, Nadam, and RMSprop. Additionally, categorical cross-entropy was employed as the loss function. It is noteworthy that our ResNet 50 model achieved its highest accuracy within the initial 12 epochs. To comprehensively assess the system’s performance, we employed a range of performance metrics, providing a holistic evaluation of its efficacy and capabilities.
During the training phase, the inner weights of the model were maintained as non-trainable, with the primary focus placed on training the introduced additional layers. This process involved a systematic introduction of key components, commencing with the incorporation of global average pooling, followed by the sequential implementation of dropout layers. Optimal convergence was determined via experimentation with dropout values ranging from 0.1 to 0.9, ultimately converging on a dropout value of 0.4.
In pursuit of further model optimization, a fully connected layer consisting of 1024 units was introduced, followed by the integration of another dropout layer. Subsequently, a connected layer comprising 512 units was introduced, followed by another dropout layer, culminating in the incorporation of a SoftMax classifier responsible for categorizing images into their respective classes. Vigilant monitoring of the model’s training progress on the validation dataset facilitated judicious adjustments to the fine-tuning strategies as necessitated.
In summary, for optimizing our ResNet 50 and Inception V3 models, we adopted a strategic approach to hyperparameter tuning, with a focus on the additional layers. We kept the base model weights static and experimented with dropout rates, settling on an effective rate of 0.4 after testing various options between 0.1 and 0.9. Our network architecture was enhanced with two fully connected layers, the first containing 1024 neurons and the second 512 neurons, each followed by dropout layers to combat overfitting. The models utilized Adam, Nadam, and RMSprop optimizers for their distinct advantages in convergence and efficiency, with categorical cross-entropy as our loss function. This configuration was refined through continuous validation to ensure optimal performance without overfitting.

7. Experimental Results

The experiments and the outcomes are described in this section. Using an Intel(R) Xeon(R) E5-2680 v4 processor clocked at 2.40 GHz and 32 GB of RAM, the experiments were run in JupyterLab. JupyterLab is the most recent web-based interactive development environment for notebooks, code, and data. It allows users to configure and organize workflows in data science, scientific computing, computational journalism, and machine learning through its adaptable user interface. Moreover, the experiment utilized the libraries Sklearn, numpy, Tensorflow, and Matplotlib.
Two types of transfer learning operations were employed in our study. First, fixed features were removed, and the model was trained using the data at the middle layer. Second, fine-tuning was performed by utilizing the net weights of ResNet 50 and Inception V3, where the fully connected layer at the end was replaced. Additionally, dense and regularization layers were incorporated.
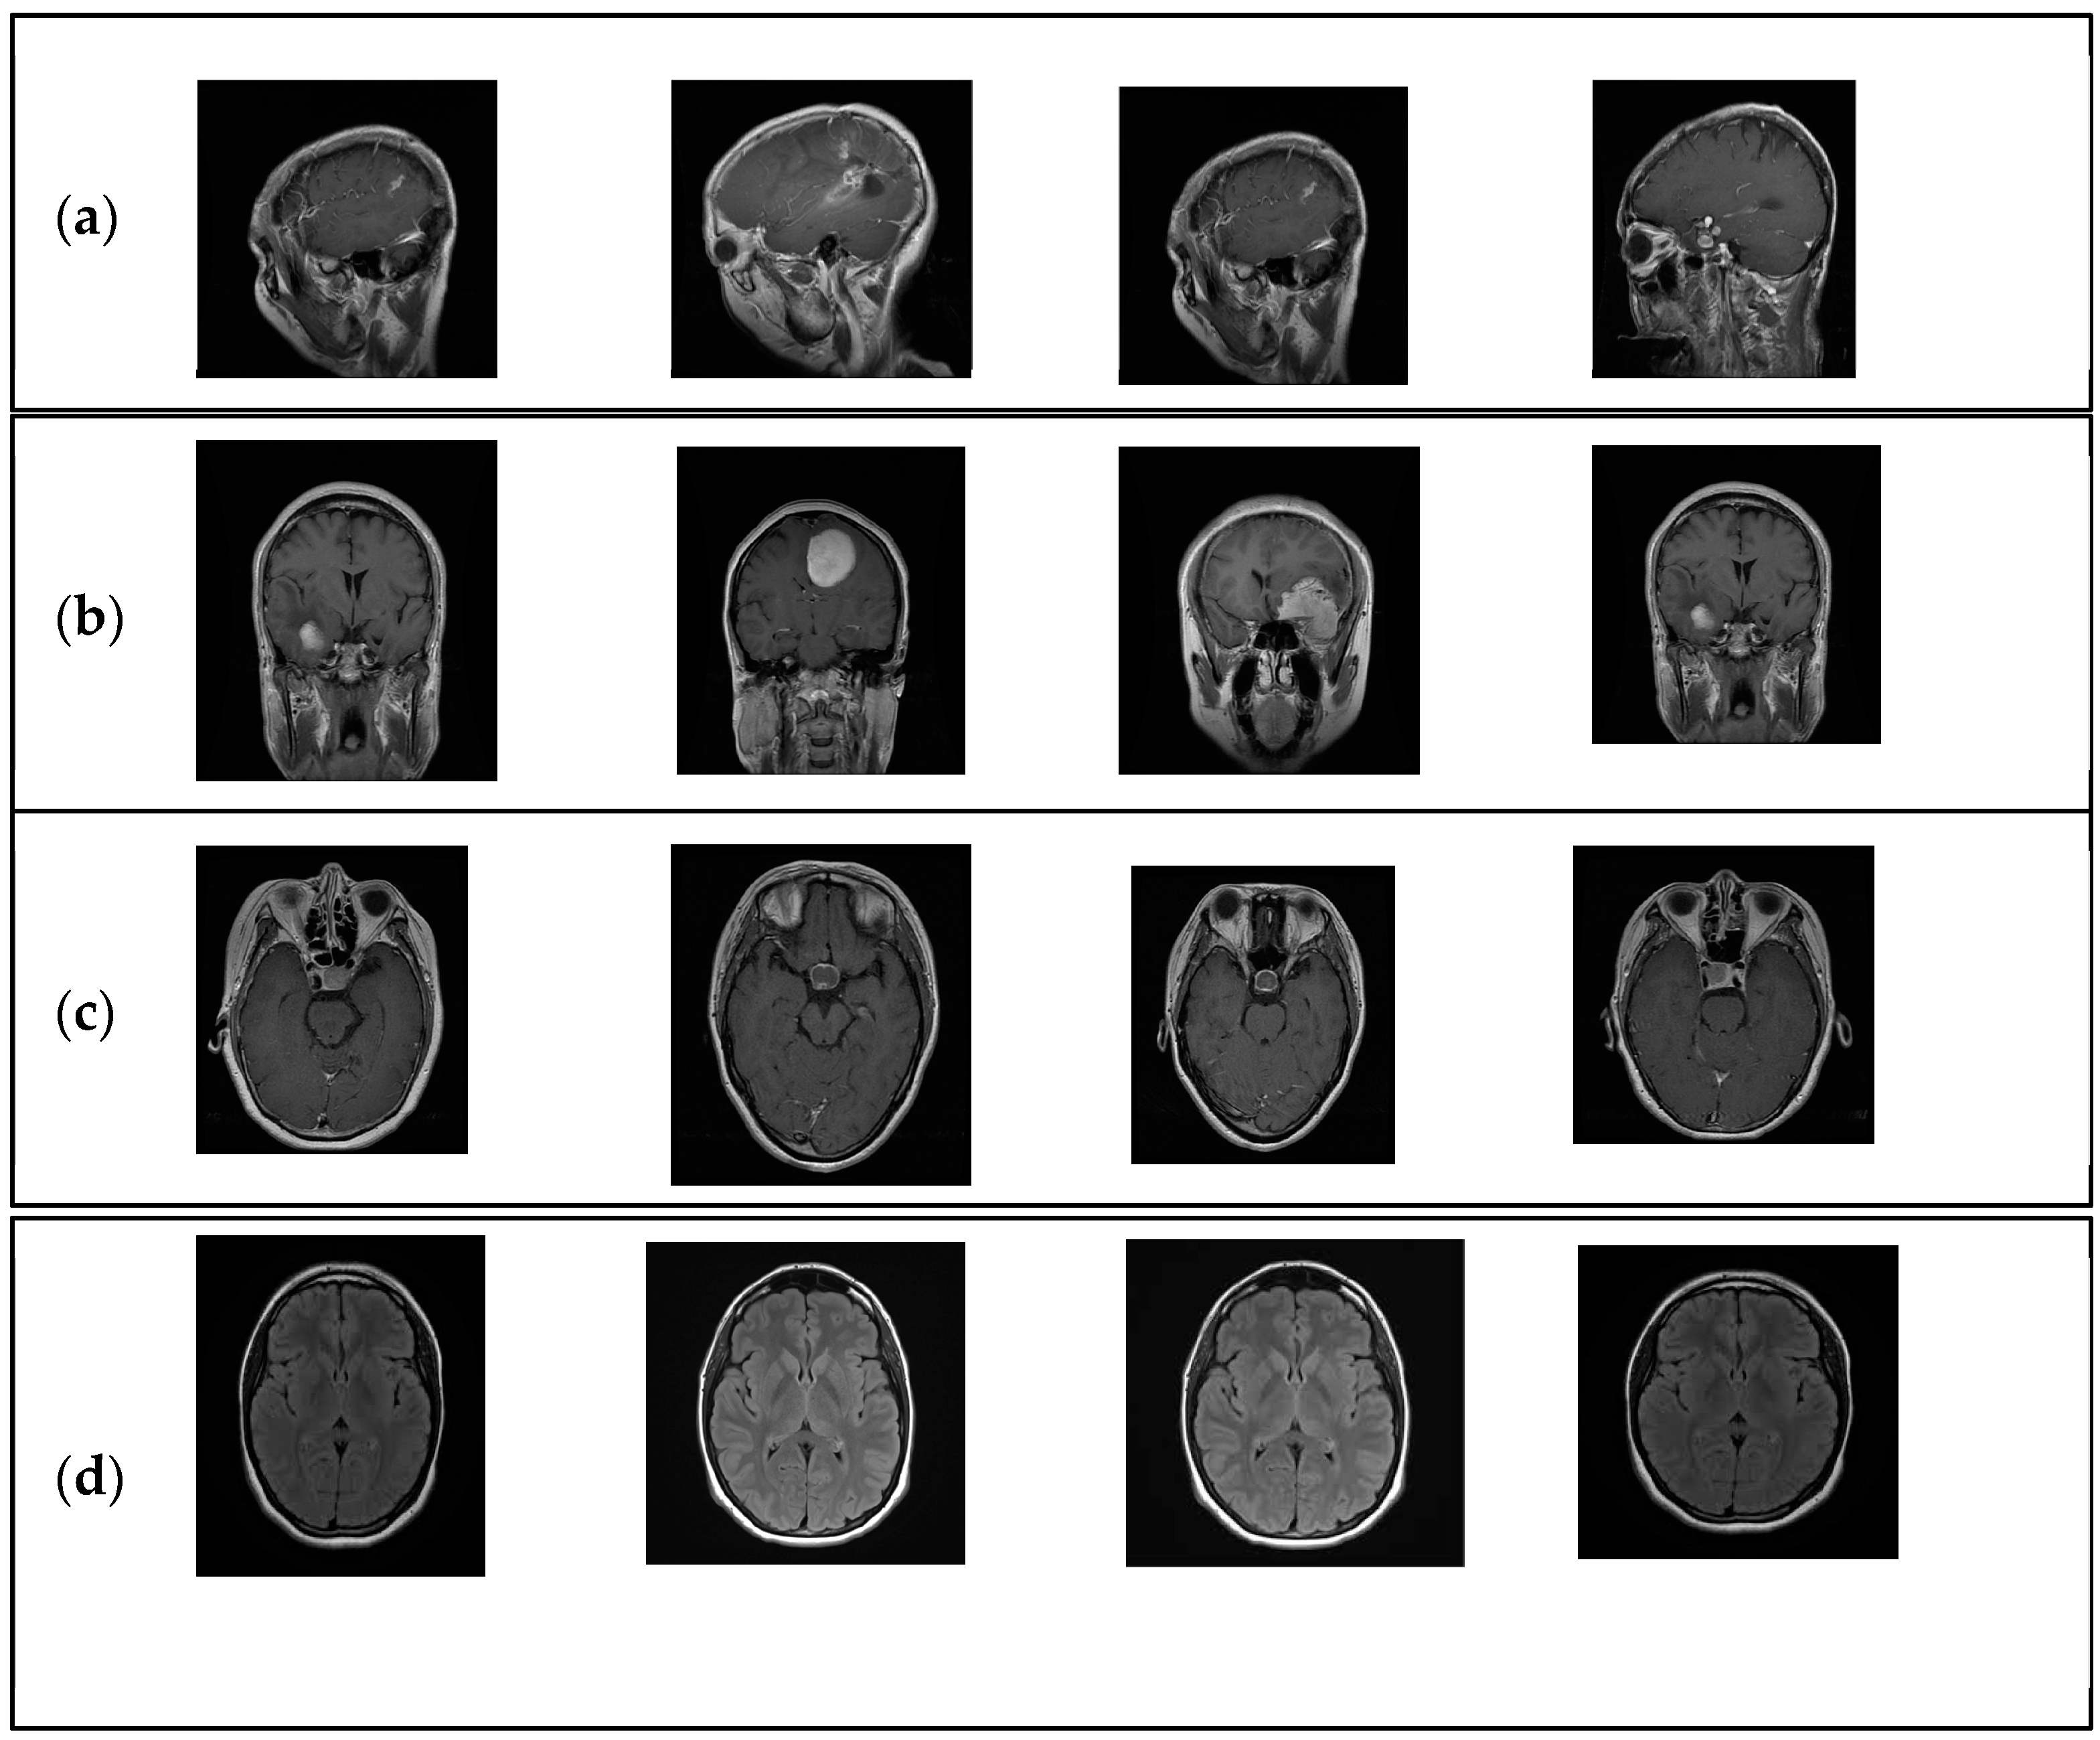
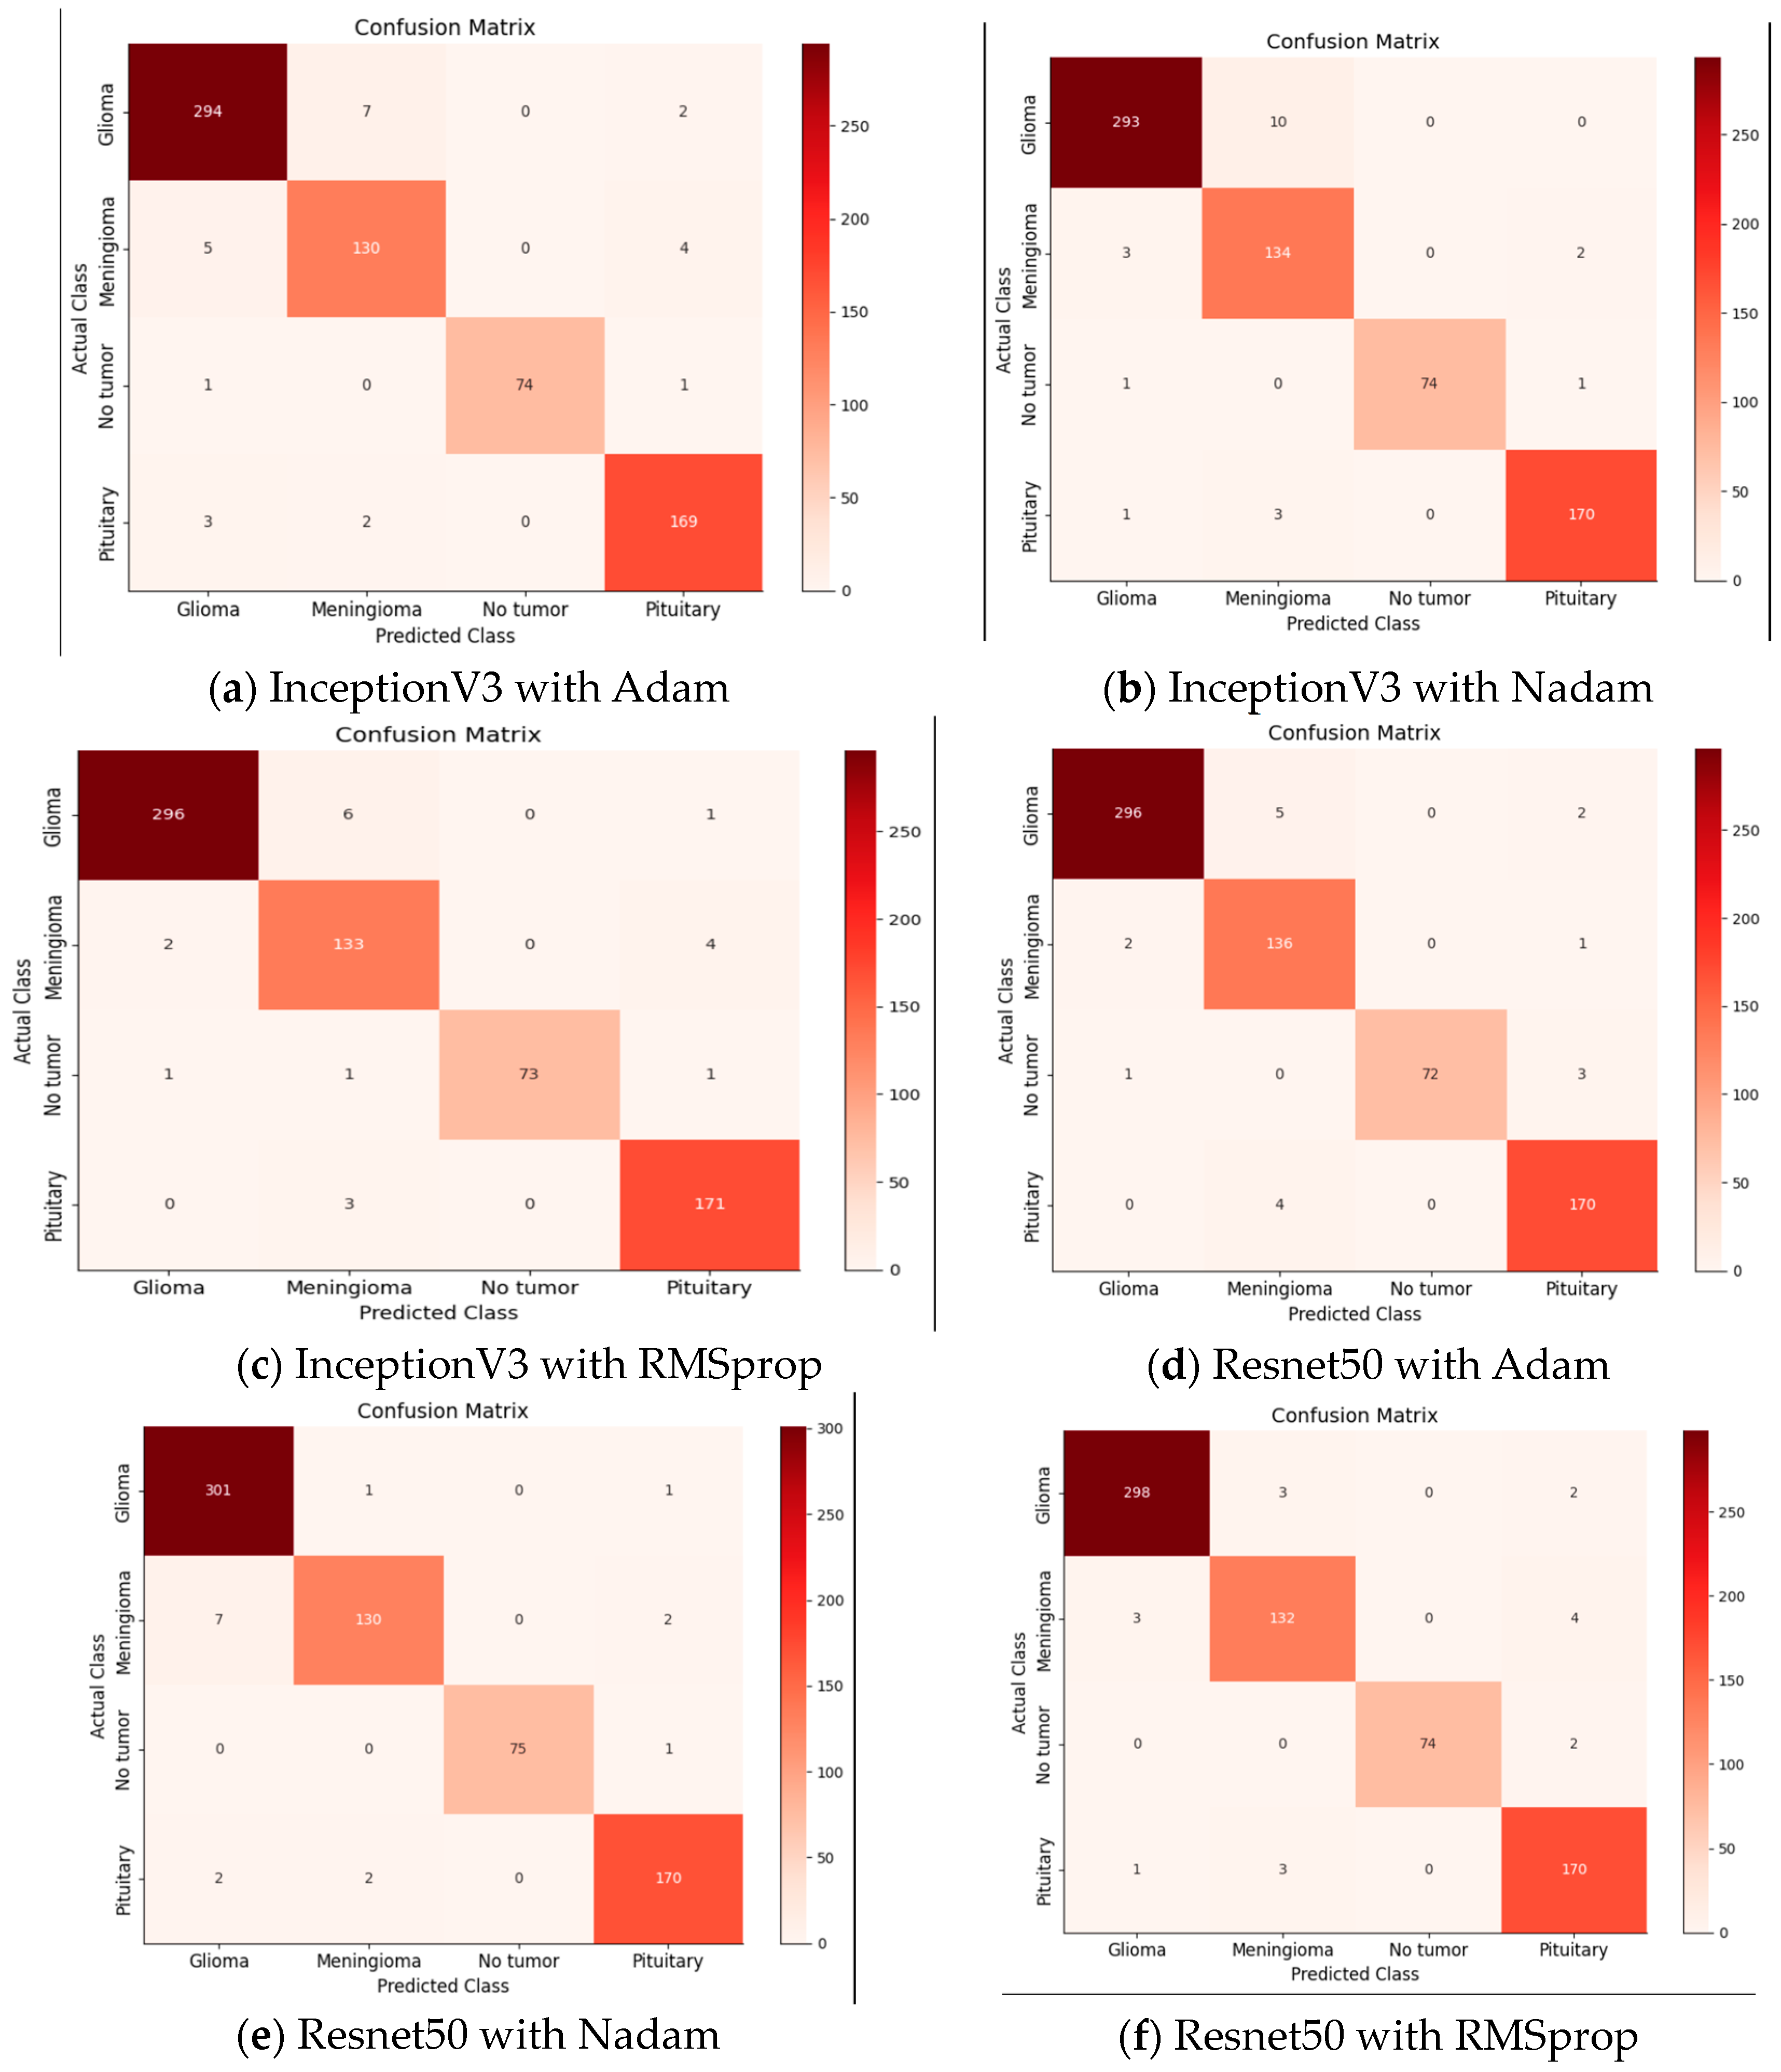
The primary objective of our model was to detect and analyze brain tumors. The classification of our data has involved differentiating between glioma tumors, meningioma tumors, no tumors, and pituitary tumors. To evaluate the performance of our model, we have constructed a 4 × 4 confusion matrix and calculated the true positives, false positives, true negatives, and false negatives. These metrics have provided insights into accurately identifying affected images and correctly detecting tumor presence.
During our data evaluation, our model demonstrated superior results. We have employed the Adam optimizer, which has facilitated quicker and more accurate result calculations. Despite high memory constraints, the Adam optimizer has exhibited efficient performance. In our experiments, we have compared the Adam and Nadam optimizers, both with an initial learning rate of 0.001. The training of the model has employed dynamic learning, wherein the learning rate was reduced after the improvement phase. We have utilized ReduceLROnPlateau with parameter values such as a factor of 0.3 and patience of 5 to monitor and adjust the learning rate based on the validation loss.
To prevent overfitting, an early stopping technique was applied, monitoring the validation loss with a tolerance of 10 s. If the validation loss has not decreased in the remaining 10 epochs, the training phase is concluded. The experiments were conducted for 50 epochs with a batch size of 20, resulting in a training time of approximately 35 min. The loss function employed in our multi-class classification was categorical cross-entropy.
The presented tables showcase the performance metrics of various DL models for brain tumor classification using different optimizers, namely, Adam, Nadam, and RMSprop. Table 4 outlines the results obtained by DL models with the Adam optimizer. Notably, the ResNet 50 model demonstrates outstanding precision and recall for different brain tumor classes, achieving an accuracy consistently above 97%. Remarkably, it achieves 98.97% precision, 97.69% recall, and an impressive F1 score of 98.33% for glioma classification. The meningioma class also exhibits excellent results, with precision, recall, and F1 scores exceeding 93%. Additionally, the non-tumor class achieves a perfect precision of 100%. The pituitary class shows commendable performance with an F1 score of 97.14% and an accuracy of 97.70%. On the other hand, Inception V3, while not surpassing ResNet 50, still demonstrates robust performance across classes, with accuracy ranging from 93.52% to 97.36%.
Table 5 highlights the performance metrics obtained using the Nadam optimizer. Once again, ResNet 50 stands out, achieving a precision of 97.09%, recall of 99.33%, and an impressive F1 score of 98.20% for Glioma classification, accompanied by a high accuracy of 99.34%. The meningioma class also performs well with precision, recall, and F1 score exceeding 93%. The non-tumor class maintains a perfect precision of 100%. Inception V3 demonstrates strong performance with an accuracy of 96.70% and an F1 score of 97.50% for glioma classification.
Table 6 presents the performance characteristics for the RMSprop optimizer. ResNet 50 continues to produce outstanding results for glioma classification, with precision, recall, and F1 score over 98%. The meningioma class attains excellent precision and recall levels of approximately 95%, but the non-tumor class maintains a flawless precision of 100%. With an F1 score of 98.33 percent for glioma categorization, Inception V3 fares highly. With high recall and F1 score values, the pituitary class displays impressive performance. From
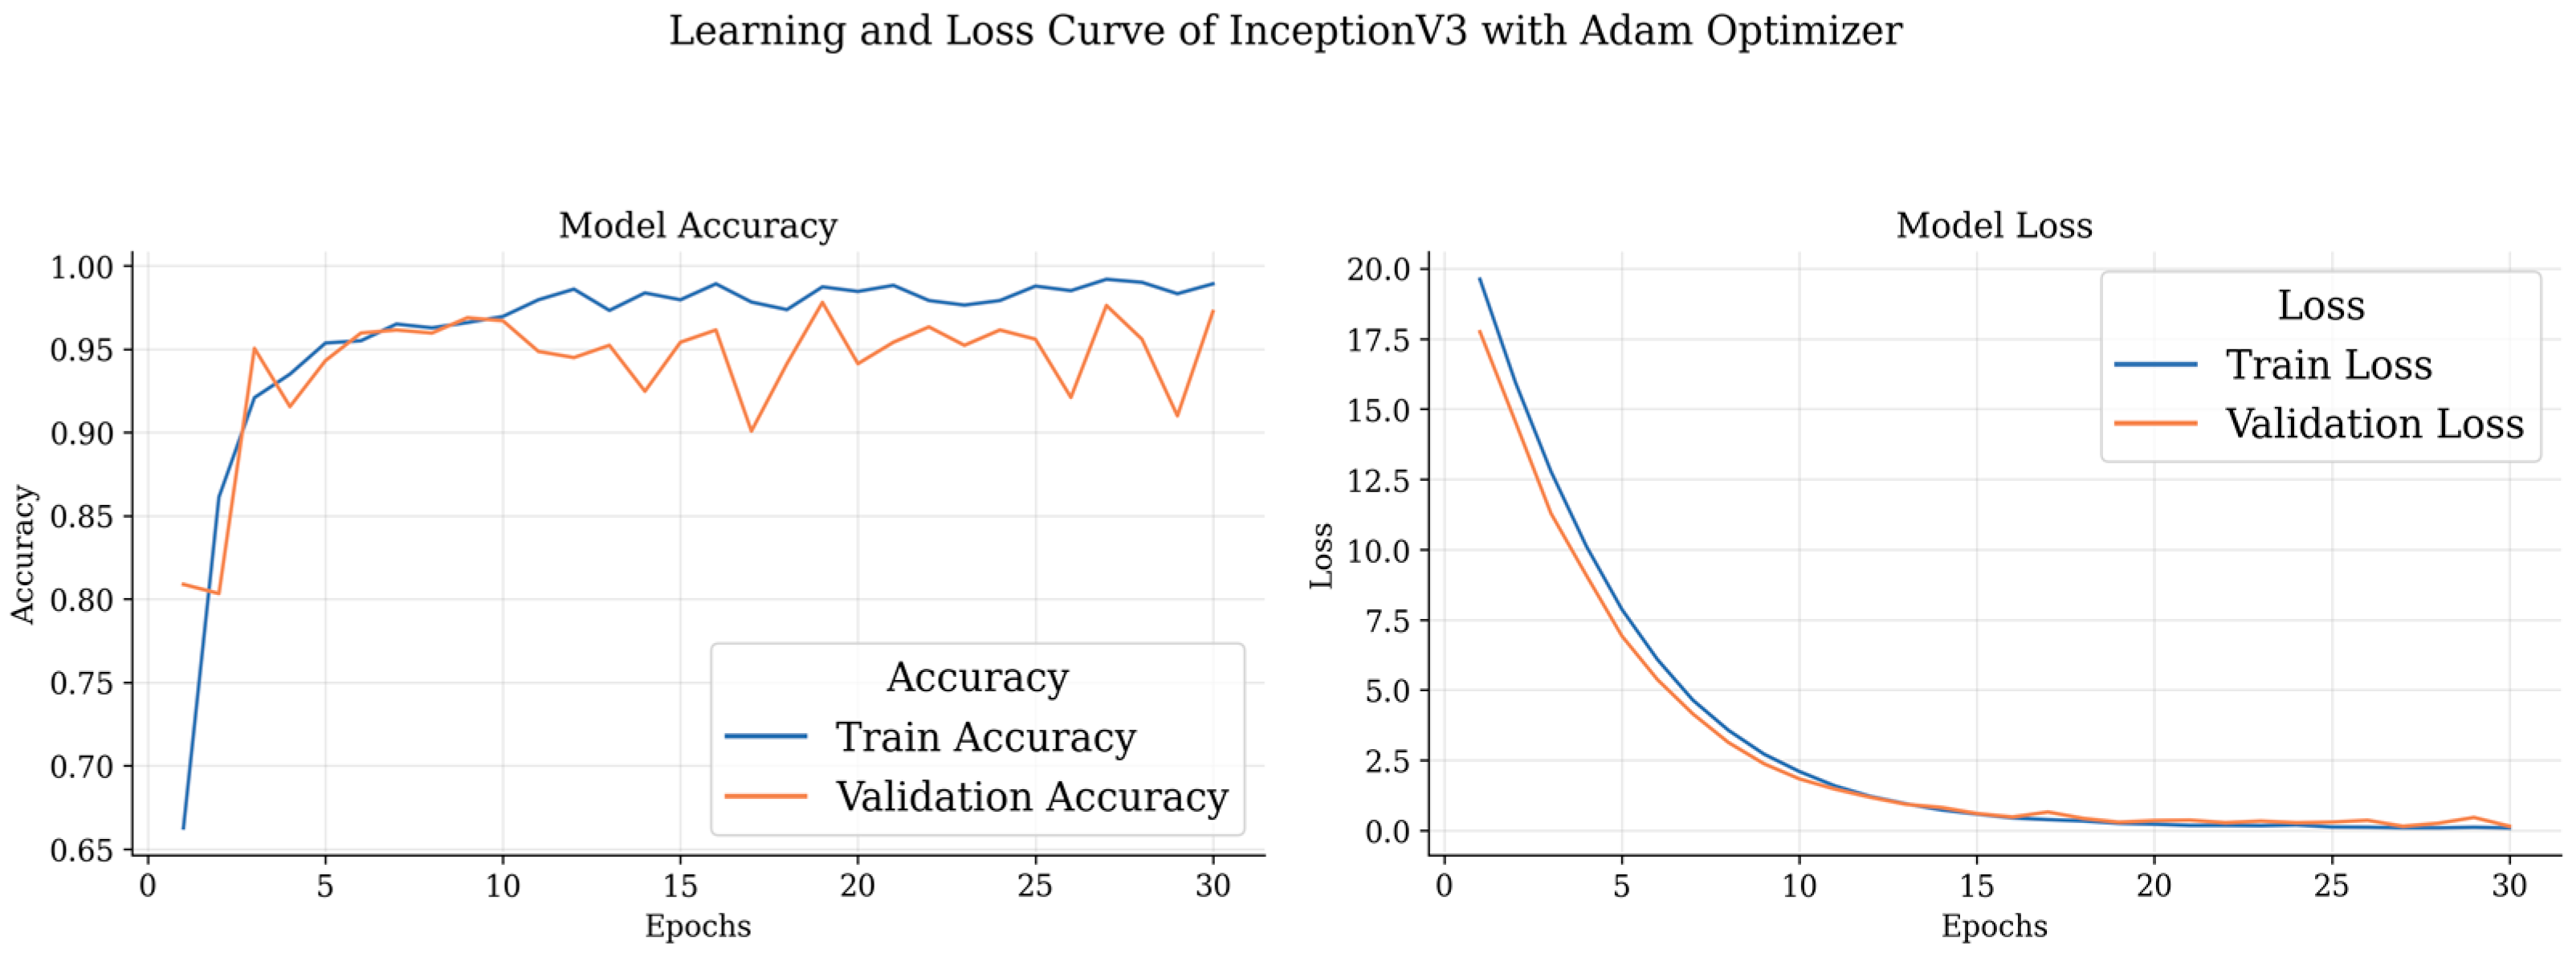
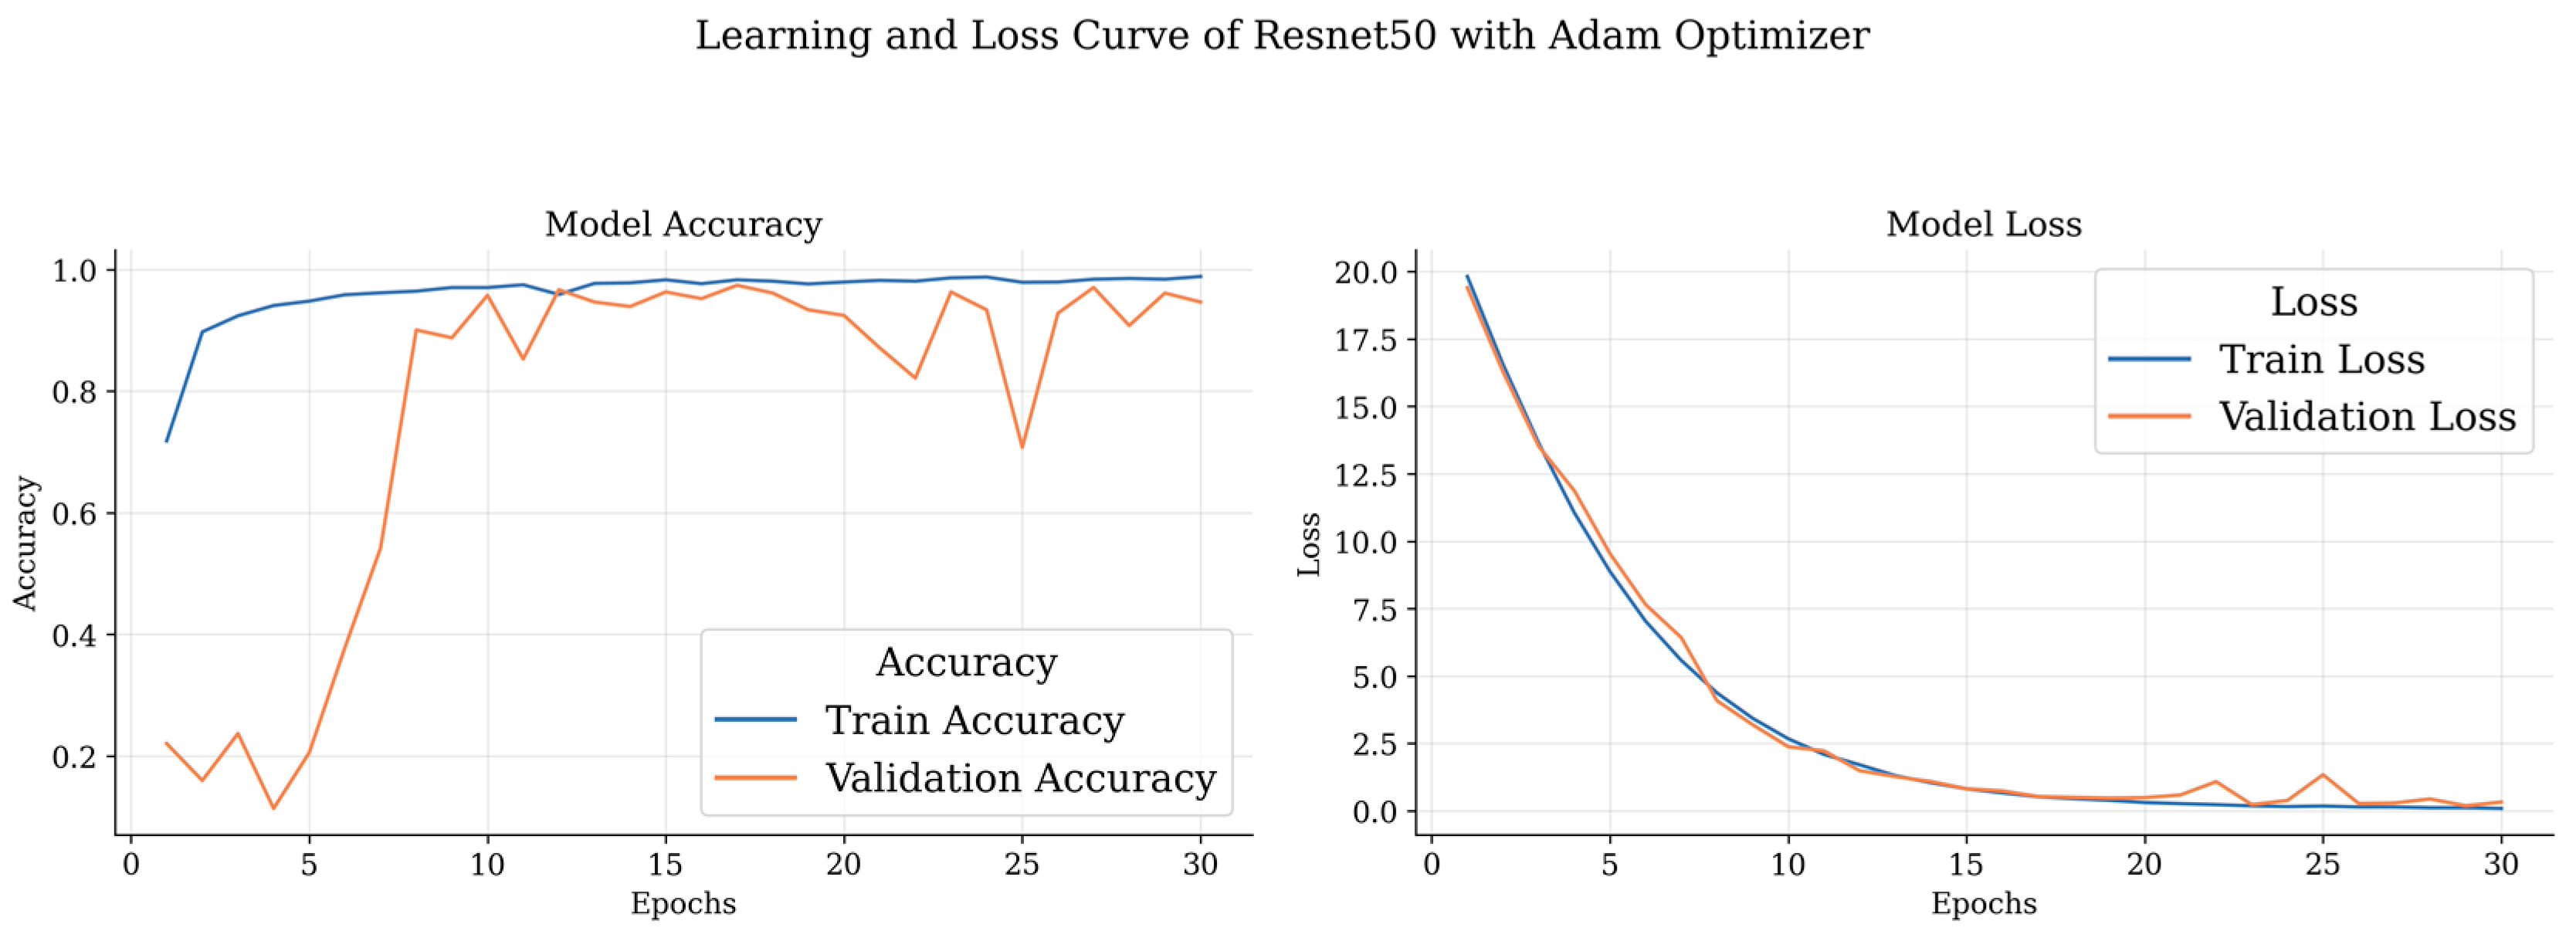
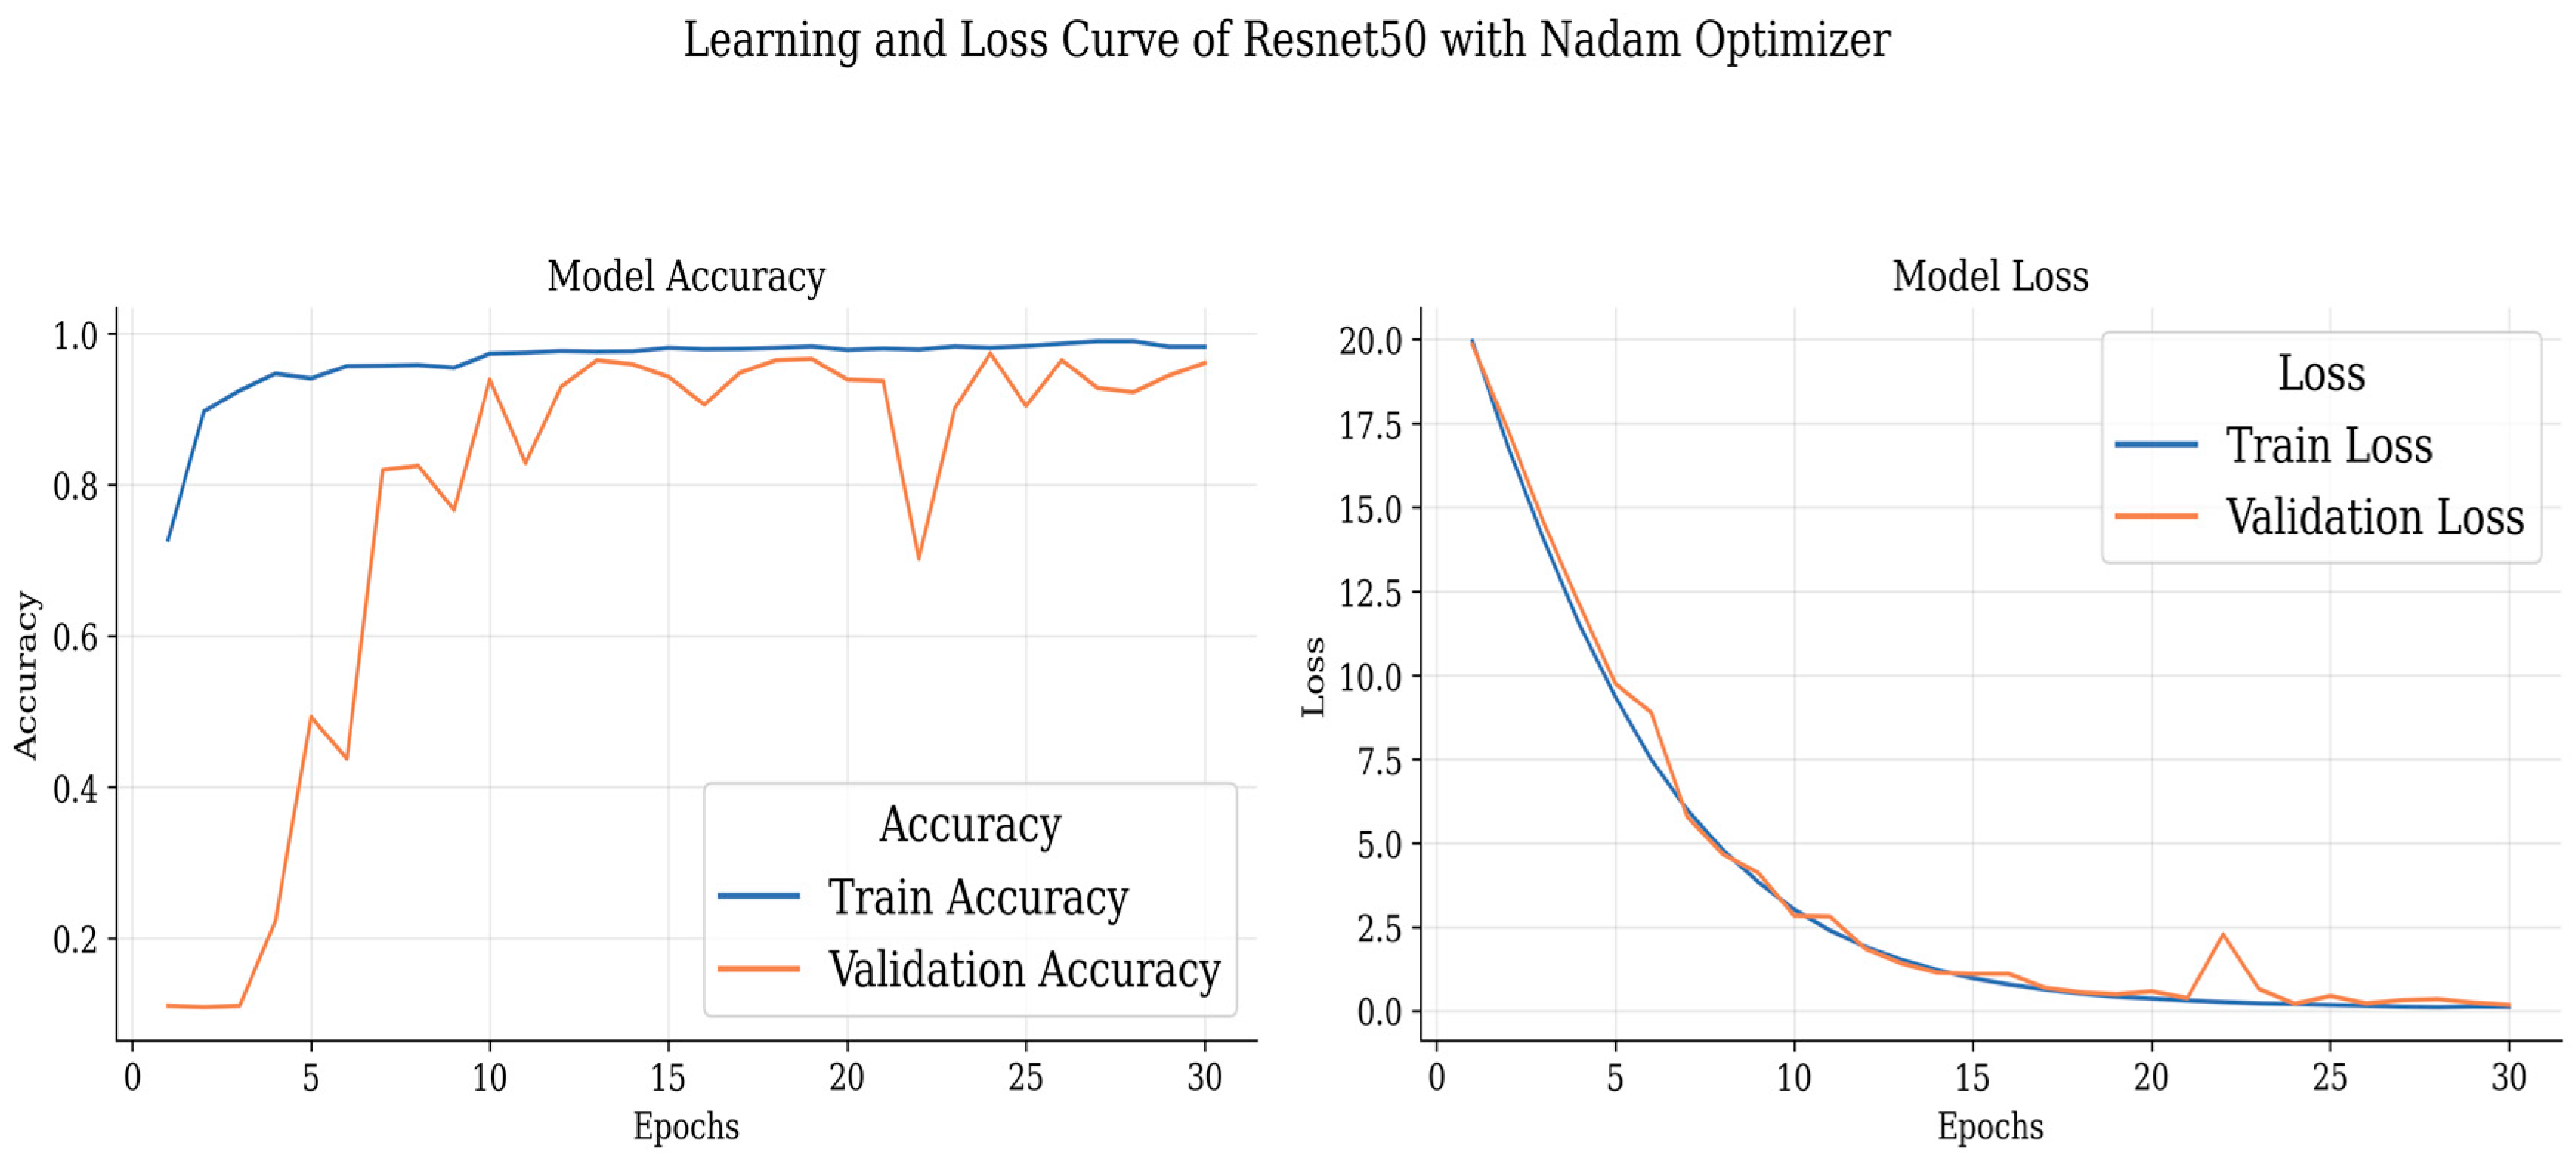
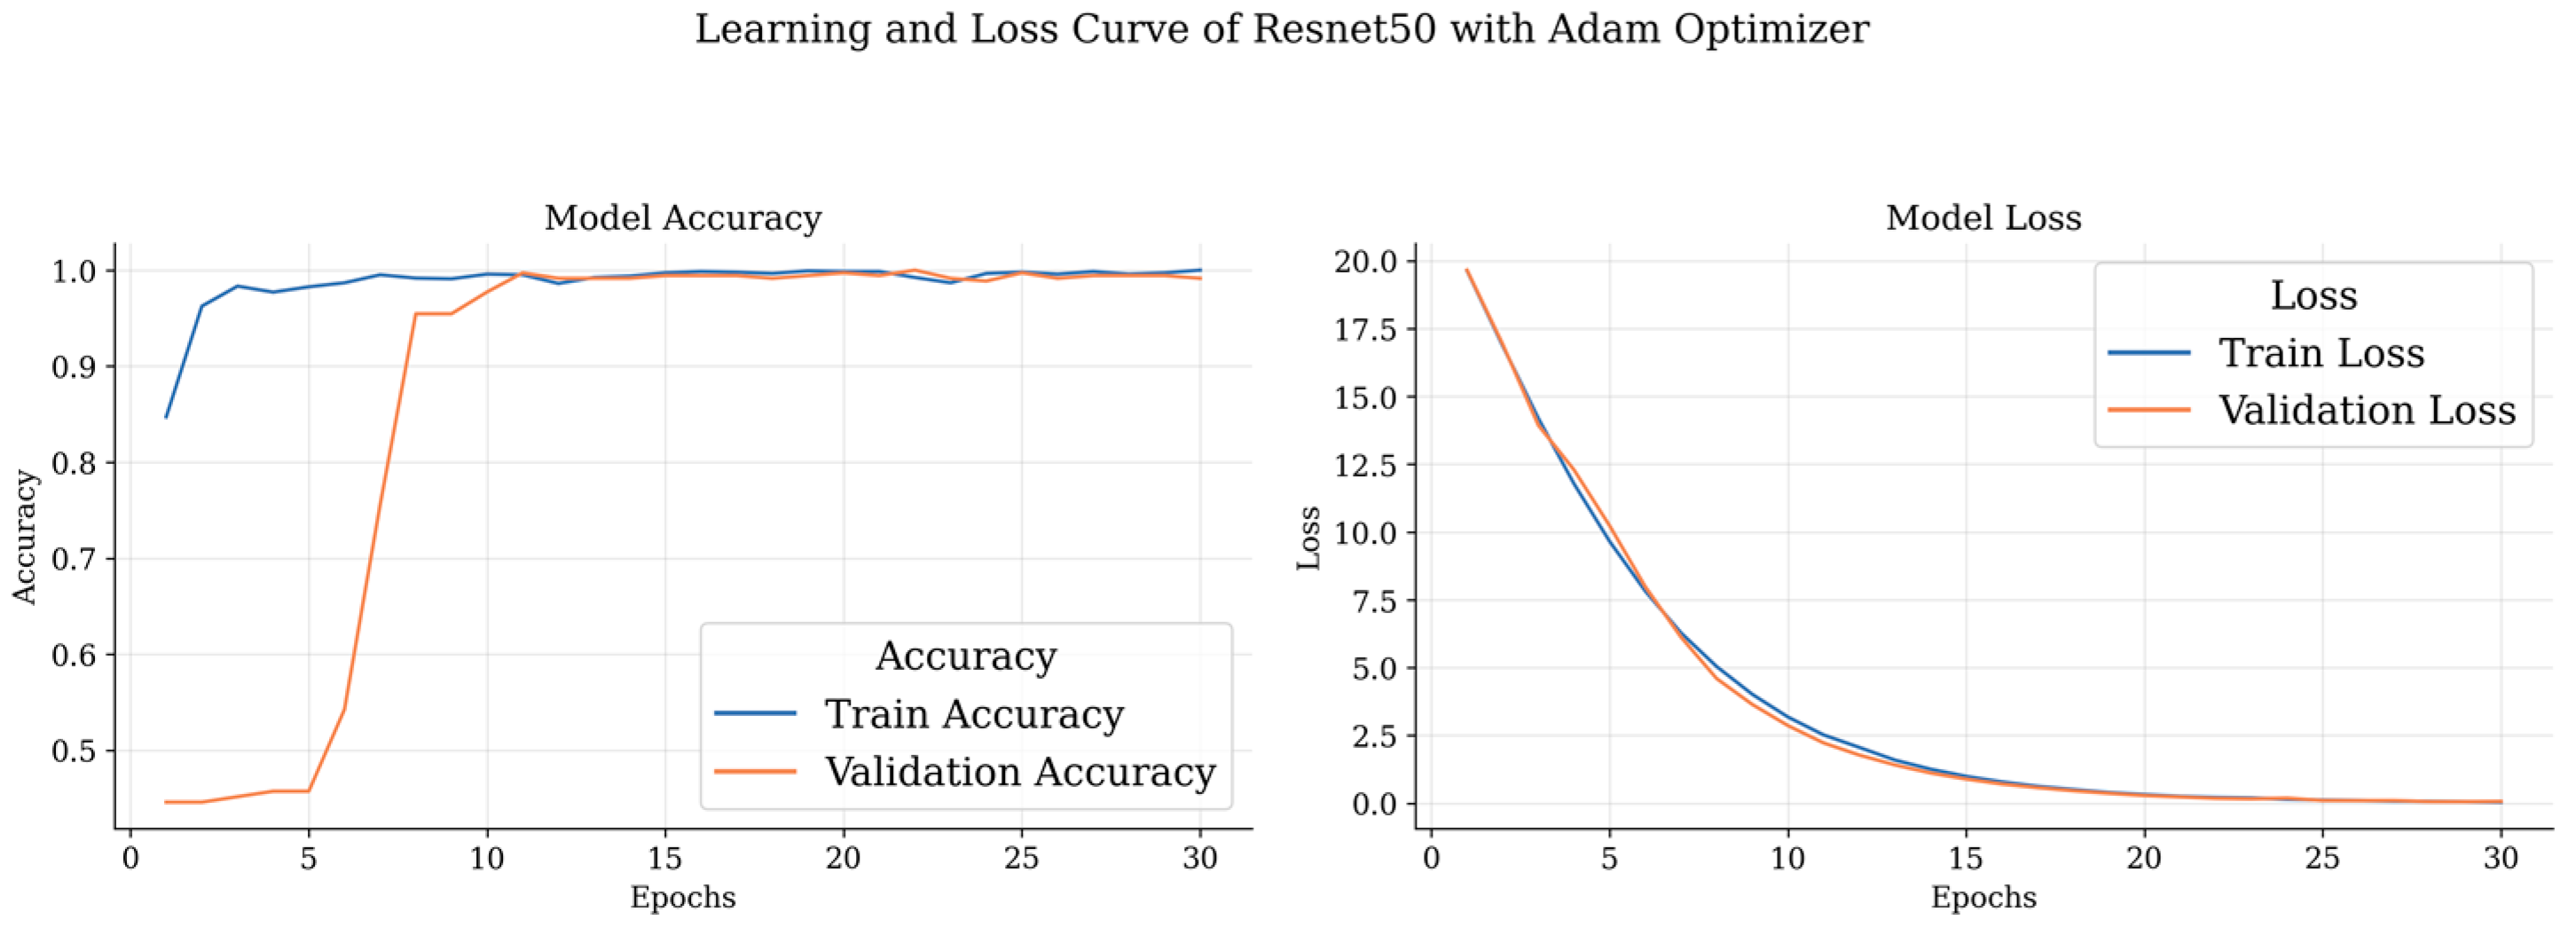
 Figure 7, Figure 8 and Figure 9, the accuracy and loss curves of the models trained on the four-class datasets can be observed.
These curves depict the model’s performance over epochs during the training process. The accuracy curve illustrates how well the model improves its predictions as it learns from the training data, while the loss curve shows the decrease in the model’s loss function over time. Analyzing these curves helps in understanding the model’s convergence and potential overfitting or underfitting issues, guiding further optimization and fine-tuning of the brain tumor detection model.
Figure 10 shows all the confusion matrices of the models with different optimizers, providing a comprehensive visual representation of their performance. The analysis of these matrices offers valuable insights into the strengths and weaknesses of each optimizer. Table 7 presents the performance evaluation of several models and optimizers applied to a four-class dataset. ResNet 50 optimized with Nadam stands out for its remarkable 97.68 percent accuracy and 98.13 percent precision. Inception V3, when paired with RMSprop, exhibits solid performance, obtaining a 97.25 percent accuracy and a 97.02 percent F1 score. The results demonstrate that the choice of optimizer has a considerable impact on the overall performance of the model for this particular dataset, hence, offering helpful guidance for picking the optimal model–optimizer combination.
After achieving the highest performance with Resnet50, we intended to apply only this architecture with the same layers as the prior architecture on the two-class dataset. 
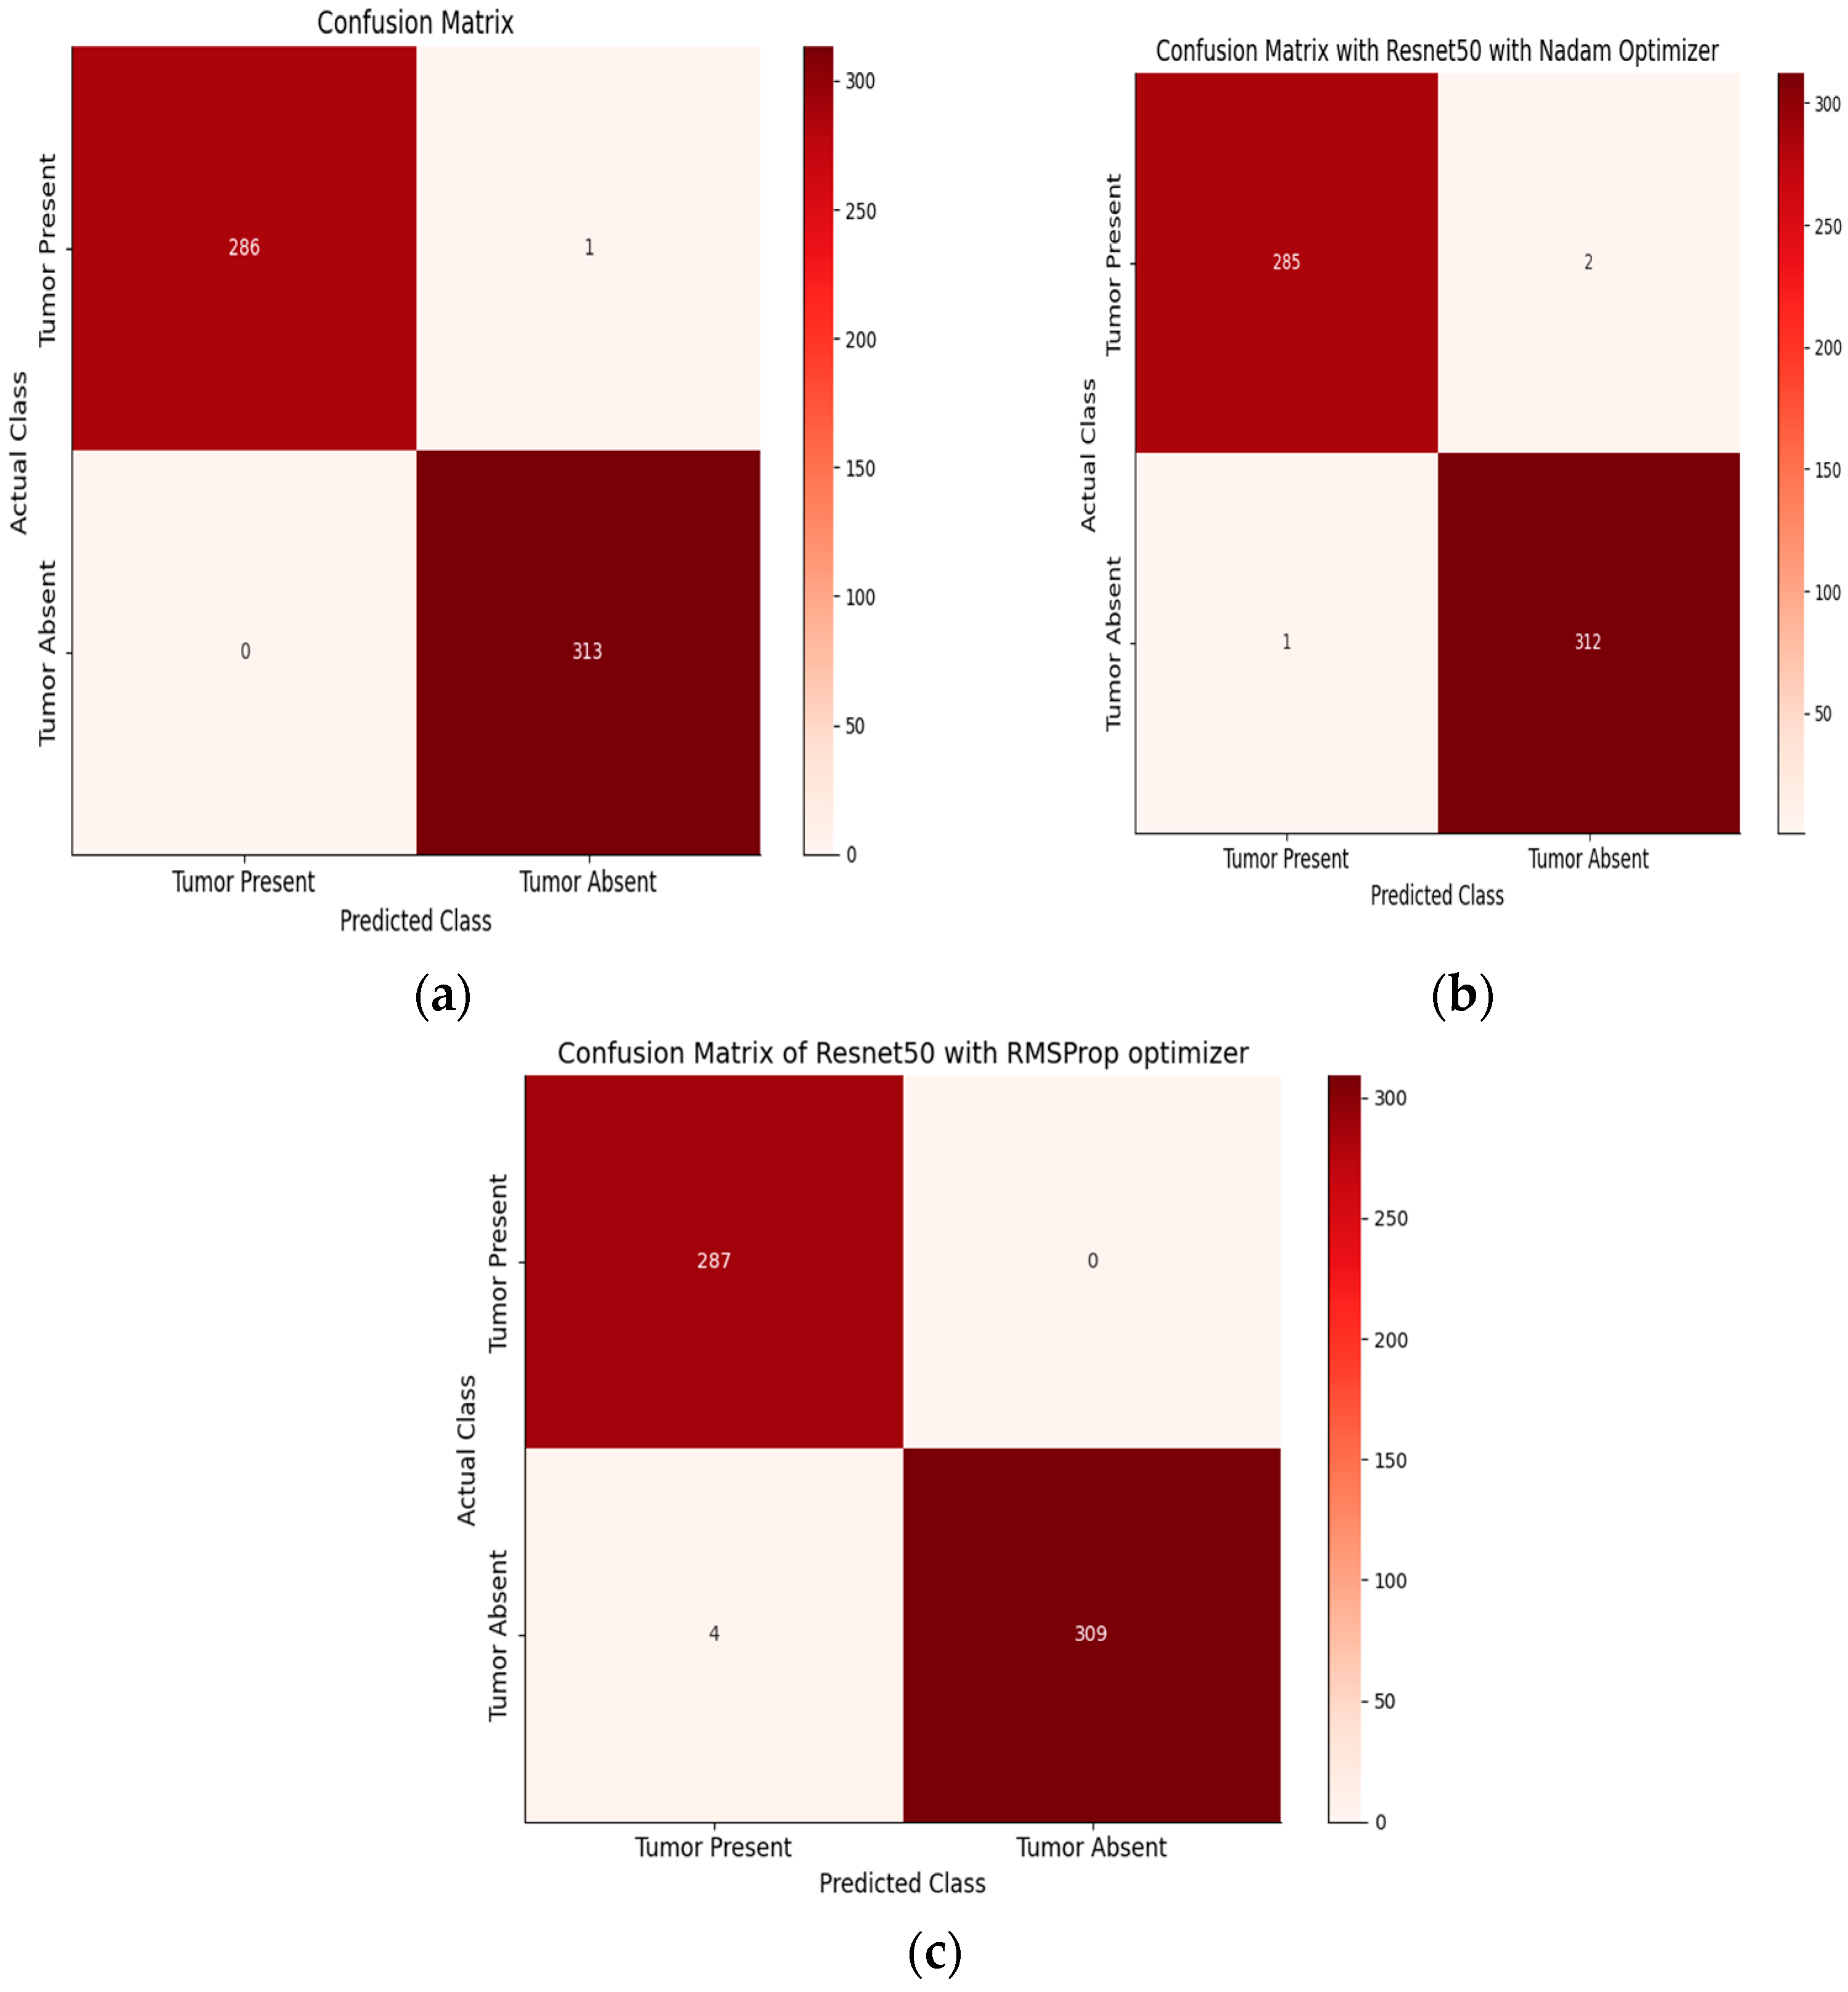
Table 8 shows the performance metrics for tumor classification on a two-class dataset using various models and optimizers. ResNet 50 with Adam achieves 100% precision and 99.65% recall for tumor positive, with an F1 score of 99.82% and an accuracy of 99.62%.
For tumor negative, it achieves 99.68% precision, 100% recall, and an F1 score of 99.81%, resulting in a perfect accuracy of 100%. With Nadam, ResNet 50 attains 99.65% precision, 99.30% recall, and a 99.47% F1 score for tumor positive, with an accuracy of 99.30%. For tumor negative, it achieves 99.36% precision, 99.68% recall, and a 99.52% F1 score, with an accuracy of 99.68%. With RMSprop, ResNet 50 demonstrates 98.96% precision, 99.65% recall, and a 99.30% F1 score for tumor positive, with an accuracy of 99.65%. For tumor negative, it achieves 99.67% precision, 99.04% recall, and a 99.35% F1 score, with an accuracy of 99.04%. Overall, ResNet 50 consistently performs well across all optimizer configurations, making it a suitable choice for accurate tumor classification in a two-class dataset. On the other hand, Table 9 presents a detailed assessment of the performance of the Inception V3 model using various optimization algorithms for the task of tumor classification. The table focuses on two distinct classes: tumor positive and tumor negative, providing essential metrics in percentage form. Precision, which gauges the accuracy of positive predictions, exhibits consistently high values across all optimizer-model combinations, with values often exceeding 98%. This indicates that the model’s positive predictions are highly accurate. The recall metric, measuring the model’s ability to correctly identify positive instances, also shows strong performance, with values typically above 97%, indicating effective capture of positive cases. The F1 score, a harmonic balance of precision and recall, further highlights the model’s overall accuracy and balance in classification. Finally, the accuracy metric, which reflects the overall correctness of the model’s predictions, consistently demonstrates impressive results, frequently surpassing 98%. These results collectively underscore the robustness and effectiveness of the Inception V3 model in tumor classification, with varying optimizers demonstrating strong performance across both positive and negative classes.
Figure 11 and Figure 12 showcase the performance evaluation of models trained on the two-class brain MRI tumor dataset. Figure 10 illustrates accuracy and loss curves, offering insights into the model’s learning progress and convergence during training. On the other hand, Figure 12 presents the confusion matrix, providing a comprehensive view of the model’s predictions for tumor present and tumor absent classes.
Table 10 provides a comprehensive performance comparison of two prominent DL models, ResNet 50 and Inception V3, utilizing different optimization algorithms on a two-class tumor dataset. For the ResNet 50 model, when optimized with Adam, it achieves a relatively low MAE of 1.6, showcasing the accuracy of its predictions. The model also demonstrates outstanding precision, recall, F1 score, and accuracy, all consistently above 99%. This indicates its exceptional ability to distinguish between the two tumor classes.
When the ResNet 50 model is optimized with Nadam and RMSprop, it continues to exhibit remarkable precision, recall, F1-score, and accuracy, although with slightly different loss values. This indicates that the choice of optimizer can affect training dynamics and model performance.
On the other hand, Inception V3, while still performing well, shows slightly lower precision, recall, F1 score, and accuracy compared to ResNet 50 across all optimizer settings. The MAE values for Inception V3 are also higher, suggesting that it might have slightly less accurate predictions. These results emphasize the importance of selecting the appropriate model and optimizer combination based on specific requirements and trade-offs in the context of tumor classification on this dataset.

8. Conclusions and Future Work

In conclusion, this study has introduced two DL frameworks utilizing ResNet 50 and Inception V3 models for the categorization of brain MRI images, demonstrating promising results in tumor classification; reflecting the achievements seen in other medical image classification tasks. These models were evaluated on openly available datasets, exhibiting high accuracy and precision rates for various tumor types. The optimization was performed using three different optimizers: Adam, Nadam, and RMSprop. A classification accuracy of 97.68% for the multi-class dataset was achieved, and an impressive accuracy rate of 99.84% was attained for the binary dataset, highlighting significant progress in the automation of brain tumor detection from MRI scans. Fine-tuning the models with techniques such as average pooling, layer-by-layer fully connected adjustments, and L2 regularization played a pivotal role in enhancing their effectiveness for tumor classification. However, as we move forward, several avenues for future work have been identified. First and foremost, expanding the assessment to diverse datasets with larger image samples is essential to ensure the generalizability of the frameworks. Additionally, incorporating state-of-the-art CNN architectures such as MobileNet, SqueezeNet, and Vision Transformers, as well as exploring ensemble learning techniques with different loss functions, could further enhance classification performance. Fine-grained tumor classification and optimization using swarm intelligence algorithms are also on the horizon. Efficiency improvements in training and clinical validation with medical professionals are essential aspects of our future research agenda. Nonetheless, it is important to acknowledge that real-world medical applications may involve challenges related to data privacy, regulatory compliance, and integration into clinical workflows, where federated learning has come as rescue, which should be addressed in future research and development efforts. By pursuing these directions, we aim to advance the field of brain MRI image analysis, ultimately contributing to more accurate and efficient brain tumor diagnostics in clinical practice.

Author Contributions

S.A.: conceptualization, methodology, writing—original draft; P.P.: conceptualization, data curation, software, visualization, resources; M.R.H.M.: conceptualization, methodology, writing—review and editing; S.M.A.R.: conceptualization, methodology; S.K.: methodology, writing—review and editing; M.J.H.: conceptualization, writing—review and editing, supervision; A.R.: conceptualization, writing—review and editing; A.E.P.: methodology, writing—review and editing. All authors have read and agreed to the published version of the manuscript.

Funding

A part of this research work received financial assistance from Bangladesh University of Engineering and Technology (BUET), Bangladesh in the form of a Basic Research Grant to author M. Rubaiyat Hossain Mondal (Grant Code: 1111202131013 R-60/Ref-5336, 30 June 2021). Financial assistance was also received from the ICT innovation grant from the ICT Division of the Ministry of Posts, Telecommunications and Information Technology of the Government of the People’s Republic of Bangladesh 2021–2022 (Grant Code: 1280101-120008431-3631108, GO-09).

Institutional Review Board Statement

Not applicable.

Informed Consent Statement

Not applicable.

Data Availability Statement

The data that support the findings of this study are available from the corresponding author upon reasonable request.

Conflicts of Interest

The authors declare no conflict of interest.

References

  1. Kavitha, A.R.; Chitra, L.; Kanaga, R. Brain tumor segmentation using genetic algorithm with SVM classifier. Int. J. Adv. Res. Electr. Electron. Instrum. Eng. 2016, 5, 1468–1471. [Google Scholar]
  2. Logeswari, T.; Karnan, M. An Improved Implementation of Brain Tumor Detection Using Segmentation Based on Hierarchical Self Organizing Map. Int. J. Comput. Theory Eng. 2010, 2, 591. [Google Scholar] [CrossRef]
  3. Badran, E.F.; Mahmoud, E.G.; Hamdy, N. An Algorithm for Detecting Brain Tumors in MRI Images. In Proceedings of the 2010 International Conference on Computer Engineering & Systems, Cairo, Egypt, 30 November–2 December 2010; IEEE: New York, NY, USA, 2010; pp. 368–373. [Google Scholar]
  4. Cheng, J.; Huang, W.; Cao, S.; Yang, R.; Yang, W.; Yun, Z.; Wang, Z.; Feng, Q. Enhanced Performance of Brain Tumor Classification via Tumor Region Augmentation and Partition. PLoS ONE 2015, 10, e0140381. [Google Scholar] [CrossRef] [PubMed]
  5. Swathi, B.; Kannan, K.S.; Chakravarthi, S.S.; Ruthvik, G.; Avanija, J.; Reddy, C.C.M. Skin Cancer Detection Using VGG16, Inception V3 and ResUNet. In Proceedings of the 2023 4th International Conference on Electronics and Sustainable Communication Systems (ICESC), Coimbatore, India, 6–8 July 2023; pp. 812–818. [Google Scholar]
  6. Khambhata, K.G.; Panchal, S.R. Multiclass Classification of Brain Tumor in MR Images. Int. J. Innov. Res. Comput. Commun. Eng 2016, 4, 8982–8992. [Google Scholar]
  7. Ullah, N.; Khan, J.A.; Khan, M.S.; Khan, W.; Hassan, I.; Obayya, M.; Negm, N.; Salama, A.S. An Effective Approach to Detect and Identify Brain Tumors Using Transfer Learning. Appl. Sci. 2022, 12, 5645. [Google Scholar] [CrossRef]
  8. Podder, P.; Alam, F.B.; Mondal, M.R.H.; Hasan, M.J.; Rohan, A.; Bharati, S. Rethinking Densely Connected Convolutional Networks for Diagnosing Infectious Diseases. Computers 2023, 12, 95. [Google Scholar] [CrossRef]
  9. Podder, P.; Das, S.R.; Mondal, M.R.H.; Bharati, S.; Maliha, A.; Hasan, M.J.; Piltan, F. Lddnet: A Deep Learning Framework for the Diagnosis of Infectious Lung Diseases. Sensors 2023, 23, 480. [Google Scholar] [CrossRef]
  10. Raza, A.; Ayub, H.; Khan, J.A.; Ahmad, I.; Salama, A.S.; Daradkeh, Y.I.; Javeed, D.; Ur Rehman, A.; Hamam, H. A Hybrid Deep Learning-Based Approach for Brain Tumor Classification. Electronics 2022, 11, 1146. [Google Scholar] [CrossRef]
  11. Goodenberger, M.L.; Jenkins, R.B. Genetics of Adult Glioma. Cancer Genet. 2012, 205, 613–621. [Google Scholar] [CrossRef]
  12. Louis, D.N.; Perry, A.; Reifenberger, G.; von Deimling, A.; Figarella-Branger, D.; Cavenee, W.K.; Ohgaki, H.; Wiestler, O.D.; Kleihues, P.; Ellison, D.W. The 2016 World Health Organization Classification of Tumors of the Central Nervous System: A Summary. Acta Neuropathol. 2016, 131, 803–820. [Google Scholar] [CrossRef]
  13. Mahmud, M.I.; Mamun, M.; Abdelgawad, A. A Deep Analysis of Brain Tumor Detection from MR Images Using Deep Learning Networks. Algorithms 2023, 16, 176. [Google Scholar] [CrossRef]
  14. Ghosal, P.; Nandanwar, L.; Kanchan, S.; Bhadra, A.; Chakraborty, J.; Nandi, D. Brain Tumor Classification Using ResNet-101 Based Squeeze and Excitation Deep Neural Network. In Proceedings of the 2019 Second International Conference on Advanced Computational and Communication Paradigms (ICACCP), Gangtok, India, 25–28 February 2019; p. 6. [Google Scholar]
  15. Krishnapriya, S.; Karuna, Y. Pre-Trained Deep Learning Models for Brain MRI Image Classification. Front. Hum. Neurosci. 2023, 17, 1150120. [Google Scholar] [CrossRef] [PubMed]
  16. Díaz-Pernas, F.J.; Martínez-Zarzuela, M.; Antón-Rodríguez, M.; González-Ortega, D. A Deep Learning Approach for Brain Tumor Classification and Segmentation Using a Multiscale Convolutional Neural Network. Healthcare 2021, 9, 153. [Google Scholar] [CrossRef] [PubMed]
  17. Sultan, H.H.; Salem, N.M.; Al-Atabany, W. Multi-Classification of Brain Tumor Images Using Deep Neural Network. IEEE Access 2019, 7, 69215–69225. [Google Scholar] [CrossRef]
  18. Abd El Kader, I.; Xu, G.; Shuai, Z.; Saminu, S.; Javaid, I.; Salim Ahmad, I. Differential Deep Convolutional Neural Network Model for Brain Tumor Classification. Brain Sci. 2021, 11, 352. [Google Scholar] [CrossRef] [PubMed]
  19. Sajja, V.R.; Al, E. Classification of Brain Tumors Using Fuzzy C-Means and VGG16. Turk. J. Comput. Math. Educ. (TURCOMAT) 2021, 12, 2103–2113. [Google Scholar]
  20. Das, S.; Aranya, O.F.M.R.R.; Labiba, N.N. Brain Tumor Classification Using Convolutional Neural Network. In Proceedings of the 2019 1st International Conference on Advances in Science, Engineering and Robotics Technology (ICASERT), Dhaka, Bangladesh, 3–5 May 2019; pp. 1–5. [Google Scholar]
  21. Abiwinanda, N.; Hanif, M.; Hesaputra, S.T.; Handayani, A.; Mengko, T.R. Brain Tumor Classification Using Convolutional Neural Network. In Proceedings of the World Congress on Medical Physics and Biomedical Engineering 2018; Lhotska, L., Sukupova, L., Lacković, I., Ibbott, G.S., Eds.; Springer Nature: Singapore, 2019; pp. 183–189. [Google Scholar]
  22. Pashaei, A.; Sajedi, H.; Jazayeri, N. Brain Tumor Classification via Convolutional Neural Network and Extreme Learning Machines. In Proceedings of the 2018 8th International Conference on Computer and Knowledge Engineering (ICCKE), Mashhad, Iran, 25–26 October 2018; pp. 314–319. [Google Scholar]
  23. Afshar, P.; Mohammadi, A.; Plataniotis, K.N. Brain Tumor Type Classification via Capsule Networks. In Proceedings of the 2018 25th IEEE International Conference on Image Processing (ICIP), Athens, Greece, 7–10 October 2018; pp. 3129–3133. [Google Scholar]
  24. Ibrokhimov, B.; Kang, J.-Y. Deep Learning Model for COVID-19-Infected Pneumonia Diagnosis Using Chest Radiography Images. BioMedInformatics 2022, 2, 654–670. [Google Scholar] [CrossRef]
  25. Eder, M.; Moser, E.; Holzinger, A.; Jean-Quartier, C.; Jeanquartier, F. Interpretable Machine Learning with Brain Image and Survival Data. BioMedInformatics 2022, 2, 492–510. [Google Scholar] [CrossRef]
  26. Shokouhifar, A.; Shokouhifar, M.; Sabbaghian, M.; Soltanian-Zadeh, H. Swarm Intelligence Empowered Three-Stage Ensemble Deep Learning for Arm Volume Measurement in Patients with Lymphedema. Biomed. Signal Process. Control 2023, 85, 105027. [Google Scholar] [CrossRef]
  27. Veeraiah, N.; Alotaibi, Y.; Subahi, A. MayGAN: Mayfly Optimization with Generative Adversarial Network-Based Deep Learning Method to Classify Leukemia Form Blood Smear Images. CSSE 2023, 46, 2039–2058. [Google Scholar] [CrossRef]
  28. Aryai, P.; Khademzadeh, A.; Jafarali Jassbi, S.; Hosseinzadeh, M.; Hashemzadeh, O.; Shokouhifar, M. Real-Time Health Monitoring in WBANs Using Hybrid Metaheuristic-Driven Machine Learning Routing Protocol (MDML-RP). AEU-Int. J. Electron. Commun. 2023, 168, 154723. [Google Scholar] [CrossRef]
  29. Ibtisum, S. A Comparative Study on Different Big Data Tools; North Dakota State University: Fargo, ND, USA, 2020. [Google Scholar]
  30. Divya, S.; Padma Suresh, L.; John, A. A Deep Transfer Learning Framework for Multi Class Brain Tumor Classification Using MRI. In Proceedings of the 2020 2nd International Conference on Advances in Computing, Communication Control and Networking (ICACCCN), Greater Noida, India, 18–19 December 2020; pp. 283–290. [Google Scholar]
  31. Shah, A.; Chavan, P.; Jadhav, D. Classification of Brain Tumor MRI Scans Using Transfer Learning with a Comparative Analysis on Pre-Trained Networks. In Proceedings of the 2022 International Conference for Advancement in Technology (ICONAT), Goa, India, 21–22 January 2022; pp. 1–7. [Google Scholar]
  32. Brain Tumor Detection Using Deep Learning Models. Available online: https://ieeexplore.ieee.org/abstract/document/9344555/ (accessed on 24 September 2023).
  33. Hussain, E.; Hasan, M.; Hassan, S.Z.; Hassan Azmi, T.; Rahman, M.A.; Zavid Parvez, M. Deep Learning Based Binary Classification for Alzheimer’s Disease Detection Using Brain MRI Images. In Proceedings of the 2020 15th IEEE Conference on Industrial Electronics and Applications (ICIEA), Kristiansand, Norway, 9–13 November 2020; pp. 1115–1120. [Google Scholar]
  34. Younis, A.; Qiang, L.; Nyatega, C.O.; Adamu, M.J.; Kawuwa, H.B. Brain Tumor Analysis Using Deep Learning and VGG-16 Ensembling Learning Approaches. Appl. Sci. 2022, 12, 7282. [Google Scholar] [CrossRef]
  35. Cheng, J. Brain Tumor Dataset, Figshare. 2017. Available online: https://figshare.com/articles/dataset/brain_tumor_dataset/1512427 (accessed on 1 April 2023).
  36. Br35H:: Brain Tumor Detection 2020|Kaggle. Available online: https://www.kaggle.com/datasets/ahmedhamada0/brain-tumor-detection (accessed on 18 August 2023).
  37. Brain-MRI-Image-Classification-Using-Deep-Learning/Brain-Tumor-Dataset/Training at Main Strikersps/Brain-MRI-Image-Classification-Using-Deep-Learning. Available online: https://github.com/strikersps/Brain-MRI-Image-Classification-Using-Deep-Learning/tree/main/Brain-Tumor-Dataset/Training (accessed on 25 September 2023).
  38. Gheisari, M.; Ebrahimzadeh, F.; Rahimi, M.; Moazzamigodarzi, M.; Liu, Y.; Dutta Pramanik, P.K.; Heravi, M.A.; Mehbodniya, A.; Liu, Y.; Pramanik, P.K.D.; et al. learning: Applications, architectures, models, tools, and frameworks: A comprehensive survey. CAAI Trans. Intell. Technol. 2023, 8, 581–606. [Google Scholar] [CrossRef]
  39. Ghaderzadeh, M.; Aria, M.; Hosseini, A.; Asadi, F.; Bashash, D.; Abolghasemi, H. A fast and efficient CNN model for B-ALL diagnosis and its subtypes classification using peripheral blood smear images. Int. J. Intell. Syst. 2022, 37, 5113–5133. [Google Scholar] [CrossRef]
Figure 1. Visual Representation of the Four-Class Brain Tumor Dataset—(a) Glioma, (b) Meningioma, (c) Pituitary, and (d) No Tumor.
Biomedinformatics 03 00068 g001
Figure 2. Distribution Bar Plot of Tumor Dataset among Four Classes: Training, Testing, and Validation.
Biomedinformatics 03 00068 g002
Figure 3. A Sample of Two-Class Brain Tumor Dataset.
Biomedinformatics 03 00068 g003
Figure 4. Distribution Bar plot of Tumor Dataset among Two Classes: Training, Testing, and Validation.
Biomedinformatics 03 00068 g004
Figure 5. Fine-Tuned ResNet 50 and Inception V3 Architectures for Brain Tumor Detection.
Biomedinformatics 03 00068 g005
Figure 6. Step-by-Step Pipeline for Brain Tumor Detection: Data Preprocessing to Model Selection.
Biomedinformatics 03 00068 g006
Figure 7. Accuracy and Loss Curve of Inceptionv3 Training with Adam Optimizer.
Biomedinformatics 03 00068 g007
Figure 8. Accuracy and Loss Curve of Resnet 50 Training with Adam Optimizer.
Biomedinformatics 03 00068 g008
Figure 9. Accuracy and Loss Curve of Resnet 50 Training with Nadam Optimizer.
Biomedinformatics 03 00068 g009
Figure 10. Confusion Matrix Evaluation of Different DL Models.
Biomedinformatics 03 00068 g010
Figure 11. Accuracy and Loss Curve of Resnet 50 with Adam For Two-Class Brain Tumor Dataset.
Biomedinformatics 03 00068 g011
Figure 12. Confusion Matrix with Different Optimizers testing with test dataset for Resnet 50 for Two Class Dataset. (a) Confusion Matrix of Resnet50 model with Adam Optimizers; (b) Confusion Matrix of Resnet 50 model with Adam Optimizers; (c) Confusion Matrix of Resnet50 model with RMSprop Optimizers.
Biomedinformatics 03 00068 g012
Table 1. Comparative analysis with state-of-the-art works.
Ref.Adopted ModelDataset DescriptionAccuracyRecall
[7]ResNet 1012762 images, 3 Class, (glioma, meningioma, pituitary)74.09%67.23%
Densenet20168.71%67.46%
Mobilenetv282.61%80.32%
[14]Squeeze and Excitation ResNet model based CNN3064 images, 3 Class, (glioma, meningioma, pituitary)93.83%
[20]CNN3064 images, 3 Class, (glioma, meningioma, pituitary)94.39%93%
[30]ResNet 503064 images, 3 Class, (glioma, meningioma, pituitary)95.33%
[31]SqueezeNet-92.08%
[32]CNNTotal: 253, 2 Class, Tumors: 155, Non Tumors: 9891.6%
[33]CNNOASIS Dataset, 2 Class Classification97.75%96%
[14]Inception V3Total: 253, 2 Class, Tumors: 155, Non Tumors: 9881.25%63.25%
ResNet 5097.92%87.7%
[34]CNNTotal: 253, 2 Class, Tumors: 155, Non Tumors: 9896%89.5%
VGG 1698.15%94.4%
[16]Multiscale CNN3064 images, 3 Class, (glioma, meningioma, pituitary)97.3%
[17]CNN3064 images, 3 Class, (glioma, meningioma, pituitary)96.13%
[19]CNNBRATS dataset, 2 Class, Total 577 images96.15%97.05%
VGG-1696.70%97.05%
[20]CNN3064 images, 3 Class, (glioma, meningioma, pituitary)94.39%93%
[21]CNN3064 images, 3 Class, (glioma, meningioma, pituitary)84.1%
[22]CNN3064 images, 3 Class, (glioma, meningioma, pituitary)81.0%
[23]CapsNet3 Class, (glioma, meningioma, pituitary)86.56%
Table 2. Distribution Table of Tumor Dataset among Four Classes: Training, Testing, and Validation.
PhasesClass: GliomaClass: MeningiomaClass: Non-TumorClass: PituitaryTotal
Training9014492586052213
Validation22212061151554
Testing30313976174692
Total14267083959303459
Table 3. Distribution Table of Tumor Dataset among Two Classes: Training, Testing, and Validation.
PhasesClass: Tumor PresentClass: Tumor AbsentTotal
Training9409801920
Validation247287534
Testing313233546
Total150015003000
Table 4. Evaluating Brain Tumor Classification with Adam Optimizer: Four-Class Test Dataset Performance Metrics.
ModelClassPrecision (%)Recall (%)F1 Score (%)Accuracy (%)
ResNet 50Glioma98.9797.6998.3397.69
Meningioma93.7997.8495.7797.84
Non-Tumor10094.7397.2994.43
Pituitary96.5997.7097.1497.70
Inception V3Glioma97.0397.0397.0397.03
Meningioma93.5293.5293.5293.52
Non-Tumor10098.6698.6697.36
Pituitary 96.0296.5796.5797.12
Table 5. Evaluating Brain Tumor Classification with Nadam Optimizer: Four-Class Test Dataset Performance Metrics.
ModelClassPrecision (%)Recall (%)F1 Score (%)Accuracy (%)
ResNet 50Glioma97.0999.3398.2099.34
Meningioma 97.7493.5295.5893.52
Non-Tumor10098.6899.3398.68
Pituitary 97.7097.7097.7097.70
Inception V3Glioma98.3296.7097.5096.70
Meningioma 91.1196.4093.7096.40
Non-Tumor10097.3698.6697.36
Pituitary 98.2697.7097.9897.70
Table 6. Evaluating Brain Tumor Classification with RMSprop Optimizer: Four-Class Test Dataset Performance Metrics.
ModelClassPrecision (%)Recall (%)F1 Score (%)Accuracy (%)
ResNet 50Glioma98.6798.3598.5198.35
Meningioma 95.6594.9695.3094.96
Non-Tumor10097.3698.6697.36
Pituitary 95.5097.7096.5997.70
Inception V3Glioma98.0399.0198.5299.01
Meningioma 95.5592.8194.3295.68
Non-Tumor10096.0597.9896.05
Pituitary 96.6198.2797.4398.27
Table 7. Overall Test Evaluation on Four Class Dataset with Various Models and Optimizers.
ModelOptimizerLossMAEPrecisionRecallF1-ScoreAccuracy
Inception V3Adam15.016.0696.6496.2696.4496.38
Nadam11.834.1996.9397.0496.9696.96
RMSprop14.604.1997.1596.9297.0297.25
Resnet 50Adam7.334.0497.3796.9997.1197.39
Nadam10.783.7598.1397.3197.7097.68
RMSprop13.034.4797.4597.0997.2697.39
Table 8. Performance Metrics of Resnet 50 Models with Different Optimizers for Tumor Classification on Test Dataset of Two-Class Tumor Dataset.
ModelOptimizerClassPrecision (%)Recall (%)F1 Score (%)Accuracy (%)
Resnet 50AdamTumor Positive10099.6599.8299.62
Tumor Negative99.6810099.81100
NadamTumor Positive99.6599.3099.4799.30
Tumor Negative99.3699.6899.5299.68
RMSpropTumor Positive99.5098.0698.7898.06
Tumor Negative98.3799.9598.9799.58
Table 9. Performance Metrics of Inception V3 Model with Different Optimizers for Tumor Classification on Test Dataset of Two-Class Tumors Dataset.
ModelOptimizerClassPrecision (%) Recall (%)F1 Score (%)Accuracy (%)
IncepitonV3AdamTumor Positive98.0698.0698.0698.62
Tumor Negative98.6899.2598.8198.35
NadamTumor Positive98.5697.6197.0896.61
Tumor Negative97.1497.9497.5497.94
RMSpropTumor Positive98.9699.6599.3099.65
Tumor Negative99.6799.0499.3599.04
Table 10. Performance Comparison Overall Test Evaluation of ResNet 50 and Inception V3 Model with Different Optimizers on Two-Class Tumor Dataset.
ModelOptimizerLossMAEPrecisionRecallF1-ScoreAccuracy
Resnet 50Adam8.831.699.8499.8299.8299.83
Nadam1.820.5399.5099.4999.4999.50
RMSprop2.910.1699.8499.8299.8399.33
Inception V3Adam8.941.1798.2198.2198.2198.22
Nadam10.862.6797.3597.2897.3197.33
RMSprop5.491.1198.9498.8299.8898.88
Disclaimer/Publisher’s Note: The statements, opinions and data contained in all publications are solely those of the individual author(s) and contributor(s) and not of MDPI and/or the editor(s). MDPI and/or the editor(s) disclaim responsibility for any injury to people or property resulting from any ideas, methods, instructions or products referred to in the content.

