Data Descriptor

NJN: A Dataset for the Normal and Jaundiced Newborns

by
Ahmad Yaseen Abdulrazzak
1,2,
Saleem Latif Mohammed
1 and
Ali Al-Naji
1,3,*
1
Electrical Engineering Technical College, Middle Technical University, Baghdad 10022, Iraq
2
Al Elwiya Maternity Teaching Hospital, Baghdad 10068, Iraq
3
School of Engineering, University of South Australia, Mawson Lakes, SA 5095, Australia
*
Author to whom correspondence should be addressed.
BioMedInformatics 2023, 3(3), 543-552; https://doi.org/10.3390/biomedinformatics3030037
Submission received: 11 May 2023 / Revised: 23 June 2023 / Accepted: 28 June 2023 / Published: 5 July 2023

Abstract

:
Neonatal jaundice is a prevalent condition among newborns, with potentially severe complications that can result in permanent brain damage if left untreated during its early stages. The existing approaches for jaundice detection involve invasive procedures such as blood sample collection, which can inflict pain and distress on the patient, and may give rise to additional complications. Alternatively, a non-invasive method using image-processing techniques and implementing kNN, Random Forest, and XGBoost machine learning algorithms as a classifier can be employed to diagnose jaundice, necessitating a comprehensive database of infant images to achieve a diagnosis with high accuracy. This data article presents the NJN collection, a repository of newborn images encompassing diverse birthweights and skin tones, spanning an age range of 2 to 8 days. The dataset is accompanied by an Excel sheet file in CSV format containing the RGB and YCrCb channel values, as well as the status of each sample. The dataset and associated resources are openly accessible at Zenodo website. Moreover, the Python code for data testing utilizing various AI techniques is provided. Consequently, this article offers an unparalleled resource for AI researchers, enabling them to train their AI systems and develop algorithms that can assist neonatal intensive care unit (NICU) healthcare specialists in monitoring neonates while facilitating the fast, real-time, non-invasive, and accurate diagnosis of jaundice.

1. Introduction

Neonatal jaundice manifests through evident symptoms such as yellow discoloration of the sclera and body skin [1]. This condition arises from elevated levels of bilirubin in the bloodstream, a consequence of premature liver function known as hyperbilirubinemia [2]. The significance of hyperbilirubinemia’s severity establishes it as a leading factor contributing to neonatal mortality and enduring impairments in newborns [3]. Disturbingly, a decade ago, hyperbilirubinemia was responsible for 114,000 deaths and 75,000 cases of newborn brain dysfunction [3]. The diagnosis of hyperbilirubinemia necessitates invasive procedures involving blood sample collection, specifically through Total Serum Bilirubin (TSB) tests [4]. However, this method is distressing and uncomfortable for patients. Consequently, non-invasive alternatives are preferred. One such technique is Transcutaneous Bilirubin (TcB), which allows for bilirubin calculation without invasive measures [5]. Unfortunately, the availability of this method remains limited within healthcare institutions [6,7].
The utilization of image-processing techniques in jaundice diagnosis dates back over two decades. Leartveravat (2009) conducted a study involving 61 neonates with jaundice, aiming to non-invasively calculate bilirubin levels through image analysis using the CMYK calculation method [8]. The researcher manually determined the CMYK components using Photoshop and estimated bilirubin levels by subtracting the values of the M component from the Y component. Pearson’s product-moment and linear regression analyses were implemented, revealing a significant correlation between bilirubin levels measured by TSB and the Y–M value. Although this method was an approximation lacking precision, it marked the beginning of various attempts to diagnose jaundice non-invasively. Another effort to diagnose hyperbilirubinemia and jaundice through color detection was performed by Mansour et al. (2012), utilizing images from a random infant monitoring database obtained from the Google website [9]. They selected pictures of normal and jaundiced infants captured under different lighting conditions and angles using the image acquisition toolbox in Matlab. The YCrCb color space method was employed, excluding the luminance (Y) and chrominance (CrCb) components stored in separate channels. Subsequently, standard deviation, mean, and kurtosis methods were utilized to compare the skin colors of normal and jaundiced infants. In 2015, a proposed study by Leung et al. [10] suggested an approach for screening neonatal jaundice using scleral images. By analyzing the hue of the sclera, the technique aimed to estimate the bilirubin level. Experimental evaluation was performed on 110 newborns, demonstrating that the proposed method exhibited promise as a screening tool for jaundice detection. Munkholm et al. (2018) proposed TcB (Transcutaneous Bilirubin) measurement based on images captured using a dermatoscope attached to an iPhone 6 camera, with a Wratten No. 11 filter inserted [11]. Pearson’s correlation coefficient was employed to assess the relationship between intensity and TSB levels. However, the researchers only obtained a total of 64 infant images. Another study by Endang et al. (2019) presented a system for estimating the risk zone of jaundiced neonates through skin color analysis, utilizing a digital camera for capturing newborn images [12]. The researchers collected only 120 images and employed various techniques to obtain values of RGB, HSV, and YCbCr color spaces, which served as input parameters for linear regression modeling and validation. The achieved accuracy was 67%. In a different approach, Padidar et al. (2019) proposed a mobile application for Android aimed at jaundice detection, although their image collection was limited to only 113 infant images [13]. Ayden et al. (2016) employed AI techniques as a classifier, utilizing 80 images of infants (half normal and half jaundiced) captured with a smartphone camera [14]. They implemented an image segmentation technique to achieve color balance, employing an eight-colored card to calibrate a specific area of the baby’s skin. Color map transformation and feature extraction were applied to the baby’s skin color and the calibration card in RGB, YCrCb, and LAB color spaces. Subsequently, kNN (k-Nearest Neighbor) and SVR (Support Vector Regression) algorithms were employed to estimate bilirubin levels. These AI techniques demonstrated improved results with reduced processing time. In a study conducted by Warkaa et al. (2021), the authors presented a research investigation focused on diagnosing neonatal jaundice using a graphical user interface. The study utilized color models such as RGB (Red, Green, and Blue), HSV (Hue, Saturation, and Value), and YCbCr (Luminance, Chrominance) for their analysis. Although the results were encouraging, it is essential to note that the study had a limited sample size, consisting of only ten images of normal and jaundiced infants [15]. Recently, Hashim et al. attempted to employ image-processing methods for jaundice diagnosis, but due to the limited availability of neonate images, they could only use two manikins and 20 infant images [16].
All the previously mentioned studies faced limitations regarding the available number of infant images, with sample sizes not exceeding 120. Acquiring a substantial number of neonate images has been challenging, leading to a scarcity of research data. However, this data article represents a noteworthy contribution by providing 760 neonate images. This extensive dataset serves as a valuable resource for future investigations in jaundice detection and the development of AI techniques. The availability of such a comprehensive dataset enables medical professionals in the Neonatal Intensive Care Unit (NICU) to accurately and rapidly diagnose jaundice using non-invasive methods.
The remainder of this paper is structured as follows: Section 2 presents the methods and materials used in this study. Section 3 discusses the results and provides a comprehensive discussion of the findings. Section 4 offers user notes, which provide additional information or instructions for users of the dataset or related materials. Finally, Section 5 presents the conclusion, summarizing the essential findings and implications of the study.

2. Methods and Materials

2.1. Ethics Considerations

The data were collected from about 600 newborns aged between 2 to 8 days with different skin tones and weights. All infant image data were collected from Al-Elwiya Maternity Teaching Hospital in Al Rusafa, Baghdad, Iraq, all according to the Declaration of Helsinki guidelines (Finland 1964) with ethical clearance granted by the research committee at the Al Rusafa Directorate of Health, Iraqi Ministry of Health and Environment, Baghdad, Iraq (Protocol number: 2022019) and written approval of the legal guardian for each infant.

2.2. Data Description

This dataset article provides images of newborns taken in the NICU at Al-Elwiya Maternity Teaching Hospital in Al Rusafa, Baghdad, Iraq. It is a hospital specializing in obstetrics and gynecology; therefore, all infants are considered aseptic. These data comprise normal and jaundiced infant images from different angles and lighting environments. Thus, collecting as many images as possible helps increase the accuracy. The collected data include 760 infant images (560 normal and 200 jaundiced) with 1000 × 1000 resolution, all in jpg format. The images were taken by an iPhone 11 pro max 12 MP camera. The dataset is composed of three folders: normal neonate images, jaundiced neonate images, and an Excel sheet file in CSV (Comma delimited) format that contains the RGB and YCrCb channel values, in addition to the status of each row of values, either “1” for normal or “2” for jaundiced. The classification of NJN data and a specification table are shown in Figure 1 and Table 1, respectively.

2.3. Artificial Intelligence Techniques

This study applied three classification techniques, namely, k-Nearest Neighbors (kNN), Random Forest (RF), and XGBoost, as artificial intelligence methods on the dataset. Each of these techniques will be individually discussed in the subsequent subsections.

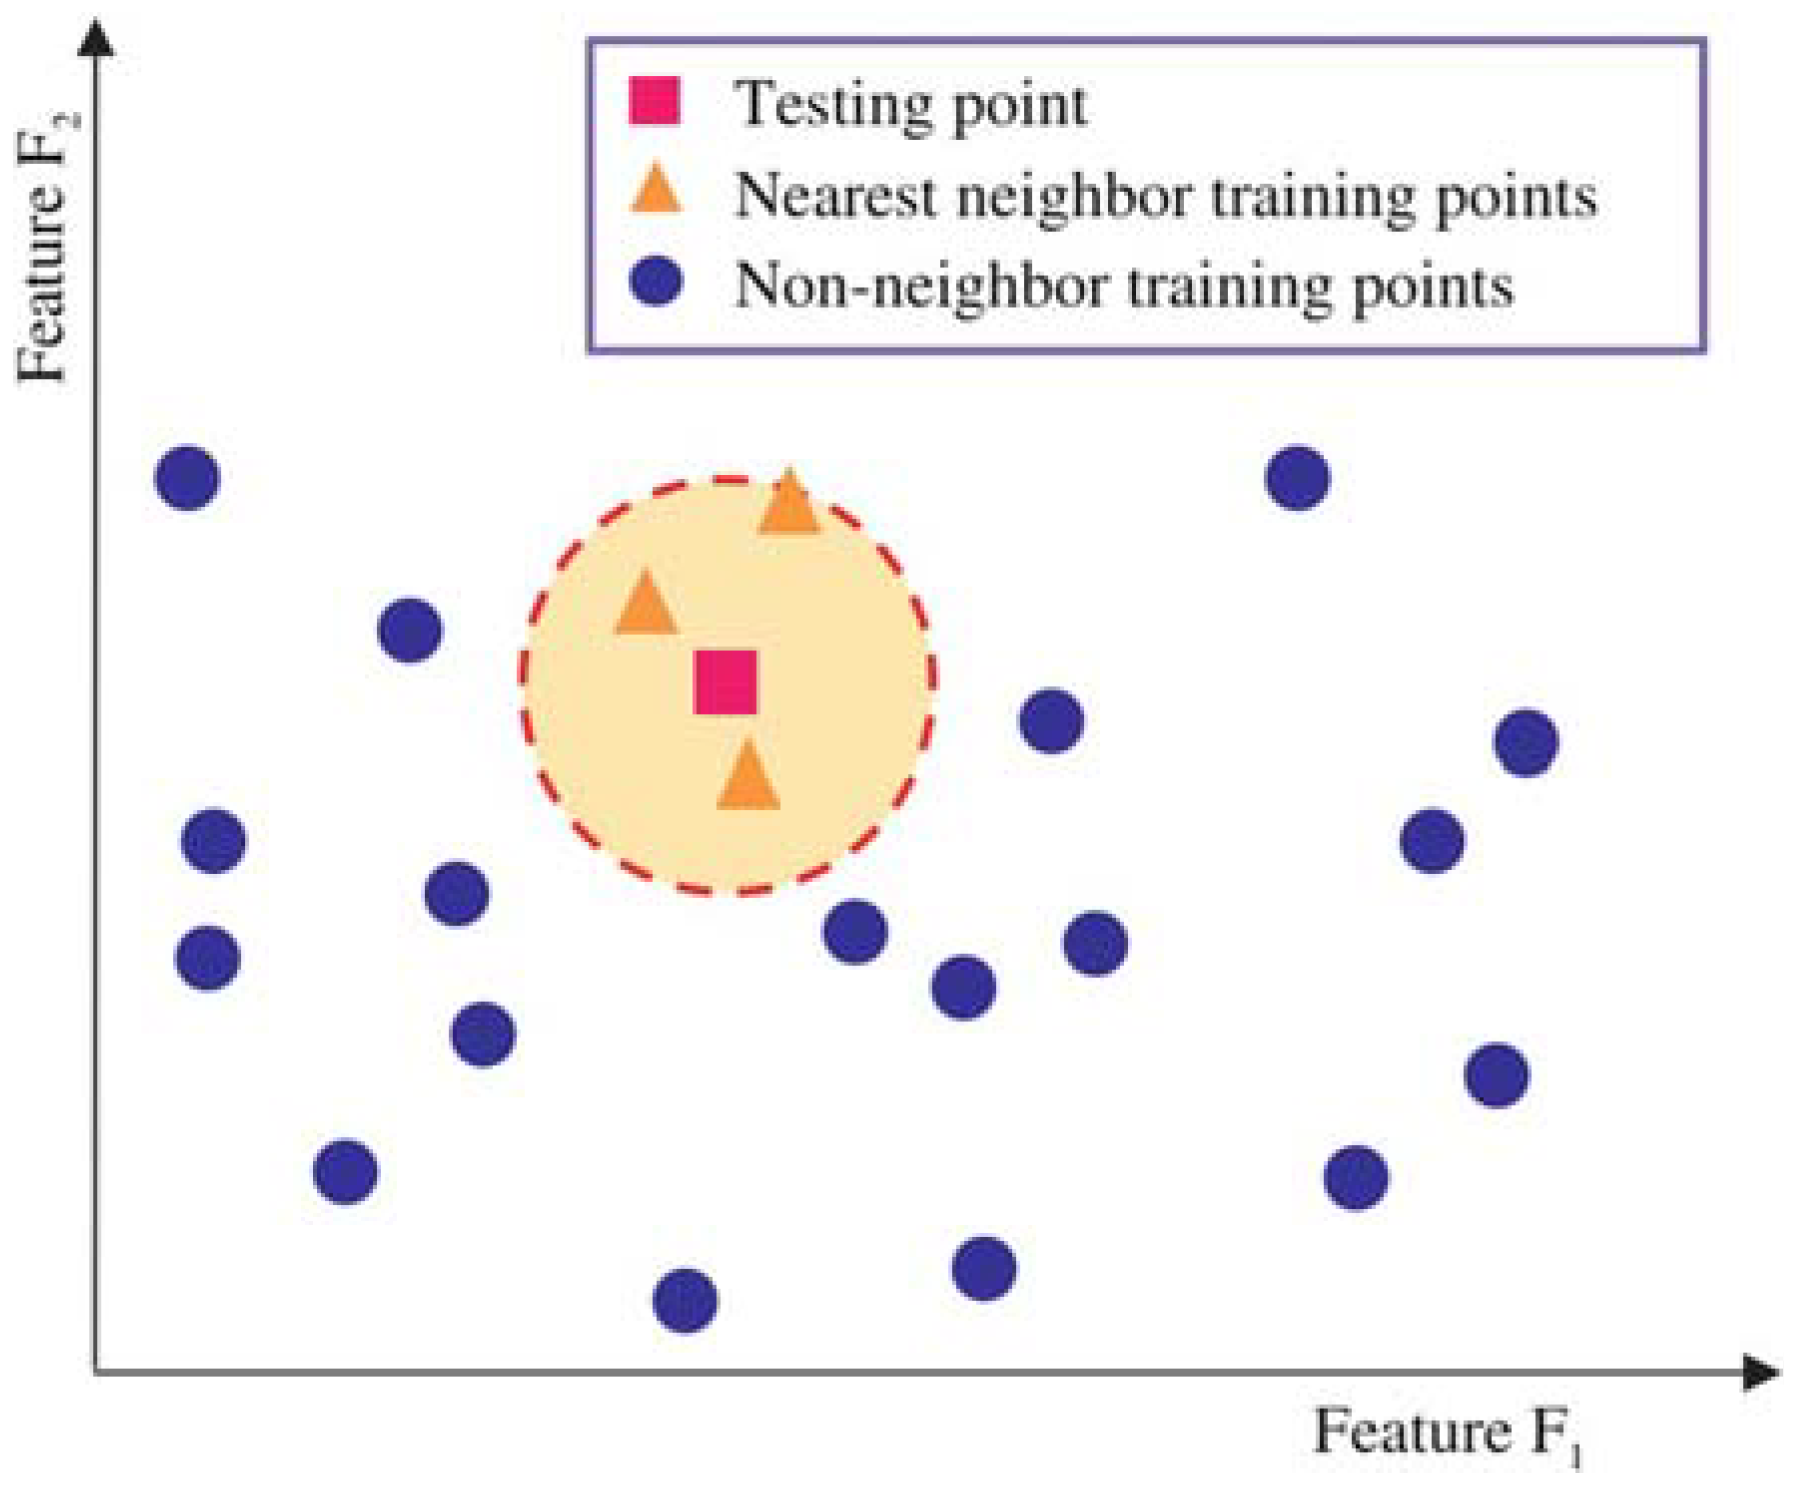
2.3.1. k-Nearest Neighbor

The kNN (k-Nearest Neighbor) technique is a simple yet effective classification method widely used in various domains. As a non-parametric approach, it identifies the k closest neighbors of a given data record t, forming a local neighborhood around t. However, the success of the kNN method relies on selecting an appropriate value for k, which acts as a bias parameter. The algorithm is iteratively executed multiple times to determine the optimal value of k, and the performance is evaluated. The k value that yields the best classification performance is then selected as the optimal choice [17]. Figure 2 clarifies the selection operation of the k value, represented by the green triangle.
The primary limitation of the kNN algorithm is its categorization as a lazy learning technique, as it solely relies on the weights assigned to neighboring data points without actively learning from the entire training set [19].

2.3.2. Random Forest

Random Forest is an ensemble learning algorithm that combines multiple decision trees to improve prediction accuracy and generalization. It has gained popularity due to its effectiveness in various domains [20]. The advantages of Random Forest include its ability to handle high-dimensional data, manage missing values, and mitigate overfitting. It can handle datasets with many features without requiring feature selection or dimensionality reduction techniques as shown in Figure 3. Additionally, Random Forest is robust to noisy data and outliers, as the aggregation of predictions from multiple trees helps to improve overall accuracy [21]. However, Random Forest has limitations, such as reduced interpretability compared to simpler models such as decision trees. The ensemble nature of Random Forest makes it more challenging to interpret feature relationships. It may also struggle with imbalanced datasets, where the majority class dominates the learning process. Techniques such as class weighting or resampling can address this issue [21]. Despite these limitations, Random Forest has demonstrated strong performance abilities in various applications, making it a widely used algorithm [22].

2.3.3. XGBoost

XGBoost, an enhanced algorithm of gradient boosting, is founded on the principles of a decision tree ensemble machine learning algorithm, specifically utilizing weak learners or stumps. While decision trees, in their generic form, are generally comprehensible and easy to conceptualize, acquiring an intuitive understanding of the next generation of tree-based algorithms can present challenges [23]. The core functionality of XGBoost revolves around optimizing the objective function’s value, enabling it to provide efficient solutions to various data-centric scientific problems with heightened accuracy and reduced computational time [19]. Diverging from the traditional gradient boost algorithm, XGBoost introduces a non-sequential approach to incorporating weak learners [23]. Furthermore, the XGBoost algorithm implements multiple strategies to effectively leverage the CPU’s resources, enhancing speed and performance [24]. Figure 4 illustrates the processing of XGBoost for a given dataset.

2.4. Evaluation Metrics

Evaluation metrics are crucial for assessing the performance and effectiveness of various machine learning models and algorithms. These metrics provide quantitative measures to evaluate the predictive power and quality of the models by comparing their predictions with the actual values. This section will discuss four commonly used evaluation metrics: accuracy, precision, recall, and F1-score. Each metric provides unique insights into the model’s performance and helps in different aspects of evaluation.
Accuracy is a widely used evaluation metric that measures the overall correctness of the model’s predictions. It is defined as the ratio of the correctly predicted samples to the total number of samples in the dataset, as follows:
Accuracy = (TP + TN)/(TP + TN + FP + FN)
where TP (True Positive) represents the number of correctly predicted positive samples. TN (True Negative) represents the number of correctly predicted negative samples. FP (False Positive) represents the number of incorrectly predicted positive samples, and FN (False Negative) represents the number of incorrectly predicted negative samples.
Precision is a metric that focuses on the accuracy of the positive predictions made by the model. It measures the proportion of correctly predicted positive samples out of the total positive predictions, as follows:
Precision = TP/(TP + FP)
Recall, also known as sensitivity or true positive rate, measures the model’s ability to identify positive samples correctly. It is the proportion of correctly predicted positive samples out of the total actual positive samples, as follows:
Recall = TP/(TP + FN)
The F1 score is a balanced metric combining precision and recall into a single value. It provides a harmonic mean of precision and recall and is particularly useful when dealing with imbalanced datasets, as follows:
F1-score = 2 × (Precision × Recall)/(Precision + Recall)
The F1-score ranges between 0 and 1, where a value of 1 indicates a perfect balance between precision and recall, while a value of 0 indicates poor performance.
These evaluation metrics provide a comprehensive view of a model’s performance in classification tasks. By considering accuracy, precision, recall, and F1-score, researchers and practitioners can make informed decisions about the effectiveness and reliability of machine learning models.

3. Results and Discussion

The experimental assessment was carried out using the Python program (version 3.9) in the Spyder integrated development environment (IDE) (version 5.2.2) from the Anaconda3-Navigator. To evaluate the collected data, the color intensity values of RGB and YCbCr obtained from the selected ROI from each infant have been collected and placed on an Excel file (train.csv). The evaluation metrics, including accuracy, precision, recall, F1-score, and confusion matrix, were used for evaluating the data based on three AI techniques, including k-Nearest Neighbors (kNN) [26], Random Forest (RF) [27] and Extreme Gradient Boosting (XGboost) [28]. All these techniques used 80% of the data for training and 20% for testing, and provided the weighted average of the above metrics, as shown in Table 2.
Table 2 summarizes the performance evaluation results of three different classification techniques: kNN (k-Nearest Neighbors), RF (Random Forest), and XGboost (Extreme Gradient Boosting). The evaluation metrics used to assess these techniques include accuracy, precision, recall, and F1-score. Let us discuss the findings for each method.
The kNN technique achieved an accuracy of 95.4%, indicating that it correctly classified 95.4% of the samples. The precision score of 96% implies that 96% of the positive predictions made by the KNN model were accurate. The recall score of 95% suggests that the kNN technique successfully identified 95% of the actual positive samples. The F1-score of 96% demonstrates a balanced performance between precision and recall for the kNN technique.
The RF technique exhibited a higher accuracy of 97.3% compared to kNN. This suggests that the RF model correctly classified 97.3% of the samples, showing a better overall performance. The precision score of 97% indicates that 97% of the positive predictions made by the RF model were correct. The recall score of 97% suggests that the RF technique accurately identified 97% of the positive samples. The F1-score of 97% demonstrates a good balance between precision and recall for the RF technique.
The XGboost technique achieved the highest accuracy among the three methods, with a score of 98.6%. This indicates that the XGboost model correctly classified 98.6% of the samples, demonstrating the highest overall performance. The precision score of 99% implies that 99% of the positive predictions made by the XGboost model were accurate. The recall score of 99% indicates that the XGboost technique successfully identified 99% of the actual positive samples. The F1-score of 99% demonstrates an excellent balance between precision and recall for the XGboost technique.
The evaluation results highlight that the XGboost technique outperformed kNN and RF in terms of accuracy, precision, recall, and F1-score. It achieved the highest scores across all metrics, indicating its superiority in correctly classifying samples and accurately predicting positive instances. These findings suggest that the XGboost technique may be the most suitable choice for the given classification task. However, it is essential to consider the specific characteristics of the dataset and the problem at hand when selecting the most appropriate technique.
From Table 2, it has been observed that XGBoost was found to have the highest accuracy among all the techniques used in this work, with an accuracy of 98.6%, while KNN was found to have the lowest accuracy of 95.4%.
The visualization of the confusion matrix from three AI techniques is shown in Figure 5, including the numbers of instances of True Positive (TP), True Negative (TN), False Positive (FP), and False Negative (FN).
This study encountered limitations in obtaining accurate and dependable images of neonates in the NICU due to various factors. Inconsistent lighting conditions, discrepancies in camera settings, and difficulty capturing images of restless or uncooperative infants contribute to the variability in image quality. Consequently, the suboptimal quality of the images can negatively impact the performance of classification techniques, resulting in imprecise or untrustworthy outcomes.

4. User Notes

  • Images of normal and jaundiced neonates are scarce online and not easily accessible;
  • Professional healthcare developers working in the AI field can benefit from these data;
  • Other researchers in biomedical engineering and computer science can also use the provided images in skin color analysis for neonates to diagnose jaundice or other skin conditions;
  • The provided images comprise 560 normal and 200 jaundiced infants;
  • The images are in jpg format with 1000 × 1000 resolution;
  • An Excel sheet in CSV (comma delimited) format is given that contains RGB and YCbCr channel values for all the provided images.

5. Conclusions

In conclusion, this paper presented the NJN dataset, a valuable resource for diagnosing neonatal jaundice in normal and jaundiced newborns. The evaluation of three artificial intelligence techniques, kNN, Random Forest, and XGBoost, demonstrated their effectiveness in accurately identifying neonates with high accuracy, precision, recall, and F1 scores. Remarkably, XGBoost exhibited superior performance across all metrics. The NJN dataset, encompassing diverse birthweights and skin tones, provides researchers and healthcare specialists in the neonatal intensive care unit (NICU) with a unique resource to train AI systems and develop algorithms for the real-time and non-invasive monitoring of neonates, enabling the fast and accurate diagnosis of jaundice. Further research can focus on expanding the dataset, incorporating additional clinical parameters, and exploring other advanced AI techniques to enhance neonatal jaundice diagnosis and management in clinical settings. Overall, this study contributes to improving the quality of care for newborns affected by jaundice and advancing the field of neonatal healthcare.

Supplementary Materials

The following supporting information can be downloaded at: https://zenodo.org/record/7825810#.ZDgONrpBy3A.

Author Contributions

Conceptualization, A.A.-N.; methodology, A.Y.A., A.A.-N. and S.L.M.; software, A.Y.A. and A.A.-N.; validation, A.Y.A. and A.A.-N.; investigation, A.Y.A., A.A.-N. and S.L.M.; resources, A.Y.A.; data curation, A.Y.A.; writing—original draft preparation, A.Y.A. and A.A.-N.; writing—review and editing, A.Y.A., A.A.-N. and S.L.M.; visualization, A.A.-N.; supervision, A.A.-N. and S.L.M.; project administration, A.A.-N. and S.L.M.; funding acquisition, A.A.-N. All authors have read and agreed to the published version of the manuscript.

Funding

This research received no external funding.

Institutional Review Board Statement

The study was conducted in accordance with the Declaration of Helsinki and approved by the research committee of the Al Rusafa Directorate of Health, Iraqi Ministry of Health and Environment, Baghdad, Iraq (Protocol number: 2022019) for studies involving humans.

Informed Consent Statement

Informed consent was obtained from all subjects involved in the study.

Data Availability Statement

The data presented in this study are available on Supplementary Materials, and https://sites.google.com/view/neonataljaundice (accessed on 1 June 2023).

Acknowledgments

The authors show their gratitude and appreciation to Middle Technical University, Electrical Engineering Technical College, Baghdad, Iraq, for the support and encouragement in disseminating scientific engineering research, and to Al Elwiya Maternity Teaching Hospital for providing the data required to perform this study.

Conflicts of Interest

The authors declare no conflict of interest.

References

  1. Dzulkifli, F.A.; Mashor, M.Y.; Khalid, K. Methods for determining bilirubin level in neonatal jaundice screening and monitoring: A literature review. J. Eng. Res. Educ. 2018, 10, 1–10. [Google Scholar]
  2. Brits, H.; Adendorff, J.; Huisamen, D.; Beukes, D.; Botha, K.; Herbst, H.; Joubert, G. The prevalence of neonatal jaundice and risk factors in healthy term neonates at National District Hospital in Bloemfontein. Afr. J. Prim. Health Care Fam. Med. 2018, 10, e1–e6. [Google Scholar] [CrossRef] [PubMed] [Green Version]
  3. Bhutani, V.; Zipursky, A.; Blencowe, H.; Khanna, R.; Sgro, M.; Ebbesen, F.; Bell, J.; Mori, R.; Slusher, T.; Fahmy, N.; et al. Neonatal hyperbilirubinemia and rhesus disease of the newborn: Incidence and impairment estimates for 2010 at regional and global levels. Pediatr. Res. 2013, 74, 86–100. [Google Scholar] [CrossRef] [Green Version]
  4. Mishra, S.; Agarwal, R.; Deorari, A.K.; Paul, V.K. Jaundice in the newborns. Indian J. Pediatr. 2008, 75, 157–163. [Google Scholar] [CrossRef]
  5. Pediatrics, A. Management of hyperbilirubinemia in the newborn infant 35 or more weeks of gestation. Am. Acad. Pediatr. 2004, 114, 297–316. [Google Scholar]
  6. Mantagou, L.; Fouzas, S.; Skylogianni, E.; Giannakopoulos, I.; Karatza, A.; Varvarigou, A. Trends of transcutaneous bilirubin in neonates who develop significant hyperbilirubinemia. Pediatrics 2012, 130, e898–e904. [Google Scholar] [CrossRef] [PubMed] [Green Version]
  7. Abdulrazzak, A.Y.; Mohammed, S.L.; Al-Naji, A.; Chahl, J. Computer-Aid System for Automated Jaundice Detection. J. Tech. 2023, 5, 8–15. [Google Scholar] [CrossRef]
  8. Leartveravat, S. Transcutaneous bilirubin measurement in full term neonate by digital camera. Med. J. Srisaket Surin Buriram Hosp. 2009, 24, 105–118. [Google Scholar]
  9. Mansor, M.; Yaacob, S.; Hariharan, M.; Basah, S.; Jamil, S.A.; Khidir, M.M.; Rejab, M.; Ibrahim, K.K.; Jamil, A.A.; Junoh, A. Jaundice in newborn monitoring using color detection method. Procedia Eng. 2012, 29, 1631–1635. [Google Scholar] [CrossRef] [Green Version]
  10. Leung, T.S.; Kapur, K.; Guilliam, A.; Okell, J.; Lim, B.; MacDonald, L.W.; Meek, J. Screening neonatal jaundice based on the sclera color of the eye using digital photography. Biomed. Opt. Express 2015, 6, 4529–4538. [Google Scholar] [CrossRef] [Green Version]
  11. Munkholm, S.B.; Krøgholt, T.; Ebbesen, F.; Szecsi, P.B.; Kristensen, S.R. The smartphone camera as a potential method for transcutaneous bilirubin measurement. PLoS ONE 2018, 13, e0197938. [Google Scholar] [CrossRef] [Green Version]
  12. Juliastuti, E.; Nadhira, V.; Satwika, Y.W.; Aziz, N.A.; Zahra, N. Risk zone estimation of newborn jaundice based on skin color image analysis. In Proceedings of the 2019 6th International Conference on Instrumentation, Control, and Automation (ICA), Bandung, Indonesia, 31 July–2 August 2019; pp. 176–181. [Google Scholar]
  13. Padidar, P.; Shaker, M.; Amoozgar, H.; Khorraminejad-Shirazi, M.; Hemmati, F.; Najib, K.S.; Pourarian, S. Detection of neonatal jaundice by using an android OS-based smartphone application. Iran. J. Pediatr. 2019, 29, e84397. [Google Scholar] [CrossRef] [Green Version]
  14. Aydın, M.; Hardalaç, F.; Ural, B.; Karap, S. Neonatal jaundice detection system. J. Med. Syst. 2016, 40, 166. [Google Scholar] [CrossRef]
  15. Hashim, W.; Al-Naji, A.; Al-Rayahi, I.A.; Oudah, M. Computer vision for jaundice detection in neonates using graphic user interface. In IOP Conference Series: Materials Science and Engineering, Proceedings of the Fifth Scientific Conference for Engineering and Postgraduate Research (PEC 2020), Baghdad, Iraq, 21–22 December 2020; IOP Science: Bristol, UK, 2021; p. 012076. [Google Scholar]
  16. Hashim, W.; Al-Naji, A.; Al-Rayahi, I.A.; Alkhaled, M.; Chahl, J. Neonatal Jaundice Detection Using a Computer Vision System. Designs 2021, 5, 63. [Google Scholar] [CrossRef]
  17. Guo, G.; Wang, H.; Bell, D.; Bi, Y.; Greer, K. KNN model-based approach in classification. In On the Move to Meaningful Internet Systems, Proceedings of the OTM Confederated International Conferences, CoopIS, DOA, and ODBASE 2003, Catania, Italy, 3–7 November 2003; Springer: Berlin/Heidelberg, Germany, 2003; pp. 986–996. [Google Scholar]
  18. Hu, C.; Jain, G.; Zhang, P.; Schmidt, C.; Gomadam, P.; Gorka, T. Data-driven method based on particle swarm optimization and k-nearest neighbor regression for estimating capacity of lithium-ion battery. Appl. Energy 2014, 129, 49–55. [Google Scholar] [CrossRef]
  19. Nguyen, H.; Bui, X.-N.; Bui, H.-B.; Cuong, D.T. Developing an XGBoost model to predict blast-induced peak particle velocity in an open-pit mine: A case study. Acta Geophys. 2019, 67, 477–490. [Google Scholar] [CrossRef]
  20. Breiman, L. Random forests. Mach. Learn. 2001, 45, 5–32. [Google Scholar] [CrossRef] [Green Version]
  21. Liaw, A.; Wiener, M. Classification and regression by randomForest. R News 2002, 2, 18–22. [Google Scholar]
  22. Deng, L.; Yu, D. Deep learning: Methods and applications. Found. Trends Signal Process. 2014, 7, 197–387. [Google Scholar] [CrossRef] [Green Version]
  23. Kabiraj, S.; Raihan, M.; Alvi, N.; Afrin, M.; Akter, L.; Sohagi, S.A.; Podder, E. Breast cancer risk prediction using XGBoost and random forest algorithm. In Proceedings of the 2020 11th International Conference on Computing, Communication and Networking Technologies (ICCCNT), Kharagpur, India, 1–3 July 2020; pp. 1–4. [Google Scholar]
  24. Ramraj, S.; Uzir, N.; Sunil, R.; Banerjee, S. Experimenting XGBoost algorithm for prediction and classification of different datasets. Int. J. Control. Theory Appl. 2016, 9, 651–662. [Google Scholar]
  25. Malik, S.; Harode, R.; Kunwar, A. XGBoost: A deep dive into boosting. Simon Fraser Univ. 2020, 1–21. [Google Scholar]
  26. Kramer, O.; Kramer, O. K-nearest neighbors. In Dimensionality Reduction with Unsupervised Nearest Neighbors; Springer: Berlin/Heidelberg, Germany, 2013; pp. 13–23. [Google Scholar]
  27. Fawagreh, K.; Gaber, M.M.; Elyan, E. Random forests: From early developments to recent advancements. Syst. Sci. Control. Eng. 2014, 2, 602–609. [Google Scholar] [CrossRef] [Green Version]
  28. Chen, T.; He, T.; Benesty, M.; Khotilovich, V.; Tang, Y.; Cho, H.; Chen, K.; Mitchell, R.; Cano, I.; Zhou, T. Xgboost: Extreme Gradient Boosting; R Package Version 0.4–2; R Package, 2015. [Google Scholar]
Figure 1. The classification of NJN data where “1” is normal or “2” is jaundiced newborns.
Biomedinformatics 03 00037 g001
Figure 2. Two-dimensional kNN algorithm illustration [18].
Biomedinformatics 03 00037 g002
Figure 3. Illustration of random forest algorithm [7].
Biomedinformatics 03 00037 g003
Figure 4. Illustration of the XGBoost classifier with gradient tree [25].
Biomedinformatics 03 00037 g004
Figure 5. The confusion matrix using (a) kNN, (b) RF, and (c) XGBoost technique.
Biomedinformatics 03 00037 g005
Table 1. Specification table.
TaskDescription
BeneficiariesBiomedical Engineers and Computer Science researchers.
Specific subject areaAI for neonatal jaundice and skin diseases.
Type of dataImages and Excel sheet in CSV format for RGB and YCrCb channel values and the status of each row.
How data were acquiredImages were taken with an iPhone 11 pro max camera.
Data formatJpg format.
Parameters for data collectionImages were taken from different angles and lighting conditions.
Description of data collectionImages were collected from the NICU for 600 aseptic normal and jaundiced neonates.
Data source locationNICU ward in Al-Elwiya Maternity Teaching Hospital in Al Rusafa, Baghdad, Iraq.
Data accessibilityThe dataset is freely accessible at (https://zenodo.org/record/7825810#.ZDgONrpBy3A (1 June 2023).
Table 2. Data evaluation based on different AI techniques.
TechniqueAccuracyPrecisionRecallF1-Score
KNN95.4%96%95%96%
RF97.3%97%97%97%
XGboot98.6%99%99%99%
Disclaimer/Publisher’s Note: The statements, opinions and data contained in all publications are solely those of the individual author(s) and contributor(s) and not of MDPI and/or the editor(s). MDPI and/or the editor(s) disclaim responsibility for any injury to people or property resulting from any ideas, methods, instructions or products referred to in the content.

