Article

Building Footprint Extraction from Classified TLS Point Clouds: Evaluation of Point Cloud Cleaning Methods


Institute of Geodesy, Cartography and Geographical Information Systems, Faculty of Mining, Ecology, Process Control and Geotechnologies, Technical University of Kosice, Park Komenského 19, 04001 Košice, Slovakia
*
Author to whom correspondence should be addressed.
Geomatics 2026, 6(3), 56; https://doi.org/10.3390/geomatics6030056
Submission received: 1 April 2026 / Revised: 30 April 2026 / Accepted: 22 May 2026 / Published: 24 May 2026

Abstract

Terrestrial laser scanning (TLS) represents an efficient method for acquiring spatial data in urban environments, while the quality of resulting geometric outputs is significantly influenced by subsequent point cloud processing. This article focuses on analyzing the accuracy of automatic building footprint extraction from classified TLS point clouds, with an emphasis on the role of data cleaning methods. The study area is located in the city center of Žiar nad Hronom, where urban structures were monitored using TLS. For detailed analysis, three objects were selected—an apartment building, a garage, and an industrial building—representing different levels of geometric complexity. To simulate realistic processing conditions, classification results obtained from different software (Leica Cyclone 3DR, Trimble RealWorks, and LiDAR360) were used. Their quality was evaluated using standard metrics such as Precision, Recall, and F1-score. These classifications also served as input scenarios containing typical errors, such as point clusters, vegetation near buildings, or misclassified terrain elements. Subsequently, selected point cloud cleaning methods were applied to these datasets, specifically statistical outlier removal, noise filter, and label connected components. The accuracy of the extracted building footprints was evaluated by comparison with reference data obtained from geodetic measurements. The results show that automatic classification alone is not sufficient to achieve accurate building footprints, and that data cleaning plays a decisive role. For example, in the case of the apartment building, statistical filtering reduced the area from 1052 m2 to approximately 854 m2 (reference value: 706 m2) and significantly improved positional accuracy (centroid shift reduced from 0.455 m to 0.077 m). Similarly, for the industrial building, the area was reduced from 215 m2 to approximately 165 m2 (reference: 148 m2) while maintaining the correct number of corner points. In contrast, noise filter method proved to be less reliable, as removing up to 25–30% of points often did not lead to improvements in footprint geometry. The results highlight the importance of systematic point cloud cleaning as a key step in automated building footprint extraction and demonstrate that a properly selected combination of methods can significantly improve accuracy even in noisy datasets. The article also provides practical guidance for efficient TLS data processing in geoinformatics applications.

1. Introduction

The digitization of urban environments currently represents one of the key topics in the fields of geodesy, geoinformatics, and spatial planning. Increasing demands for accurate, up-to-date, and detailed spatial data are closely linked to the development of concepts such as digital cities [1], 3D modeling of urban areas [2], and support for decision-making processes in spatial planning and asset management. One of the technologies that has significantly contributed to expanding the possibilities of high-resolution spatial data acquisition is TLS. This non-contact method enables fast and accurate collection of dense point clouds that faithfully represent the geometric shape of objects in three-dimensional space. TLS provides large volumes of data with millimeter- to centimeter-level accuracy, depending on the technology used, measurement distance, and environmental conditions. The result of TLS measurement is a point cloud containing millions to billions of points, where each point is defined by its spatial coordinates and often additional attributes such as signal intensity. However, data acquisition itself represents only the first step in the process of creating usable spatial information. A crucial step is subsequent data processing, which includes registration of individual scan positions, noise filtering, point classification, and extraction of relevant objects or geometric features. TLS measurements are applied across various fields and disciplines, including mining, geology, architecture, construction, mechanical engineering, and industry, as well as for monitoring natural processes such as slope stability, geohazards, or landslides.
Study [3] investigates the use of TLS for evaluating 3D convergence and surface changes in salt mining environments, demonstrating its potential for monitoring the safety and stability of mining structures. Publication [4] analyzes underground deformations caused by mining using multi-temporal TLS data. Point cloud registration enables precise determination of displacements and deformations, which is essential for risk prevention, and confirms the effectiveness of repeated TLS monitoring for dynamic geodetic applications. Research [5] compares the accuracy of Simultaneous Localization and Mapping (SLAM) and static laser scanners in mining tunnels. Authors in [6] present the G-Super4PCS method for registering photogrammetric and TLS data in geology, enabling accurate integration of multi-source data and improving spatial models of geological formations. Article [7] focuses on the creation of geocultural site content using precise spatial data, demonstrating the potential of TLS and Unmanned Aerial System (UAS) for documenting historical sites. Publication [8] analyzes the use of TLS in architecture, construction, and engineering, showing that high-precision laser scanners enable detailed mapping of built structures. Study [9] validates wall geometry using a combination of TLS data and Building Information Modeling (BIM) models, highlighting its relevance for accurate digital documentation of buildings. Publication [10] examines spatial data for monitoring deformations in bridge structures, confirming that TLS allows precise quantification of changes and supports preventive maintenance. Authors in [11] assess the stability of shallow rock blocks on steep slopes using a combination of TLS and UAS photogrammetry, showing that integrating both technologies improves the accuracy of terrain stability assessment. Similarly, study [12] investigates high rock slopes using combined TLS and UAS digital photogrammetry, confirming improved model accuracy and the ability to identify critical areas, which is essential for landslide prevention. Publication [13] presents the use of TLS for mapping, monitoring, and modeling geohazards, demonstrating high accuracy and reliability in identifying risk zones. Article [14] focuses on monitoring ground crack deformations using TLS, further supporting its application in geohazard mapping. Study [15] combines TLS point clouds with RGB imagery to estimate dense 3D displacements in landslide monitoring, while publication [16] explores the use of digital elevation models generated from TLS data.
In the context of urban mapping, point cloud classification [17] plays a crucial role, as its objective is to assign individual points to predefined classes such as terrain, buildings, or vegetation [18,19]. The reliability of classification is closely linked to point cloud segmentation [20], which divides the data into homogeneous and spatially coherent units representing individual objects or their parts [21]. During point cloud processing, noise, isolated points, or misclassified elements often occur due to measurement inaccuracies or limitations of classification algorithms. Such anomalies can negatively affect subsequent analyses; therefore, point cloud cleaning methods are applied to remove or separate noise and incorrectly classified points. The quality of segmentation, classification [22], and subsequent cleaning thus has a direct impact on the accuracy of geometric feature extraction, particularly building footprint edges [23]. One of the most common outputs of TLS data processing in urban environments is building footprint extraction [24], which represents a fundamental geometric characteristic of an object used in map production, cadastral updates, and 3D city modeling [25]. Extracting a building footprint from a point cloud [26] involves identifying the boundary lines of an object based on points classified as buildings. If the classification is inaccurate or contains noise, irrelevant points may be included, or important points may be omitted. These errors are subsequently reflected in deviations of the resulting footprint, potentially leading to systematic or random distortions of its shape. For this reason, it is essential to analyze not only the quality of classification but also the effectiveness of point cloud cleaning methods, which can significantly improve the geometric accuracy of extracted footprints. Article [27] presents the PH-shape method based on adaptive homology for extracting building outlines from point clouds, showing that it accurately captures building shapes and geometric details. Publication [28] proposes the PDAA algorithm for dynamic polygon adjustment in building footprint extraction, demonstrating improved accuracy and topological consistency of the resulting footprints.
The presented article focuses on analyzing the possibilities of improving the accuracy of automatic building footprint extraction from TLS point clouds through various data cleaning methods. The study area is located in the city center of Žiar nad Hronom, where detailed TLS measurements of selected parts of the urban environment were carried out. Out of six surveyed objects, three building typologies were purposefully selected for detailed analysis: an apartment building, a garage, and an industrial building. Rather than representing a statistically random sample, the selection followed a purposive typological sampling strategy aimed at covering distinct levels of geometric complexity and structural characteristics relevant for footprint extraction, including a simple regular structure, a geometrically complex residential building, and an irregular industrial object. To ensure an independent reference dataset, the corner points of these three buildings were measured using a classical geodetic method—the spatial polar method with a total station. The obtained coordinates served as reference values and were not included in the TLS data processing, thus enabling an objective evaluation of the accuracy of the resulting building footprints. This reference method provided a reliable geometric basis for comparison with footprints derived from point clouds. As part of the processing workflow, a quantitative evaluation of the quality of automatic classification was also performed on the three selected buildings using standard metrics such as Precision, Recall, and F1-score. However, this evaluation is not the primary objective of the study; rather, it serves to create realistic TLS data processing scenarios in which classification errors naturally occur, such as redundant points, noise, or misclassified objects. The resulting classified point clouds represent the input data for subsequent footprint extraction analysis, with emphasis placed on examining the impact of these errors and the possibilities of their elimination using point cloud cleaning methods. This approach enables a comprehensive evaluation of the entire processing workflow and reflects real-world conditions encountered when working with TLS data in urban environments.
The main aim of the article is therefore to systematically investigate the influence of various TLS point cloud cleaning methods on the accuracy of automatic building footprint extraction and to identify processing approaches that ensure robust results even in the presence of realistic errors arising from automatic classification. An additional aim is to verify how individual cleaning methods affect the resulting footprint geometry depending on the type of object and the nature of errors in the data. Existing studies primarily focus on classification accuracy or footprint extraction as separate tasks, while the impact of post-classification point cloud cleaning on geometric accuracy remains insufficiently addressed. This paper addresses this gap by introducing a systematic evaluation framework that links classification errors with their geometric consequences and reveals the critical role of cleaning in determining footprint accuracy. The results of the article contribute to a better understanding of the relationships between individual stages of TLS data processing, particularly between input data quality, data refinement, and the resulting accuracy of geometric outputs. They also provide a basis for optimizing workflows in building footprint extraction within urban environments. The structure of the article is systematically divided into several chapters reflecting the individual phases of the research conducted. The second chapter characterizes the study area and describes its spatial and urban features. The city of Žiar nad Hronom is one of the important industrial cities in Slovakia. The Materials and Methods chapter provides a detailed description of fieldwork, methodological procedures, types of Ground Control Points (GCPs) and Check Points (CPs), as well as the technical parameters of all used surveying instruments and equipment. The subchapters include the measurement of GCPs and CPs for TLS, TLS data acquisition itself, and the measurement of corner points using the spatial polar method, which served as the reference dataset. The fourth chapter focuses on data processing, including TLS data processing, classification, application of point cloud cleaning methods, and subsequent building footprint extraction. The Results chapter presents the findings in three consecutive parts. The first part provides a quantitative evaluation of classification quality, serving as a basis for further analysis. The second part focuses on assessing the impact of classification quality on footprint extraction accuracy. The third part analyzes the influence of different point cloud cleaning methods on the resulting footprint geometry, with the aim of identifying approaches that improve its accuracy. The Discussion interprets the obtained results in a broader context and evaluates their significance in terms of the accuracy and reliability of TLS data processing.

2. Study Area

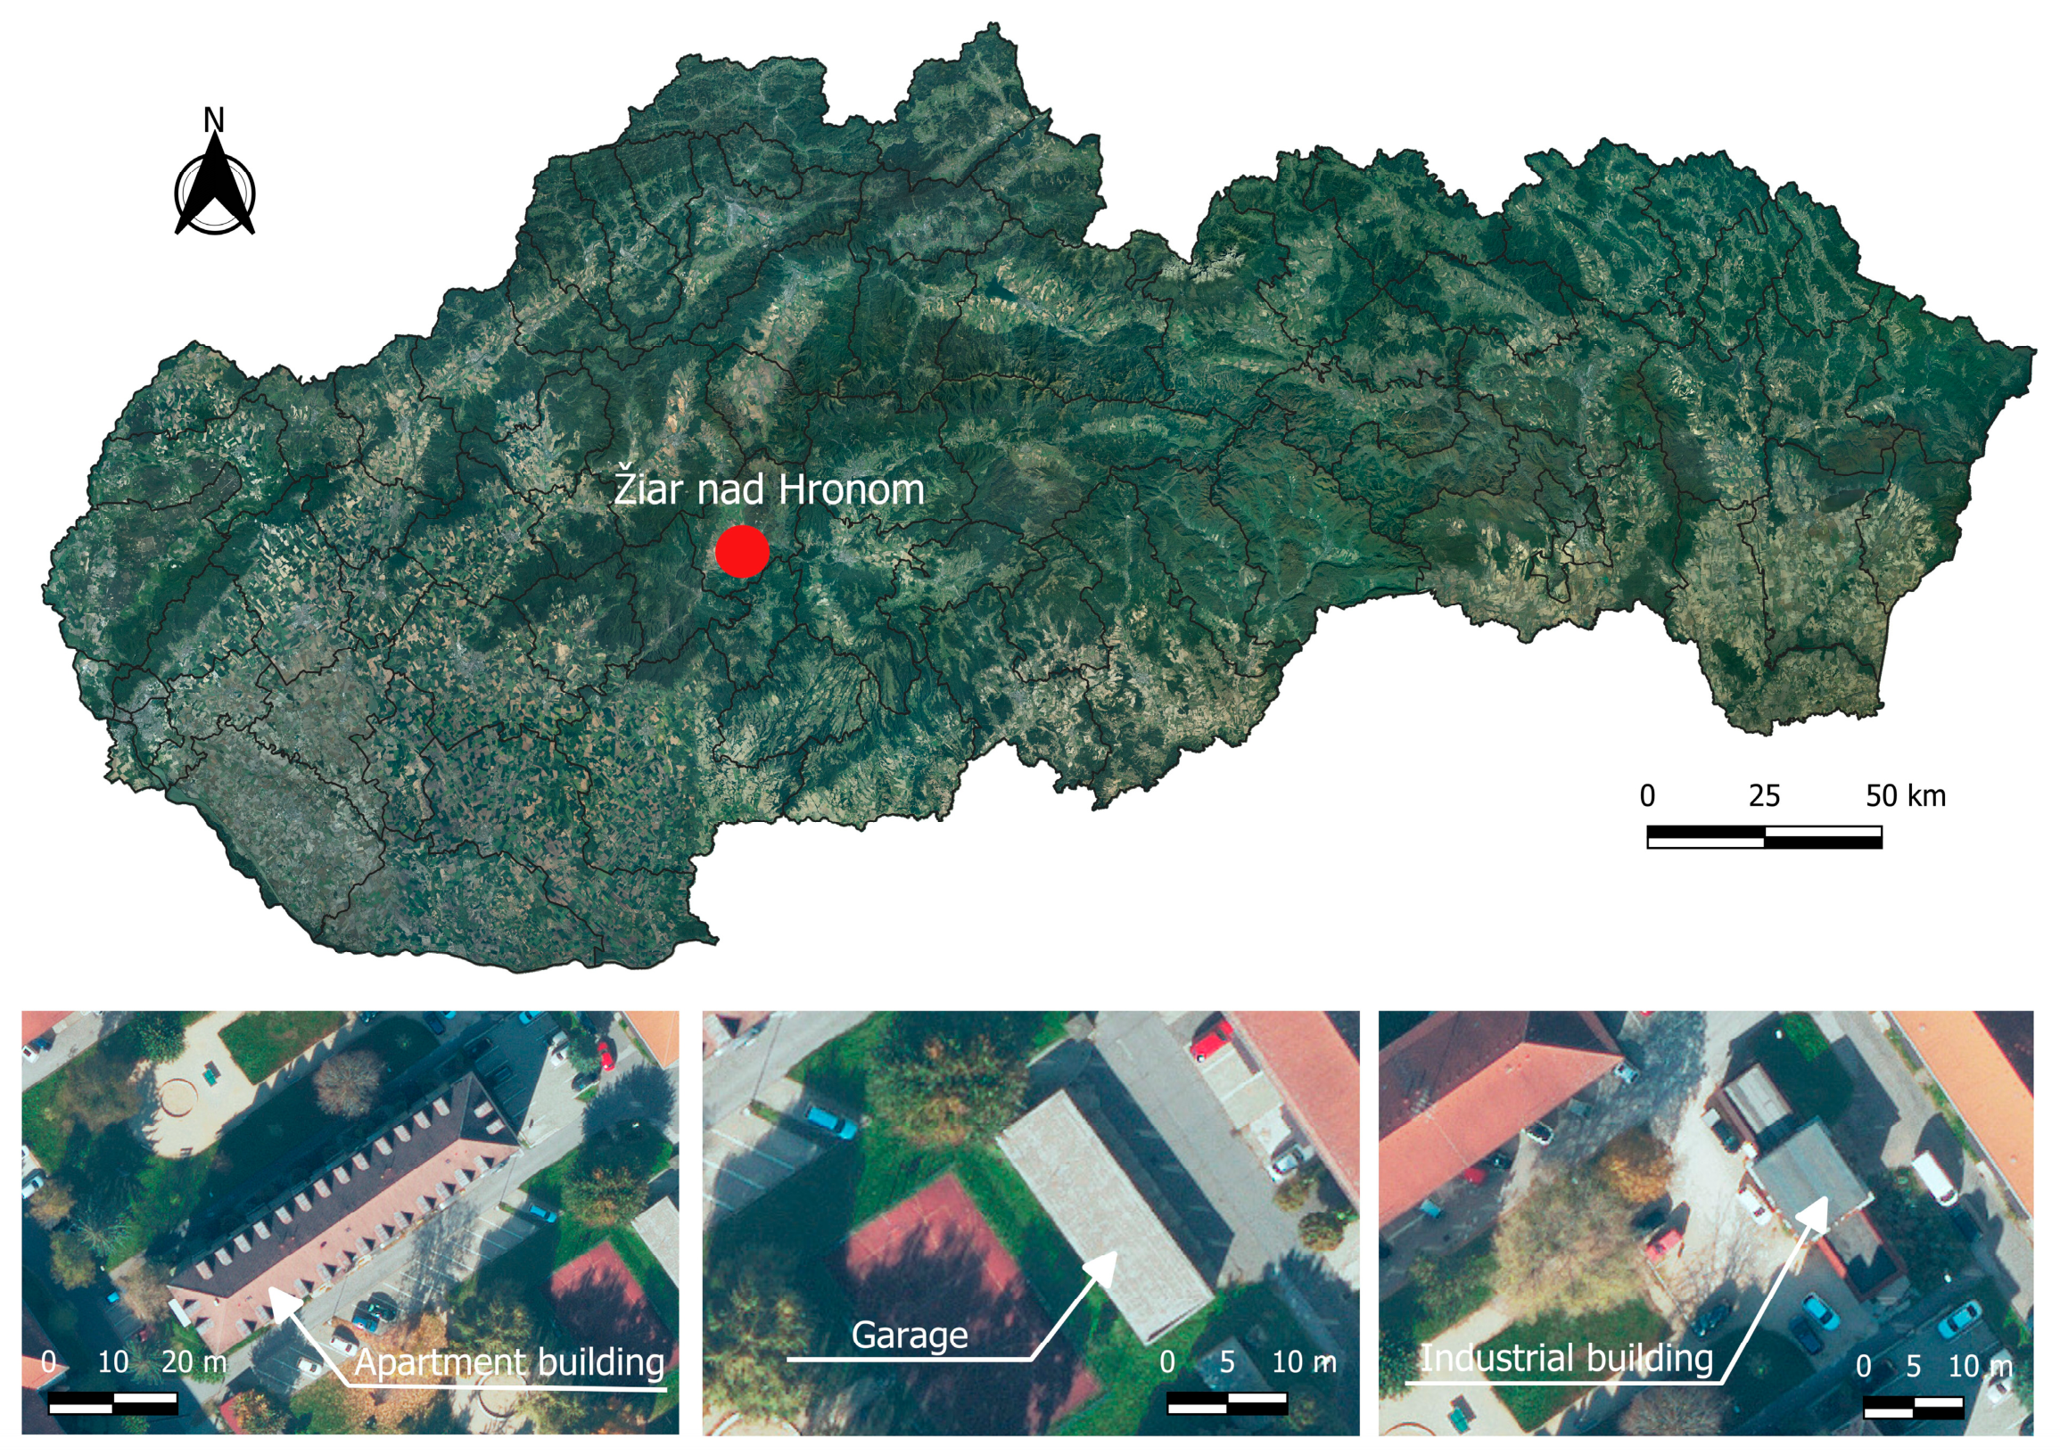
Žiar nad Hronom is a district town in the Banská Bystrica Region in central Slovakia, situated in the valley of the Hron River at the foothills of the Štiavnica Mountains. Žiar nad Hronom lies in a strategically advantageous location between two significant mountain massifs, the Štiavnica Mountains and the Kremnica Mountains [29], which provide suitable conditions for industrial and agricultural activities. The town is located on the main road and railway corridor connecting central Slovakia with Bratislava and Košice. The Hron River, the second longest river in Slovakia, flows through Žiar nad Hronom. The town covers an area of 39.1 km2, lies at an altitude of 272 m above sea level, and has a population of 16,879 inhabitants [30]. The study area consists of a part of the urban built-up area located in the center of Žiar nad Hronom.
The total area of the selected locality is 2.8 ha and includes approximately six buildings. Analyzed locality contains a heterogeneous urban structure consisting of residential, industrial, and auxiliary buildings, paved surfaces, vegetation elements, parked vehicles, and partial visual obstructions affecting TLS acquisition. Such conditions create realistic classification errors and geometric disturbances commonly encountered in automated building footprint extraction workflows. Three buildings were selected through purposive typological sampling rather than random sampling, with the objective of covering distinct geometric and error-related conditions relevant for footprint extraction (Figure 1). The selected objects represent: (1) a simple regular structure with low geometric complexity (garage), (2) a residential structure with articulated façade elements and nearby vegetation (apartment building), and (3) an irregular industrial structure with multiple breakpoints and locally fragmented geometry (industrial building).
The garage represents the simplest case, characterized by a regular rectangular footprint with an area of approximately 143 m2, a perimeter of 56 m, and four corner points. In contrast, the apartment building represents the most geometrically complex object, with a footprint area of approximately 706 m2 and a perimeter of 137 m. Although the reference geometry contains four principal corner points, the presence of balconies, façade articulations, and surrounding vegetation creates locally irregular point cloud structures and increased sensitivity to classification errors. The industrial building represents an intermediate but geometrically irregular case, with an area of approximately 148 m2, a perimeter of 66 m, and twelve corner points reflecting its segmented footprint geometry.

3. Materials and Methods

The aim of this study is to map and document the urban built-up area in the center of Žiar nad Hronom using the non-contact TLS method in order to determine building footprints based on point cloud classification. In this method, GCPs and CPs were used for georeferencing the point cloud, and their coordinates were determined using the Global Navigation Satellite System (GNSS) method. Fieldwork in the study area was carried out according to the following procedure:
  • Terrain reconnaissance and determination of the study area.
  • Location and determination of the coordinates of the GCPs and CPs for TLS.
  • Measurement using the TLS method.
  • Measurement of corner points of three selected buildings using the spatial polar method.
The objective of these measurements was to capture the current state of the town center of Žiar nad Hronom in detail. To achieve this goal, appropriate surveying instruments, tools, and equipment were used. For the TLS method, the terrestrial laser scanner Leica RTC360 was employed. The coordinates of the GCPs and CPs for TLS were measured using the dual-frequency GNSS Leica GS07 (Leica Geosystems AG, Heerbrugg, Switzerland). The coordinates of the corner points of the three selected buildings were measured using the total station Leica Viva TS15 I (Leica Geosystems AG, Heerbrugg, Switzerland).

3.1. Surveying of GCPs and CPs for TLS

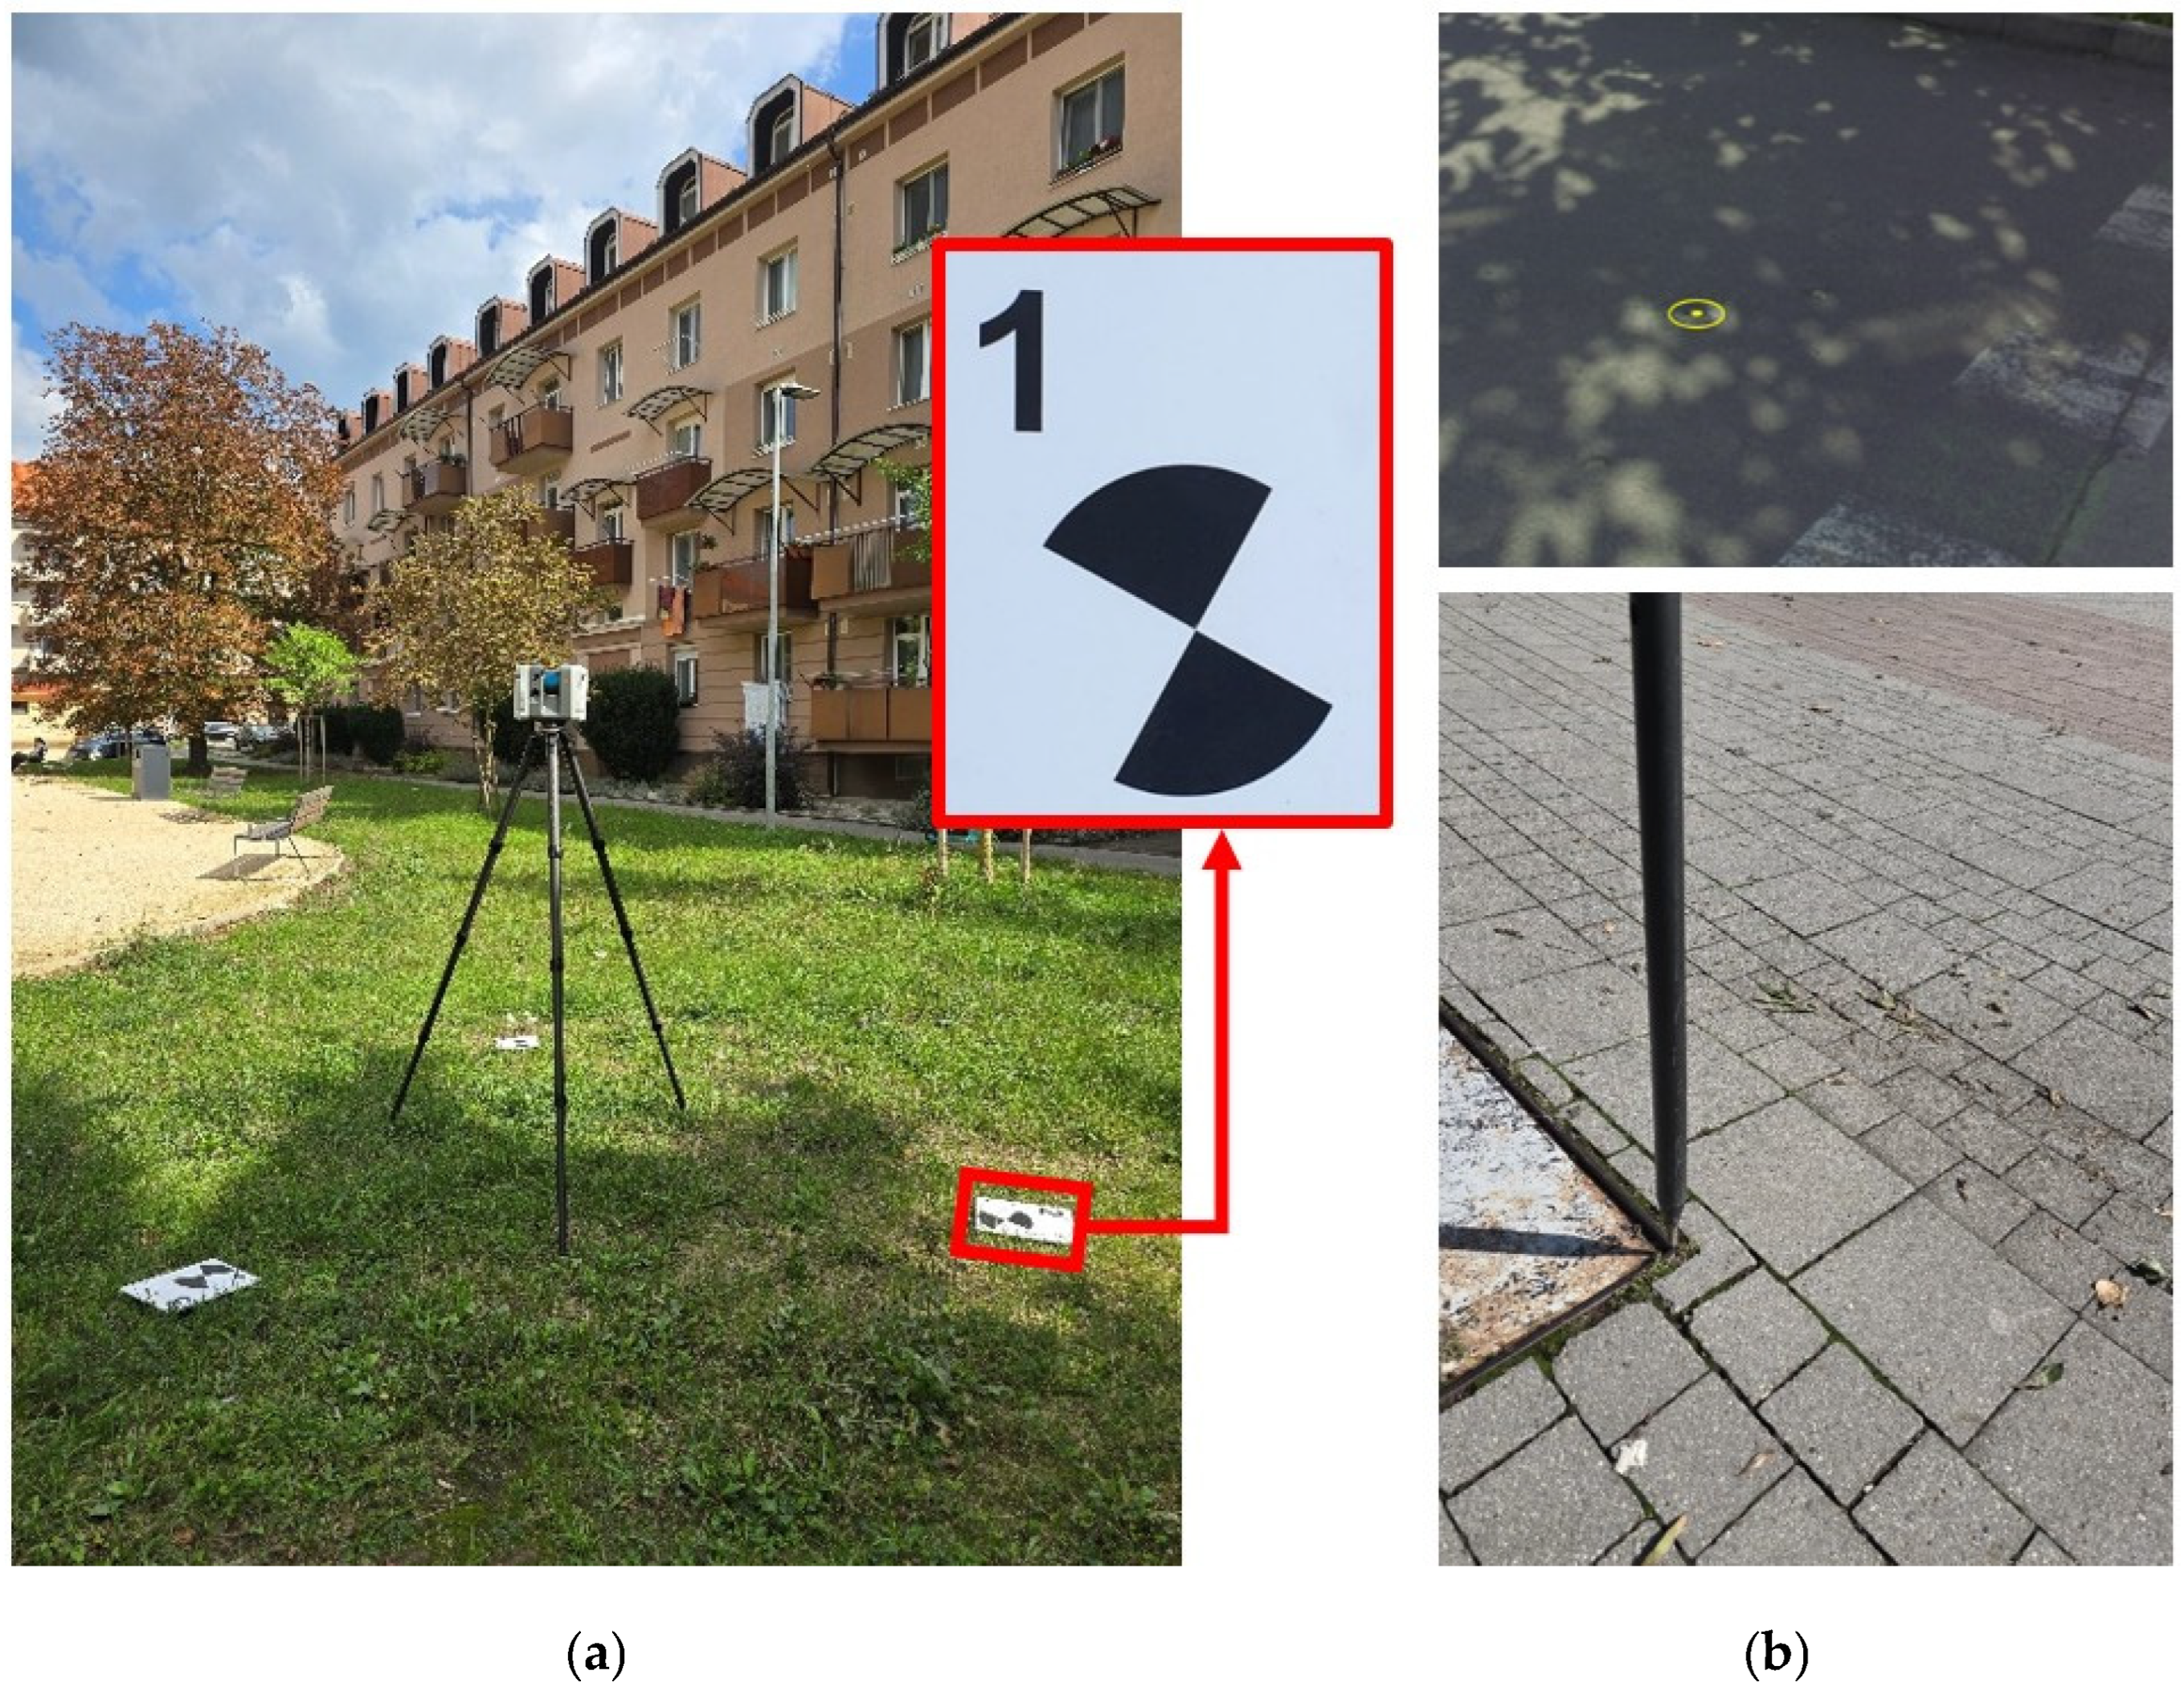
GCPs for TLS monitoring of the town center of Žiar nad Hronom were temporarily stabilized using black-and-white circular scanning targets (Figure 2a). At every second station, three GCPs for TLS were placed around the laser scanner, subsequently scanned, and used to link the TLS measurements to a common coordinate system. In total, 86 scanning targets were used during the TLS monitoring of the town center. Manholes, valves, drainage channels, and curbstones were selected as CPs (Figure 2b), with a total of 68 points.
The GCPs and CPs were determined using the rapid static method with the GNSS set Leica GS07, using the NRTK (Network Real Time Kinematic) corrections, connected to the Leica SmartNet service. The coordinates were determined in real time using the GNSS RTK method. The integer phase ambiguities were resolved as a fixed solution. The observation time at each point was 5 s. All GNSS measurements were transformed into the national positional coordinate system Datum of Uniform Trigonometric Cadastral Network (S-JTSK). The measured heights of the points were transformed into the height system Baltic Vertical Datum after adjustment using the digital height reference model DVRM. The estimated accuracy of the determined GCPs and CPs coordinates was 0.02 m in position and 0.04 m in height. The GNSS set Leica GS07 is a lightweight and compact instrument from Leica Geosystems, consisting of a SmartAntenna, a Leica CS20 controller, and a telescopic pole. Thanks to adaptive satellite selection “On the Fly,” it can continuously maintain RTK reliability of up to 99.95%, ensuring excellent results. The SmartTrack function supports and tracks signals from GPS, GLONASS, BeiDou, Galileo, QZSS, and other systems. All additional technical specifications of this device are listed in Table 1.

3.2. Measurement by TLS Method

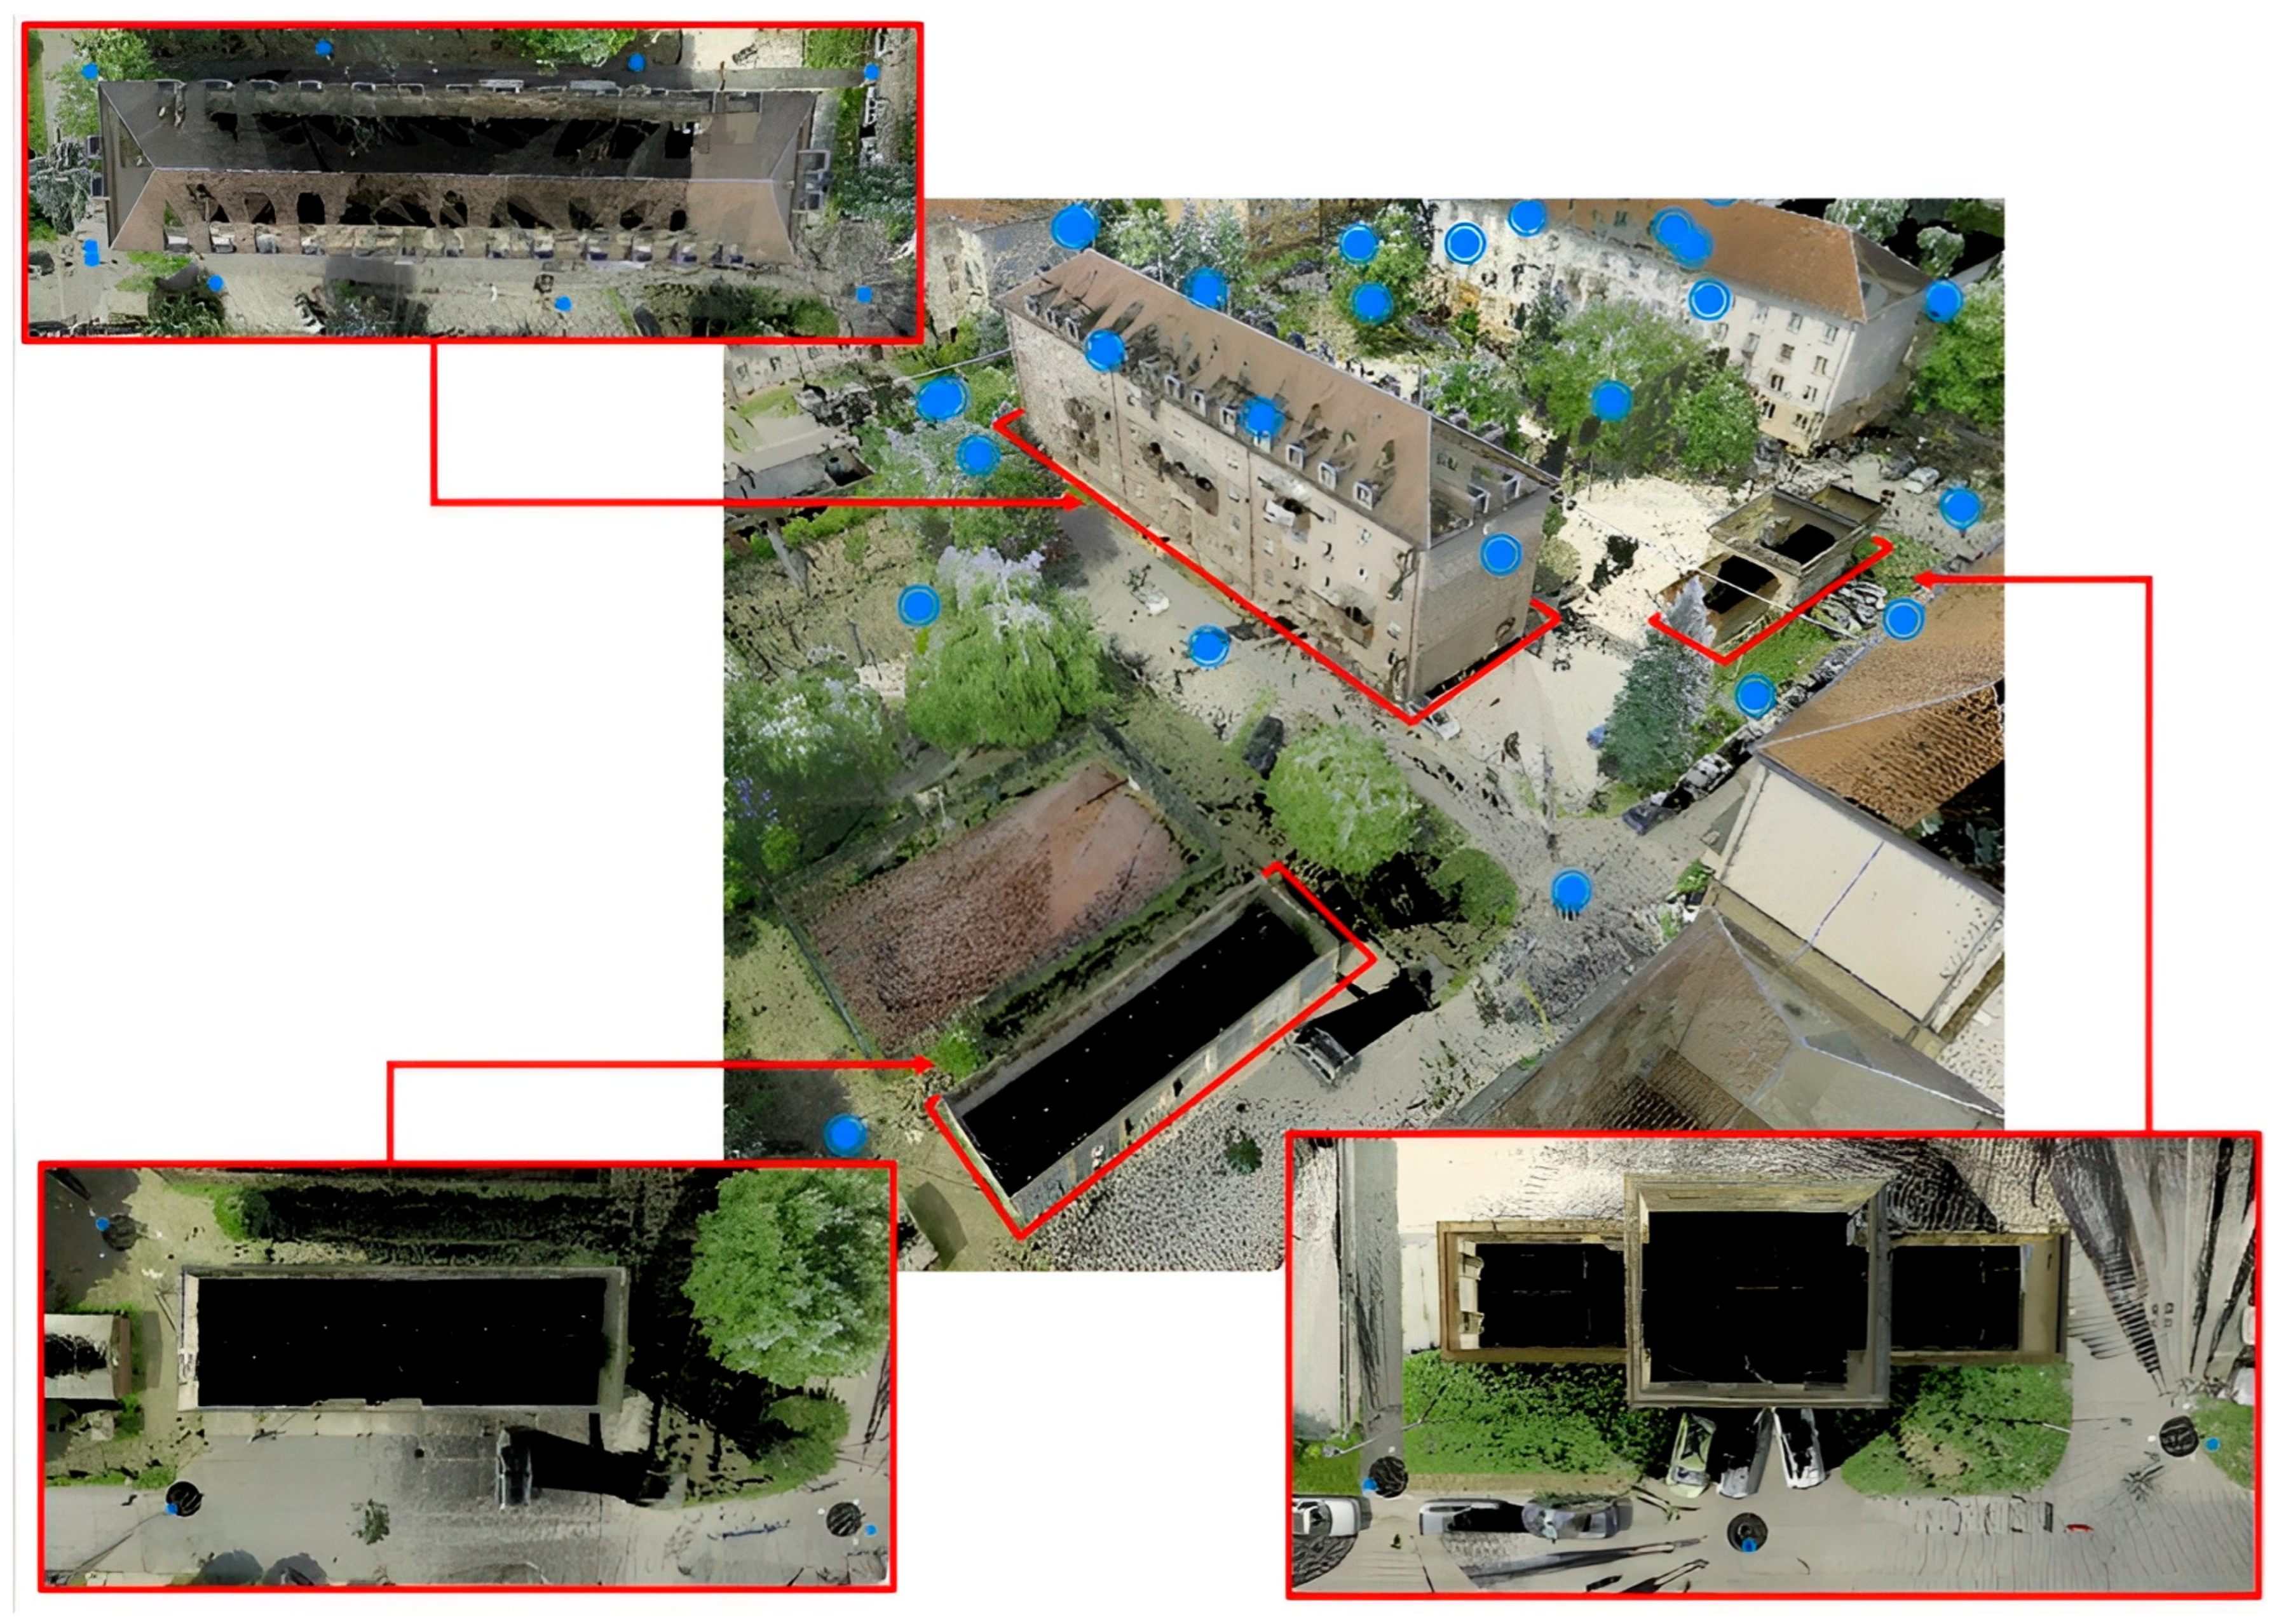
For the TLS method, the laser scanner Leica RTC360 was used. This scanner is a mobile, automated, and efficient 3D laser scanner with a range of up to 130 m. A significant advancement of this technology is the automatic point cloud registration in the field using VIS technology, which reduces processing time and enables double scanning, automatically removing moving objects. All technical parameters are presented in Table 2. TLS measurements were carried out from 66 stations (Figure 3) over approximately 5 h. At each station, three temporary black-and-white circular scanning targets were scanned separately, serving as GCPs for the TLS method. The scanning resolution was set to 6 mm/10 m with a range of 130 m. The apartment building was scanned from 9 stations, while the garage and the industrial building were each scanned from 3 stations.

3.3. Measurement of Corner Points Using the Spatial Polar Method

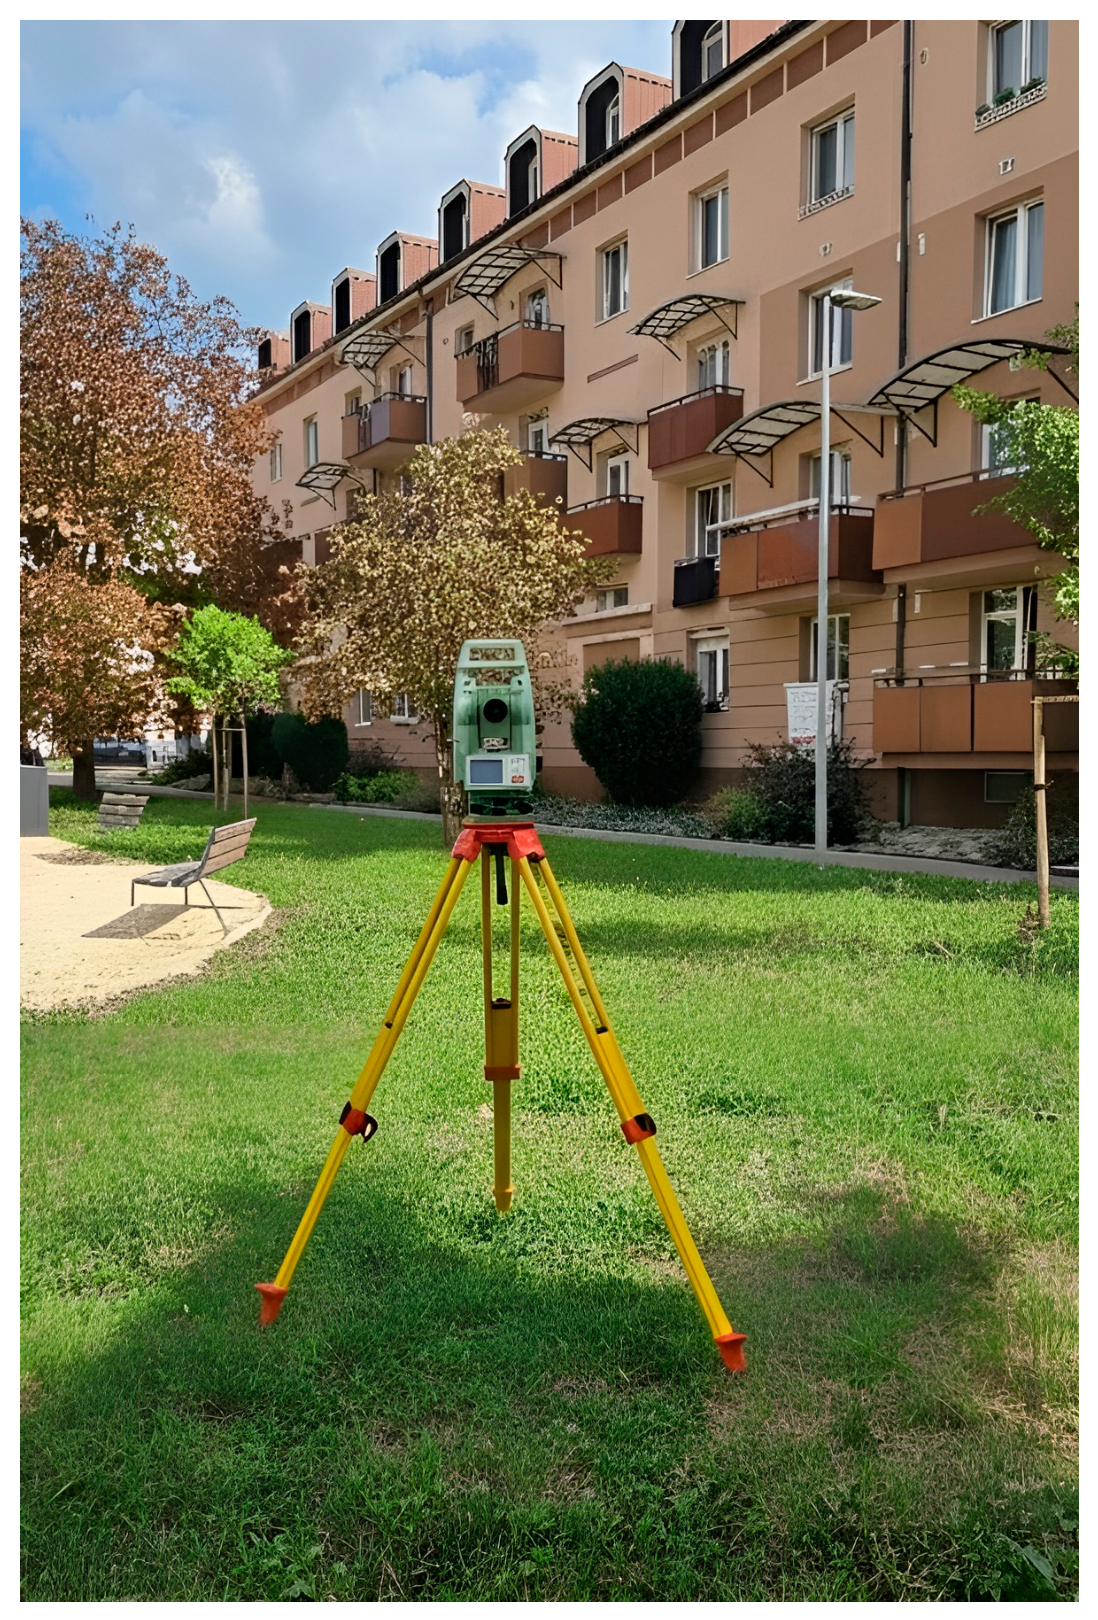
For the purpose of establishing reference data to assess the accuracy of TLS data, corner points on three selected buildings (apartment building, garage, and industrial building) were surveyed using the spatial polar method. After determining the extent of the study area and conducting field reconnaissance, 13 temporarily stabilized auxiliary survey points were established. These auxiliary points were stabilized using survey nails and measured with GNSS set Leica GS07 using the RTK method with connection to the Slovak Real-time Positioning Service (SKPOS), which is part of the active geodetic control network. The achieved coordinate accuracy of the auxiliary points was 0.02 m in planimetry and 0.04 m in height. The auxiliary survey points served to connect terrestrial measurements to the standard reference systems used in the Slovak Republic: Datum of Uniform Trigonometric Cadastral Network (S-JTSK) and Baltic Vertical Datum—after adjustment (Bpv). These points subsequently served as orientation points for the computation of free stations. Each free station was determined based on at least three auxiliary survey points, ensuring geometric stability and redundancy of observations. Thanks to the applied measurement methodology, very high accuracies were achieved, with the resulting free stations exhibiting a mean positional accuracy of up to 3 mm and a mean vertical accuracy of up to 5 mm. The free stations determined in this way provided a reliable basis for subsequent detailed geodetic measurements within the study area. After centering and leveling the total station Leica Viva TS15 I (Figure 4) and computing the free station, the corner points were measured with a prismless measurement using total station in two faces of telescope with three repetitions to increase the measurement accuracy. The corner points were surveyed at clearly identifiable locations on the perimeter structures of the buildings, especially at building corners and at points where the facade direction changes. The corner points of the buildings were surveyed using a total station at the level of their heel, at the point where the structure meets the ground. The measurements were carried out at the lower part of the structure in order to ensure a clear definition of the planimetric position of the objects without the influence of overhanging above-ground structures. Emphasis was placed on point stability and clear definability in the field to ensure their reliable identification during the subsequent comparison of building footprints. The technical parameters of the Leica Viva TS15 are listed in Table 3. The coordinates of the corner points obtained in this way represent independent reference data used for calculating the accuracy of the resulting building footprints.

4. Processing of Measured Data

Data acquired using TLS were processed in Leica Cyclone REGISTER 360. Data classification was performed in Trimble RealWorks 2026.10, Leica Cyclone 3DR v. 2026.00 and LiDAR360 V9.1 software. After completing the measurements and data processing (registration, filtering, and classification), it is essential to quantify the geometric accuracy of the resulting model. The accuracy of measurements carried out using the TLS method can be objectively assessed through independent reference measurements that were not included in the registration process or in any further point cloud processing. The term accuracy is generally used as an indicator of the quality of the acquired spatial data and the resulting model. This accuracy can be quantified, for example, using Root Mean Square Error (RMSE). This value expresses the difference between the coordinates of points obtained from TLS data processing and the reference coordinates of the same points determined by independent field measurements. In the evaluation of the final 3D model, RMSE characterizes the magnitude of deviations between the positions of points generated by the software and their true positions in the reference coordinate system. RMSE for the individual coordinates x, y, and z is defined as follows [35]:
R M S E x = i = 1 n x o i x m i 2 n
R M S E y = i = 1 n y o i y m i 2 n
R M S E z = i = 1 n z o i z m i 2 n
where x o i , y o i , z o i are the coordinates of the i-th point estimated from the model, x m i , y m i , z m i are the coordinates of the i-th point measured in the field, and n is the number of points for which RMSE is calculated. Equivalently, for the overall RMSE, the following applies:
R M S E = R M S E x 2 + R M S E y 2 + R M S E z 2

4.1. TLS Data Processing

Using the laser scanner Leica RTC360, the town center within the study area in Žiar nad Hronom was scanned from 66 stations. The acquired data were processed in Leica Cyclone REGISTER 360. Point clouds from individual stations were mutually registered and georeferenced based on 86 GCPs. The resulting dense point cloud consisted of 1,511,379,486 points. The average RMSE according to Equation (4) reached an accuracy of 0.016 m, the Bundle error accuracy was 0.009 m, and the Cloud-to-Cloud value was 0.009 m. The overall overlap of the point clouds was 40%, and the strength of the resulting point cloud reached 78%. Additional parameters of the final point cloud obtained using the TLS method are presented in Table 4.

4.2. Classification of Spatial Data

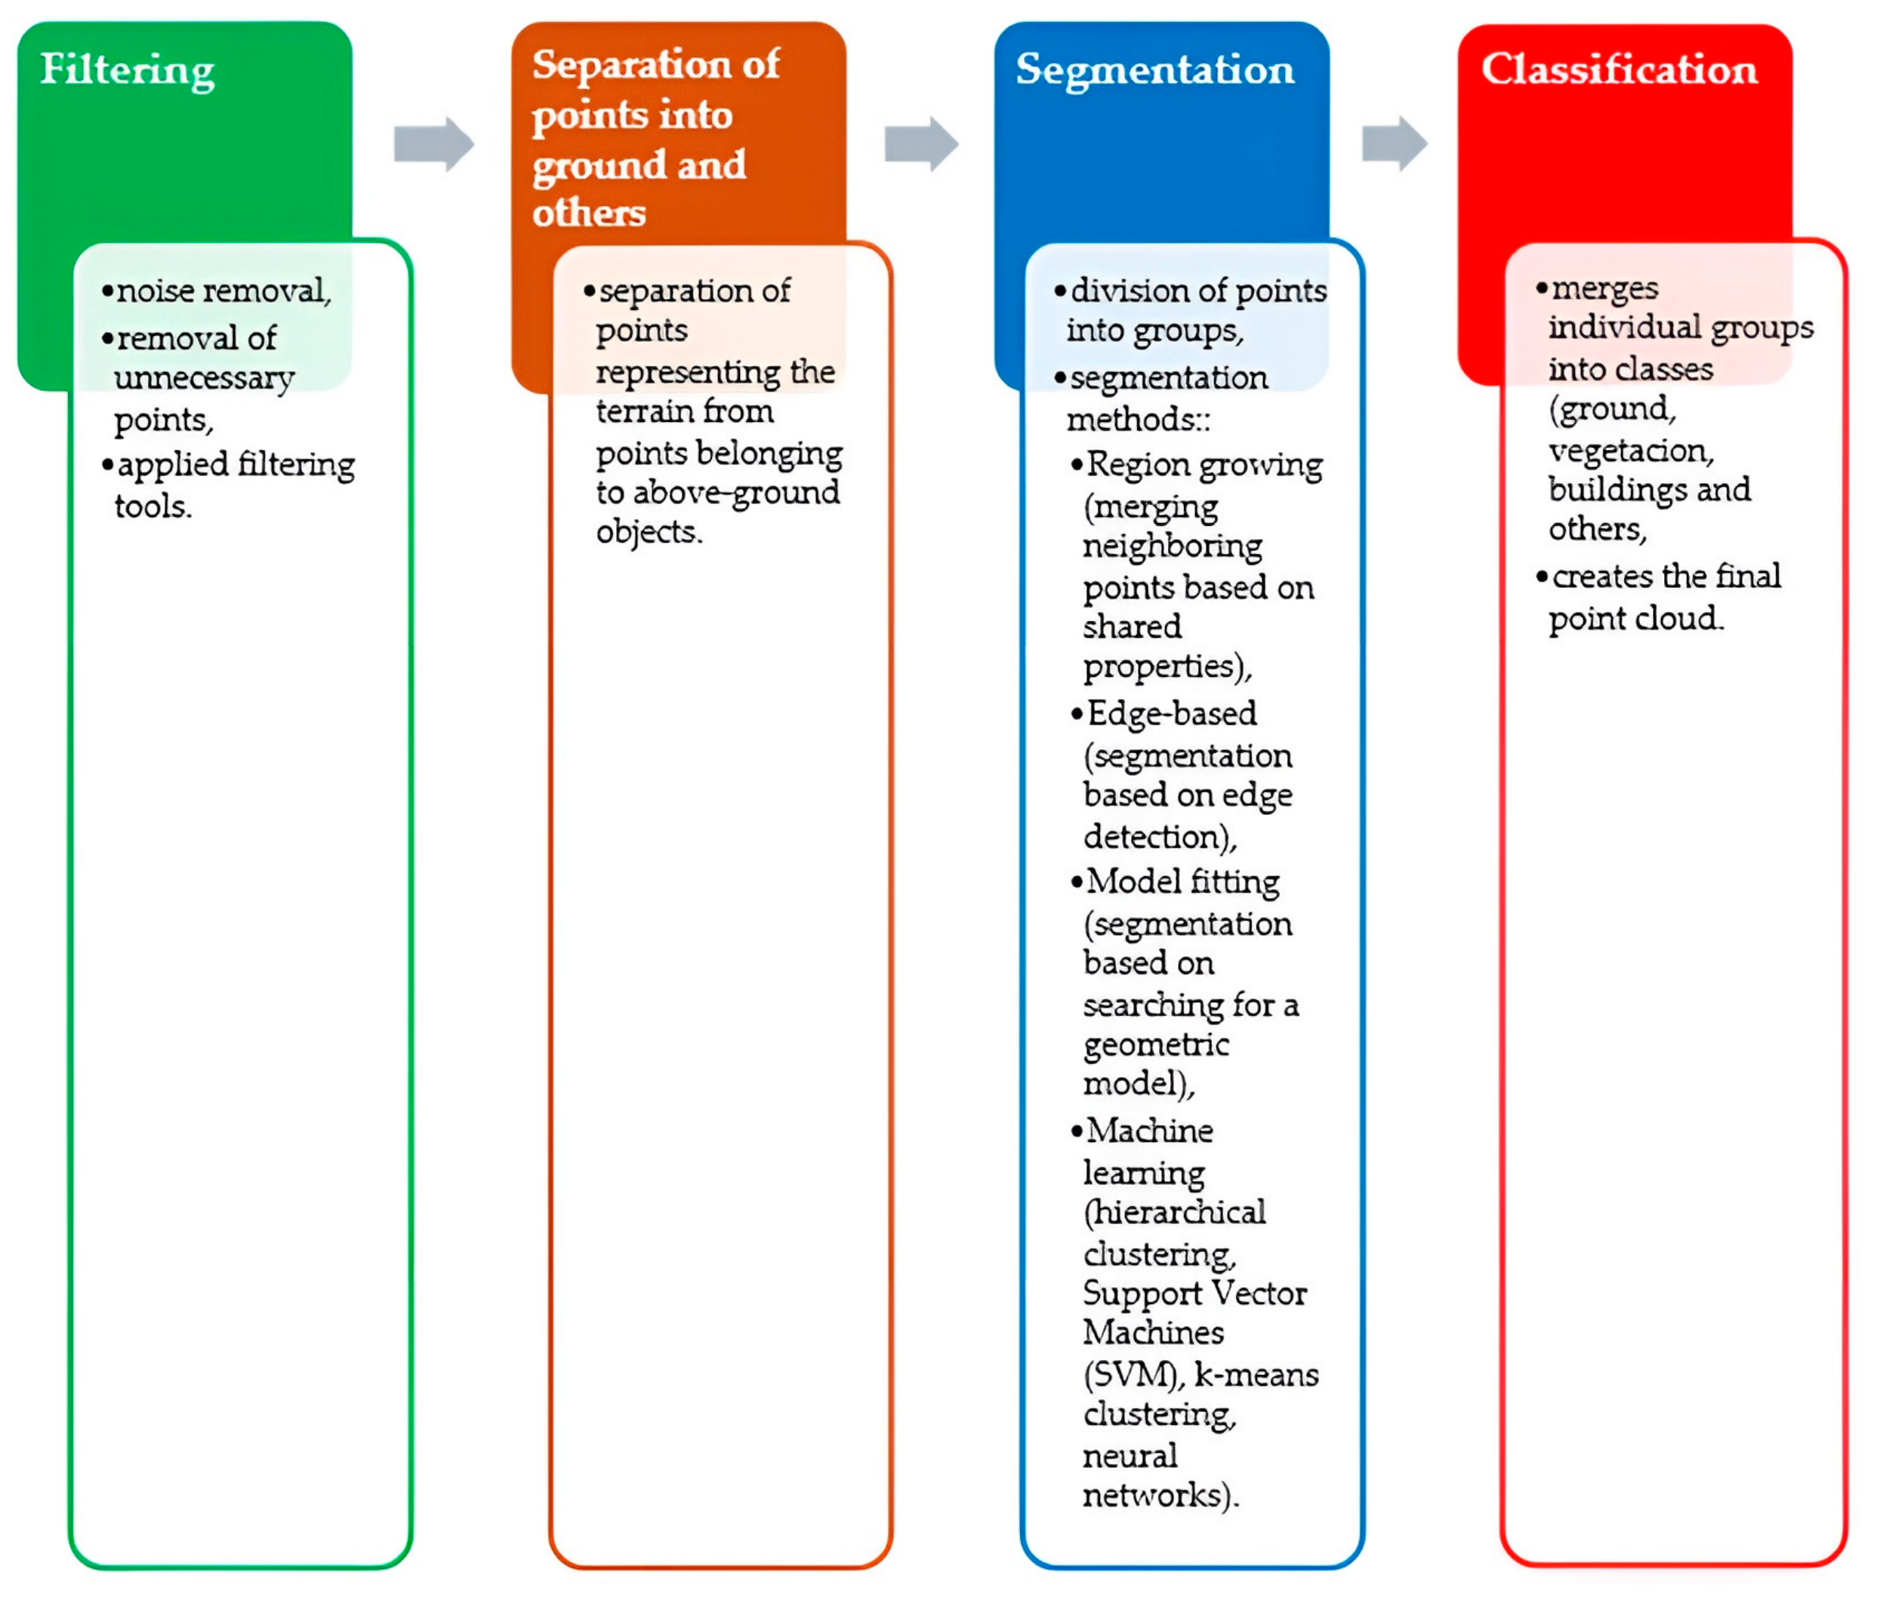
The acquired dense point clouds undergo the basic phases of the classification process during data processing (Figure 5), which transform the spatial data into their final form. At the beginning, the raw data passes through a filtering stage, where filtering tools are used to remove noise and unnecessary points. The main and most essential phase of the process is segmentation, which applies methods designed to divide points into groups. In many software environments, machine learning algorithms are frequently used for data classification. After dividing the points into groups, the process continues with merging them into different classes. This represents the final phase of classification, resulting in the creation of classification classes. This process is essential for further analysis, as it improves the quality of results, enables a better understanding of terrain structure and properties, removes unwanted points, and minimizes errors. Data classification can be performed using various methods, each based on a different algorithm. These methods are often combined to achieve higher accuracy and efficiency. Classification primarily serves to enhance the quality of acquired data, optimize processing time, accelerate the achievement of desired results, and support effective decision-making. However, this process also has its limitations, particularly its dependence on the quality and accuracy of input data, high computational requirements, and the potential occurrence of partial errors that may affect the final outcome of the analysis [36,37].
Accurate and reliable evaluation of classification outputs is essential for the objective assessment of the effectiveness of the proposed methods. The quantitative evaluation of classification results is based on standard metrics: Precision, Recall, and F-score. These metrics provide a comprehensive view of the performance of classification algorithms and enable the comparison of various approaches [38,39]. Precision represents the proportion of correctly classified positive examples out of the total predicted positive cases. It is calculated using the formula:
P r e c i s i o n = T P T P + F P
where TP denotes the number of true positives in the extracted results, and FP represents the number of false positives in the extracted results. Recall measures the classifier’s ability to identify all relevant positive cases. It is defined by the formula:
R e c a l l = T P T P + F N
where FN denotes the number of false negatives in the ground truth. The F-score is the harmonic mean of Precision and Recall, providing a balanced performance metric for classification. This indicator enables an effective comparison of different classification methods and helps identify the optimal solution for a given problem. It is defined as:
F s c o r e = 2 · P r e c i s i o n   ·   R e c a l l P r e c i s i o n + R e c a l l
When analyzing results, it is crucial to assess the values of all three metrics together. High Precision may indicate a low number of false positive cases, while high Recall demonstrates the classifier’s ability to correctly identify most relevant cases. The F-score evaluates the trade-off between these two metrics and provides a comprehensive view of the model’s performance.

4.3. Point Cloud Cleaning and Building Footprint Extraction Methodology

In the context of point cloud processing, it is necessary to distinguish between filtering applied in the initial stages of processing and data cleaning performed after classification. While in the early stages of TLS data processing, filtering methods are primarily used to remove measurement noise and random outliers, this article focuses on cleaning the point cloud after classification. In this case, cleaning does not represent only standard noise suppression but is specifically aimed at eliminating erroneous points resulting from misclassification, such as points representing vegetation, small objects, or isolated elements incorrectly assigned to the “building” class. These points constitute a significant source of errors in subsequent footprint extraction, as they may lead to geometric distortion, area overestimation, or the creation of unwanted polygonal artifacts.
This approach reflects real-world processing scenarios, where classification errors cannot be completely eliminated and must be addressed in subsequent processing steps. To capture variability in such classification-induced errors, each of the three selected building typologies was processed using three independent classification software environments, generating nine input classification scenarios with differing error characteristics. The classification in all software environments was performed using fully automatic workflows without manual parameter tuning. This reflects current practice in modern classification tools, which are often based on advanced algorithms, including machine learning and deep learning approaches. The aim was not to optimize classification performance, but to generate representative input scenarios with varying classification quality. This strategy also helps mitigate software-specific (“black-box”) bias by incorporating multiple independent classification outputs into the analysis.
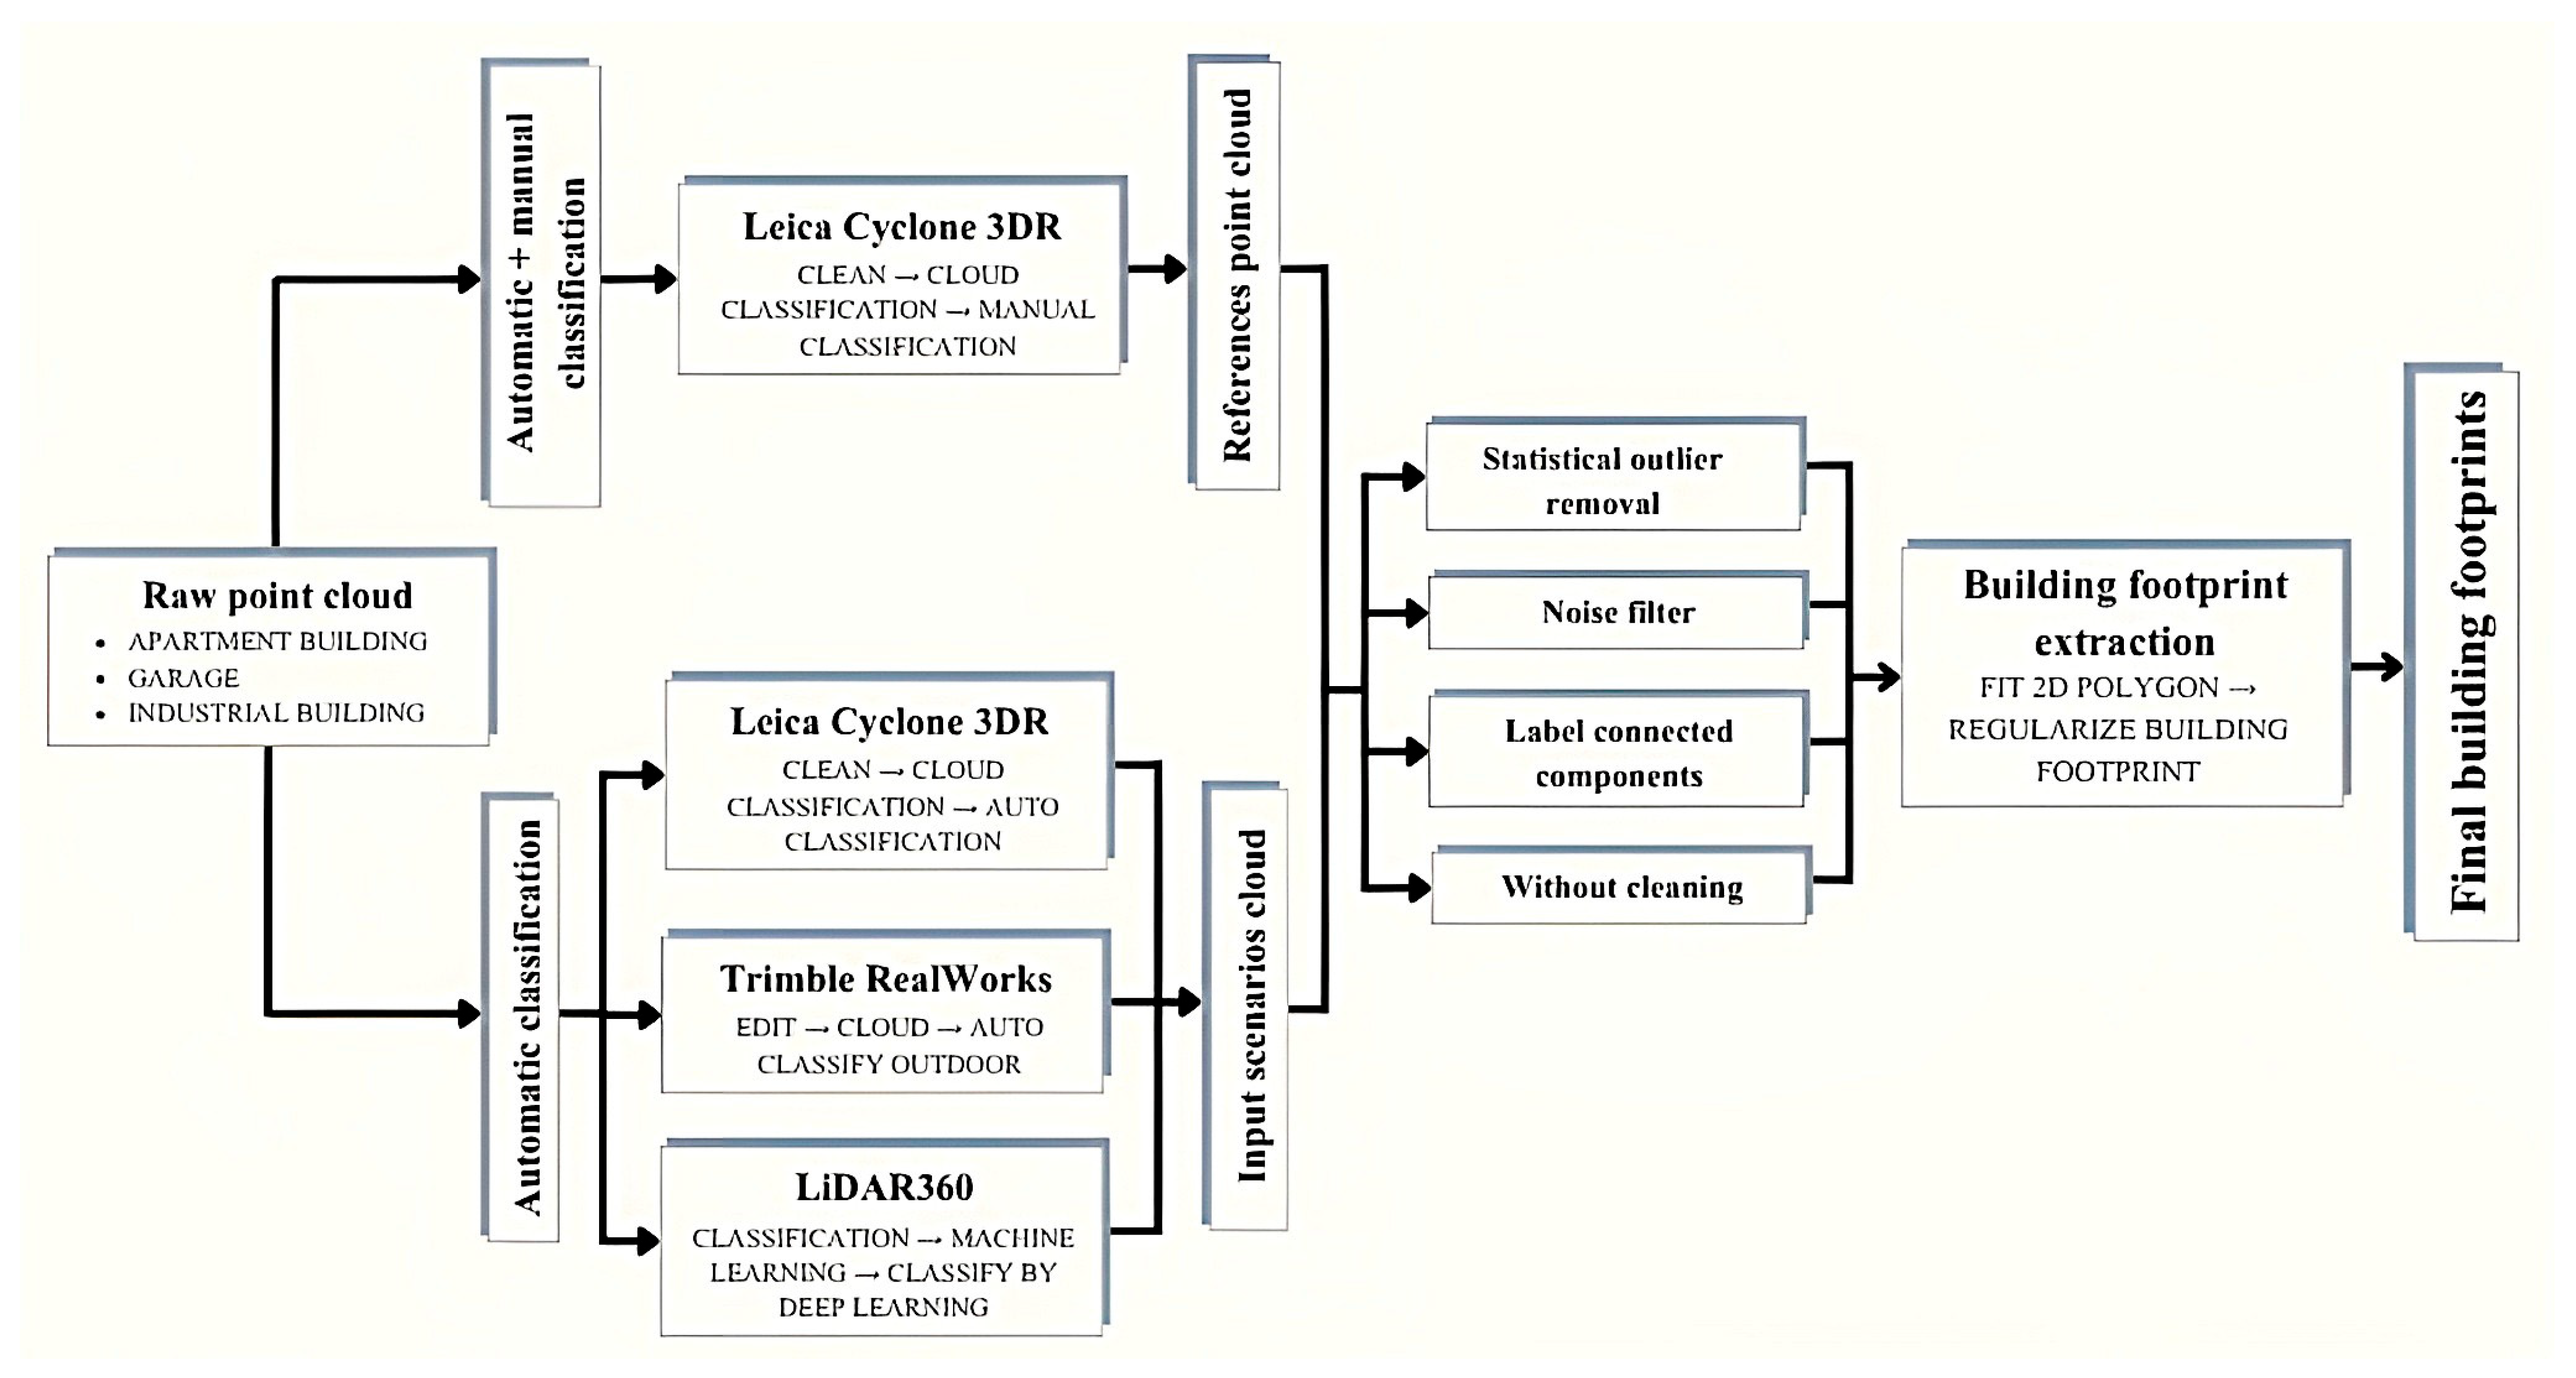
To ensure transparency and reproducibility, the subsequent processing workflow was formalized as a sequence of defined steps: (1) input data preparation, (2) point cloud cleaning, (3) footprint extraction, (4) optional geometric regularization, and (5) quantitative evaluation. The overall workflow is illustrated in Figure 6, which provides a structured overview of the processing chain, including the generation of input scenarios, parallel application of cleaning methods, and comparison with a baseline case without cleaning.
As shown in Figure 6, the raw point cloud data representing different building typologies (apartment building, garage, industrial building) were first processed using independent classification workflows in three software environments. In addition, a reference dataset including manually refined classification was created to serve as a benchmark. The resulting classified point clouds form a set of input scenarios with varying levels and types of classification errors. These scenarios are subsequently processed in parallel using different cleaning strategies, including statistical outlier filtering, noise filtering, and segmentation based on connected components, as well as a control branch without any cleaning. This experimental design enables direct comparison of the influence of individual cleaning methods against the baseline case and across different classification conditions. The selected cleaning methods were intentionally chosen as representative and commonly used approaches in TLS processing. In this study, these established and reproducible procedures are evaluated in a post-classification context, with the aim of assessing their potential for removing classification-induced errors and improving footprint delineation. Specifically, the following approaches are considered:
  • Statistical outlier filtering, which identifies and removes points with anomalous distances relative to neighboring points [40],
  • Noise filtering based on local point cloud characteristics, aimed at eliminating isolated or sparsely distributed points [41],
  • Segmentation based on connected components, which enables the identification and removal of smaller isolated clusters of points not belonging to the main object [42].
Each cleaning method is controlled by a set of parameters (e.g., number of neighbors, standard deviation threshold, search radius, minimum component size). Rather than relying on a single empirically selected configuration, parameter ranges were systematically explored based on literature and preliminary testing (e.g., 20–60 neighbors, 0.5–2.0 standard deviation, radius 0.1–0.5 m). This enables the assessment of method robustness under realistic parameter variations. Although a full sensitivity analysis was not performed, the influence of parameter selection was evaluated by comparing results across multiple parameter configurations, with the stability of geometric outputs (area, perimeter, centroid position, and vertex count) serving as an indicator of robustness.
The building footprint extraction itself was performed from the processed point clouds using the Fit 2D polygon tool in the CloudCompare [43], which allows approximation of the object footprint based on the projection of points onto a plane. This step was applied identically to all datasets, including the baseline without cleaning, ensuring that differences in results primarily reflect the quality of the input point clouds. Subsequently, the resulting polygons were refined and geometrically regularized using the Regularize Building Footprint tool in ArcGIS Pro 3.4. [44], ensuring geometry simplification and preservation of orthogonal relationships between edges. Since such assumptions may not be valid for all building types, this step was treated as optional and its influence was explicitly evaluated. Geometric metrics were compared before and after regularization to verify that the process did not introduce significant deformation or artificially improve results. The analysis showed that regularization did not degrade accuracy and only introduced minor adjustments without substantially altering footprint geometry. Therefore, it is considered a supportive, non-mandatory post-processing step, and the methodology allows the impact of point cloud cleaning to be assessed independently of geometric regularization.
The final evaluation was performed using geometric accuracy metrics (area, perimeter, centroid position, and Hausdorff distance) against reference data. The proposed methodology is not intended to identify a single optimal parameter configuration, but rather to provide a robust and reproducible framework for evaluating the impact of point cloud cleaning on building footprint extraction under realistic processing conditions.

5. Results

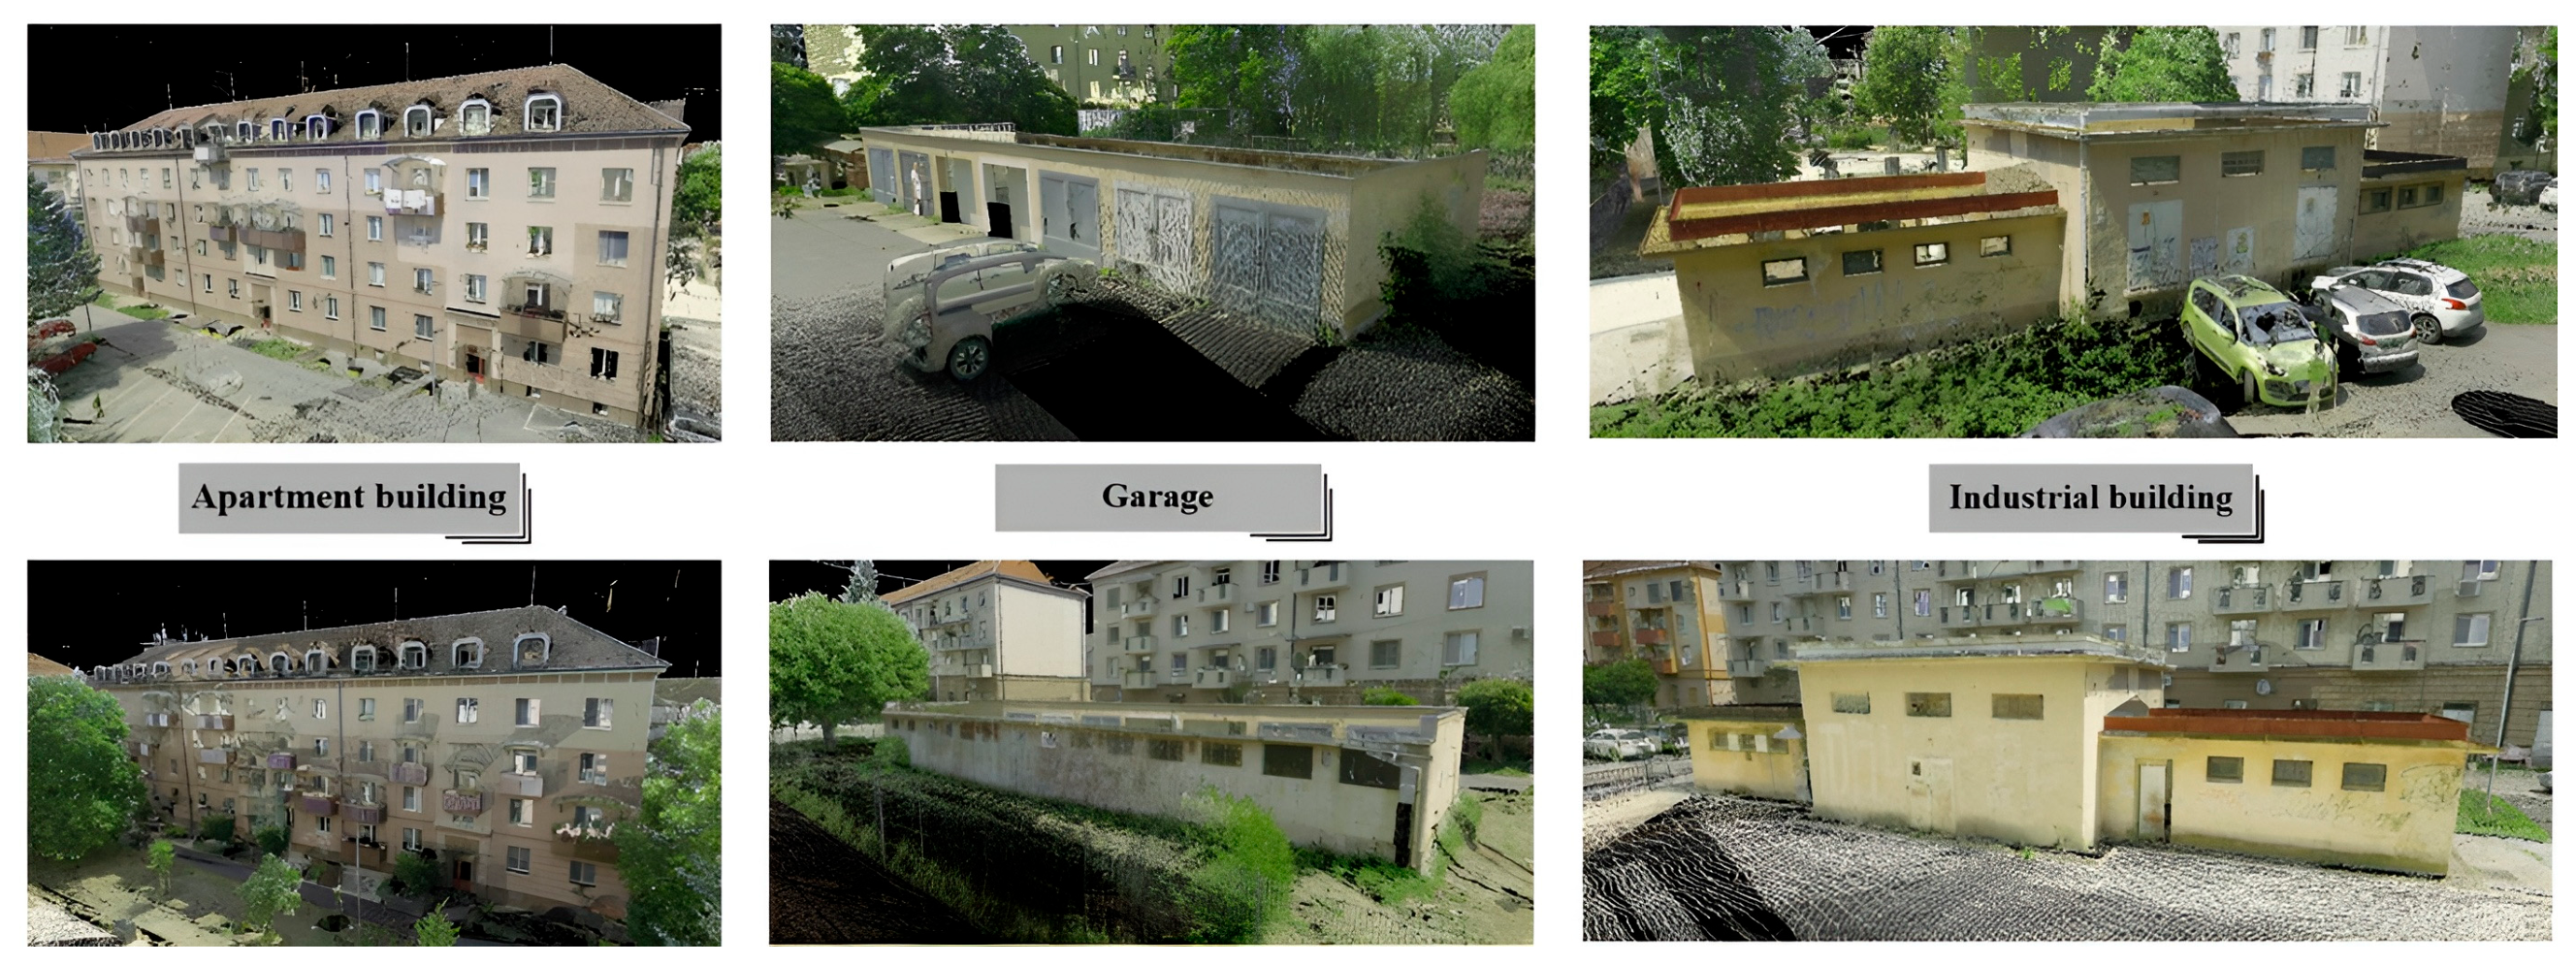
Based on the final data obtained using the spatial polar method and the TLS method, it was possible to perform analyses involving the comparison of building footprints derived from classification. Before the comparison itself, the TLS data were processed into a form in which unwanted and redundant points were filtered out from each point cloud. For segmentation, processing, filtering, visualization, and comparison, the software Leica Cyclone 3DR, Trimble RealWorks 2026.10, and CloudCompare 2.13 were used. After processing the TLS data, dense point clouds of the three selected buildings (Figure 7) were generated in Leica Cyclone REGISTER 360, which were subsequently used for further comparisons and analyses. For the apartment building, the resulting dense point cloud contained 38,854,364 points. The garage point cloud consisted of 2,422,442 points, and the industrial building contained 4,670,562 points.

5.1. Quantitative Evaluation of Classification Results

For the three analyzed buildings, manual point cloud classification was first performed, serving as a reference layer for the subsequent evaluation of the reliability of automatic classification carried out in the software tools Leica Cyclone 3DR, Trimble RealWorks, and LiDAR360. These manually classified points represent the reference GT (ground truth) data against which the results of individual software solutions are compared. Table 5 presents the number of points belonging to the Building class for each building type after applying the respective classification methods. The comparison shows that the individual software tools exhibit differences in the number of classified points, as well as in their relative change expressed in percentages, indicating variability in the results of automatic classification among the applied tools.
In the first phase of the experiment, the accuracy of automatic classification of building points derived from TLS data was analyzed. The reference classification was created through manual interpretation of the point cloud and served as the basis for quantitative evaluation of the results from individual software solutions. Classification accuracy was assessed using the metrics Precision, Recall, and F1-score, which take into account the number of correctly classified points (TP), incorrectly classified points (FP), and building points that remained unidentified (FN). It should be emphasized that the aim of this analysis was not a detailed comparison of classification algorithms implemented in individual software tools. Rather, the evaluation of classification primarily serves to characterize the quality of the input point clouds, which are subsequently used for building footprint extraction in the next part of the study. Differences in classification accuracy led to various types of errors in the data, representing realistic scenarios encountered in practical TLS data processing. Such prepared datasets subsequently enable the analysis of the sensitivity of footprint extraction tools to imperfections in input data. The results of the classification evaluation are presented in Table 6.
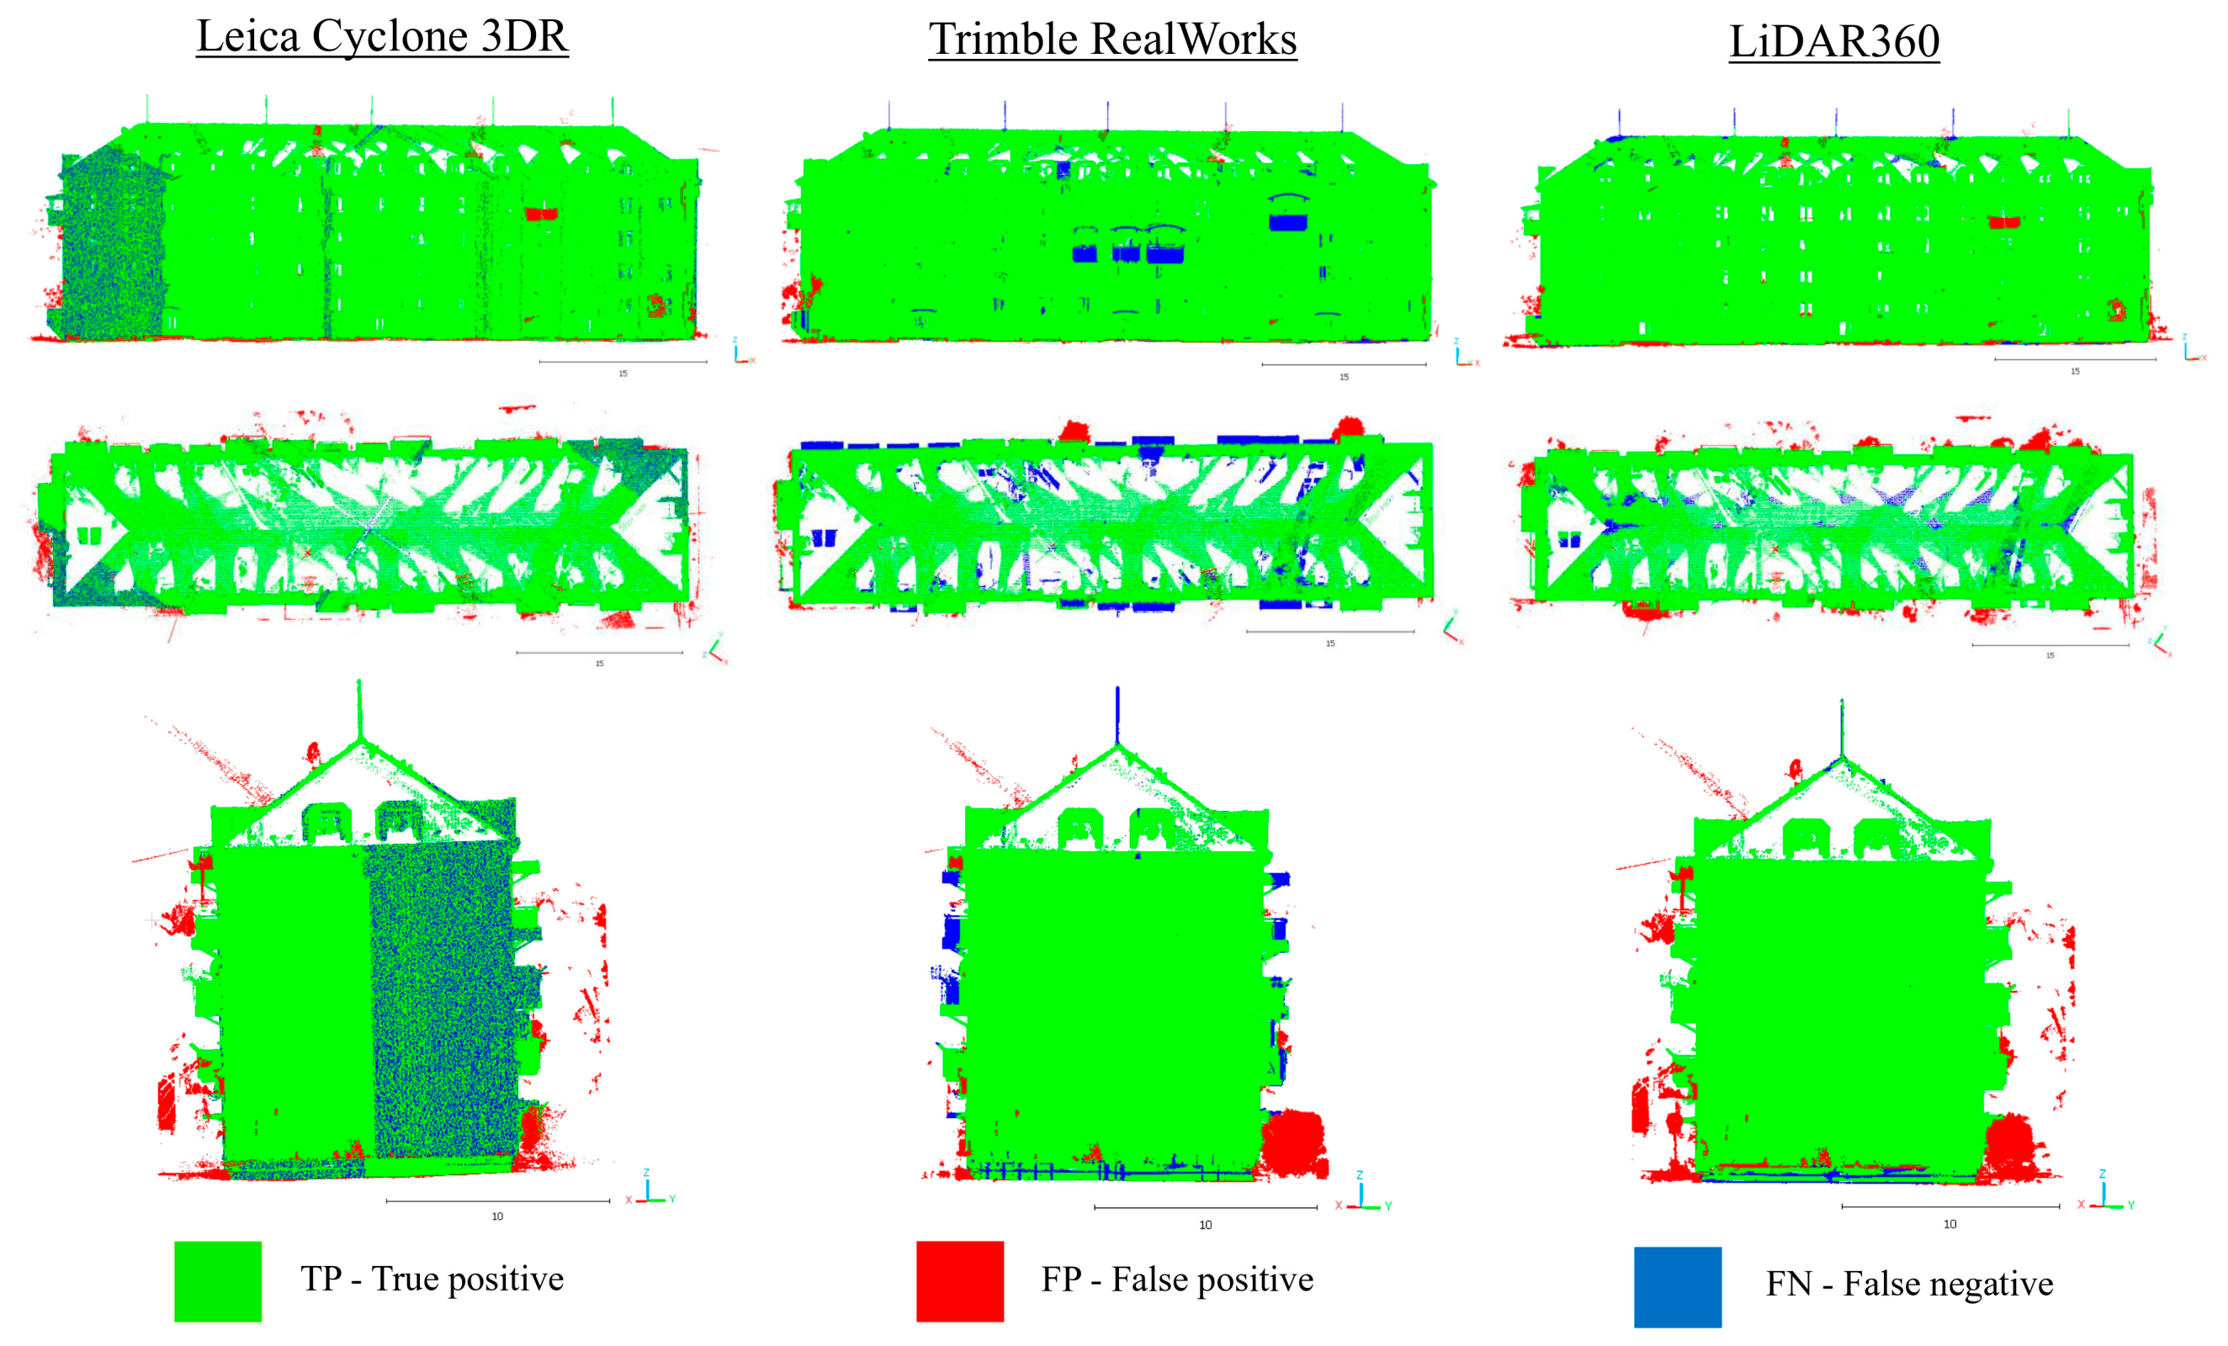
The results show that all tested software—Leica Cyclone 3DR, Trimble RealWorks, and LiDAR360—achieve relatively high accuracy in classifying building points. In most cases, the F1-score values are above 0.93, which indicates that the automatic classification tools can reliably identify points belonging to buildings, even in more complex TLS datasets. When analyzing by building type, some differences in the performance of the algorithms can be observed. For the apartment building, Leica Cyclone 3DR achieved the highest F1-score of 0.994, followed closely by LiDAR360 with 0.987, while Trimble RealWorks scored slightly lower at 0.961. The lower score for Trimble RealWorks is mainly due to a higher number of incorrectly classified points (FP), indicating that the algorithm sometimes includes points near the facade as part of the building class. For the garage, the differences between the software are more noticeable. LiDAR360 achieved the highest F1-score of 0.947, followed by Trimble RealWorks at 0.922. Leica Cyclone 3DR scored lower at 0.871, mainly because more points around the object were classified as part of the building, likely due to sensitivity to vegetation or points close to the facade. For the industrial building, the results of all software were very similar, with F1-scores ranging narrowly from 0.932 to 0.935. This indicates that for objects with simpler geometry and larger flat surfaces, all classification tools can achieve a comparable level of accuracy. A visual example of the spatial distribution of correctly classified points (TP), misclassified points (FP), and omitted points (FN) is shown in Figure 8.
From a practical point of view, it is important to emphasize that even with high classification metric values, certain errors still occur in the point clouds. These primarily include isolated points caused by measurement errors, vegetation points located very close to the facade, or points representing architectural elements such as balconies or roof overhangs. These types of errors represent realistic scenarios that can affect the subsequent extraction of the building’s geometry. For this reason, the classified point clouds are used in the next part of the study as input data for analyzing the impact of cleaning tools and building footprint extraction algorithms.

5.2. Impact of Classification on Building Footprint Extraction

Building footprints were extracted from TLS point clouds using CloudCompare software. The resulting polygons were subsequently adjusted and regularized using the Regularize Building Footprint tool in ArcGIS Pro to ensure geometric consistency and preserve orthogonal relationships between walls. To achieve the most accurate results, different input parameter settings were tested for each building, with the tolerance parameter playing a key role. Despite efforts to optimize these parameters and extract the maximum geometric information from the TLS data, it became clear that parameter adjustment alone was insufficient for obtaining a reliable footprint in noisy datasets. Higher tolerance values simplified the geometry and reduced the number of corner points but caused a significant increase in area, perimeter, and centroid shift. Conversely, lower tolerance values captured more detailed features but resulted in distorted or overly complex footprints. No manual selection of the optimal building cross-section (e.g., excluding balconies or roof overhangs) was used during footprint extraction, as this would have reduced automation and introduced subjectivity into the process. The only cross-section applied for each building was to remove overhanging roofs, as the goal was to obtain the footprint of the building itself, not the roof. The aim was to maintain a fully automated and reproducible workflow that reflects real-world TLS data processing conditions. Results presented in Table 7 indicate that the quality of the initial classification directly affects the accuracy of the extracted footprint, with the impact varying significantly depending on the geometric complexity of the analyzed building.
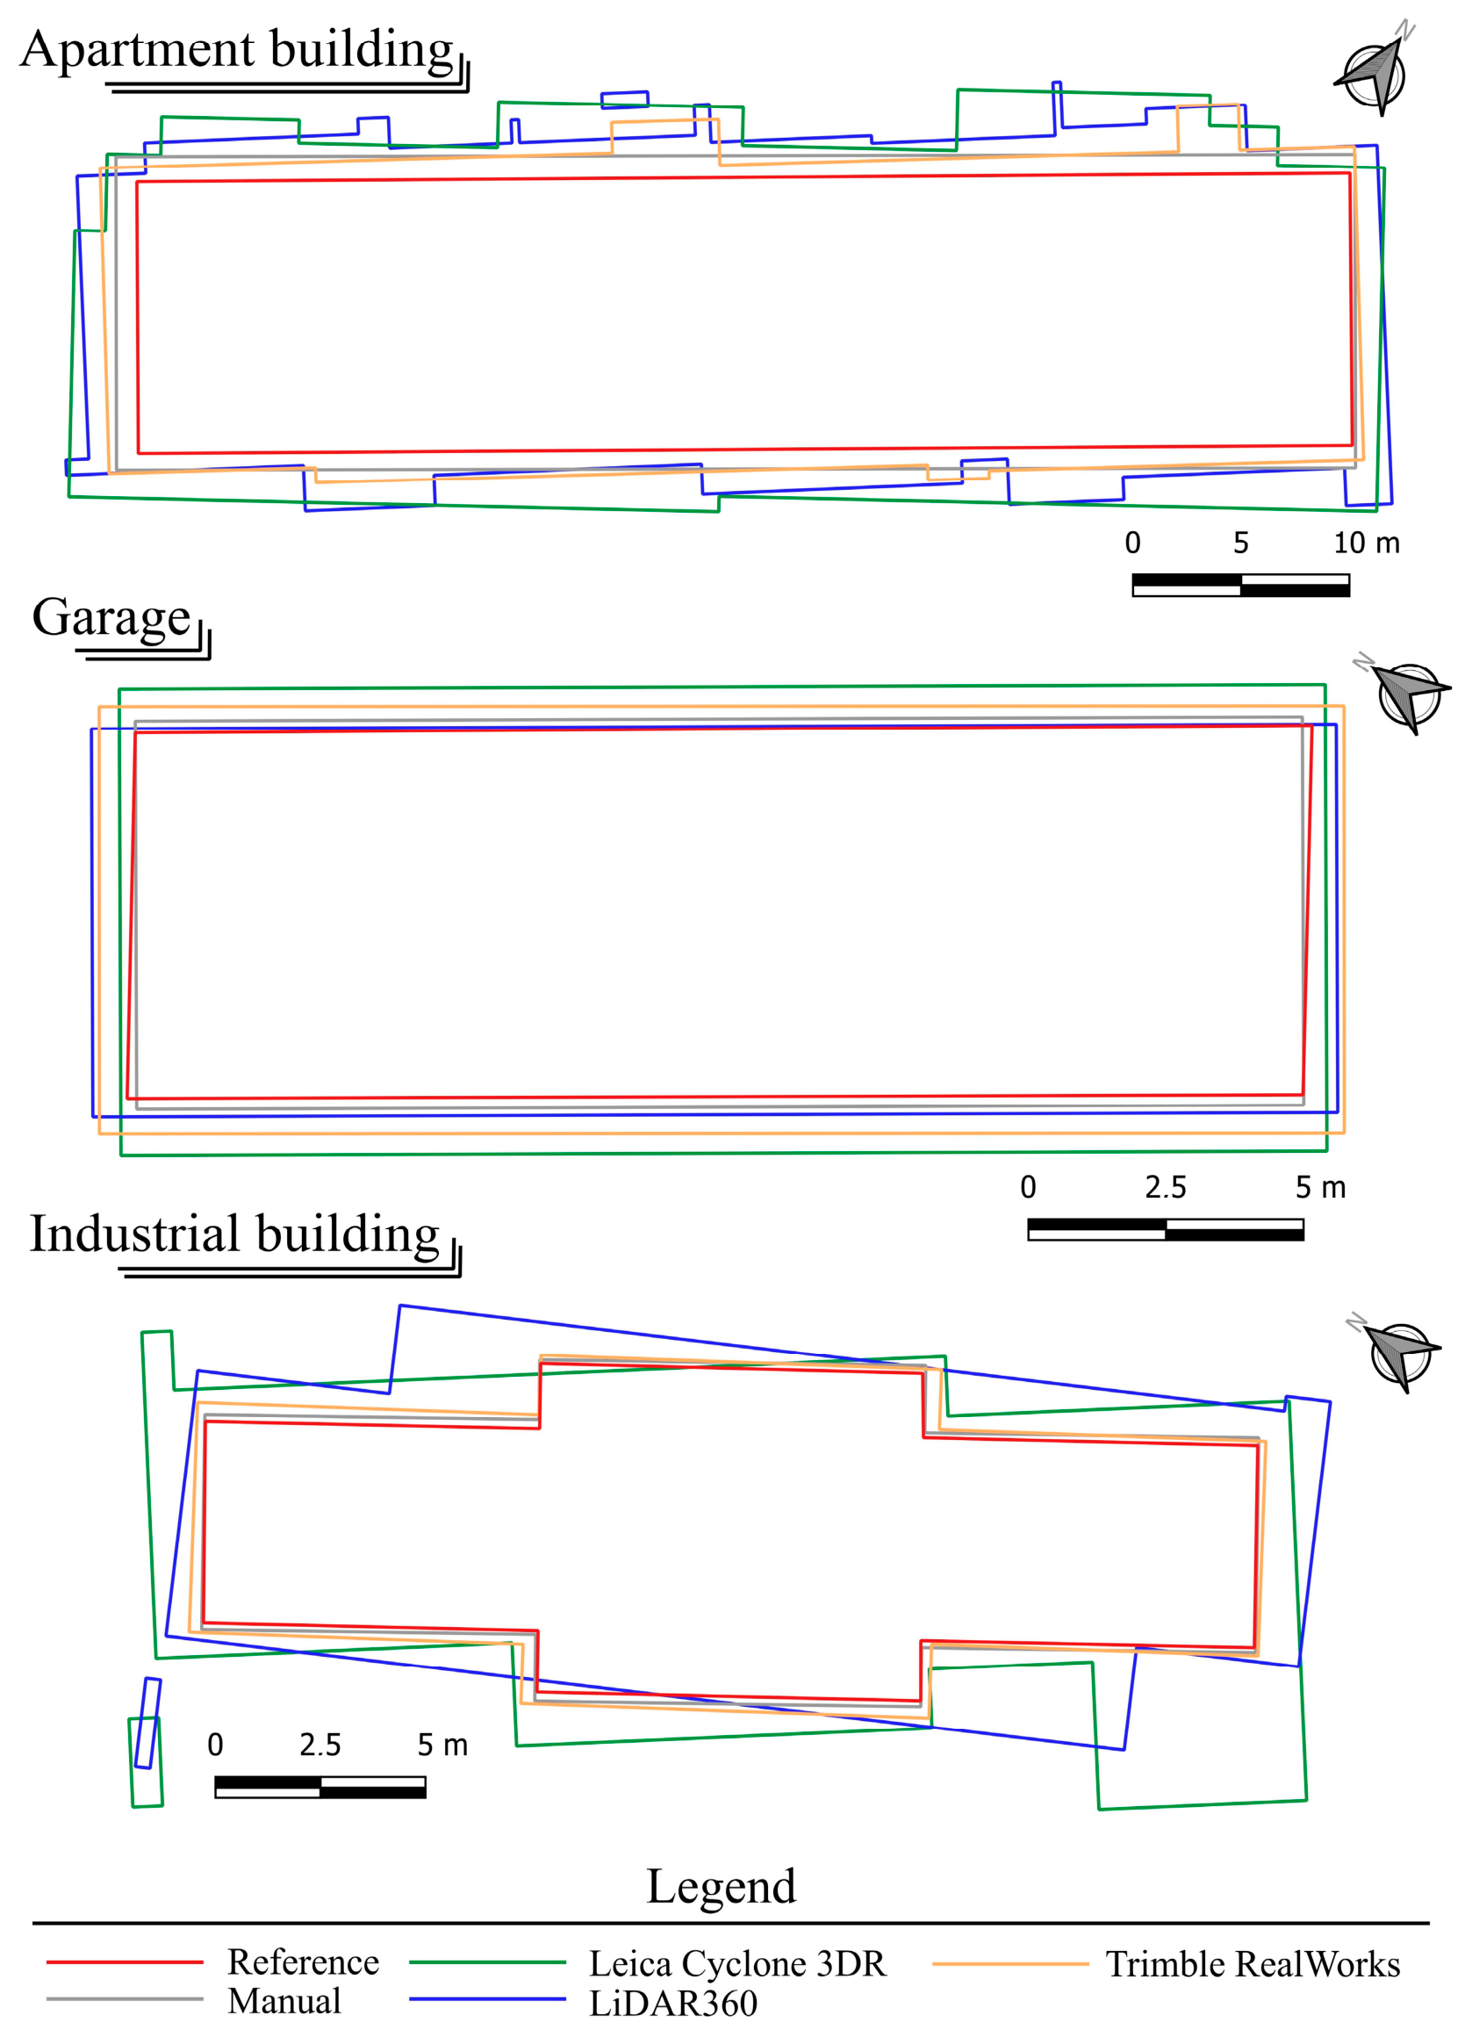
In the case of apartment building, significant deviations are observed across all monitored parameters. The reference area measures 705.862 m2, while the manually classified data increases it to 830.251 m2, and in Leica Cyclone 3DR it reaches 1052.374 m2. A similar trend is seen in the perimeter, which rises from the reference value of 137.361 m to 166.169 m. A notable increase is also observed in the number of corner points (from 4 to 22, and up to 48 in LiDAR360), indicating deformation of the building footprint. Importantly, deviations are present even when using manually classified reference data, which is related to the complex geometry of the object, particularly the presence of balconies and roof overhangs. These elements mean that even correctly classified points do not necessarily result in an ideal footprint, and classification errors further amplify this effect. This is also reflected in the Hausdorff distance, which reached 4.01 m in Leica Cyclone 3DR and 4.32 m in LiDAR360, confirming substantial boundary deviations from the reference footprint, whereas the manually classified dataset showed a considerably lower value of 1.51 m.
For a simpler object, such as the garage, differences between the approaches are minimal. The area ranges from 142.952 m2 (reference) to 189.434 m2 (Leica Cyclone 3DR), while the perimeter shows only slight deviations. The number of corner points remains constant (4) across all methods, confirming that for objects with simple geometry, the quality of classification has a much smaller impact on the resulting footprint. This is further supported by relatively low Hausdorff distances ranging from 0.80 m to 1.11 m across the tested software environments, indicating only minor boundary deviations. For the industrial building, the influence of classification errors reappears, particularly in the increase of area from 148.173 m2 to 215.624 m2 (Leica Cyclone 3DR) and the perimeter from 65.678 m to 87.68 m. The number of corner points also increases from 12 to 18, indicating geometric deformation. The centroid shift reaches up to 0.659 m, representing a significant spatial deviation. Similar behavior is reflected in the Hausdorff distance, which reached 4.71 m in Leica Cyclone 3DR, while Trimble RealWorks showed substantially lower deviation (0.49 m), confirming considerable differences in boundary accuracy among classification outputs.
Visual analysis shows that classification errors manifest not only as deformation of the main footprint (Figure 9) but also, in some cases, as the emergence of smaller separate polygonal objects. These artifacts usually result from the misclassification of isolated objects, such as streetlights or vegetation, mistakenly assigned to the building class. Such errors significantly affect the resulting geometry and topology of the extracted footprint. These results indicate that classification alone, even with high reliability values, may not be sufficient for accurate footprint extraction, particularly for objects with complex geometry. They also confirm that optimizing extraction parameters (e.g., tolerance) cannot fully eliminate the influence of errors in the data, highlighting the need for additional point cloud cleaning methods.

5.3. Impact of Point Cloud Cleaning Methods on Building Footprint Extraction Accuracy

In this part of the article, the influence of selected point cloud cleaning methods on the accuracy of building footprint extraction is analyzed. For each method, different combinations of input parameters were tested, while their optimization was not the primary objective of the analysis. The parameters were adjusted to achieve the best possible result for a specific type of object while maintaining comparability between methods and software solutions. To ensure comparability of results, an identical workflow for footprint extraction was applied in all cases. Specifically, the Fit 2D polygon tool in CloudCompare was used, followed by footprint regularization using the Regularize Building Footprint tool in ArcGIS Pro. This approach eliminated the influence of different extraction techniques and allowed the analysis to focus solely on the impact of input data quality after applying individual cleaning methods.
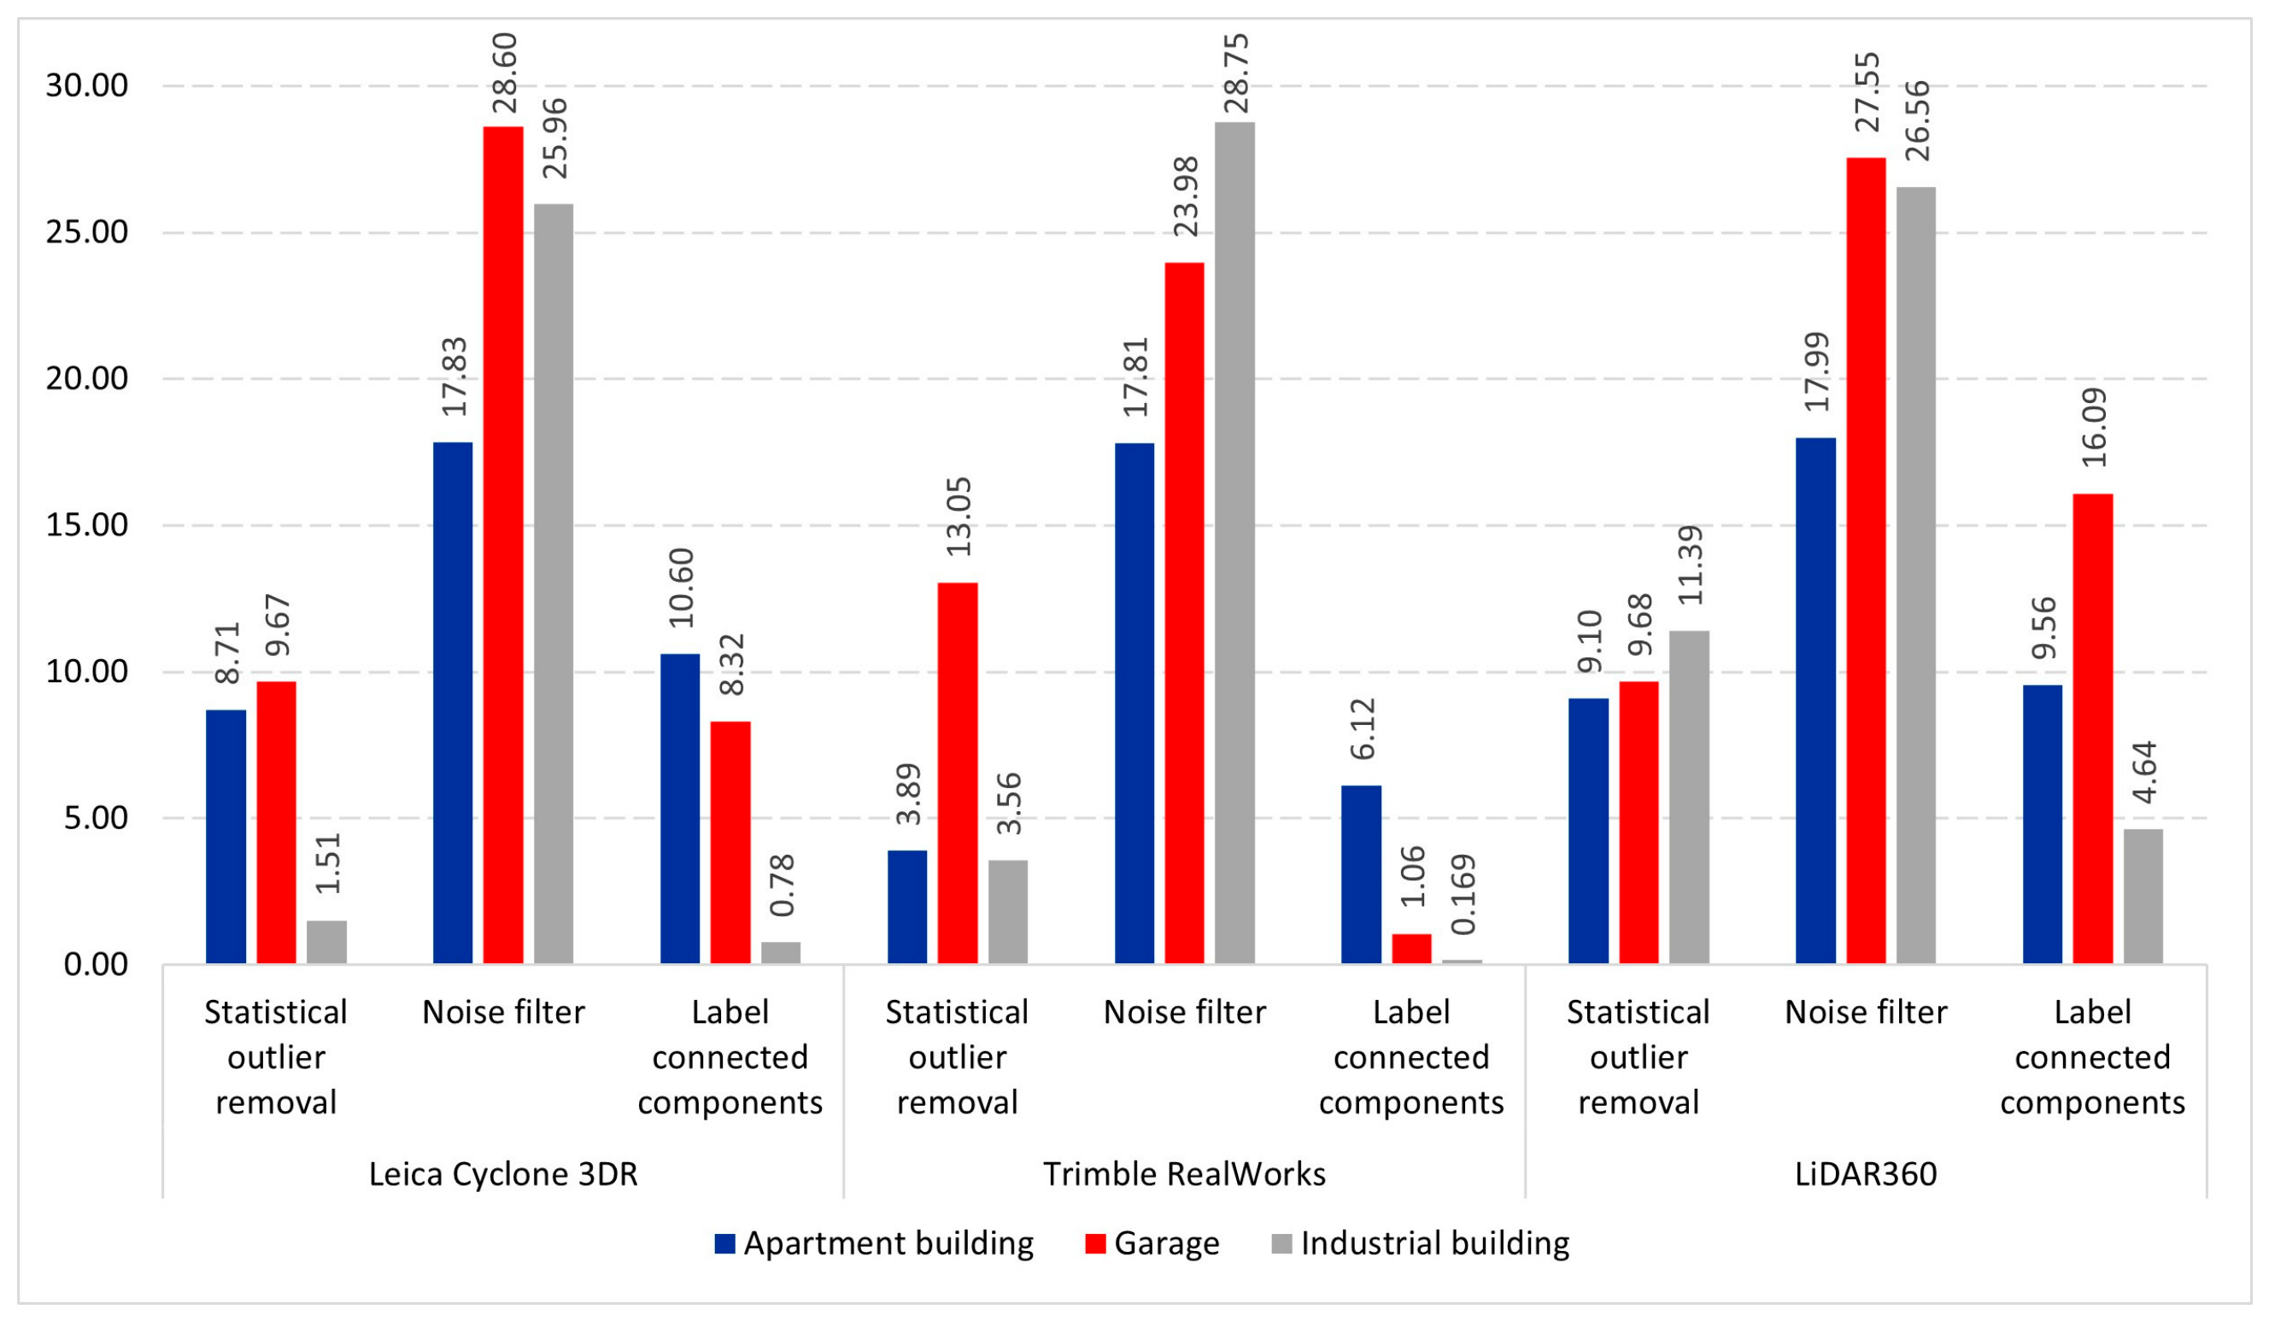
The effectiveness of the cleaning methods was initially evaluated based on the proportion of removed points, with results presented in a bar chart (Figure 10). The chart shows significant differences between methods in terms of cleaning intensity, as well as variations across different software solutions and object types. The highest values were observed for noise filter method, where the proportion of removed points reached approximately 17–29%, depending on the object type and software used. In contrast, statistical outlier removal and label connected components showed lower and more stable levels of point removal. At first glance, it might seem that a higher proportion of removed points leads to more effective cleaning. However, as demonstrated in the following sections, this assumption does not hold. In the case of the noise filter, a significant number of points belonging to the building itself were removed, while some unwanted structures, such as vegetation in close proximity to the object, remained. This indicates that the proportion of removed points alone is not a sufficient indicator of cleaning quality or its impact on the final footprint accuracy. This aspect is further analyzed in detail based on the geometric characteristics of the extracted building footprints.
In the case of the apartment building, the input data represented a realistic TLS data processing scenario in an urban environment, where various types of classification errors occur within the point cloud, particularly in the form of vegetation and smaller objects located in close proximity to the building. This condition significantly affects the possibilities of automated footprint extraction, as without additional processing it leads to substantial deformation of the resulting geometry. Without applying any cleaning methods, all extracted footprints were significantly overestimated. For example, in Leica Cyclone 3DR, the area reached 1052.374 m2 compared to the reference value of 705.862 m2, while the number of corner points increased to 22. In practice, such a footprint is unusable for precise cartographic outputs, such as cadastral maps or large-scale technical city maps.
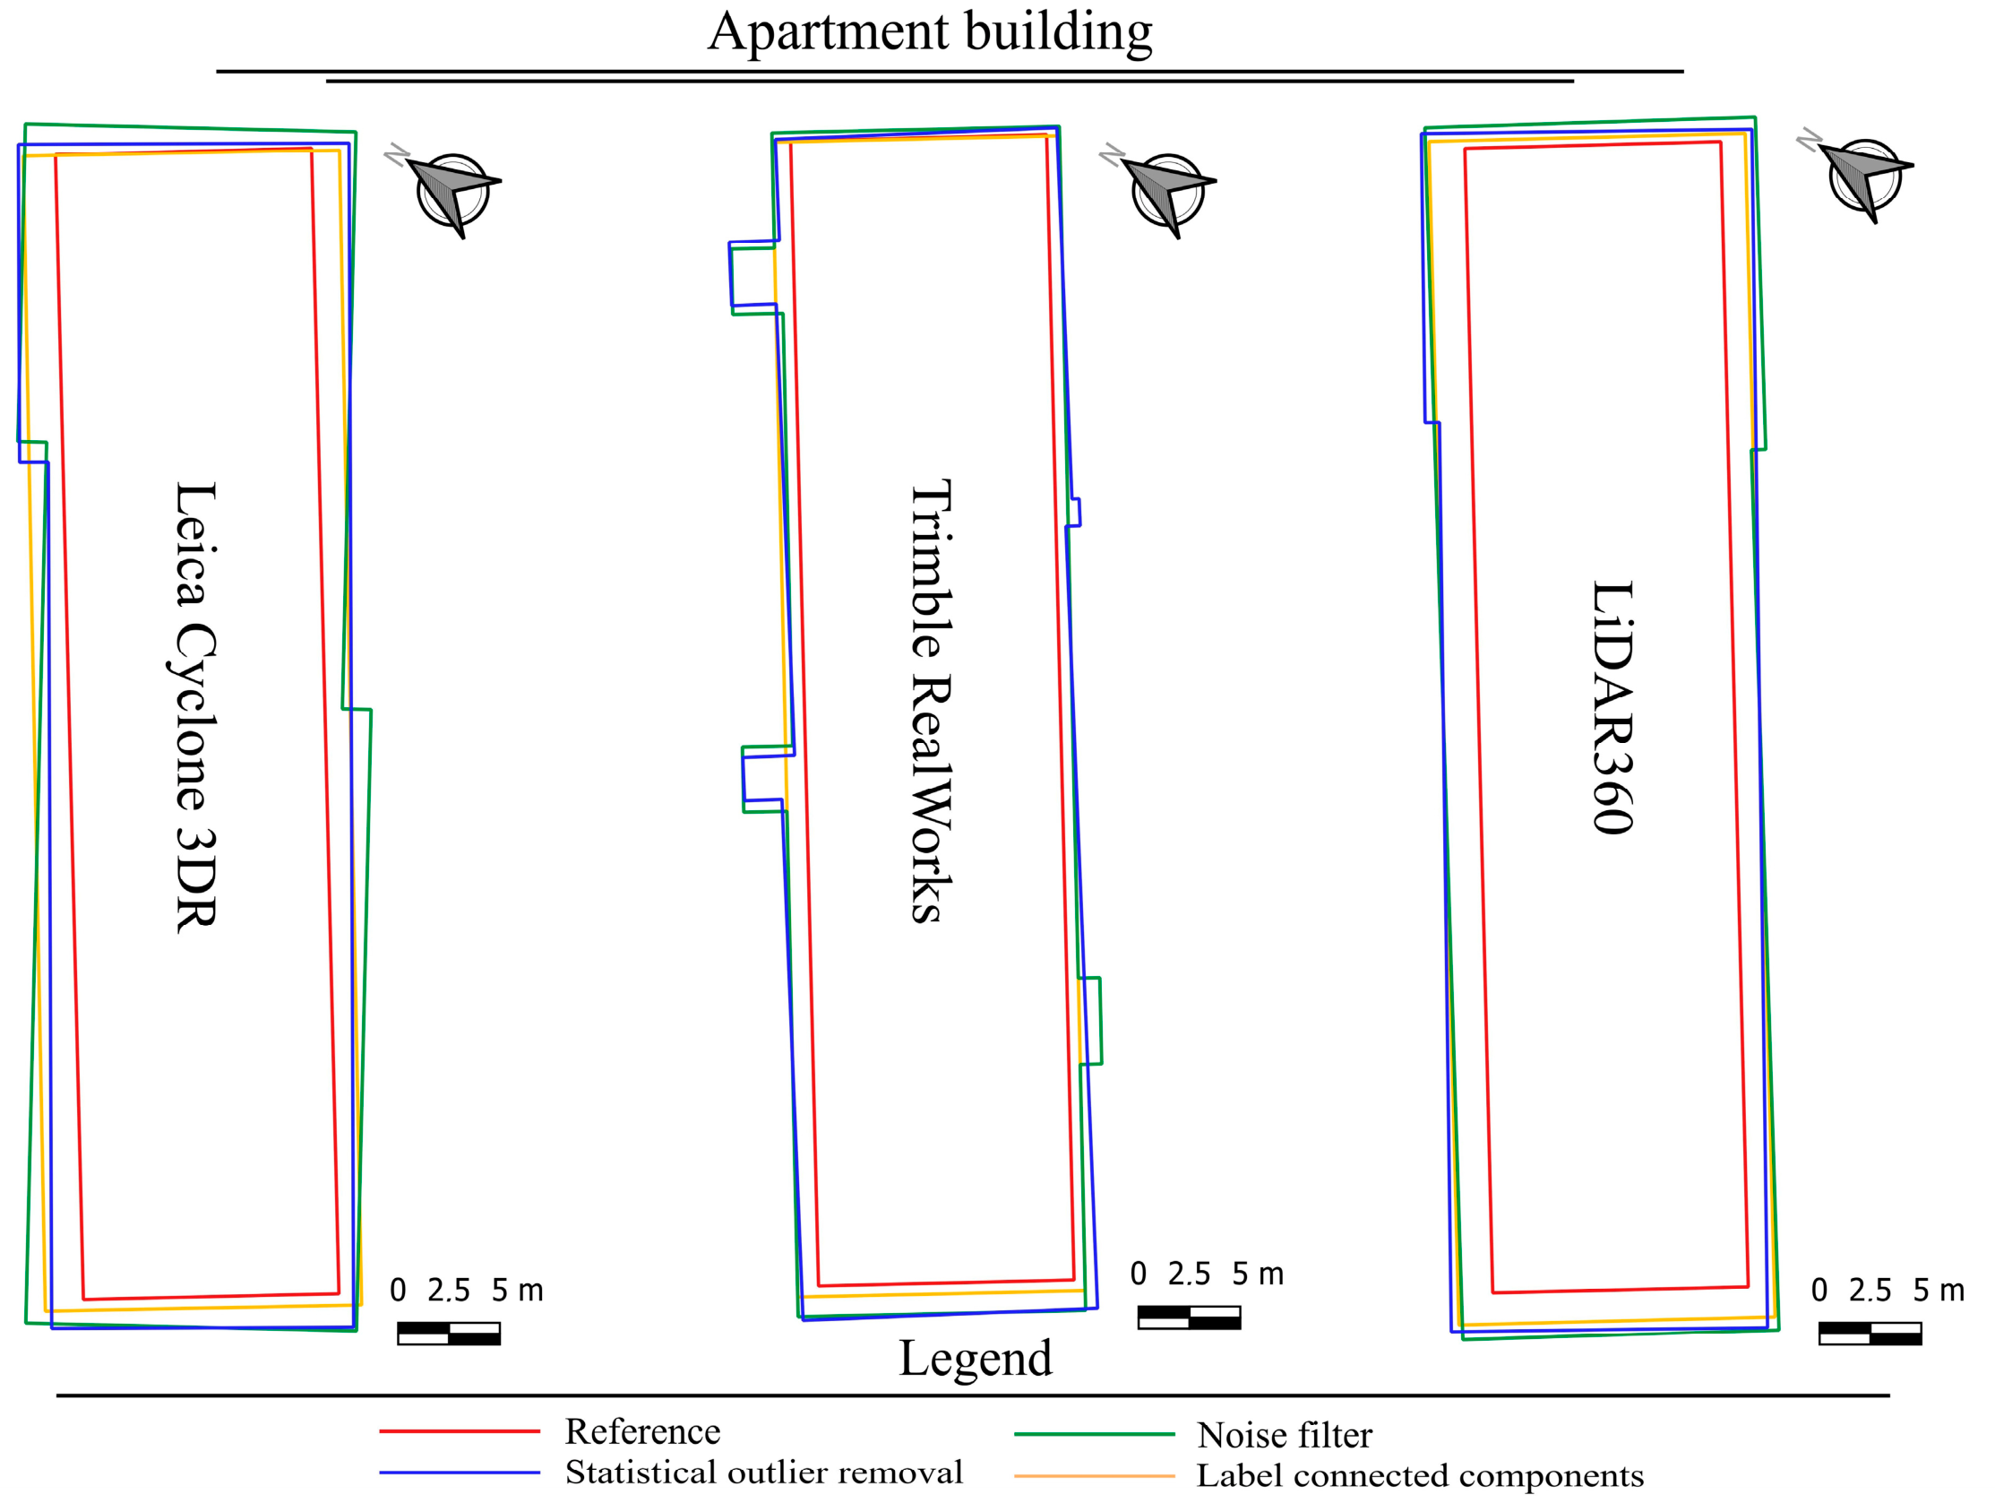
The application of cleaning methods demonstrated that their proper selection has a crucial impact on the usability of the resulting data. The statistical outlier removal method proved to be a robust approach, significantly improving footprint accuracy without substantially distorting the object’s geometry. In Leica Cyclone 3DR, the area was reduced to 853.585 m2, and positional accuracy improved considerably (centroid shift of 0.077 m), making the resulting footprint suitable for applications such as urban analysis, land-use assessment, or thematic land cover maps. In contrast, noise filter method proved to be the least suitable method. Despite removing many points, it did not lead to a corresponding improvement in the footprint (e.g., 936.501 m2 in Leica Cyclone 3DR) and often resulted in the loss of parts of the building. Such outputs are problematic from an application perspective, as they combine geometric inaccuracies with incomplete data. The best results in terms of practical usability were achieved using the label connected components method, which effectively removed isolated objects around the building while preserving its fundamental shape. This is also reflected in reduced Hausdorff distance values, for example, from 4.01 m to 1.95 m in Leica Cyclone 3DR and from 4.32 m to 2.79 m in LiDAR360. In Leica Cyclone 3DR, the area was reduced to 846.397 m2 and the number of corner points to 4, corresponding to the reference geometry. A similar trend was observed across other software solutions. The resulting footprints (Figure 11) are suitable not only for detailed large-scale mapping but also as input for automated workflows in building database updates or urban environment analyses. A comprehensive overview of all analyzed combinations of classification tools, cleaning methods, and resulting geometric parameters for the apartment building is provided in Table 8.
It should be emphasized, however, that for apartment buildings, the geometric complexity of the object itself plays a significant role. Elements such as balconies or structural overhangs often remain part of the point cloud even after cleaning, as they are geometrically connected to the main building volume. These structures subsequently influence the resulting footprint and represent a limitation of automated approaches, which must be considered, especially in applications requiring high geometric accuracy.
In the case of the garage, the object had a geometrically simple and regular rectangular shape, which was also reflected in the stability of the extracted building footprints. Unlike the apartment building, no shape deformation occurred, as the correct number of corner points (4) was preserved in all cases. However, the main issue was a systematic classification error, where a narrow strip of points in the immediate vicinity of the object was incorrectly classified as part of the building class. This type of error is specific in that the points are directly geometrically connected to the object, which significantly limits the possibilities for their removal. Without the application of cleaning methods, this issue was primarily manifested by an overestimation of area and perimeter. For example, in Leica Cyclone 3DR software, the area reached 189.434 m2 compared to the reference value of 142.952 m2, with a similar trend observed in other software solutions (e.g., 179.229 m2 in Trimble RealWorks and 162.222 m2 in LiDAR360).
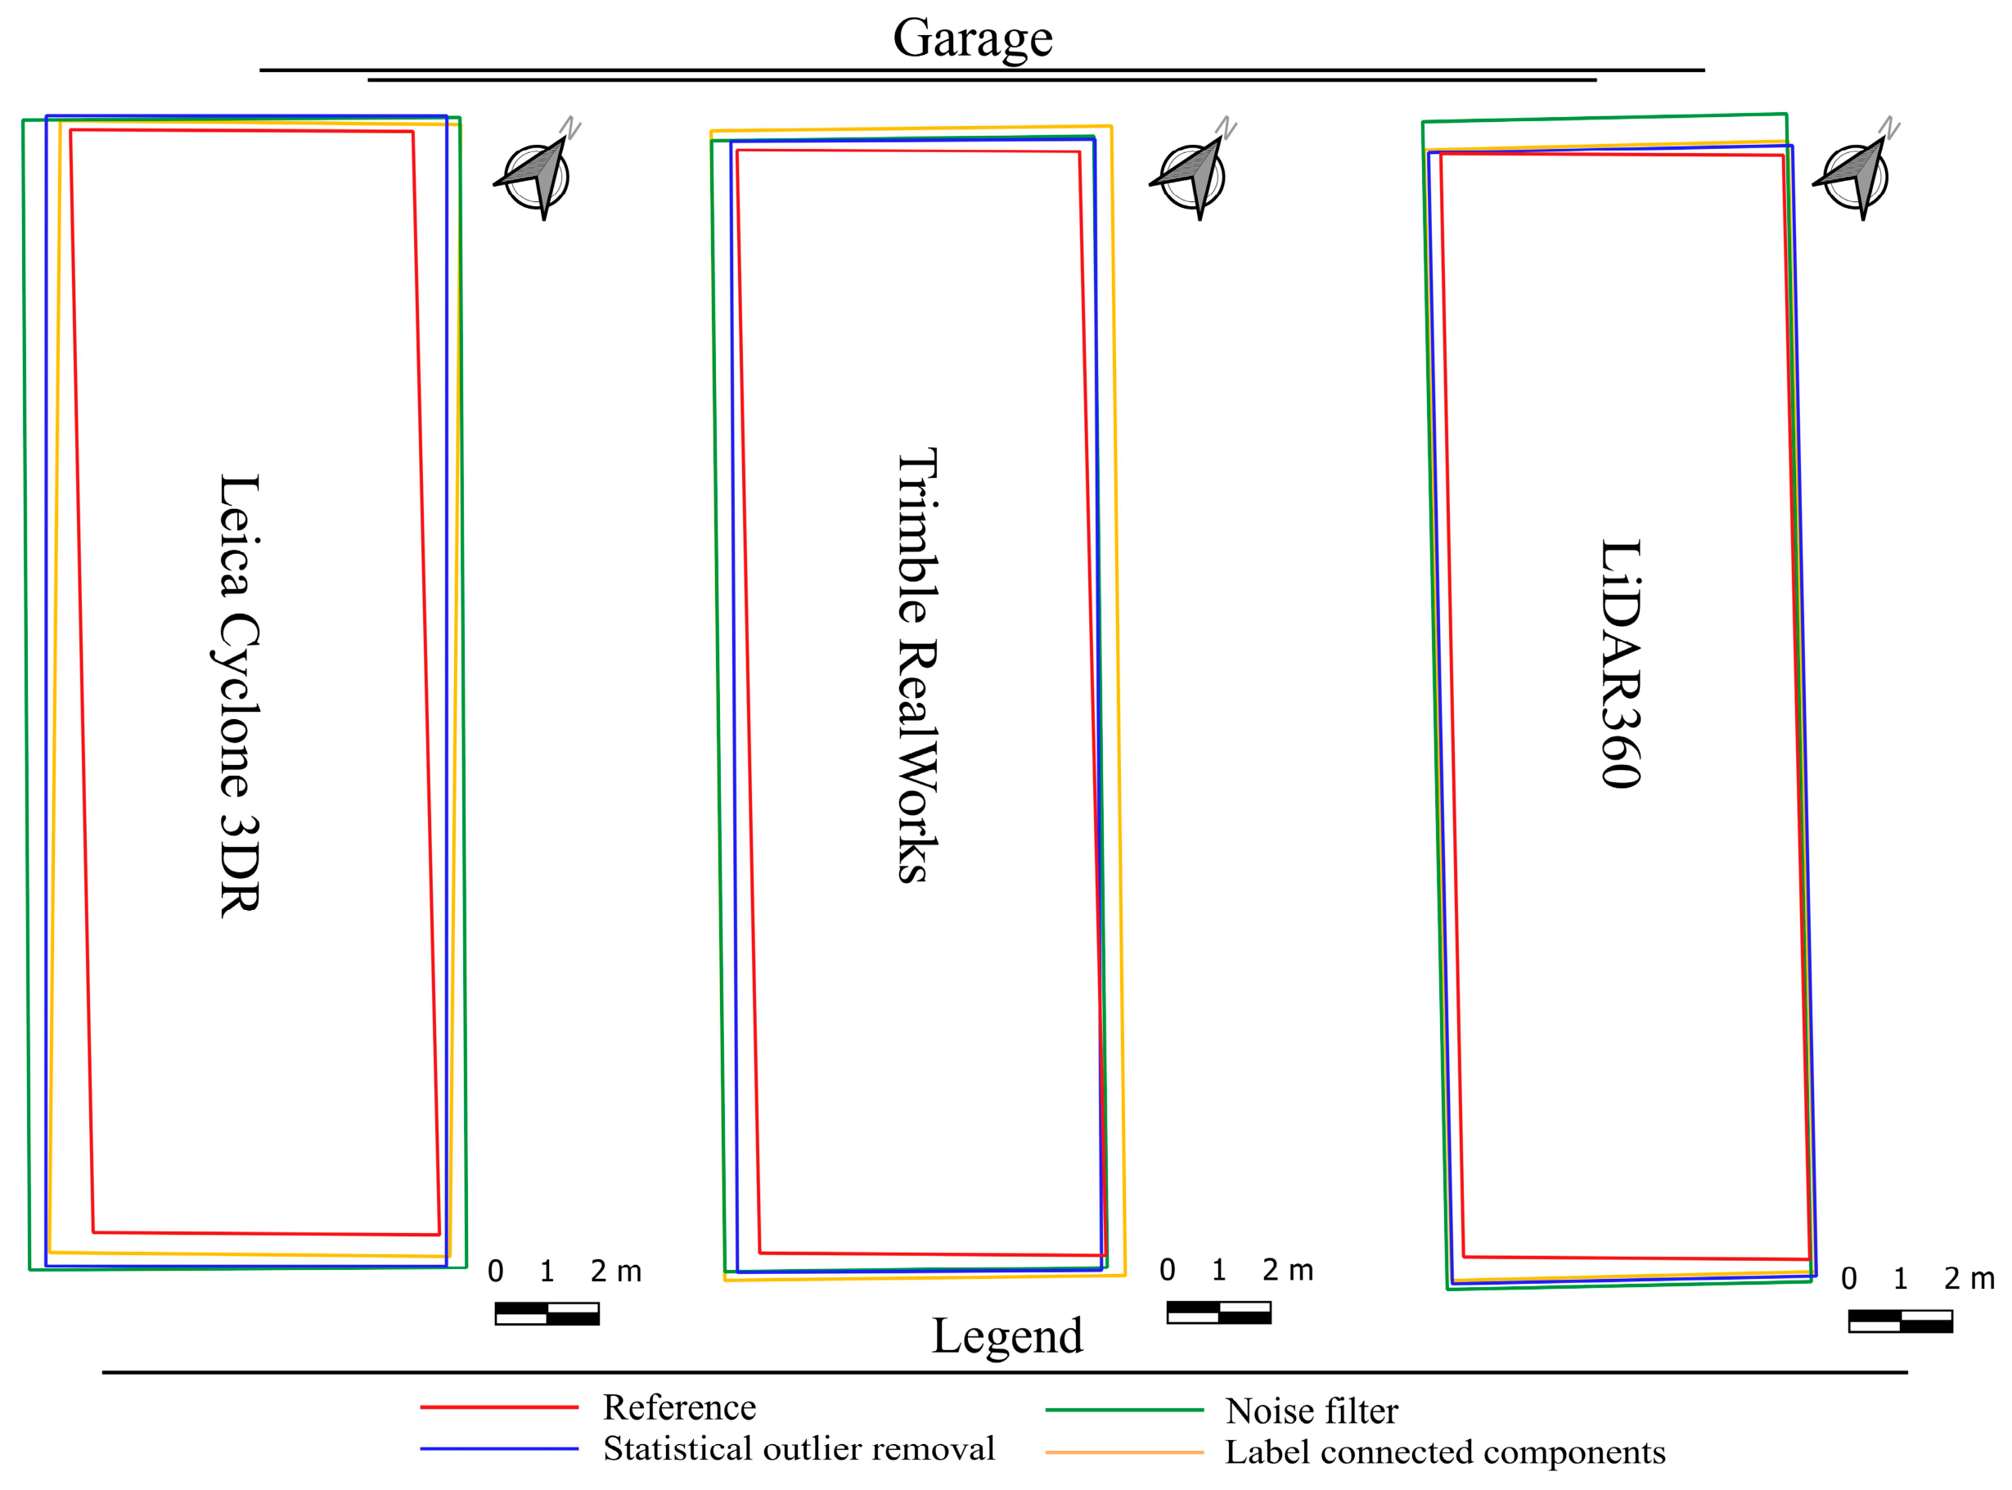
The application of cleaning methods (Table 9) led only to partial improvements, while the effectiveness of individual approaches was limited by the nature of the error (Figure 12). The statistical outlier removal method provided the most consistent results; for instance, in Trimble RealWorks software, the area was reduced to 155.029 m2 while also achieving the lowest centroid shift (0.098 m). A similar effect was observed in LiDAR360 software, where statistical outlier removal method produced the same area value (155.029 m2), representing the closest approximation to the reference among all tested methods. This improvement was also reflected in Hausdorff distance values, which decreased to 0.58 m in Trimble RealWorks and 0.57 m in LiDAR360, indicating improved boundary conformity. Noise filter method, however, proved ineffective in this case as well. For example, in Leica Cyclone 3DR, the area remained at 189.035 m2, showing virtually no improvement compared to the uncleaned data. This result confirms that the method is unable to eliminate continuous point structures that have a similar density to the object itself. The label connected components method also showed limited effectiveness, as the misclassified points did not form separate components. Nevertheless, in some cases, a slight improvement was observed, for example, in Leica Cyclone 3DR software, where the area decreased to 170.532 m2, but still with a significant deviation from the reference value. In Leica Cyclone 3DR, however, the label connected components method reduced the Hausdorff distance to 0.94 m compared to 1.11 m without cleaning, indicating only partial improvement. This result highlights the limitation of this method in addressing errors that are directly connected to the object.
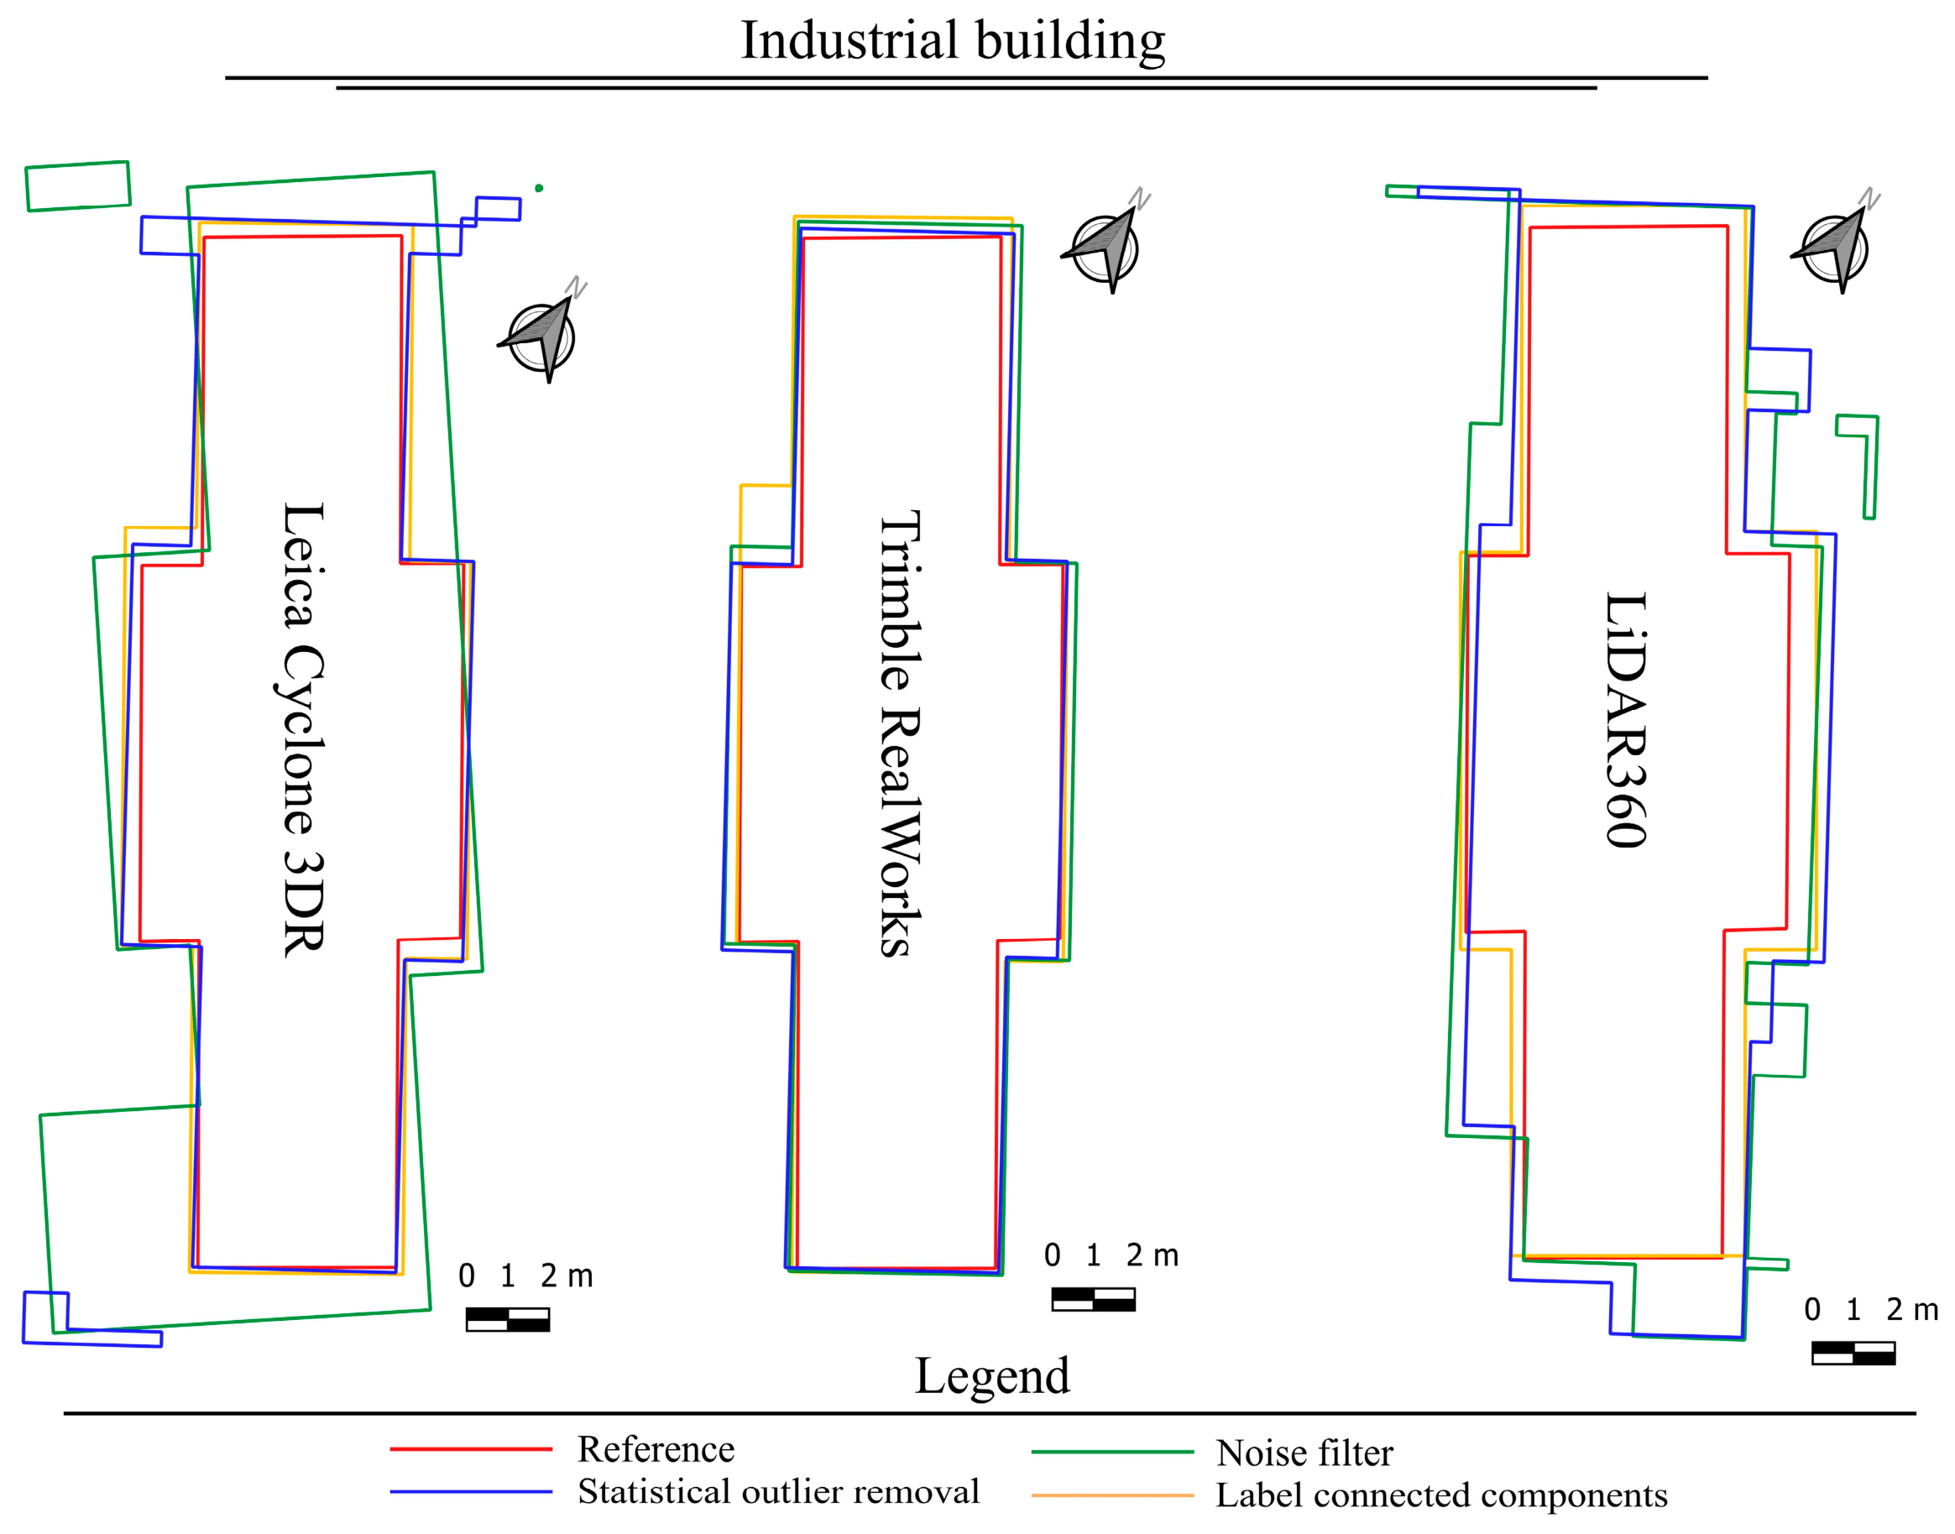
The industrial building represents a specific type of object with more complex geometry, differing from simple rectangular shapes. An overview of all analyzed combinations of classification tools, cleaning methods, and resulting geometric parameters of the building footprints for the industrial building is presented in Table 10. The footprint consists of multiple breakpoints (12), which increases the demands on both classification accuracy and subsequent processing. In terms of input data, differences between individual classification tools were again observed. While Trimble RealWorks software provided relatively clean input data without significant errors, clusters of points were present around the object in Leica Cyclone 3DR and LiDAR360 datasets, particularly in the form of misclassified elements near the building. Without applying cleaning methods, these errors resulted in a significant overestimation of geometric characteristics. For example, in Leica Cyclone 3DR software, the area reached 215.624 m2 compared to the reference value of 148.173 m2, with a perimeter of 87.68 m and the number of corner points increasing to 18. A similar trend was observed in LiDAR360 software (209.238 m2, perimeter 98.763 m, 14 corner points). Unlike the garage case, however, this scenario involved not only overestimation of size but also deformation of the footprint geometry, which is also evident from visual comparison.
The application of cleaning methods produced varying results depending on the approach used (Figure 13). The statistical outlier removal method once again confirmed its robustness. For instance, in Leica Cyclone 3DR, it led to a significant reduction in area to 164.906 m2 and a centroid shift of 0.250 m. Even more accurate results were achieved with Trimble RealWorks (159.525 m2, centroid shift 0.070 m), representing very good agreement with the reference values. This approach also preserved the correct number of corner points (12), maintaining the geometric integrity of the object. This was accompanied by slight improvement in Hausdorff distance (e.g., from 4.71 m to 4.62 m in Leica Cyclone 3DR and from 0.49 m to 0.47 m in Trimble RealWorks), although boundary deviations remained relatively large in some cases. Noise filter method again proved to be an unsuitable method. In Leica Cyclone 3DR, it resulted in a final area of 211.426 m2 and a substantial increase in the number of corner points to 29, indicating significant geometric degradation. A similar effect was observed in LiDAR360 (199.284 m2, 34 corner points), confirming that this approach is not effective in eliminating more complex errors in the data and negatively affects the footprint shape. The label connected components method proved to be highly effective in this case, particularly for datasets containing isolated clusters of points. In Leica Cyclone 3DR, the area was reduced to 164.426 m2, along with a significant improvement in positional accuracy (centroid shift of 0.117 m), while preserving the correct number of corner points. The most notable improvement, however, was observed in LiDAR360, where the area decreased to 172.573 m2 and the perimeter to 68.313 m, with the number of corner points reduced to 12, corresponding to the reference geometry. This improvement is also evident from Hausdorff distance values, which decreased markedly to 0.99 m in Leica Cyclone 3DR and 0.89 m in LiDAR360, confirming substantial improvement in local boundary agreement.
The analysis carried out on three typologically distinct objects—an apartment building, a garage, and an industrial building—clearly confirms that classification of TLS point clouds alone does not constitute a final step leading to reliable footprint extraction. Instead, it represents an initial phase that generates realistic error scenarios commonly encountered in practice. The quality of the resulting footprints is significantly improved in many cases only through subsequent point cloud cleaning, which enhances geometric accuracy and practical usability. The results provide a systematic view of how different types of errors—from isolated point clusters, through vegetation elements, to points directly connected to the object—are reflected in the resulting footprint geometry and how effectively different cleaning methods can mitigate them. This aspect represents a key contribution of the study, as it allows not only for quantifying the accuracy of results but also for interpreting them in the context of real-world scenarios encountered when processing TLS data in urban environments.
From an applied perspective, it is particularly important to note that an appropriately chosen cleaning method can transform initially unusable or significantly distorted footprints into geometrically consistent objects, directly usable in GIS (Geographic Information System) applications. Such processed data are especially valuable for creating and updating building databases, generating base and technical maps at larger scales, as well as for analytical tasks such as evaluating land coverage, conducting urban analyses, or producing land cover maps. A significant advantage is that these outputs can be achieved automatically, without detailed manual intervention, resulting in considerable time savings and increased reproducibility of the processing. In terms of computational performance, all tested cleaning methods showed comparable processing times, typically within a few minutes even for the most complex object. As a result, computational cost was not a decisive factor in method selection within this study. Methodologically, the article also demonstrates that the quality of the result is not determined by the sheer number of points removed, but by the method’s ability to selectively eliminate structures that negatively affect the resulting geometry. This insight has direct practical implications, highlighting the limitations of universal, blanket-applied filters and emphasizing the need for a targeted choice of method depending on the object type and error characteristics. In this context, approaches that combine statistical filtering with segmentation principles appear the most promising, as they strike a balance between error removal and preservation of the object’s geometric integrity.
Another important contribution of the article is the identification of the limits of current automated procedures. The results clearly show that certain types of errors, particularly those geometrically connected to the object (e.g., misclassified strips of terrain or structural elements such as balconies), cannot be reliably removed using standard cleaning methods. This finding is critical for the proper interpretation of results in practice, as it allows for a realistic assessment of the accuracy achievable without additional interventions. From a practical view, the presented study provides a concrete methodological framework for TLS data users aiming to automatically extract building footprints. It enables the identification of suitable procedures for different object types, the estimation of expected accuracy, and an understanding of when additional post-processing steps may be necessary. Such knowledge is particularly important in the context of the growing volume of 3D data, where efficient, scalable, and reproducible processing is increasingly essential.

6. Discussion

The aim of this article was to analyze the influence of TLS point cloud processing on the accuracy of building footprint extraction in urban environments, with particular emphasis on the role of data cleaning applied to classified point clouds. The results highlighted a clear relationship between classification quality, expressed through Precision, Recall, and F-score metrics, and the geometric accuracy of derived footprints, evaluated against reference data obtained using the spatial polar method. However, it was also shown that this relationship is not strictly linear, and classification metrics alone cannot fully capture the quality of the final geometric output without considering subsequent processing steps. From a results interpretation perspective, it is important to note that Precision and Recall affect the resulting footprint in different ways. A lower Recall leads to omission of parts of the object and simplification of its geometry, whereas a lower Precision results in the inclusion of redundant points, manifesting as footprint expansion or geometric distortions. The F-score provides a balanced indicator; however, the findings of this study confirm that its interpretation must be complemented by an analysis of the geometric characteristics of the output.
A key finding of the article is that the decisive impact on the accuracy of the extracted footprint arises from the point cloud cleaning stage. Even with relatively high-quality classification, errors may persist in the data, such as vegetation points, small objects, or structures connected to the building, which significantly deform the resulting geometry. The application of cleaning methods effectively reduced these errors, bringing the resulting area, perimeter, and centroid position closer to the reference values. It was also shown that the proportion of removed points is not the critical factor—the essential aspect is the method’s ability to selectively eliminate precisely those points that negatively affect geometry. The results further indicate that the influence of classification and cleaning on footprint accuracy depends on the typological characteristics of the object. Simple objects with regular shapes showed high stability of results even with less optimal processing, whereas more complex objects were significantly more sensitive to noise and misclassified points. These findings underscore the need to tailor processing procedures to the specific conditions and type of analyzed object.
When interpreting the results, certain limitations of the study must also be considered. The analysis was conducted on three objects with distinct typological characteristics, enabling the identification of the basic behavior of the applied methods; however, including a larger sample would allow for more robust generalization. At the same time, the research was designed as a controlled methodological experiment rather than a statistically representative survey, and the combination of three typological cases, nine classification scenarios, and multiple data-cleaning strategies enabled systematic testing of method performance under realistic error conditions. Future work should therefore extend validation to a broader range of buildings, including high-rise and historical structures. The outcomes are also influenced by the parameter settings for cleaning and footprint extraction, which were optimized to achieve the highest possible accuracy. The use of specific software tools, such as CloudCompare and ArcGIS Pro, may affect the reproducibility of results; however, the procedures employed are based on generally available algorithms. Future research could focus on systematic optimization of cleaning parameters, the design of adaptive or hybrid approaches combining multiple methods, and the integration of machine learning algorithms for automatic recognition and elimination of errors in point clouds. An interesting direction would also be the direct integration of classification and cleaning into a unified processing workflow, minimizing the need for manual parameter adjustments.
The issue of classification assessment is addressed, for example, in study [45], which emphasizes the need for a comprehensive evaluation of classification models beyond basic metrics. This approach aligns with our findings, as the metrics Precision, Recall, and F-score alone cannot fully characterize the quality of the resulting geometric output without considering subsequent processing steps. In the field of TLS data processing, article [46] highlights the importance of algorithm robustness against noise and data heterogeneity, which was also confirmed in our work, where these factors significantly influenced the accuracy of footprint extraction. Approaches focused on footprint extraction, such as [47], demonstrate the effectiveness of combining classification and segmentation. Our work extends these insights by emphasizing data cleaning as a critical intermediate step that substantially affects the final geometry. Similarly, Ref. [48] presents advanced methodologies using a combination of statistical and optimization approaches, achieving high extraction accuracy. Compared to these approaches, our study shows that high-quality results can also be achieved using standard tools, provided that the data cleaning phase is adequately addressed. The importance of reliable reference datasets is also highlighted in [49], which stresses the need for accurate and dependable benchmarks to evaluate geometric characteristics. In our case, the use of geodetically surveyed reference points allowed an objective assessment of the accuracy of the individual processing workflows.
A distinctive feature of this article is the comprehensive integration of classification, point cloud cleaning, and footprint extraction within a single analytical framework. Unlike many existing studies, which primarily focus on either classification or extraction alone, this work systematically highlights the importance of data cleaning as a key step influencing the quality of the final footprint. The results thus provide new insights into the relationship between thematic data accuracy, the presence of noise, and the geometric precision of outputs, offering practically applicable recommendations for automated TLS data processing in urban environments.

7. Conclusions

This article focused on analyzing the accuracy of building footprint extraction from TLS point clouds in an urban environment, with particular emphasis on the role of data cleaning applied to classified point clouds. The article was conducted on three typologically distinct objects in the center of Žiar nad Hronom, with reference values obtained through independent geodetic measurements. Classification was evaluated using Precision, Recall, and F-score metrics and primarily served to simulate realistic input conditions. The results demonstrated that classification quality alone is not the decisive factor for footprint accuracy; rather, the critical role is played by the subsequent point cloud cleaning phase. It was confirmed that appropriately chosen cleaning methods, particularly statistical outlier removal and label-connected components, can significantly reduce the impact of classification errors and improve the geometric characteristics of the extracted footprints. It was also shown that the proportion of removed points is not decisive, what matters is their selection according to geometric relevance. Based on the results obtained, it can be concluded that the main objective of the article was achieved. It was systematically demonstrated that different cleaning methods have varying impacts on footprint extraction accuracy, and approaches ensuring robust results even in the presence of realistic classification errors were identified. The contribution of the article lies in the comprehensive integration of classification, cleaning, and footprint extraction, with particular attention given to the cleaning phase as a decisive processing step. The results have practical applications, particularly for creating accurate footprint layers in GIS, mapping urban structures, or applications such as Digital Twins. Future research could focus on expanding the analyzed set of objects, optimizing cleaning parameters, and integrating advanced methods, such as machine learning approaches or the combination of multiple spatial data sources.

Author Contributions

Conceptualization: Ľ.K., B.T., P.P., P.B. and O.T.; methodology: Ľ.K., B.T., P.P. and P.B.; software: Ľ.K., B.T., P.P. and J.L.; validation: Ľ.K., B.T., P.P., P.B., O.T. and J.L.; formal analysis: Ľ.K., B.T., P.P., P.B. and O.T.; investigation: Ľ.K. and P.B.; resources: Ľ.K., B.T. and P.P.; data curation: Ľ.K., B.T., P.P. and J.L.; writing—original draft preparation: Ľ.K., B.T., P.P., P.B. and O.T.; writing—review and editing: Ľ.K., B.T., P.P., P.B. and O.T.; visualization: Ľ.K., B.T. and P.P.; supervision: Ľ.K. and P.B. All authors have read and agreed to the published version of the manuscript.

Funding

This research was supported by the Slovak Research and Development Agency under contract KEGA grant no. 018TUKE-4/2026, 011TUKE-4/2024, grant no. APVV-18-0351 and Interreg grant #mountgreenfra—HUSK/2302/1.2/060.

Institutional Review Board Statement

Not applicable.

Informed Consent Statement

Not applicable.

Data Availability Statement

The raw data supporting the conclusions of this article will be made available by the authors on request.

Conflicts of Interest

The authors declare no conflicts of interest.

Abbreviations

The following abbreviations are used in this manuscript:
BIMBuilding Information Modeling
CPControl Point
FNFalse Negatives
FPFalse Positives
GCPGround Control Point
GISGeographic Information System
GNSSGlobal Navigation Satellite System
GTGround Truth
NRTKNetwork Real Time Kinematic
RMSERoot Mean Square Error
RTKReal-Time Kinematic
SLAMSimultaneous Localization and Mapping
TLSTerrestrial Laser Scanning
TPTrue Positives
UASUnmanned Aerial System

References

  1. Wagg, D.J.; Worden, K.; Barthorpe, R.J.; Gardner, P. Digital Twins: State-of-the-Art and Future Directions for Modeling and Simulation in Engineering Dynamics Applications. ASME J. Risk Uncertain. Part B 2020, 6, 030901. [Google Scholar] [CrossRef]
  2. Hananto, A.L.; Tirta, A.; Herawan, S.G.; Idris, M.; Soudagar, M.E.M.; Djamari, D.W.; Veza, I. Digital Twin and 3D Digital Twin: Concepts, Applications, and Challenges in Industry 4.0 for Digital Twin. Computers 2024, 13, 100. [Google Scholar] [CrossRef]
  3. Gawronek, P.; Kwinta, A.; Sajdak, K.; Koczwara, P. TLS in Sustainable Mining Engineering: 3D Convergence and Surface Changes in Chamber Excavation in CH Salt Mine “Wieliczka”. Mining 2025, 5, 15. [Google Scholar] [CrossRef]
  4. Matwij, W.; Gruszczyński, W.; Puniach, E.; Ćwiąkała, P. Determination of underground mining-induced displacement field using multi-temporal TLS point cloud registration. Measurement 2021, 180, 109482. [Google Scholar] [CrossRef]
  5. Štroner, M.; Urban, R.; Křemen, T.; Braun, J.; Michal, O.; Jiřikovský, T. Scanning the underground: Comparison of the accuracies of SLAM and static laser scanners in a mine tunnel. Measurement 2025, 242, 115875. [Google Scholar] [CrossRef]
  6. Zhang, R.; Li, H.; Liu, L.; Wu, M. A G-Super4PCS Registration Method for Photogrammetric and TLS Data in Geology. ISPRS Int. J. Geo-Inf. 2017, 6, 129. [Google Scholar] [CrossRef]
  7. Skowronek, E.; Brzezińska-Wójcik, T.; Kociuba, W. How to Create a Geocultural Site’s Content–Huta Różaniecka Case Study (SE Poland). Sustainability 2024, 16, 2193. [Google Scholar] [CrossRef]
  8. Wu, C.; Yuan, Y.; Tang, Y.; Tian, B. Application of Terrestrial Laser Scanning (TLS) in the Architecture, Engineering and Construction (AEC) Industry. Sensors 2022, 22, 265. [Google Scholar] [CrossRef]
  9. Bariczová, G.; Erdélyi, J.; Honti, R.; Tomek, L. Wall Structure Geometry Verification Using TLS Data and BIM Model. Appl. Sci. 2021, 11, 11804. [Google Scholar] [CrossRef]
  10. Erdélyi, J.; Kopáčik, A.; Kyrinovič, P. Spatial Data Analysis for Deformation Monitoring of Bridge Structures. Appl. Sci. 2020, 10, 8731. [Google Scholar] [CrossRef]
  11. Chen, J.L.; Li, H.B.; Jiang, N.; Chen, Q.; Yang, Y.C.; Zhou, J.W. Stability evaluation of shallow blocks in high and steep slope combining TLS and UAV photogrammetry. Geomat. Nat. Hazards Risk 2025, 16, 2464052. [Google Scholar] [CrossRef]
  12. Ismail, A.; Safuan, A.R.A.; Sa’ari, R.; Rasib, A.W.; Mustaffar, M.; Abdullah, R.A.; Kassim, A.; Yusof, N.M.; Rahaman, N.A.; Kalatehjari, R. Application of combined terrestrial laser scanning and unmanned aerial vehicle digital photogrammetry method in high rock slope stability analysis: A case study. Measurement 2022, 195, 111161. [Google Scholar] [CrossRef]
  13. Jones, L.; Hobbs, P. The Application of Terrestrial LiDAR for Geohazard Mapping, Monitoring and Modelling in the British Geological Survey. Remote Sens. 2021, 13, 395. [Google Scholar] [CrossRef]
  14. Ge, Y.; Tang, H.; Gong, X.; Zhao, B.; Lu, Y.; Chen, Y.; Lin, Z.; Chen, H.; Qiu, Y. Deformation Monitoring of Earth Fissure Hazards Using Terrestrial Laser Scanning. Sensors 2019, 19, 1463. [Google Scholar] [CrossRef]
  15. Wang, Z.; Butt, J.A.; Huang, S.; Medić, T.; Wieser, A. Dense 3D displacement estimation for landslide monitoring via fusion of TLS point clouds and embedded RGB images. Int. J. Appl. Earth Obs. Geoinf. 2026, 146, 105093. [Google Scholar] [CrossRef]
  16. Barbarella, M.; Di Benedetto, A.; Fiani, M.; Guida, D.; Lugli, A. Use of DEMs Derived from TLS and HRSI Data for Landslide Feature Recognition. ISPRS Int. J. Geo-Inf. 2018, 7, 160. [Google Scholar] [CrossRef]
  17. Bayrak, O.C.; Ma, Z.; Farella, E.M.; Remondino, F.; Uzar, M. Combining 3D Urban Objects from All Around the World to Improve Object Classification and Semantic Segmentation. PFG–J. Photogramm. Remote Sens. Geoinf. Sci. 2026, 94, 305–332. [Google Scholar] [CrossRef]
  18. Štroner, M.; Urban, R.; Suk, T. Filtering Green Vegetation Out from Colored Point Clouds of Rocky Terrains Based on Various Vegetation Indices: Comparison of Simple Statistical Methods, Support Vector Machine, and Neural Network. Remote Sens. 2023, 15, 3254. [Google Scholar] [CrossRef]
  19. Štroner, M.; Urban, R.; Línková, L. Color-Based Point Cloud Classification Using a Novel Gaussian Mixed Modeling-Based Approach versus a Deep Neural Network. Remote Sens. 2024, 16, 115. [Google Scholar] [CrossRef]
  20. Zhang, H.; Wang, C.; Yu, L.; Tian, S.; Ning, X.; Rodrigues, J. Pointgt: A method for point-cloud classification and segmentation based on local geometric transformation. IEEE Trans. Multimed. 2024, 26, 8052–8062. [Google Scholar] [CrossRef]
  21. Sarker, S.; Sarker, P.; Stone, G.; Gorman, R.; Tavakkoli, A.; Bebis, G.; Sattarvand, J. A comprehensive overview of deep learning techniques for 3D point cloud classification and semantic segmentation. Mach. Vis. Appl. 2024, 35, 67. [Google Scholar] [CrossRef]
  22. Wang, J.; Zhang, Y.; Zhang, B.; Xia, J.; Wang, W. IPFA-Net: Important Points Feature Aggregating Net for Point Cloud Classification and Segmentation. Chin. J. Electron. 2025, 34, 322–337. [Google Scholar] [CrossRef]
  23. Gui, B.; Bhardwaj, A.; Sam, L. Comparative analysis of different machine learning algorithms for urban footprint extraction in diverse urban contexts using high-resolution remote sensing imagery. J. Geogr. Sci. 2025, 35, 664–696. [Google Scholar] [CrossRef]
  24. Gashti, E.H.; Bahiraei, H.; Zoej, M.J.V.; Ghaderpour, E. Fusion of Aerial and Satellite Images for Automatic Extraction of Building Footprint Information Using Deep Neural Networks. Information 2025, 16, 380. [Google Scholar] [CrossRef]
  25. Li, Y.; Hong, D.; Li, C.; Yao, J.; Chanussot, J. HD-Net: High-resolution decoupled network for building footprint extraction via deeply supervised body and boundary decomposition. ISPRS J. Photogramm. Remote Sens. 2024, 209, 51–65. [Google Scholar] [CrossRef]
  26. Karsli, B.; Yilmazturk, F.; Bahadir, M.; Karsli, F.; Ozdemir, E. Automatic building footprint extraction from photogrammetric and LiDAR point clouds using a novel improved-Octree approach. J. Build. Eng. 2024, 82, 108281. [Google Scholar] [CrossRef]
  27. Kong, G.; Fan, H. PH-shape: An adaptive persistent homology-based approach for building outline extraction from ALS point cloud data. Geo-Spat. Inf. Sci. 2024, 27, 1107–1117. [Google Scholar] [CrossRef]
  28. Luo, L.; Cai, J.; Feng, B.; Tao, L. PDAA: An End-to-End Polygon Dynamic Adjustment Algorithm for Building Footprint Extraction. Remote Sens. 2025, 17, 2495. [Google Scholar] [CrossRef]
  29. Available online: https://slovenskovkocke.sk/ziar-nad-hronom (accessed on 15 January 2026).
  30. Available online: https://www.ziar.sk/ (accessed on 15 January 2026).
  31. Available online: https://www.geotech.sk/Produkty/GPS-GNSS/Leica-GS07.html (accessed on 15 January 2026).
  32. Available online: https://www.geotech.sk/downloads/Laserove-skenery-HDS/Leica_RTC360_sk2.pdf (accessed on 15 January 2026).
  33. Available online: https://www.geotech.sk/Produkty/Totalne-stanice/Geodeticke/Leica-TS15.html (accessed on 1 February 2026).
  34. Available online: https://www.geotech.sk/downloads/Totalne-stanice/TS11-15/VivaTS15-prospekt-SK.pdf (accessed on 1 February 2026).
  35. Luhmann, T.; Robson, S.; Kyle, S.; Boehm, J. Close-Range Photogrammetry and 3D Imaging; De Gruyter: Berlin, Germany; Boston, MA, USA, 2020. [Google Scholar] [CrossRef]
  36. Ciou, T.-S.; Lin, C.-H.; Wang, C.-K. Airborne LiDAR Point Cloud Classification Using Ensemble Learning for DEM Generation. Sensors 2024, 24, 6858. [Google Scholar] [CrossRef]
  37. Grilli, E.; Menna, F.; Remondino, F. A REVIEW OF POINT CLOUDS SEGMENTATION AND CLASSIFICATION ALGORITHMS. Int. Arch. Photogramm. Remote Sens. Spat. Inf. Sci. 2017, XLII-2/W3, 339–344. [Google Scholar] [CrossRef]
  38. Liu, J.-K.; Qin, R.; Arundel, S.T. Assessing the utility of uncrewed aerial system photogrammetrically derived point clouds for land cover classification in the Alaska North Slope. Photogramm. Eng. Remote Sens. 2024, 90, 405–414. [Google Scholar] [CrossRef]
  39. Ma, R.; Ge, X.; Zhu, Q.; Jia, X.; Jiang, H.; Chen, M.; Liu, T. Model-driven precise degradation analysis method of highway marking using mobile laser scanning point clouds. Photogramm. Eng. Remote Sens. 2023, 89, 245–258. [Google Scholar] [CrossRef]
  40. Balta, H.; Velagic, J.; Bosschaerts, W.; De Cubber, G.; Siciliano, B. Fast statistical outlier removal based method for large 3D point clouds of outdoor environments. IFAC-Pap. 2018, 51, 348–353. [Google Scholar] [CrossRef]
  41. Xie, T.; Zhu, J.; Wang, C.; Li, F.; Meng, Z. A Unified Denoising Framework for Restoring the LiDAR Point Cloud Geometry of Reflective Targets. Appl. Sci. 2025, 15, 3904. [Google Scholar] [CrossRef]
  42. Jiang, Y.; Weng, Q.; Speer, J.H.; Baker, S. Estimating Tree Frontal Area in Urban Areas Using Terrestrial LiDAR Data. Remote Sens. 2016, 8, 401. [Google Scholar] [CrossRef]
  43. Available online: https://www.cloudcompare.org/doc/wiki/index.php/Fit_2D_Polygon (accessed on 30 March 2026).
  44. Available online: https://pro.arcgis.com/en/pro-app/3.4/tool-reference/3d-analyst/regularize-building-footprint.htm (accessed on 30 March 2026).
  45. Chen, N.; Zhang, Z.; Chen, A. Comprehensive evaluation of classification: An empirical study on consequence prediction of construction accidents in China. Constr. Innov. 2024, 25, 1210–1230. [Google Scholar] [CrossRef]
  46. Wang, L.; Li, J.; Jiang, C.; Huang, J. Automatic Deformation Extraction Method of Buildings in Mining Areas Based on TLS Point Clouds. IEEE Access 2022, 10, 127817–127824. [Google Scholar] [CrossRef]
  47. Sharma, M.; Dev Garg, R. Building footprint extraction from aerial photogrammetric point cloud data using its geometric features. J. Build. Eng. 2023, 76, 107387. [Google Scholar] [CrossRef]
  48. Rottmann, P.; Haunert, J.-H.; Dehbi, Y. Automatic building footprint extraction from 3d laserscans. ISPRS Ann. Photogramm. Remote Sens. Spat. Inf. Sci. 2022, X-4/W2-2022, 233–240. [Google Scholar] [CrossRef]
  49. Heris, M.P.; Foks, N.L.; Bagstad, K.J.; Troy, A.; Ancona, Z.H. A rasterized building footprint dataset for the United States. Sci. Data 2020, 7, 207. [Google Scholar] [CrossRef]
Figure 1. Location of the study area and the three selected buildings.
Geomatics 06 00056 g001
Figure 2. Example of GCP placement for the Leica RTC360 terrestrial laser scanner (a), example of the CPs used—natural signalization (b).
Geomatics 06 00056 g002
Figure 3. Distribution of TLS stations—blue dots.
Geomatics 06 00056 g003
Figure 4. Total station Leica Viva TS 15 I.
Geomatics 06 00056 g004
Figure 5. Basic phases of the classification process.
Geomatics 06 00056 g005
Figure 6. Formalized workflow for point cloud cleaning and building footprint extraction.
Geomatics 06 00056 g006
Figure 7. Resulting point clouds of the three selected buildings obtained using the TLS method.
Geomatics 06 00056 g007
Figure 8. Evaluation of point cloud classification for the apartment building in the software used.
Geomatics 06 00056 g008
Figure 9. Comparison of building footprints derived from point clouds in different software.
Geomatics 06 00056 g009
Figure 10. Proportion of removed points for individual point cloud cleaning methods.
Geomatics 06 00056 g010
Figure 11. Comparison of apartment building footprints after applying point cloud cleaning methods.
Geomatics 06 00056 g011
Figure 12. Comparison of garage footprints after applying point cloud cleaning methods.
Geomatics 06 00056 g012
Figure 13. Comparison of industrial building footprints after applying point cloud cleaning methods.
Geomatics 06 00056 g013
Table 1. Selected technical parameters of Leica GS07 set [31].
GNSS TechnologyLeica RTKplus
Weight2.85 kg
Number of channels320
SmartCheckContinuous check of RTK solution
Accuracy RTKStatic and rapid static (phase)Horizontal: 5 mm + 0.5 ppm
Vertical: 10 mm + 0.5 ppm
Table 2. Technical parameters of the Leica RTC360 [32].
SpecificationGeomatics 06 00056 i001
Leica RTC360
Technology3D ToF enhanced by WFD technology laser scanner with an integrated system for capturing HDR panoramic images and a VIS system for registering data clouds in real time
MobilityTerrestrial (placed on a tripod)
Weight5.35 kg (without batteries)
Range0.5 m–130 m
Waterproof/dustproofIP54
Operating temperature−5 °C to +40 °C
Dimensions120 mm × 240 mm × 230 mm
GNSSExternal GNSS set with RTK module
Scanning point frequencyUp to 2,000,000 pts/s
AccuracyAngular: 18″
Distance:
1.0 mm + 10 ppm
3D points:
1.9 mm @ 10 m
2.9 mm @ 20 m
5.3 mm @ 40 m
Resolution3/6/12 mm @ 10 m
Field of view360° × 300°
Camera36 MPx 3-camera system 432 MPx raw data for calibrated panoramic 360° × 300° image
Table 3. Technical parameters of the Leica Viva TS 15 I [33,34].
Geomatics 06 00056 i002Operating SystemWindows CE 6.0
Keyboard and Display2× display (640 × 480 pixel) with 36 keys
BatteryLithium Ion (operating Time 5–8 h)
Temperature range−20 °C to +50 °C
Waterproof/dustproofIP55
Memory devicesUSB, SD card
Angular Measurement1″ (0.3 mgon)
Distance MeasurementPrismRound prism (GPR1)3500 m
360° prism (GRZ4, GRZ122)2000 m
Accuracy1 mm + 1.5 ppm
Measurement Time0.8 s
PrismlessRange R10001000 m
Accuracy2 mm + 2 ppm
Measurement Time3 s
Table 4. Parameters of the resulting point cloud for the TLS method.
ResultsTLS
Leica RTC360
Number of stations66
GCPs/CPs86/68
Resulting point cloud1,511,379,486
Area [m2]28,000
Bundle Error [m]0.009
Cloud to Cloud [m]0.009
Overlap [%]40
Strength [%]78
RMSE on GCPs [m]0.016
Measurement time [h]5
Table 5. Comparison of the number of points of classified objects against reference data in the applied software tools.
Reference (Manual)Leica Cyclone 3DRΔ [%]Trimble RealWorksΔ [%]Lidar360Δ [%]
Apartment building31,037,90531,189,580+0.4930,006,464−3.3231,603,395+1.82
Garage1,865,9352,059,887+10.392,173,651+16.492,059,394+10.36
Industrial building3,395,4983,800,018+11.913,688,780+8.633,868,036+13.92
Table 6. Quantitative evaluation of classification results.
SoftwareBuildingTPFPFNPrecisionRecallFscore
Leica Cyclone 3DRApartment building30,929,791259,789108,1140.9910.9960.994
Garage1,710,397349,490155,5380.8300.9170.871
Industrial building3,364,901435,11730,5970.8850.9910.935
Trimble RealWorksApartment building29,318,969687,4951,718,9360.9770.9450.961
Garage1,861,644312,00742910.8560.9980.922
Industrial building3,302,263386,51793,2350.8950.9730.932
Lidar360Apartment building30,901,914701,481135,9910.9780.9960.987
Garage1,858,567200,82773680.9030.9960.947
Industrial building3,387,358480,67881400.8760.9980.933
Table 7. Evaluation of the accuracy of building footprint parameters in the applied software.
ReferenceAutomatic + Manual ClassificationLeica Cyclone 3DRTrimble
RealWorks
Lidar360
Apartment building
Area [m2]705.9830.31052.4854.6948.0
Perimeter [m]137.4143.5166.2154.2244.6
Number of corner points44221948
Centroid shift [m] 0.42100.4550.4520.251
Hausdorff distance [m] 1.514.013.244.32
Garage
Area [m2]143.0144.7189.4179.2162.2
Perimeter [m]56.156.360.659.464.7
Number of corner points44444
Centroid shift [m] 0.0170.1410.1320.179
Hausdorff distance [m] 0.221.111.030.80
Industrial building
Area [m2]148.2156.3215.6164.0209.2
Perimeter [m]65.766.587.767.598.8
Number of corner points1212181214
Centroid shift [m] 0.0080.6590.1960.392
Hausdorff distance [m] 0.224.710.493.79
Table 8. Evaluation of the accuracy of building footprint parameters for the apartment building after applying point cloud cleaning methods.
Apartment Building
ReferenceWithout CleaningStatistical Outlier RemovalNoise FilterLabel Connected Components
Leica Cyclone 3DR
Area [m2]705.91052.4853.6936.5846.4
Perimeter [m]137.4166.2148.5152.7144.2
Number of corner points422684
Centroid shift [m] 0.4550.0770.3580.409
Hausdorff distance [m] 4.012.133.061.95
Trimble Realworks
Area [m2]705.9854.6833.8830.7800.2
Perimeter [m]137.4154.2154.1155.6141.4
Number of corner points41916164
Centroid shift [m] 0.4520.7500.6060.351
Hausdorff distance [m] 3.243.133.111.15
Lidar360
Area [m2]705.9948.0923.2935.7902.0
Perimeter [m]137.4244.6149.9151.3147.1
Number of corner points448664
Centroid shift [m] 0.2510.5340.3390.627
Hausdorff distance [m] 4.322.792.742.79
Table 9. Evaluation of the accuracy of building footprint parameters for the garage after applying point cloud cleaning methods.
Garage
ReferenceWithout CleaningStatistical Outlier RemovalNoise FilterLabel Connected Components
Leica Cyclone 3DR
Area [m2]143.0189.4173.3189.0170.5
Perimeter [m]56.160.660.161.559.4
Number of corner points44444
Centroid shift [m] 0.1410.2120.2750.104
Hausdorff distance [m] 1.111.121.430.94
Trimble Realworks
Area [m2]143.0179.2155.0162.8173.3
Perimeter [m]56.159.458.058.759.3
Number of corner points44444
Centroid shift [m] 0.1320.0980.2180.047
Hausdorff distance [m] 1.030.580.770.86
Lidar360
Area [m2]143.0162.2155.0160.0155.0
Perimeter [m]56.164.758.059.458.0
Number of corner points44444
Centroid shift [m] 0.1790.1460.1780.113
Hausdorff distance [m] 0.800.570.790.52
Table 10. Evaluation of the accuracy of building footprint parameters for the industrial building after applying point cloud cleaning methods.
Industrial Building
ReferenceWithout CleaningStatistical Outlier RemovalNoise FilterLabel Connected Components
Leica Cyclone 3DR
Area [m2]148.2215.6164.9211.4164.4
Perimeter [m]65.787.786.387.567.8
Number of corner points1218291612
Centroid shift [m] 0.6590.2500.7220.117
Hausdorff distance [m] 4.714.624.650.99
Trimble Realworks
Area [m2]164.0159.5162.4162.1164.0
Perimeter [m]67.566.867.867.267.5
Number of corner points1212121212
Centroid shift [m]0.1960.0700.1870.3010.196
Hausdorff distance [m] 0.490.470.571.49
Lidar360
Area [m2]148.2209.2193.2199.3172.6
Perimeter [m]65.798.880.791.668.3
Number of corner points1214233412
Centroid shift [m] 0.3920.5020.2280.246
Hausdorff distance [m] 3.792.893.670.89
Disclaimer/Publisher’s Note: The statements, opinions and data contained in all publications are solely those of the individual author(s) and contributor(s) and not of MDPI and/or the editor(s). MDPI and/or the editor(s) disclaim responsibility for any injury to people or property resulting from any ideas, methods, instructions or products referred to in the content.