Article

Deep Learning and Multiview-Based Detection of Scatterable PFM-1 Landmines: Performance, Out-of-Sample Evaluation, and Field Readiness


1
Departments of Geography and Geology, Binghamton University, Binghamton, NY 13902, USA
2
Department of Earth Sciences, Binghamton University, Binghamton, NY 13902, USA
*
Author to whom correspondence should be addressed.
Geomatics 2026, 6(3), 54; https://doi.org/10.3390/geomatics6030054
Submission received: 19 March 2026 / Revised: 27 April 2026 / Accepted: 12 May 2026 / Published: 19 May 2026

Highlights

What are the main findings?
  • The use of optical imagery combined with YOLO-based deep learning can detect surface-laid landmines across various fall and winter environments.
  • The field-ready deep learning model must undergo rigorous blind testing or out-of-sample (OOS) testing, which suggests the potential for significant performance drops that were not present in the validation and testing of the model.
What are the implications of the main findings?
  • These object detection models can be deployed on edge devices for a non-technical survey in resource-limited post-conflict humanitarian demining operations.
  • Without OOS testing, the deep learning model risks overestimating field performance.

Abstract

The detection and classification of scatterable landmines present a significant challenge for humanitarian demining, particularly in resource-constrained regions. This paper evaluates the use of a deep learning-based strategy using RGB imagery and the YOLOv11 algorithm to detect the most commonly deployed PFM-1 landmines, with the overarching goal of applying this approach to the broad category of scatterable landmines. RGB image-based YOLOv11 detection showed strong precision (78–91%) and recall (76–88%) against validation data for several model variants. Additionally, 3D-printed, paint-matched replicas of PFM-1 landmines were used provisionally as part of out-of-sample (OOS) testing to assess the realistic value of this methodology in the field, along with an inert PFM-1 mine. This demonstrated the potential for 3D-printed replicas to be used as part of the training and assessment process due to their low-cost, scalable, and safe approach, highlighting strong precision (74–80%) but weaker recall (14–24%). Additional edge deployment was tested using the model to demonstrate its capability in locating a minefield using trigonometric relationships and kernel density relationships, further supporting this method in non-technical, first-pass landmine sweeps. These results demonstrate that OOS evaluation is critical in humanitarian demining research to ensure that detection systems are truly field-ready and operationally reliable. This study provides a replicable workflow for deep learning tasks related to surface-laid landmines that can be deployed on edge devices for use in non-technical surveys.

1. Introduction

Today, over 80 countries are contaminated with landmines [1], a crisis that continues to claim victims and inflict long-term, cyclical, physical, psychological, environmental, and economic harm on civilian populations [2,3,4]. Civilian casualties accounted for 84% of landmine casualties in 2024 alone, with nearly half of them children, mostly concentrated in Syria, Myanmar, and Ukraine [5]. Further exacerbating the landmine crisis is the unfortunate reality that the increase in landmine deployment is not matched by the pace of conventional landmine detection and clearance. Geophysical, biological, and direct contact methods form the cornerstone of modern landmine detection workflows in humanitarian mine action (HMA). Despite their general reliability and long history of deployment, these methods are often costly in terms of required resources and time commitments [6,7,8]. While traditional techniques work well in limited-area organized minefields, characteristic of early- to mid-20th-century large-scale armed conflicts, they are particularly ill-suited for detecting disorganized mine fields or single mine emplacements over wide areas, especially in areas where vegetation or varied terrain reduce visibility and sensor efficacy [9].
Light-weight scatterable plastic landmines that are specifically designed to be deployed over wide areas and avoid detection are of particular concern in post-conflict nations where national HMA resources are limited, and landmine contamination is present over wide areas [10]. The PFM-1 mine and its PFM-1S subvariant have become emblematic of the scatterable landmine concern due to their unique “butterfly” shape (Figure 1) and widescale indiscriminate use across multiple conflict zones. The PFM-1S mine has a self-destruct function that has been shown to consistently fail [11], and both variants were initially designed to be deployed rapidly over large areas by artillery, aircraft, or specialized ground-based dispersal systems. Unlike traditionally buried mines, these devices remain on the surface or shallowly embedded. By design, the PFM-1 was meant to have a limited dispersion radius, guided by the ballistic trajectory of its cassette, which was, in turn, determined by the type of artillery or rocket system used for dispersion. However, recent technological developments driven by the full-scale conflict in Ukraine have paired the PFM-1 with drone delivery systems, without the need for cassettes. This shift has dramatically increased the long-term risk to both combatants and civilians, as it has removed the maximum ballistic boundaries previously used in mapping PFM-1 minefields [11].
Since plastic mines are less detectable by standard metal detectors, they often remain active long after conflict zones have been declared safe, leading to ongoing accidents and injuries. The unpredictability of their placement and the absence of accurate minefield maps make these “weapons of mass destruction in slow motion” [12] as Strada (1996) described them. Critically, traditional methods of HMA surveying, described in the next section, are less effective in addressing PFM-1 and analogous scatterable landmine contamination and may, in fact, be hampered by the presence of landmines. As a response to these limitations, automated uncrewed aerial vehicle (UAV) surveys have emerged as a critical auxiliary tool in the remote detection of PFM-1 and similar scatterable landmines.

Literature Overview

This section examines the evolution from traditional to modern landmine detection methods to emphasize the innovation and technological advancements in the field. This includes a brief overview of the methods that have been used to detect highly metallic landmines in more recent studies, focusing on the use of computer vision tasks and optical sensors. Additional focus is given to innovations in addressing data scarcity issues due to the limited availability of inert landmines for model learning tasks, supporting existing studies that utilize optical and single-pass deep learning models, and novelty in the approach to object detection in HMA, positioning this study as applicable to real-world scenarios.
Electromagnetic induction (EMI) surveying is a core geophysical method of HMA, capable of pinpointing subtle variations in the subsurface electrical properties, which may indicate buried metallic ordnance and landmines. In tandem with standard EMI surveys, alternative geophysical techniques such as Ground Penetrating Radar (GPR) and magnetometry have demonstrated effectiveness as auxiliary tools in landmine detection [13,14]. These tools can be supplemented with biological detection methods using trained animals or bacteria [15]; however, ground-based geophysical techniques are significantly less effective for low-metal or plastic mines, which are designed to evade traditional detection signals. As small, scatterable, non-metallic landmines that are often deployed irregularly become increasingly prevalent, traditional terrestrial surveys face reduced detection performance and slow clearance progress relative to continued contamination.
As the dangers of remotely detonated landmines and improvised explosive devices (IEDs) came into focus with the emergence of proximity sensor and wireless communication technologies, several studies focused on the use of remote sensing technology as a promising supplemental approach to landmine detection and classification. In the context of HMA, where safety, scalability, and accuracy are critical, remote sensing provides a compelling additional level of decision-enabling data to complement traditional survey techniques. Recent advances in UAVs have introduced promising alternatives to traditional surveying methods by improving access, efficiency, and operator safety [16]. UAV-mounted optical, thermal, multispectral, and radar sensors have shown varied success in detecting plastic landmines, though their real-world effectiveness remains contingent on environmental complexity and operational constraints. UAV-GPR systems have shown their potential in characterizing internal components of buried mines but suffer from reduced performance in heterogeneous soils with small scatterable landmines with minimal to no metallic construction, like the PFM-1 [17]. UAV synthetic aperture radar (SAR) systems have achieved centimeter-scale imaging under controlled testing conditions, yet are limited by short endurance and sensitivity to terrain interfaces [18]. Efforts using thermal imaging show the early-morning detectability of plastic PFM-1-type mines but rely on narrow diurnal windows and simplified terrain [10]. Multispectral and hyperspectral approaches expand detection capabilities, but spectral similarity between mines and natural substrates often leads to diminished reliability and requires expensive, data-intensive workflows [19,20,21]. Polarization-based detection shows promise in vegetated environments but requires further validation for UAV-based operational use [22], while lidar-assisted tomography methods entail extensive computational, trained personnel, and equipment costs, making them inaccessible in post-conflict regions [23].
Innovations in deep learning, a branch of machine learning that utilizes complex patterns like human neural networks to identify change [24], is a learning algorithm that is emerging as a low-cost alternative capable of supporting wide-area reconnaissance and initial area reduction using easily accessible sensors equipped with optical cameras in HMA. Convolutional neural networks (CNNs) and object detection architectures have achieved high precision in controlled UAV surveys identifying PFM-1 mines and their casings, though performance remains sensitive to training data diversity, environmental variability, and image preprocessing choices [25]. While network architectures provide foundational support in detecting the PFM-1, as Saprykin states, concrete conclusions on the effectiveness of a particular network are short-lived [26]. Perception systems that integrate the necessary framework for models to interact and learn from incoming data typically work with the assumption that the input data contains sufficient perceptual detail. In the realm of landmine decontamination, operators preserve incoming data as the initial data to extract information, not focus on emphasizing the data integrity or what should be kept. As such, this study seeks to examine the use of single-frame imagery and its effect in earlier stages of the perception pipeline on retaining the fine-scale features critical for deployed model performance on edge devices [26]. As high-resolution UAV-borne imaging systems and robotic platforms continue to advance, integrating automated object detection workflows offers the potential to accelerate the identification of surface-scattered hazards while reducing risk to personnel. However, further research is required to ensure generalizable performance across complex landscapes, enhance low-metal mine detection, and reduce reliance on costly or specialized sensing technologies.
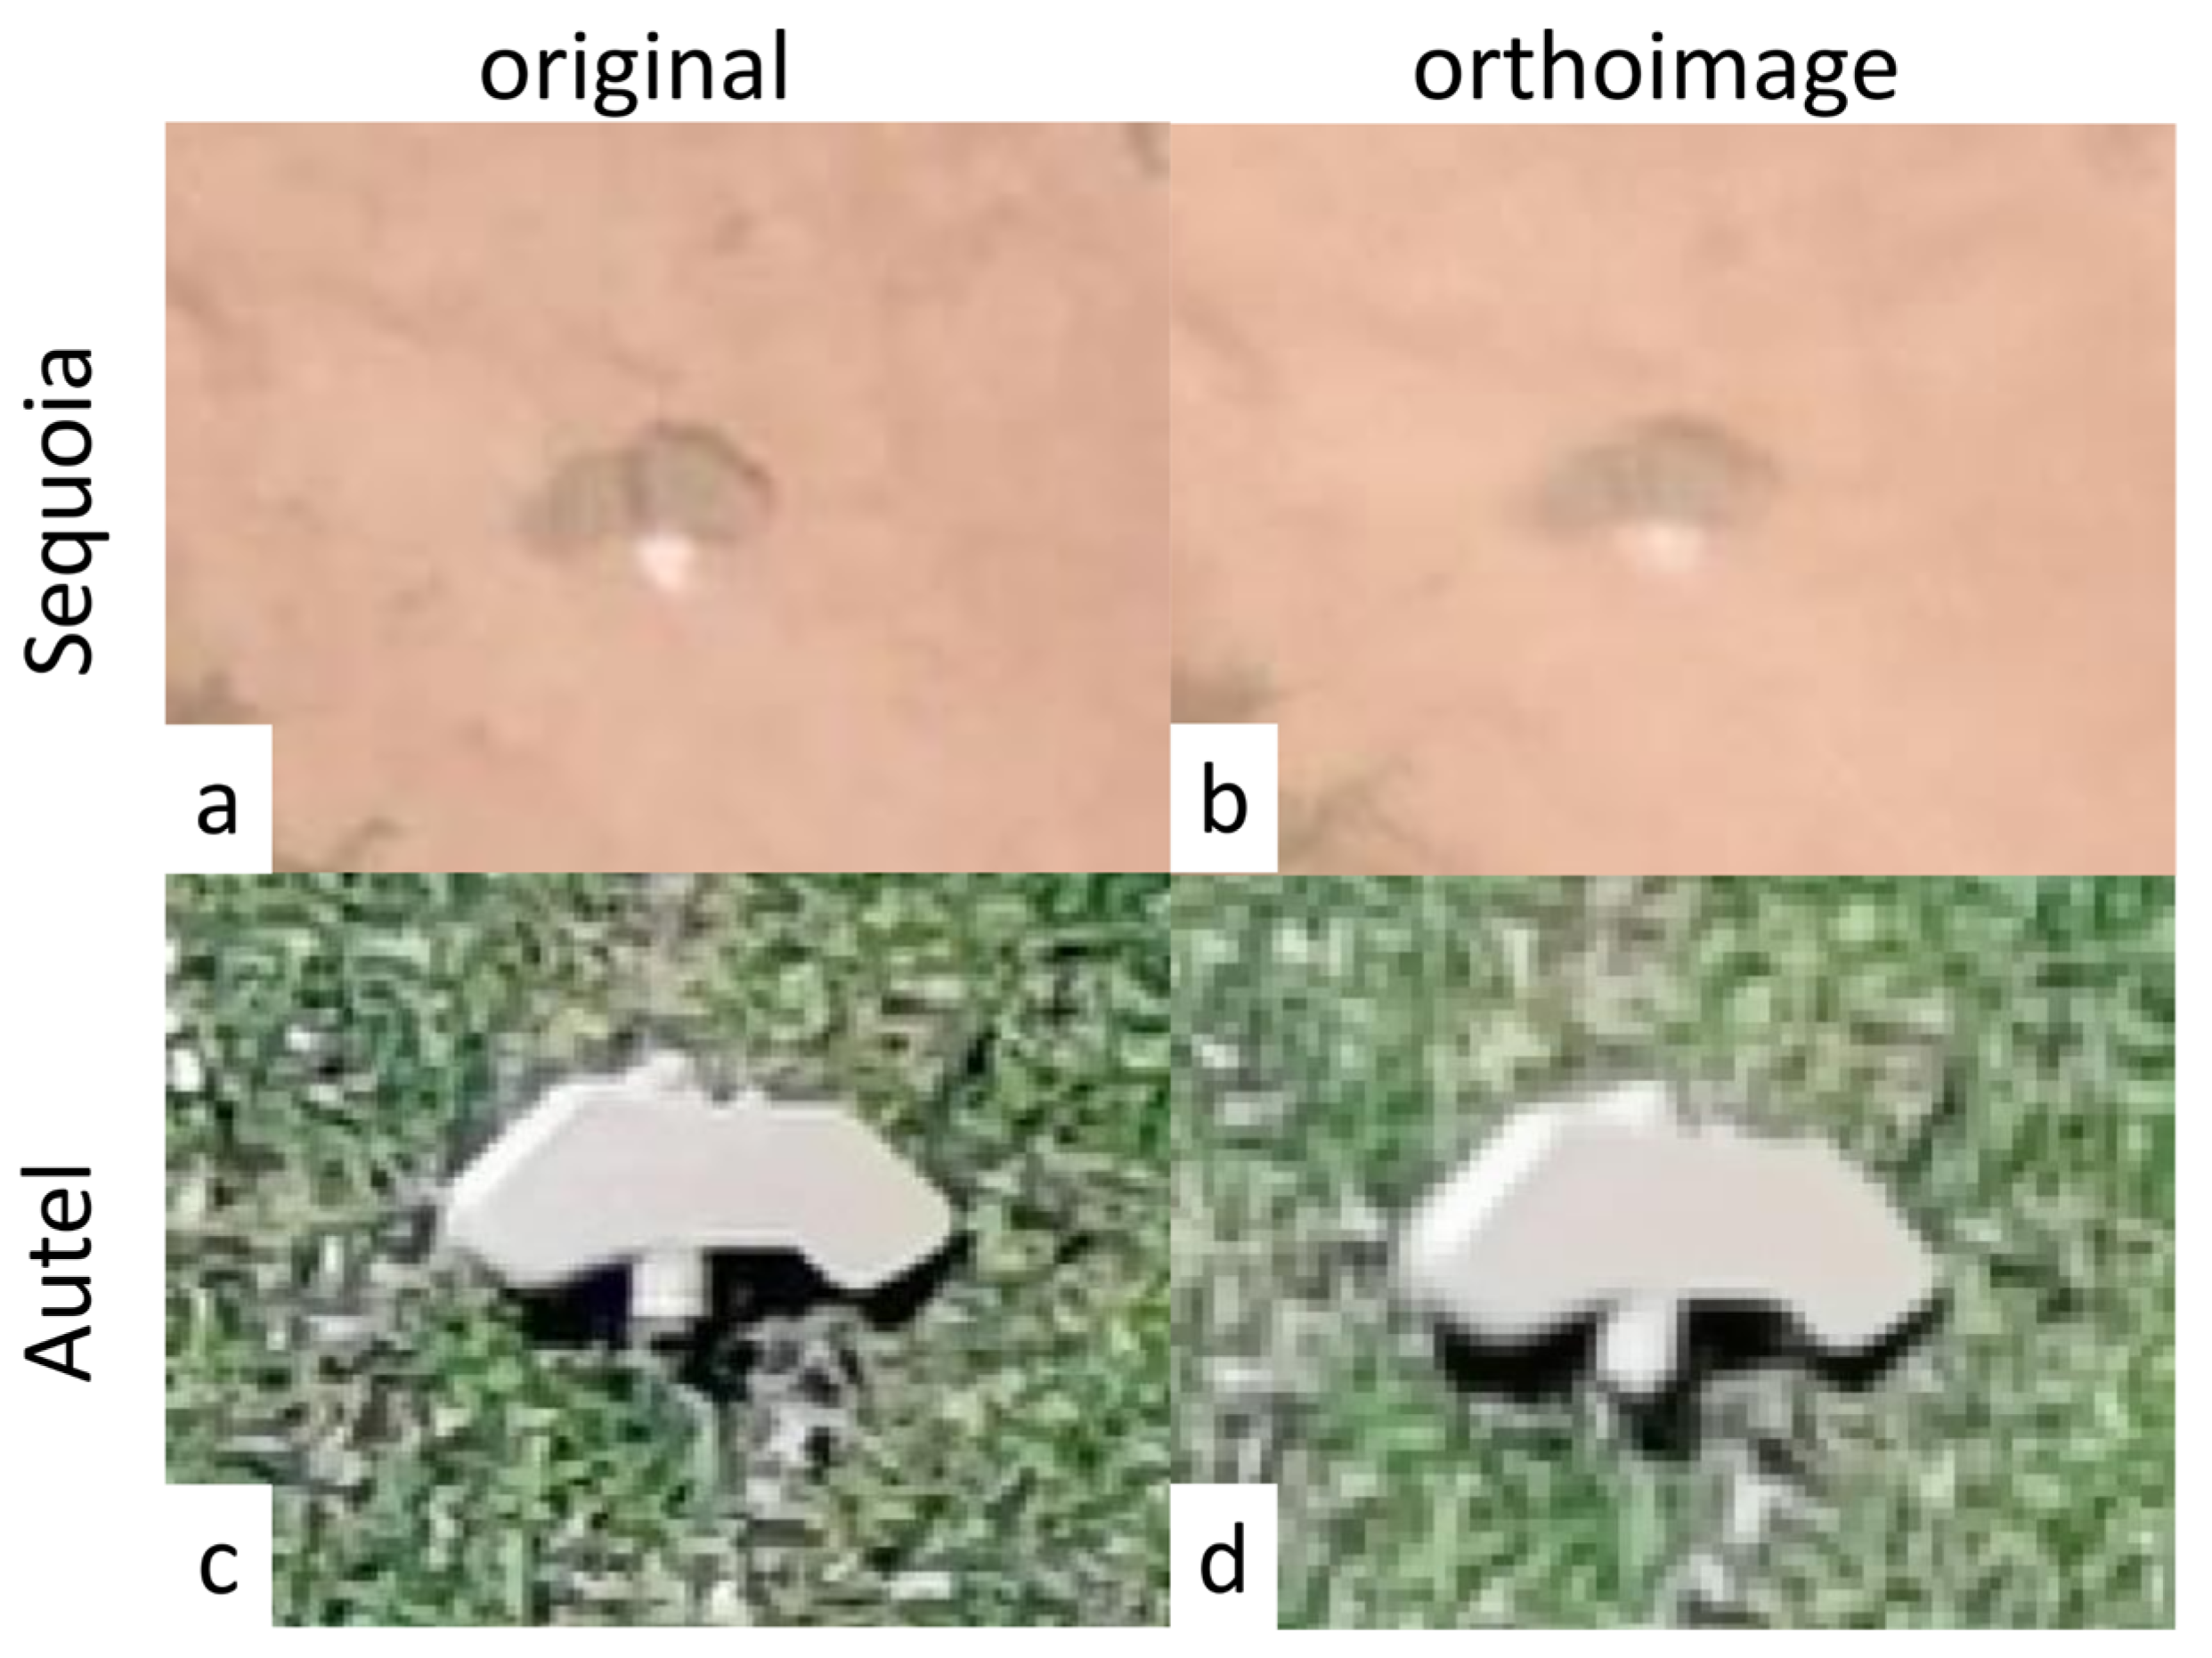
In geographic contexts, deep learning is often applied to orthoimagery, which has been created as part of a Structure from Motion (SfM) 3D reconstruction using specialized software (e.g., Pix4D, Agisoft, OpenDroneMap, Esri’s Drone2Map), where large orthoimages are tiled into a large number of overlapping “chips” for training, validation, and detection [27,28,29]. However, application to individual input or “multiview” images rather than orthoimagery has been shown to improve detection accuracy, especially when targets are small and can be occluded [30,31]. Orthophotos generated from drone imagery represent the synthesis of many photos and can feature image artifacts known as “ghosting”, blurring, and lower effective pixel resolution (Figure 2), which makes training and detection more error-prone for smaller objects such as the PFM-1, which may only occupy a small number of pixels [32,33,34].
In this context, this study examines the viability of a low-cost scalable detection workflow using commercially available UAVs and sensors equipped with optical sensors paired with a single-pass deep learning architecture for resource-limited communities. In an effort to leverage the scatterable PFM-1 mine’s unique shape for optical detection, an approach that used the You Only Look Once (YOLO) convolutional neural network (CNN) algorithm was applied to individual high-resolution RGB images. While similar approaches have been used in computer vision tasks, such as R-CNN, which requires a two-stage approach, the YOLO methodology is advantageous in its ability to use a unified single-pass approach to predict class probabilities and bounding boxes, reducing the computational cost and time [35]. The model’s performance was tested using out-of-sample (OOS) imagery to evaluate robustness, terrain types, and lighting conditions using an inert PFM-1 mine and paint-matched 3D-printed replicas.
Similar work conducted by Vivoli et al. developed a real-time optical and deep learning-based system for detecting surficial landmines using a mobile robotic platform equipped with an iPhone 13 Pro camera and a YOLOv8 model [36]. The model was trained and tested on PFM-1 and PMA-2 mines across varied terrain, weather, and slope conditions, with performance evaluated through four key metrics including precision, recall, mean average precision (mAP), and F1 score. Results demonstrated high detection accuracy, though performance decreased in heterogeneous environments, where terrain color and texture interfered with identification. The authors emphasized the approach’s scalability to aerial platforms and its feasibility for low-cost deployment in operational contexts. Additional results published by Saprykin demonstrated YOLOv8’s detection ability in limited antipersonnel and anti-tank optical datasets in Ukraine and included data augmentation to increase the data’s sample size. However, this study was constrained by the available data and lack of OOS testing [37].
While landmine detection technology evolves, data scarcity remains a real problem. Many authors cite the use of training landmines that are donated or bought from third parties to conduct their studies. This limitation provides an opportunity to innovate methods and enhance current studies. Kunichik provides an analysis of 3D-printed replicas of the five most common landmines that are used in Ukraine, including the PFM-1 [38]. Their work calculated the detection of replicas and real landmines in terms of the output metric of the precision to be 98.4% and 91.0%, respectively, and 98.6% recall for 3D-printed replicas compared to 79.1% for real landmines, emphasizing the need to continue to improve this innovation. This paper proposes the use of 3D-printed, paint-matched replicas of the PFM-1 mine based on existing data and dimensions from an inert PFM-1 mine to enhance the existing literature, addressing this data scarcity problem.
This research seeks to answer the following questions:
  • Can high-resolution RGB imagery that is processed through a deep learning model accurately identify PFM-1 mines in post-conflict regions?
  • What are the strengths and limitations of using individual georeferenced images in landmine detection workflows?
By addressing these questions, this work contributes to a broader understanding of how remote sensing can assist in creating a field-adaptable framework for detecting scatterable surface-level mines. While this study does not propose a complete operational solution, it offers an important standardized workflow that illustrates the growing potential of UAV-based remote sensing for humanitarian demining.
The framework of this study was based on the standards set by the International Mine Action Standards (IMAS) committee, which is committed to providing clear, safe guardrails in humanitarian demining and as such, sets guidelines that organizations should consider [32]. Broadly, the IMAS outline five main categories that national and regional demining organizations should consider in the process of land clearance: explosive risk education, surveying, marking, and clearance, victim assistance, stockpile destruction, and advocacy [32].
The research conducted in this study aligns best with the surveying, marking, and clearance category of the IMAS. Further clarification provided by the IMAS defines surveys as either technical surveys (TSs) or non-technical surveys (NTSs), where each process iteratively adds to the land release workflow. A technical survey is explicitly considered an intrusive process, where the marking, surveying, and clearance happens in confirmed or suspected hazardous areas [33], whereas a non-technical survey aims to provide a starting point for assessment of the area [34]. This includes assessment in the office and field, obtaining any historical documents related to the area and speaking with knowledgeable community members, supporting the findings of where explosive ordnance can and cannot be located in the field. As such, this study focuses on serving as a first-pass method to assess and determine the potential spatial extents of Explosive Ordnance (EO) in the field. It is well suited for edge devices, where real-time detection occurs in the field while the drone is still in the air, as explicitly outlined in [39,40,41] for the purpose of non-technical surveys, to contribute to efficient and effective planning of subsequent technical interventions.

2. Materials and Methods

2.1. Model Determination

Model training was conducted using two different computers. Initially, training and validation were performed on a system equipped with an Intel® Core™ i9-10980XE processor with CPU @ 3.00 GHz, an installed RAM of 256 GB, a 4 TB PS drive, an 18 TB data drive, and an NVIDIA RTXA2000 GPU. As the dataset expanded, training was transferred to an AMD Ryzen Threadripper 7980X processor with 64 cores and an ASUS Pro WS TRX50-SAGE motherboard, with 512 GB of installed RAM, an 8 TB SSD OS drive, 2 × 8 SSDs, an 18 TB HDD, and an NVIDIA GeForce RTX 4090 GPU to speed up training. Object detection modeling was conducted using the You Only Look Once (YOLO) architecture, version 11x [35,36]. This version was selected due to its performance, retaining innovative capabilities introduced in the earlier version YOLOv8 with semantic segmentation, oriented object detection, and pose estimation and scalability, whilst improving the feature extraction blocks, migrating from the C2f block to the C3k2 block, and introducing the Cross Stage Partial with Spatial Attention (C2PSA), increasing the accuracy in detecting overlapping and small objects and lowering the computational cost when compared to the C3 block [42]. Additional benchmark testing using an industry-standard Microsoft Common Objects in Context (COCO) dataset demonstrated the YOLO architecture’s capability in terms of the industry standards, with its current ranking of number 15 and a mean Average Precision of 53.6. Model runs were conducted using Python version 3.11.11, torch-2.5.1, and Ultralytics version 8.3.78. The hyperparameters for tuning the YOLO model included 50 epochs or iterations throughout the entire dataset for training, a batch size of -1 to allow the model to initialize memory usage, an input image size of 640 × 640, a threshold of detection set to 0.3 (30%) or above for detecting labeled objects within scenes, and a learning rate of 0.01, which specifies how fast the model updates its weights.
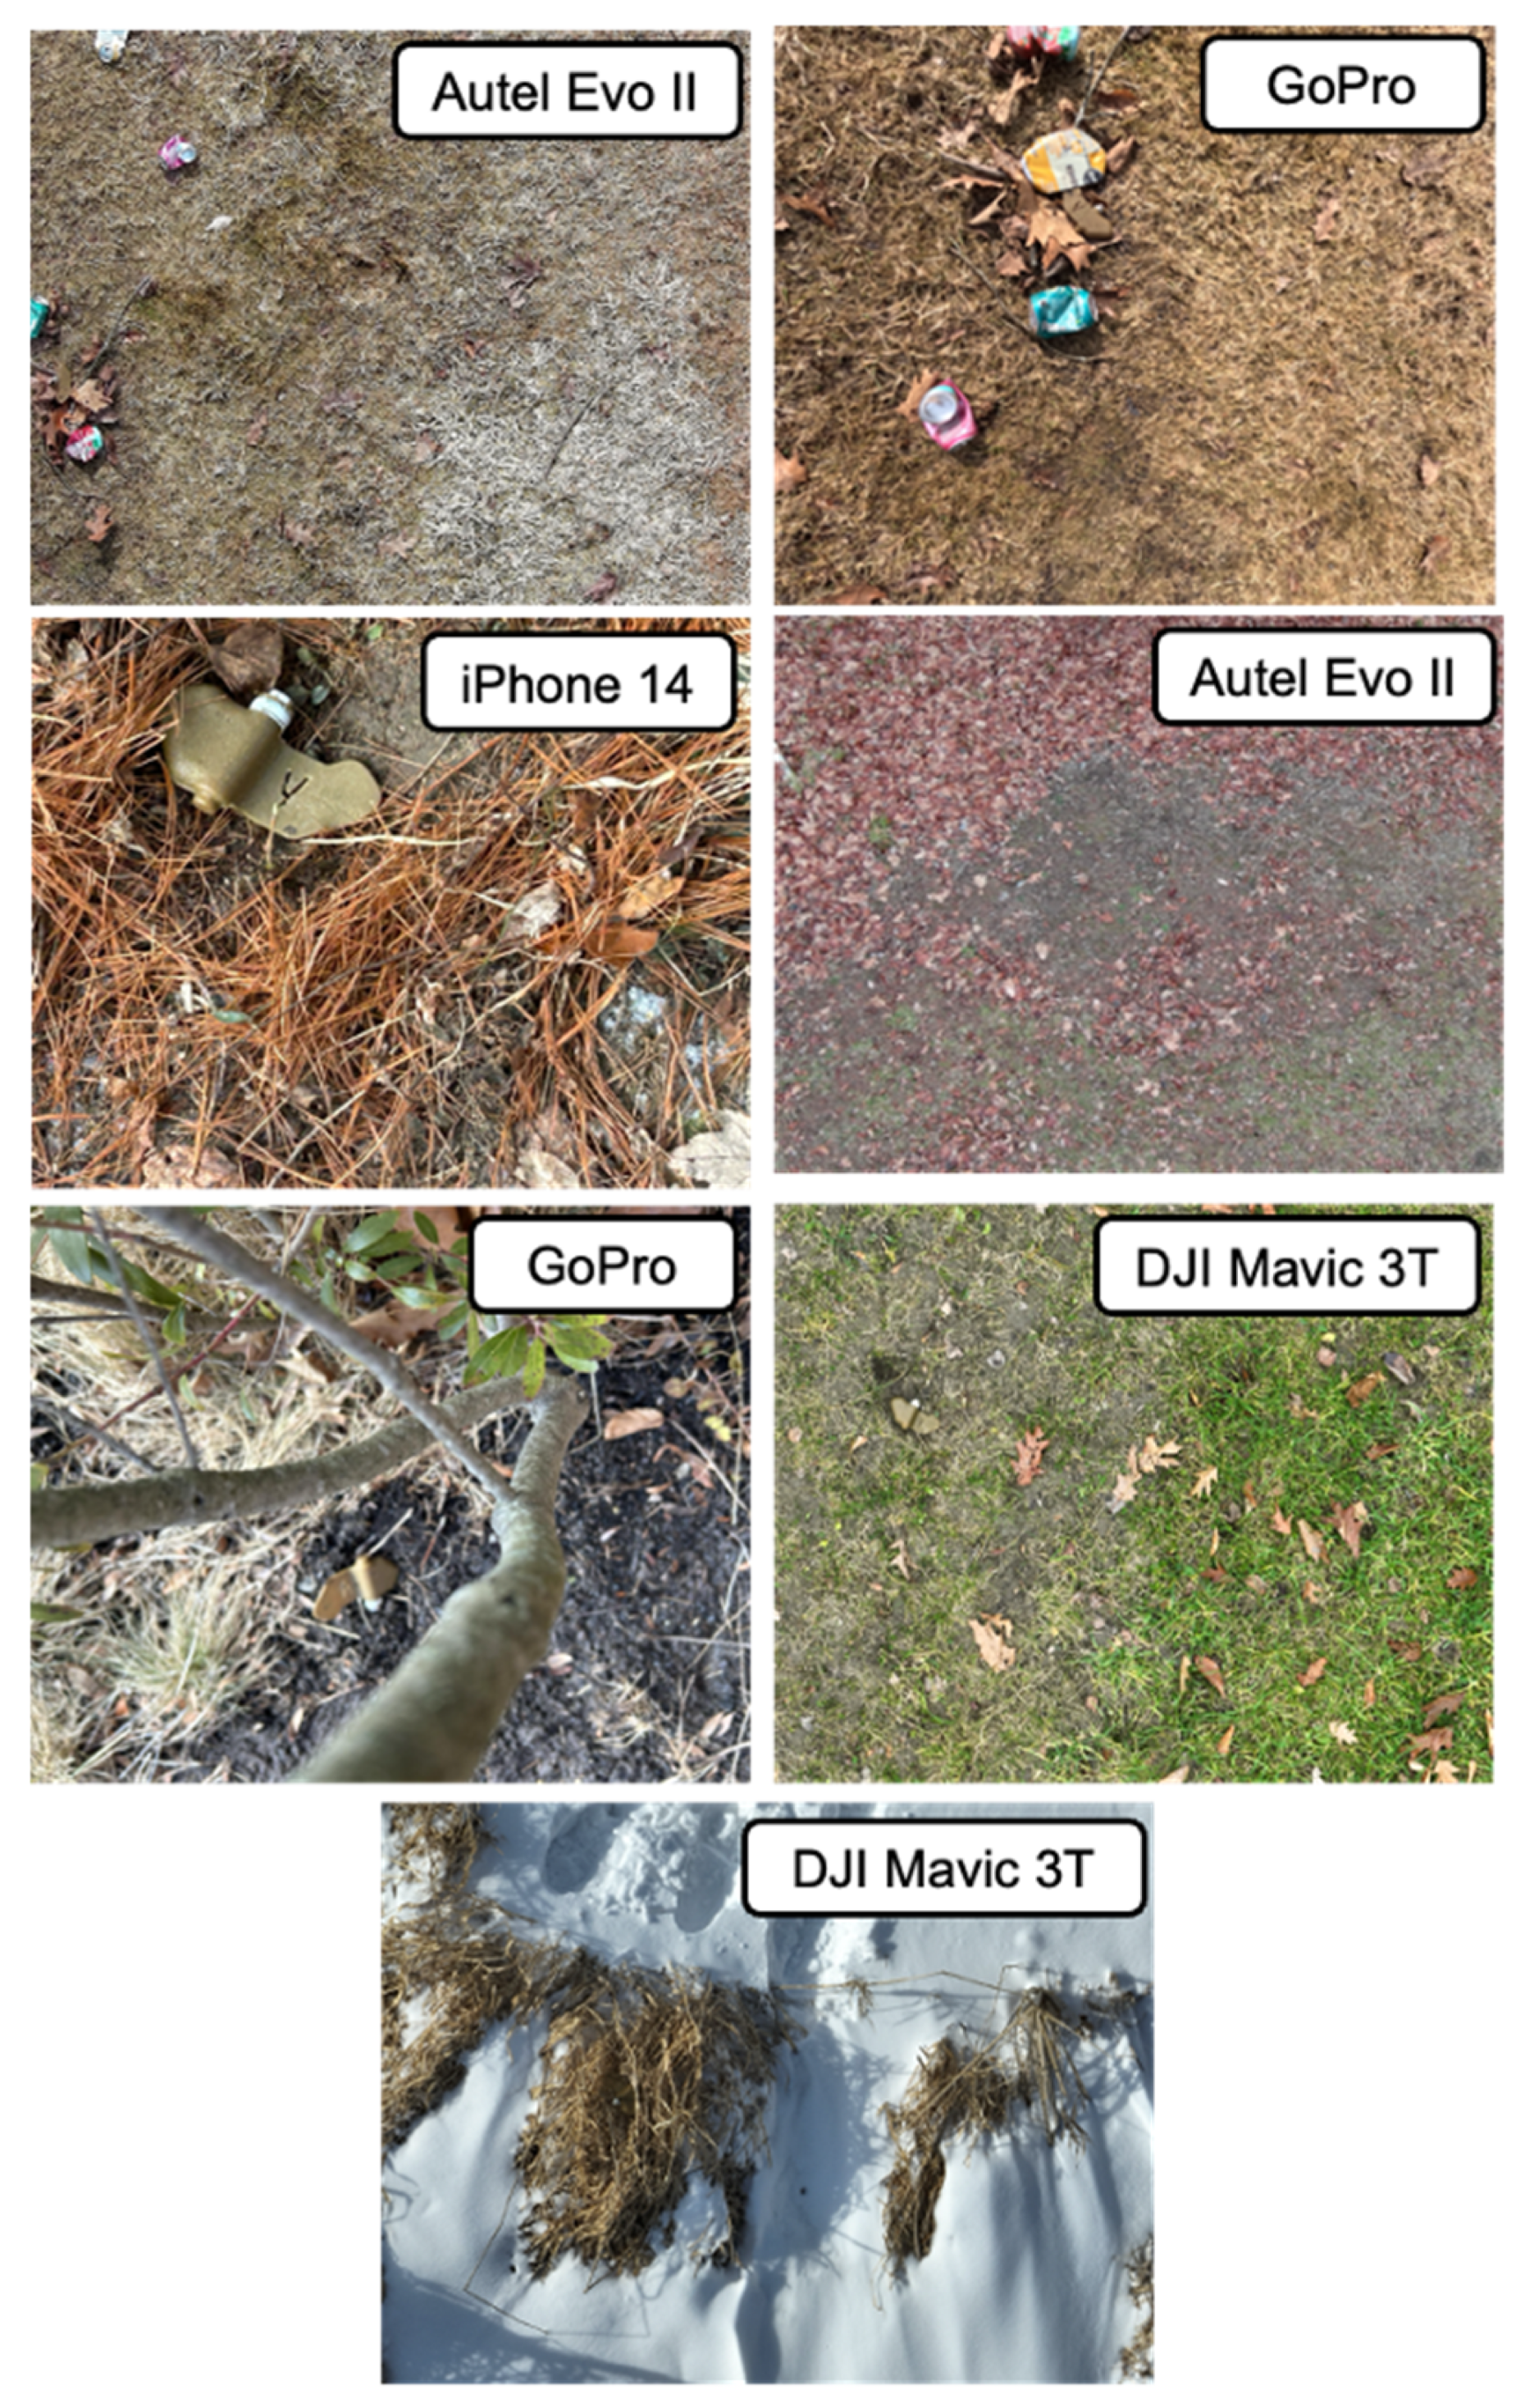
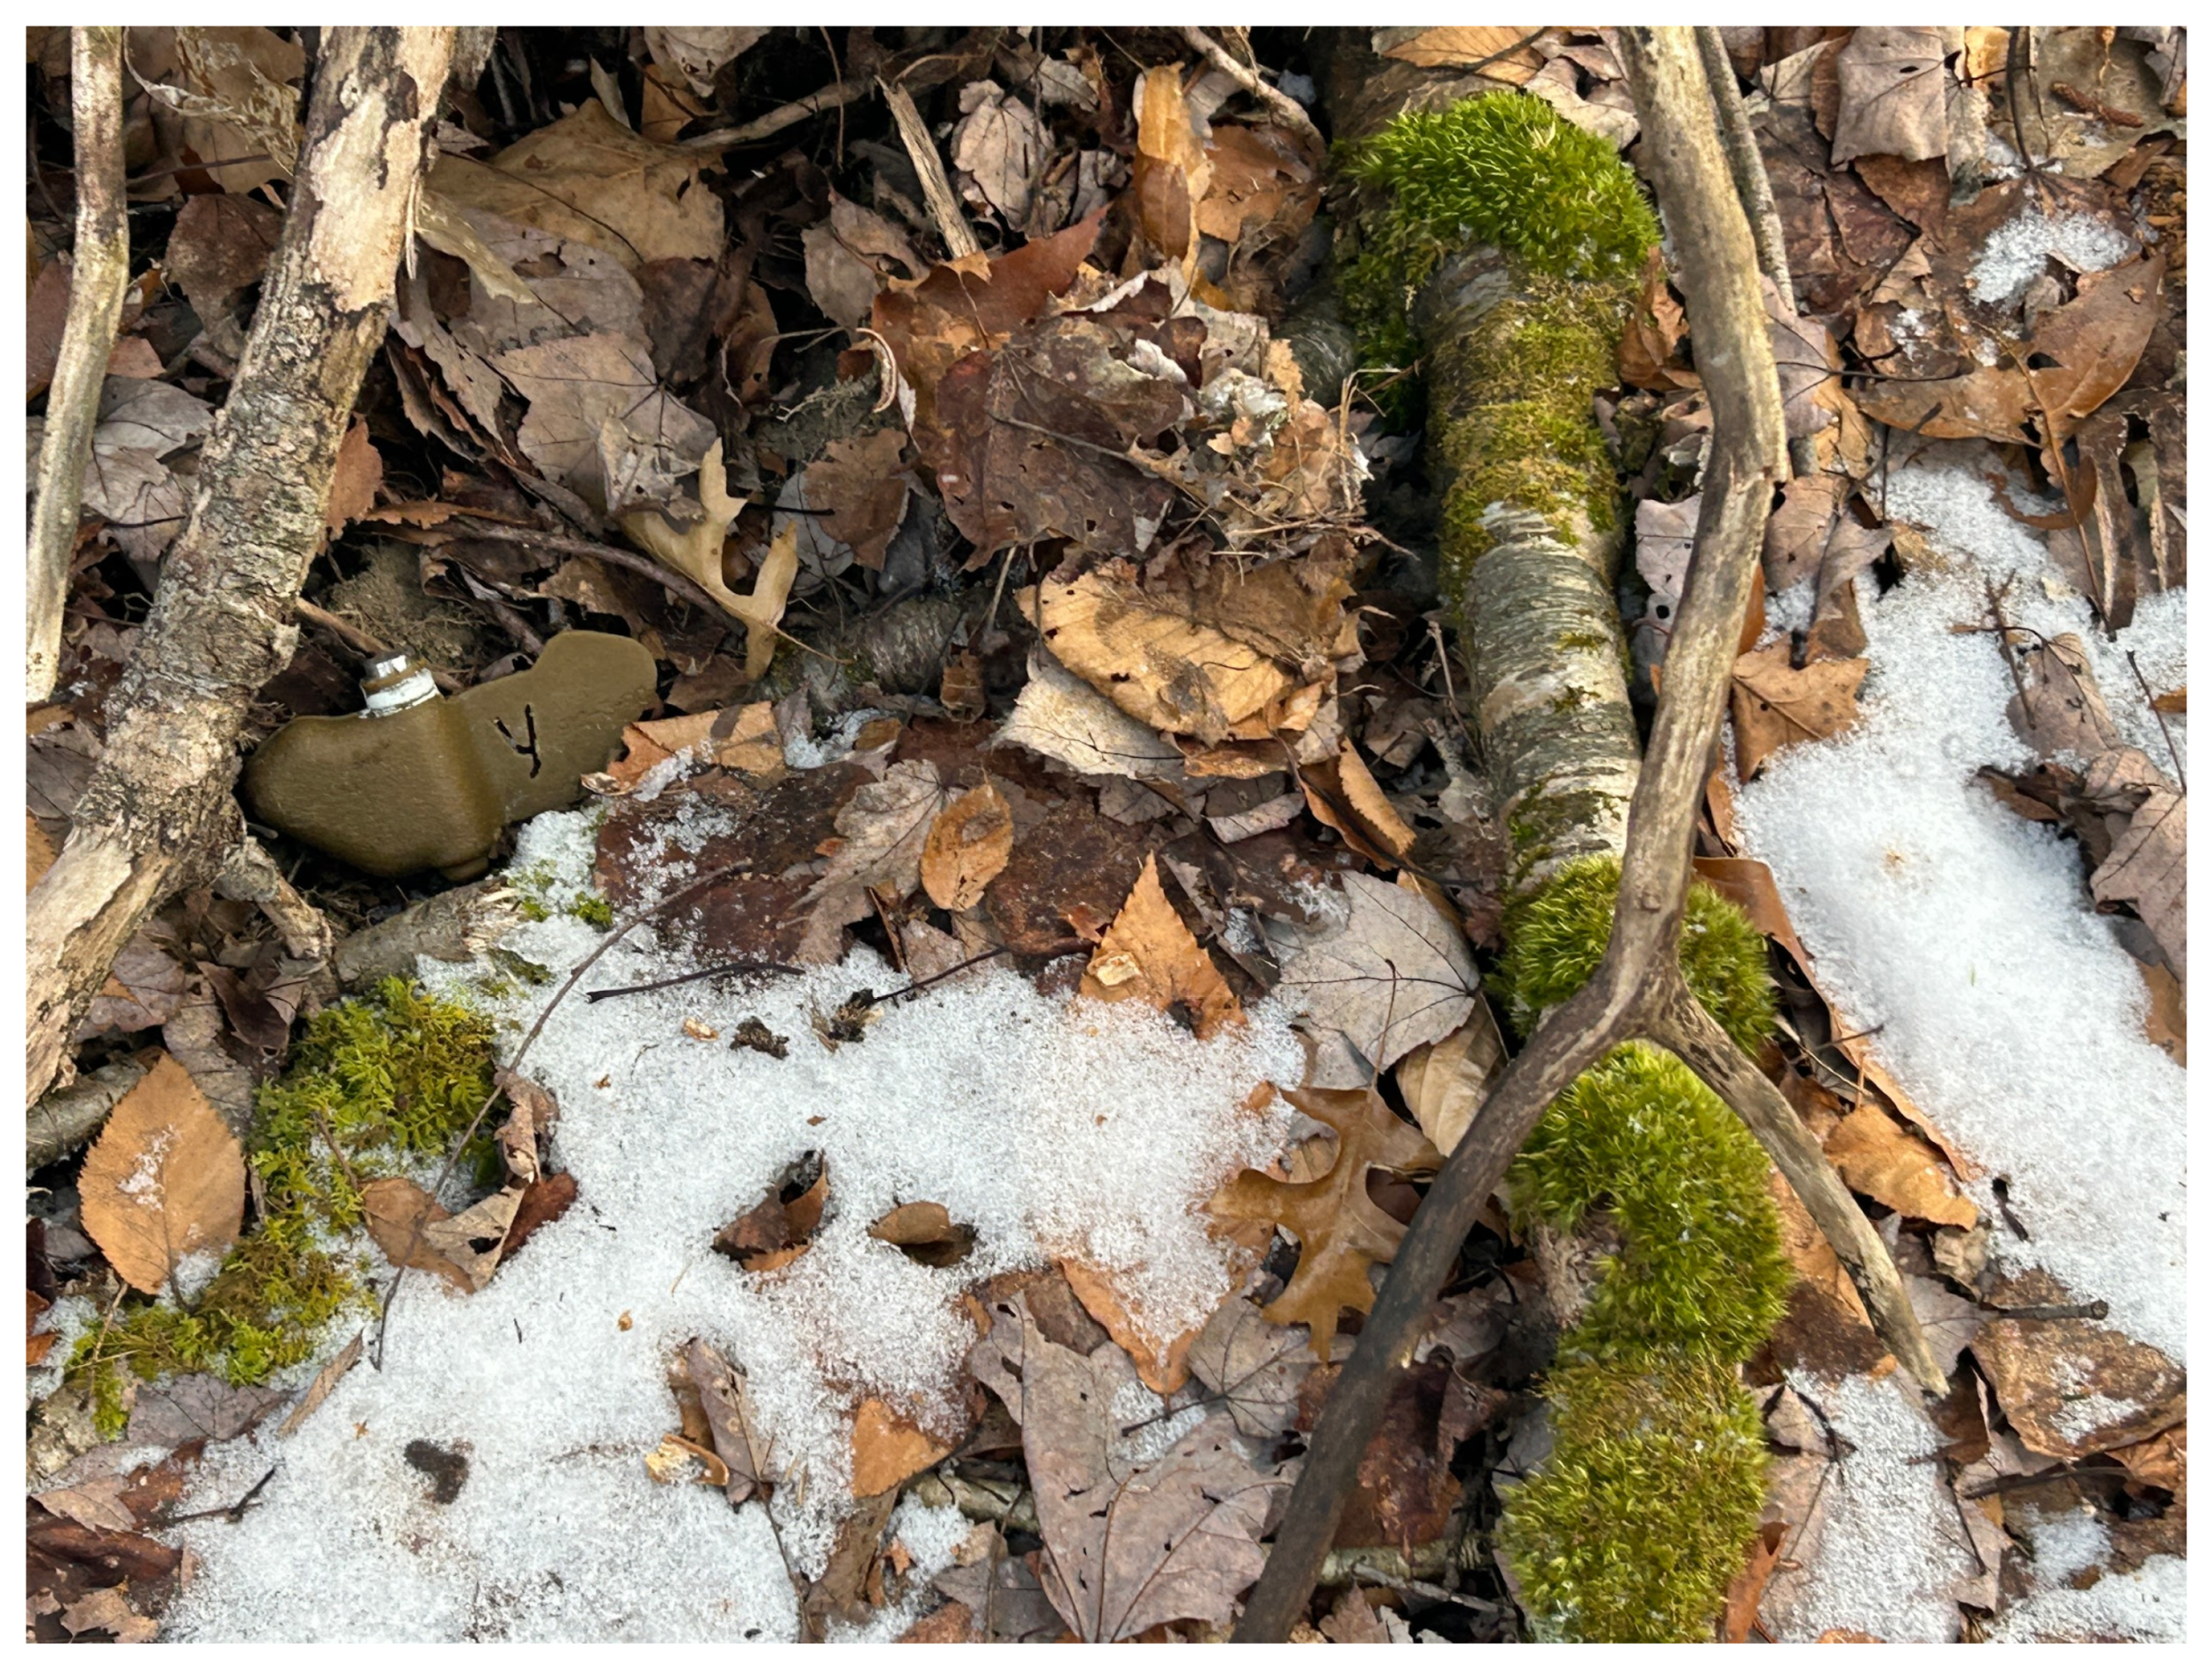
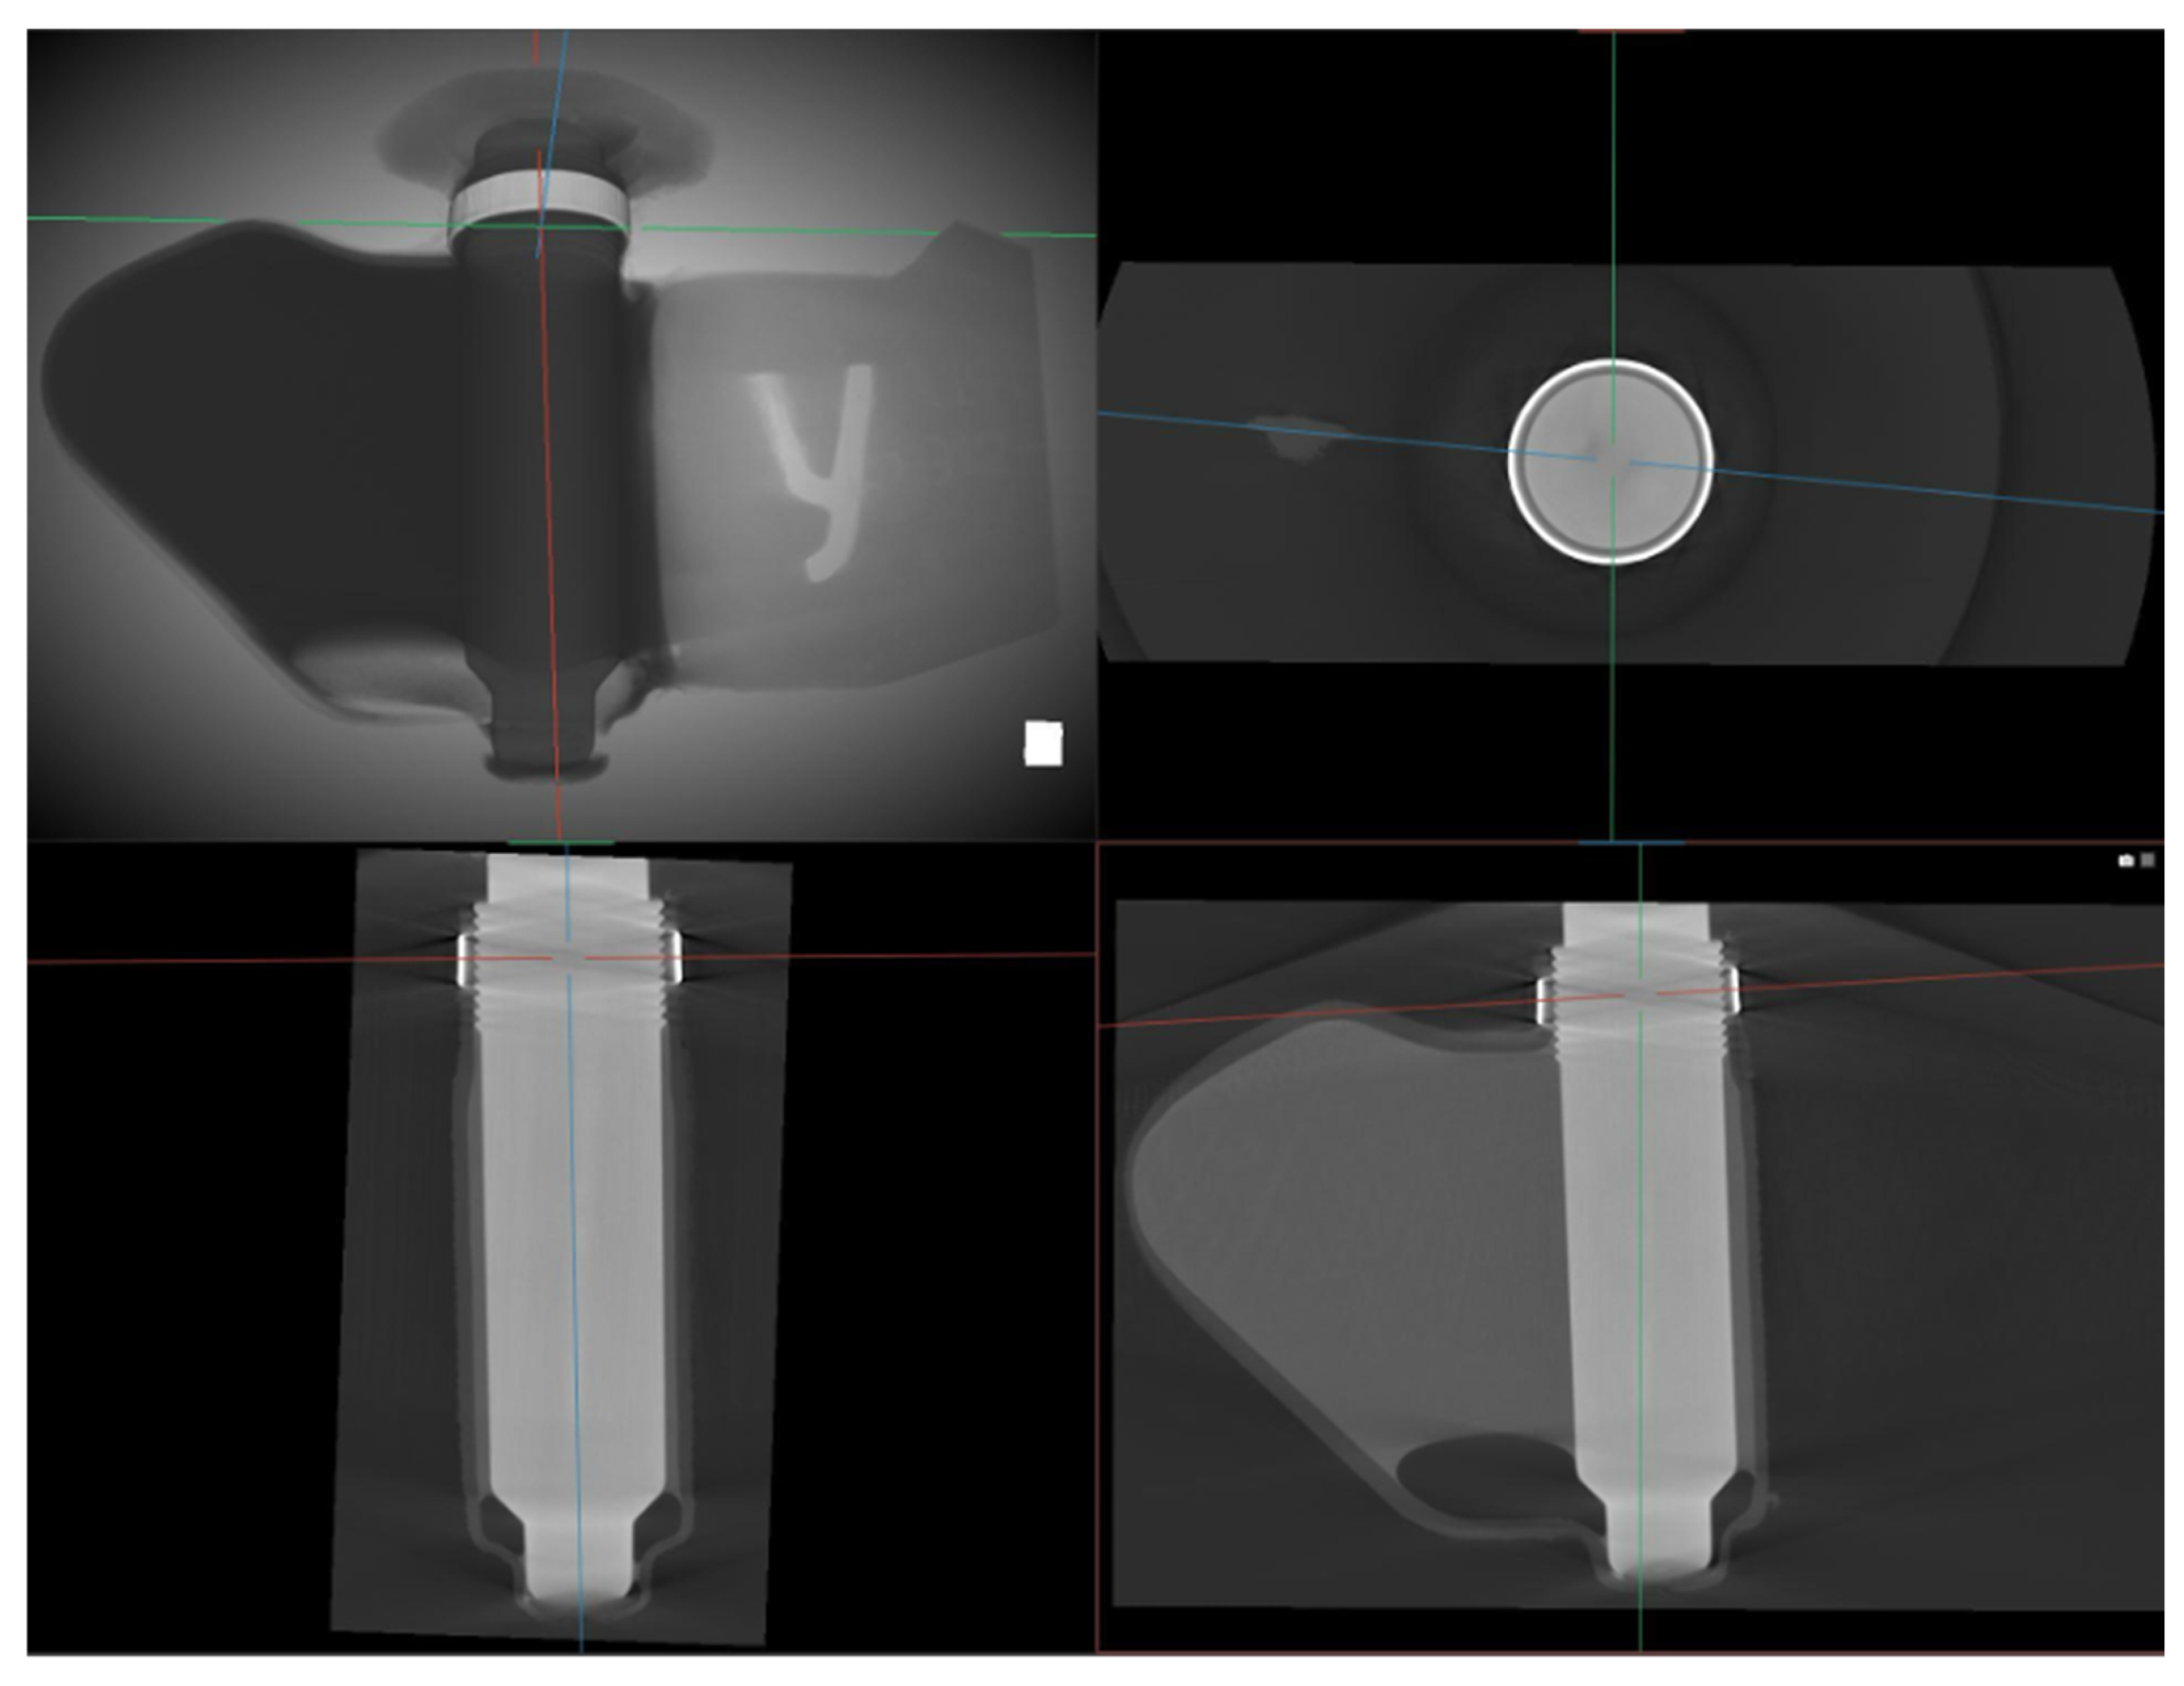
The RGB or optical images used for training were collected on Binghamton University’s campus in the fall of 2024 and spring of 2025 using a variety of cameras to improve generalizability across sensors: the DJI Mavic 3T UAV, manufactured by SZ DJI Technology Co., Ltd. in Shenzhen, China, with a 12-megapixel (MP) RGB camera, the Autel Evo II Pro V3 UAV, manufactured by Autel Robotics Co., Ltd. in Shenzhen, China, (20 MP), GoPro Hero 11, manufactured by GoPro Inc. based in San Mateo, CA, USA, (27 MP), and an iPhone 14, manufactured by Apple Inc. based in Cupertino, CA, USA, (12 MP). Drone flights were approved prior to data collection. An actual inert PFM-1 landmine was used during image collection. Notably, these inert mines are marked by cutting a Cyrillic “Y” into the wing of the mine (Figure 3). Data were collected in various environmental conditions as indicated in Figure 4 and Table 1, mainly during leaf-off season due to the climate in the area. There was a total of 13 separate collections, categorized by the environmental conditions in Table 1 below. The temperature ranged from −8 to 5 °C and wind gusts were 5–11 knots. Images captured using the DJI Mavic 3T and Autel Evo II Pro V3 were manually flown at varying altitudes ranging from 9–13 m. Additional distractor data was placed within the field of view (FOV), such as aluminum cans and plastic bags, to test the model’s ability to accurately differentiate between the landmine and other similarly sized objects.
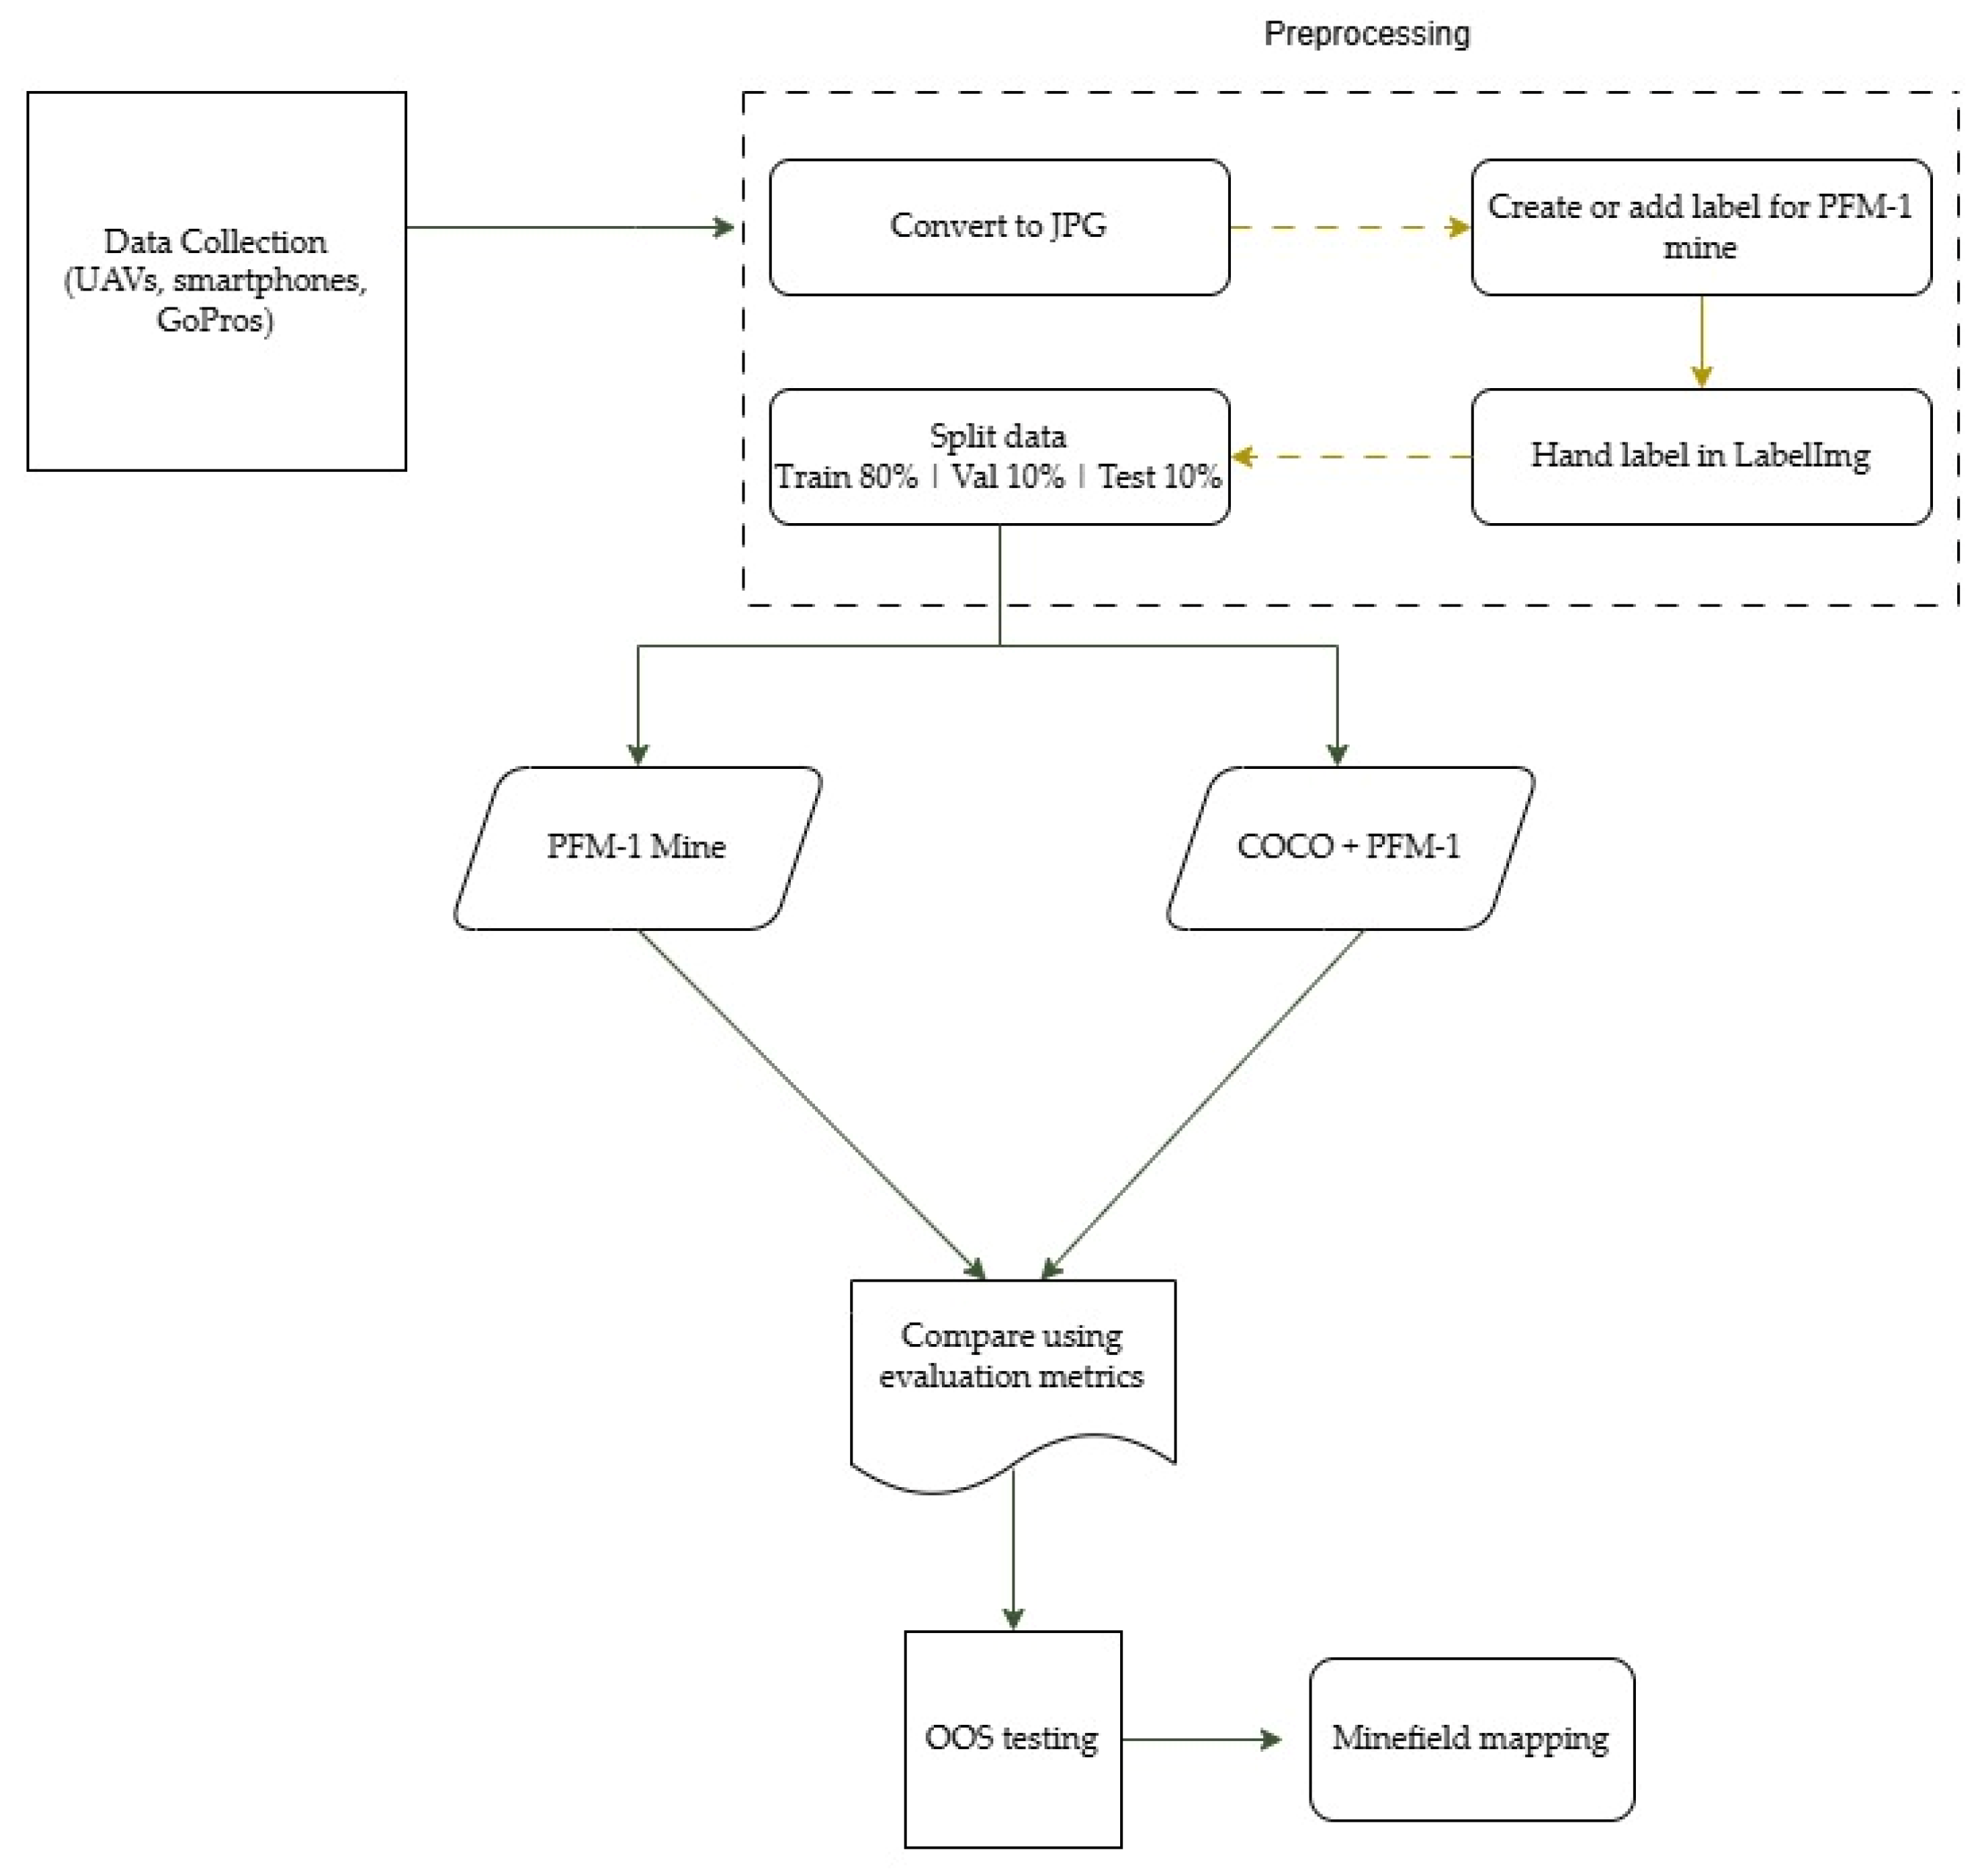
A minimal preprocessing workflow was established prior to running the models. All images collected were formatted into JPG images due to compatibility with the native file format in LabelImage version 1.8.6. After hand labeling the images using the LabelImg tool, any images larger than 640 × 640 were resized prior to automatic model running. No explicit radiometric generalization was applied to the images due to the preservation of the inherent default variability in the captured images. The model was trained on diverse inputs reflecting the differences in sensor types, acquisition settings, lighting conditions, and exposure settings to prevent overfitting to artificially homogenized data. Model evaluation using OOS testing further mitigated potential bias towards a specific sensor. This approach emphasized the generalization of a variety of sources rather than the optimization of a single dataset to mimic the real-world conditions in which landmines may be investigated.

2.2. Model Runs

Two approaches were considered for this method. One was to train and test the object detection model on just the PFM-1 mine. The second was to train and test the model using the COCO dataset, with an additional PFM-1 mine class (PFM-1 + COCO model). The purpose was to compare how the model performs on a dataset that is specifically trained on one object versus a broader dataset, encompassing multiple classes. These also included images with no known PFM-1 mine within the field of view, also known as background images. The model trained solely on the PFM-1 mine had a total of 5869 images, split as close as possible into 80/10/10 for training, testing, and validation, respectively, or 4696 images for training, 587 for validation, and 586 for testing. The model using the COCO dataset in addition to the PFM-1 mines had a total of 117,639 images, also split as close as possible into 80/10/10 for training (94,112 images), validation (11,764 images), and testing (11,763 images), with imagery split into each category in a non-specific pattern for each model to reduce overfitting to a specific sensor. Most of the data is considered for training to prevent overfitting and to reduce the number of false negative and positive detections. Once the data was collected and reviewed for quality control and assurance, images were annotated using the LabelImg tool [43], an intuitive interface that enables the labeling of specific objects within scenes for model training, validation, and testing purposes (Figure 5).

2.3. Evaluating Metrics

Output metrics were used to understand how the model performed and indicate errors in the false classification of objects. In this case, four metrics were considered: precision, which is the proportion of correctly classified instances (true positives) compared to all instances classified as positives; recall, which is the ratio of true positives versus all actual positives, which accounts for false negatives; mean Average Precision (mAP50), which is used to determine the average across all classes; and the F1 score, which considers both false positives and negatives by taking the harmonic mean of both precision and recall. All four metrics ranged from 0–1.
To further validate the model’s performance, out-of-sample (OOS) data was collected, for which no part of the image set was used for training or validation. Two separate sets of OOS data were collected. The first portion captured both inert and 3D-printed replicas of the PFM-1 mine in various environments across Binghamton University’s campus using a variety of Android and Apple smartphones including an iPhone 15 Pro, iPhone 16 Pro, OnePlus 7 Pro, and Google Pixel 8. Additional OOS data was captured using the Autel Evo II Pro V3 (20 MP) at Harold Moore Park in Binghamton, NY, USA, in an effort to generate a map, highlighting the capacity in which this method may be used in a non-technical survey. A set of nine 3D-printed PFM-1 mines were scattered and captured. The 3D-printed, paint-matched replicas of the PFM-1 mine were used for discrete portions of the OOS testing. An existing repository found on Printables of a 3D PFM-1 mine without the placement of the Cyrillic Y was modified [44] according to the dimensions provided by the HALO Trust Organization, and further removal of writing on the body of the mine was conducted in Autodesk Fusion using the extrude tool. To validate the modifications, a 3D scan of the inert PFM-1 mine was taken at Binghamton University’s Emerging Technology Studio (ETS) using the EinScan-SP V2 [45], and the resulting OBJ file was imported into Autodesk Fusion. It took 83 min to print five mines and 34.3 g of white PLA filament per mine. The cost of one kilogram of white PLA filament is $30 USD, costing a total of $1.03 to 3D-print one mine. The files associated with 3D-printed PFM-1 replicas used for OOS testing have been uploaded to the 3D repository Thingiverse [46].
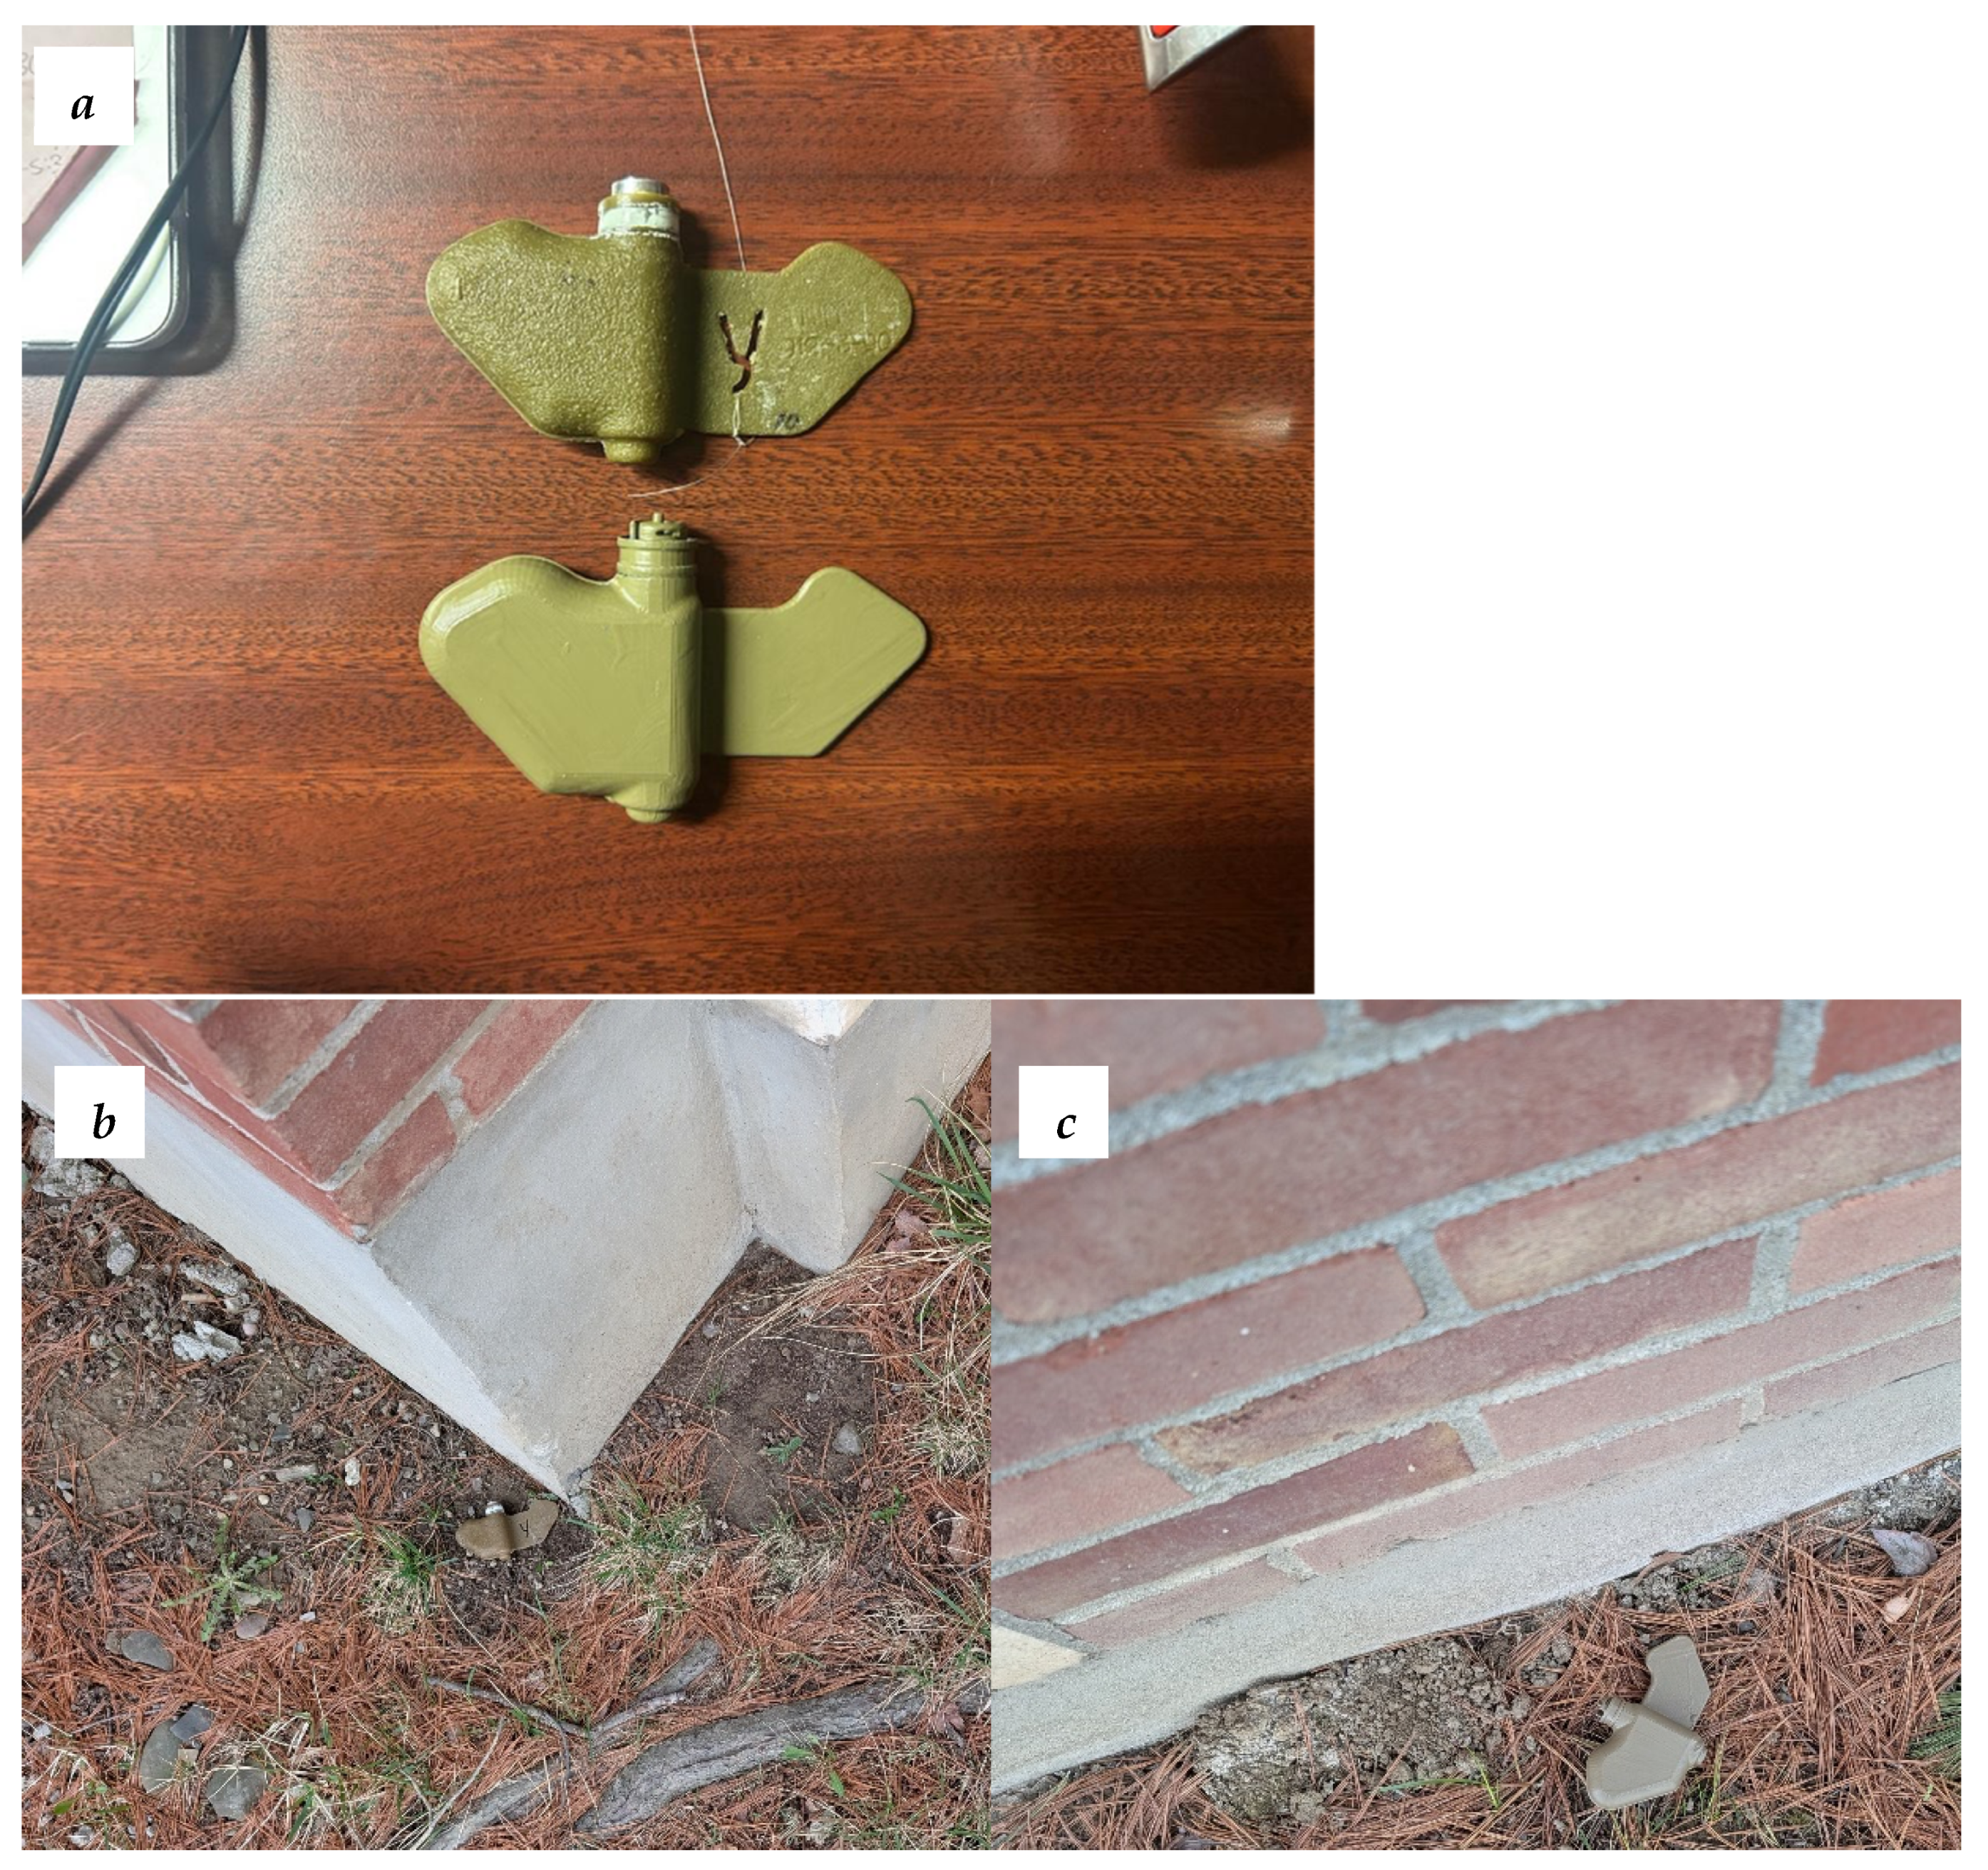
Inert PFM-1 mines were color-matched using the Color Muse 2 device produced by Variable [47] (Figure 6). The given paint code was taken to a nearby hardware store to obtain a sample of paint with semi-gloss mixed in to match the gloss of the inert mine. The oil-based primer Rust-Oleum 2X Ultra Cover Flat Spray Paint manufactured by RPM International Inc. based in Vernon Hills, IL, USA, designed for use on plastic, was applied prior to painting.

3. Results

This section presents the findings from each model, one trained on only the PFM-1 mine and the other pretrained on the COCO dataset along with the PFM-1 mine, for a total of 81 classes. Each model’s efficacy is evaluated based on four key quantitative metrics, as described in Section 2.3. A further compiled OOS dataset was generated into a map, highlighting the range in which mines may potentially appear in suspected hazardous areas (SHAs) or confirmed hazardous areas (CHAs).
A total of 5869 images were collected from all devices and locations. For the fine-tuned YOLO model trained to detect only PFM-1 mines, the total time to train using the AMD Ryzen Threadripper 7980X processor was 0.99 h at 50 epochs. For the PFM-2 + COCO model, it took a total time of 26 h to train at 50 epochs. Repeated testing showed that accuracy measurements plateaued well before 50 epochs. The PFM-1 + COCO model had a comparatively higher number of background images, with the validation set alone having over 40,000 background images and 479 labeled images. The PFM-1 model contained a total of 587 images and 192 labeled images for validation. The output metrics precision, recall, F1, and mAP were considered for determining how well the model was able to detect the mines. The training scores represent the YOLO-reported best score during the training phase, the validation scores represent the scores applied to the 10% of separated data, but still used as part of training, and the testing scores represent the 10% of images from the original datasets, not included for training or validation. The out-of-sample (OOS) scores represent the model applied to subsequent independently collected imagery; they differ from the testing scores in that the testing images were 10% of the images separated out from the initial collections and are thus still quite similar to those in the training and validation sets. OOS images are unlike these and are “entirely unseen” images; they best represent the expected performance of the model on truly novel data.
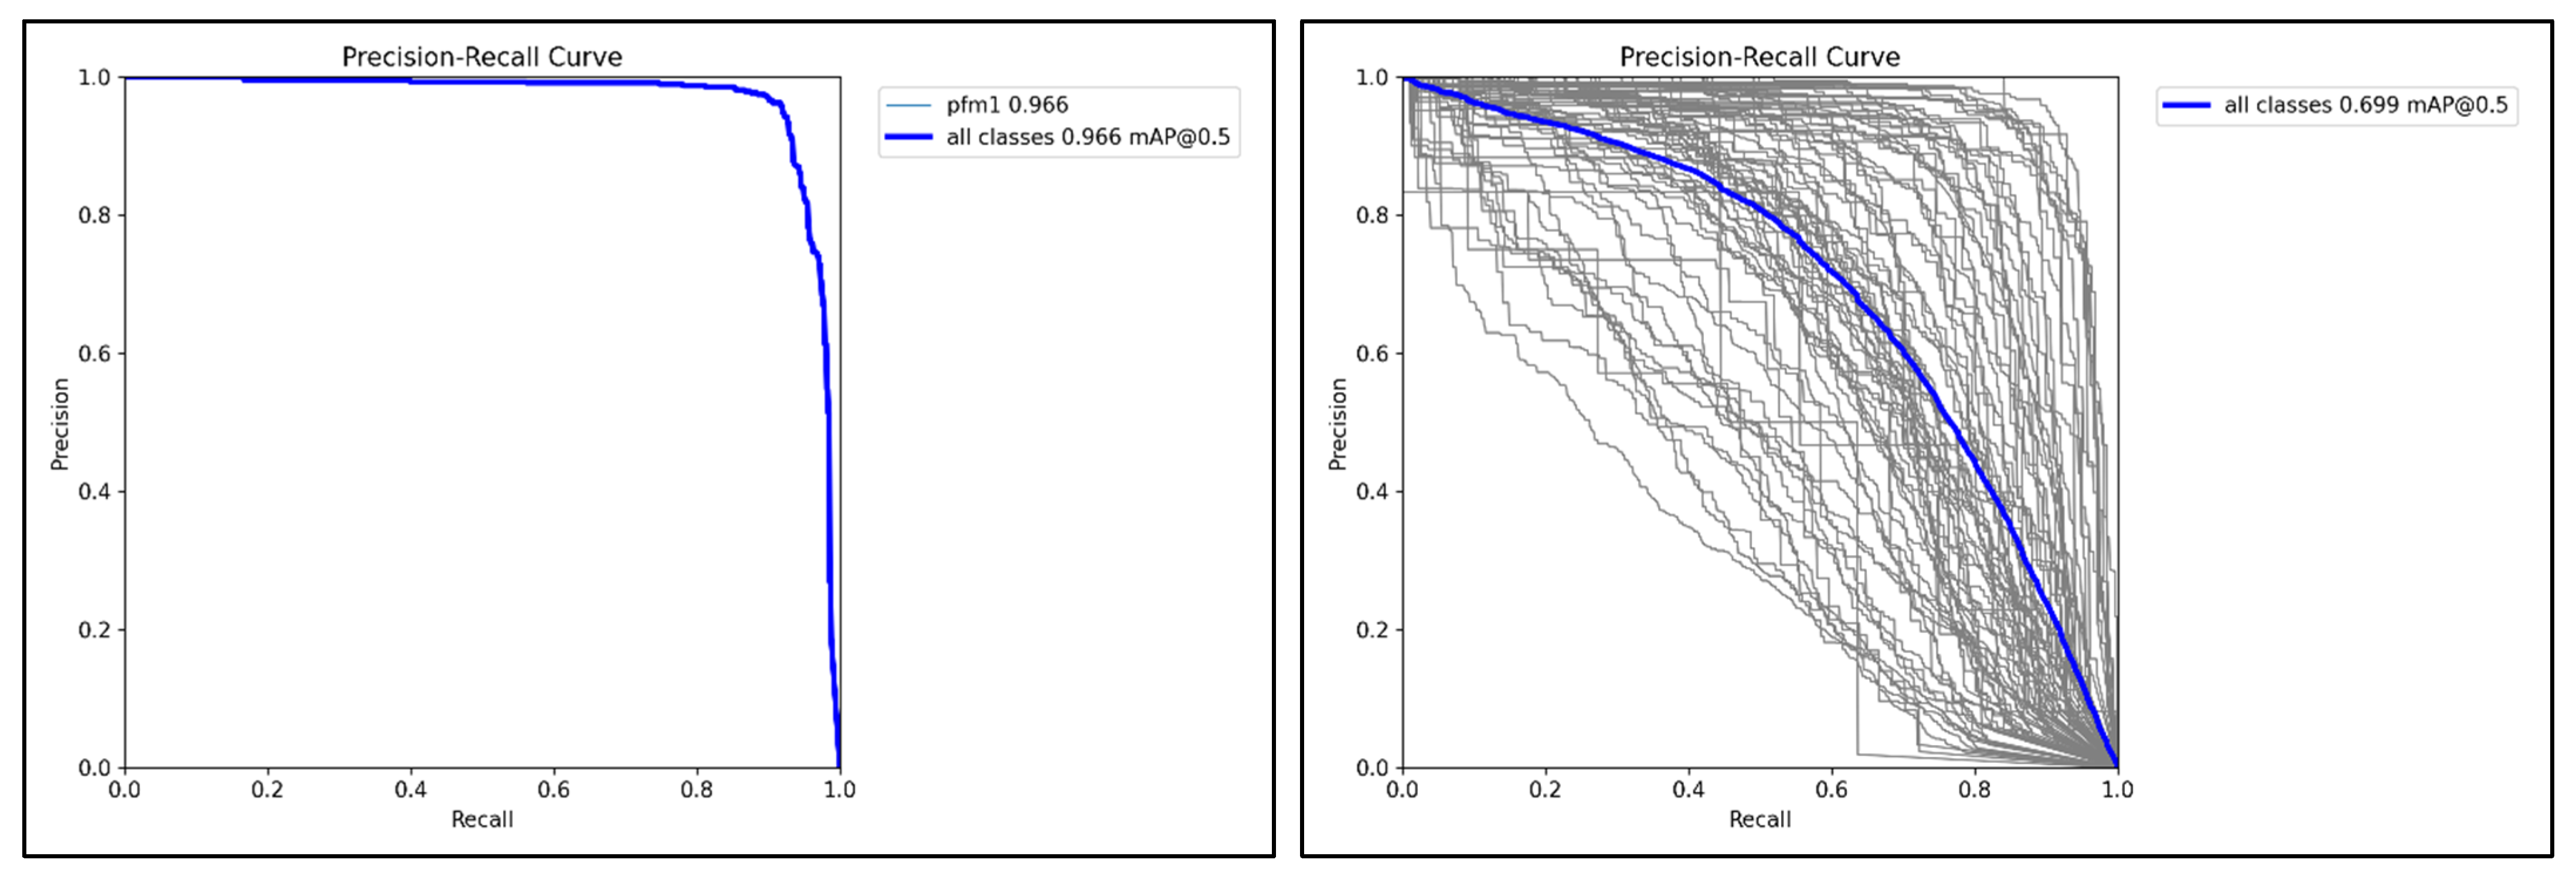
Table 2 outlines the results from each respective model run. The PFM-1 model shows very high-performance during training and validation (precision 91–95%, recall 88–92%), but performs notably worse with respect to recall (14%) during OOS testing, in which the model was applied to images collected separately and therefore unlike the training, validation, and testing images. In contrast, the PFM-1 + COCO model showed slightly worse performance for precision and recall for training and validation, nearly equivalent performance for testing, and better performance than the PFM-1 model for OOS, although recall was still low (24%) (Figure 7). Taken together, these results highlight the importance of OOS in evaluation, as the results clearly differ from the patterns of scores observed in training, validation, and testing.
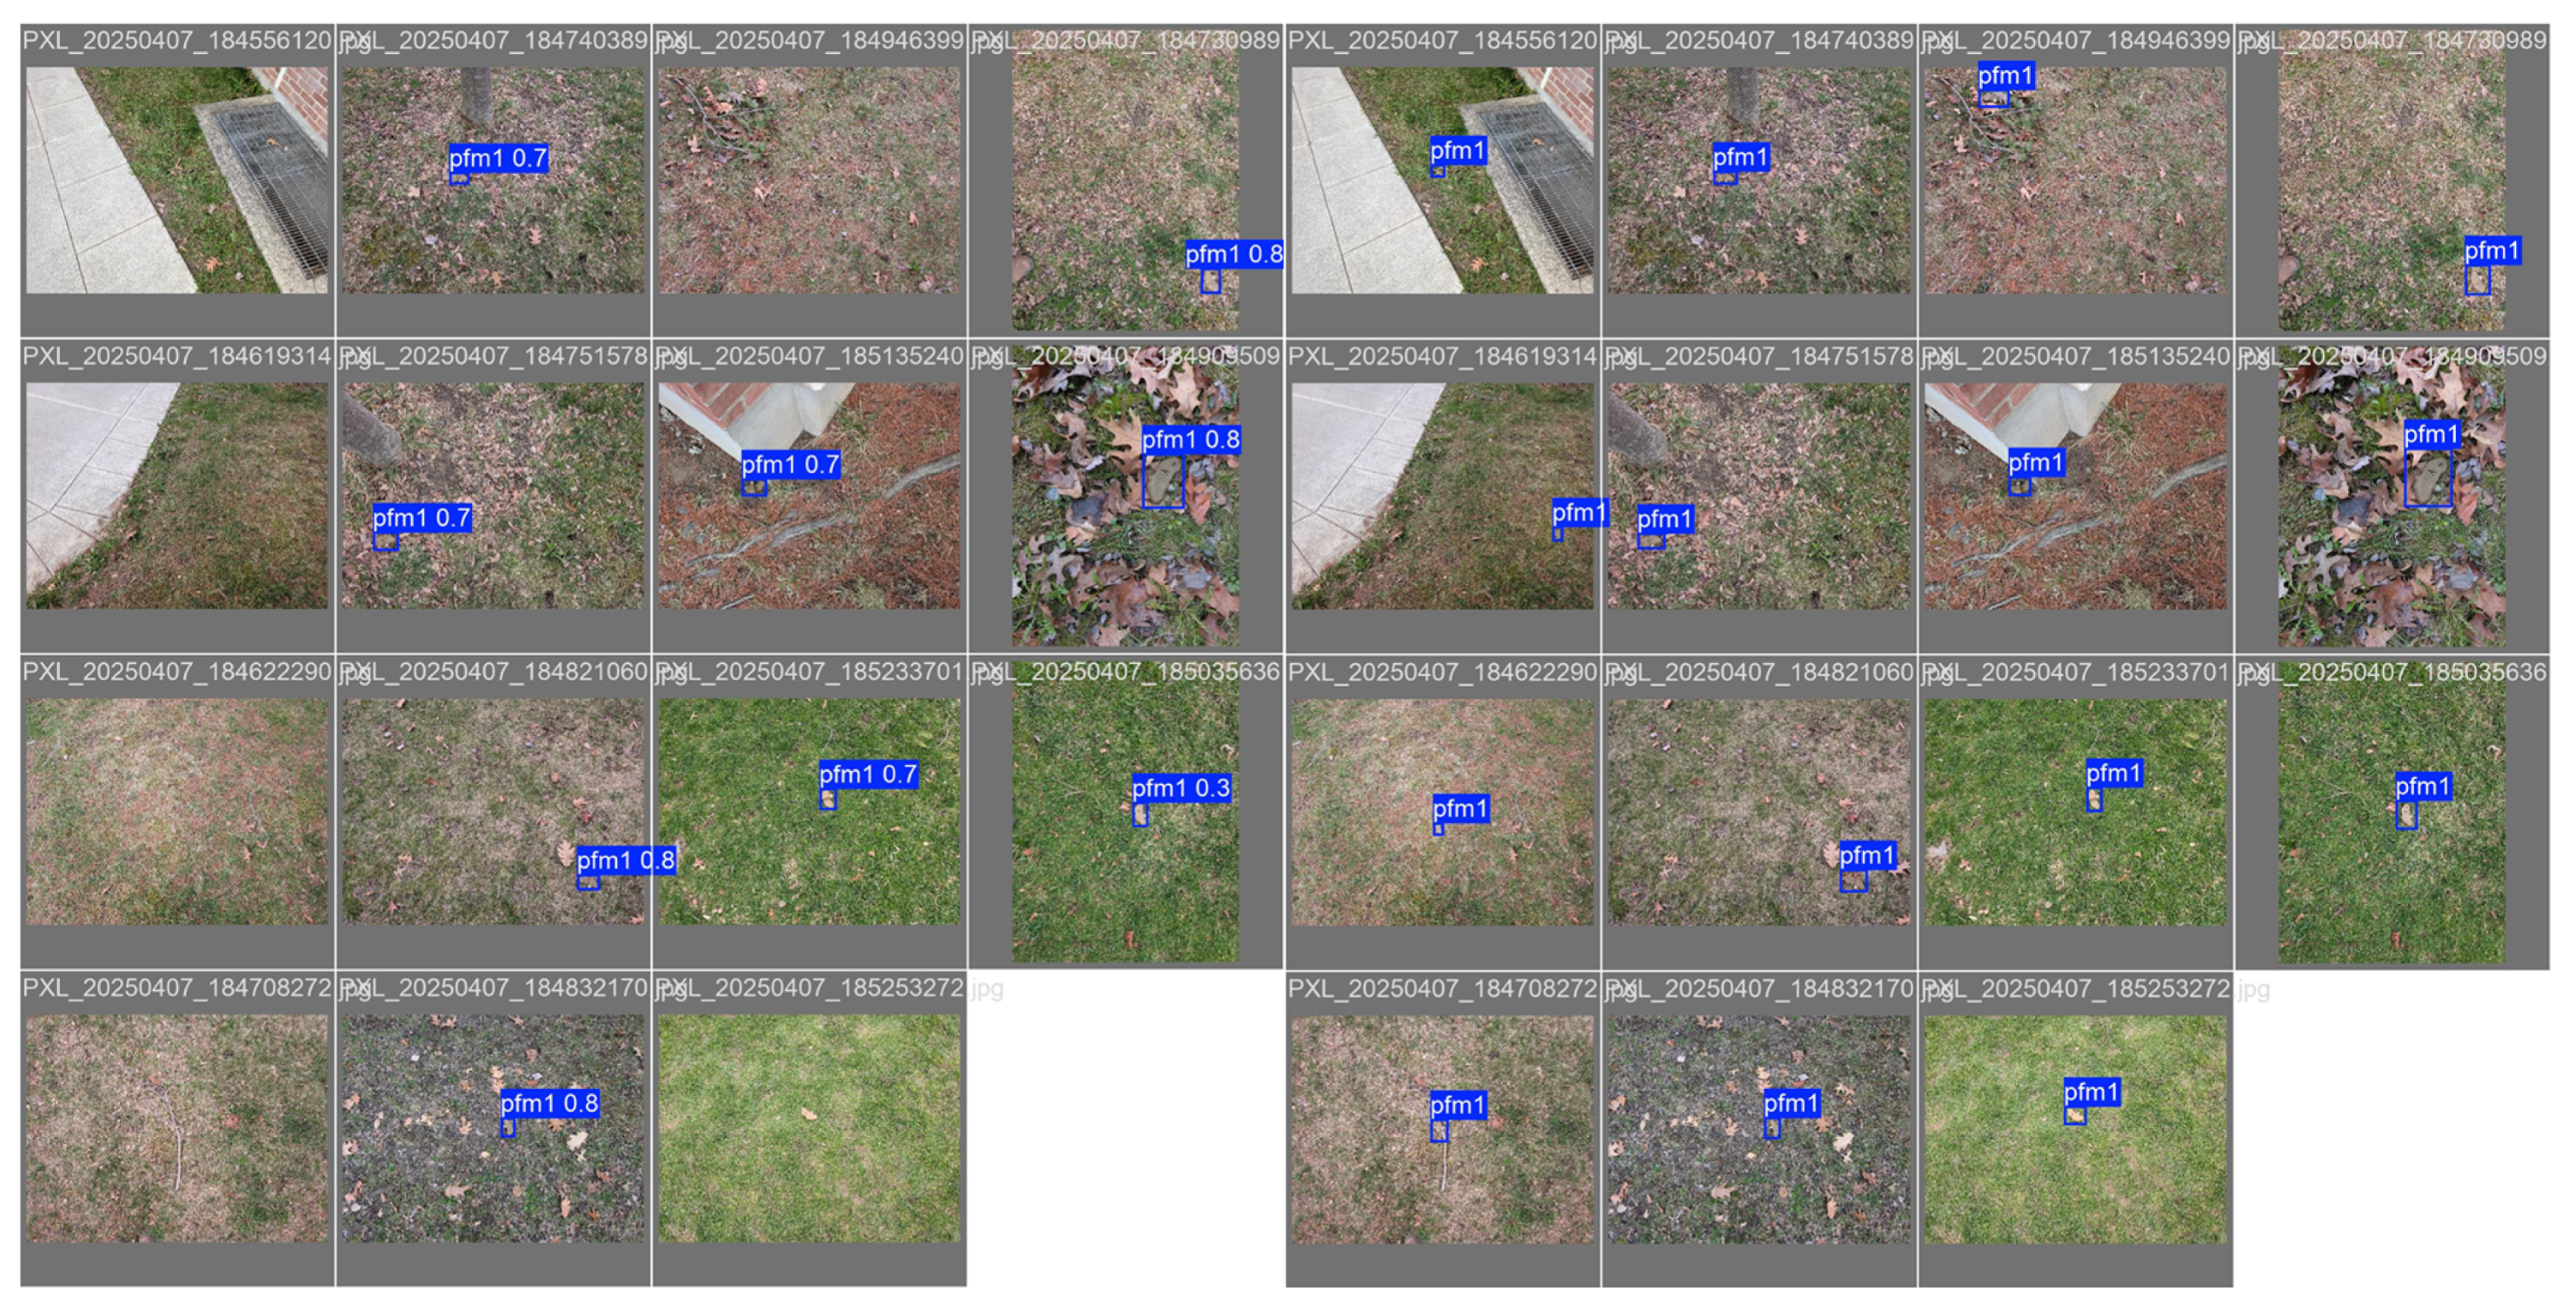
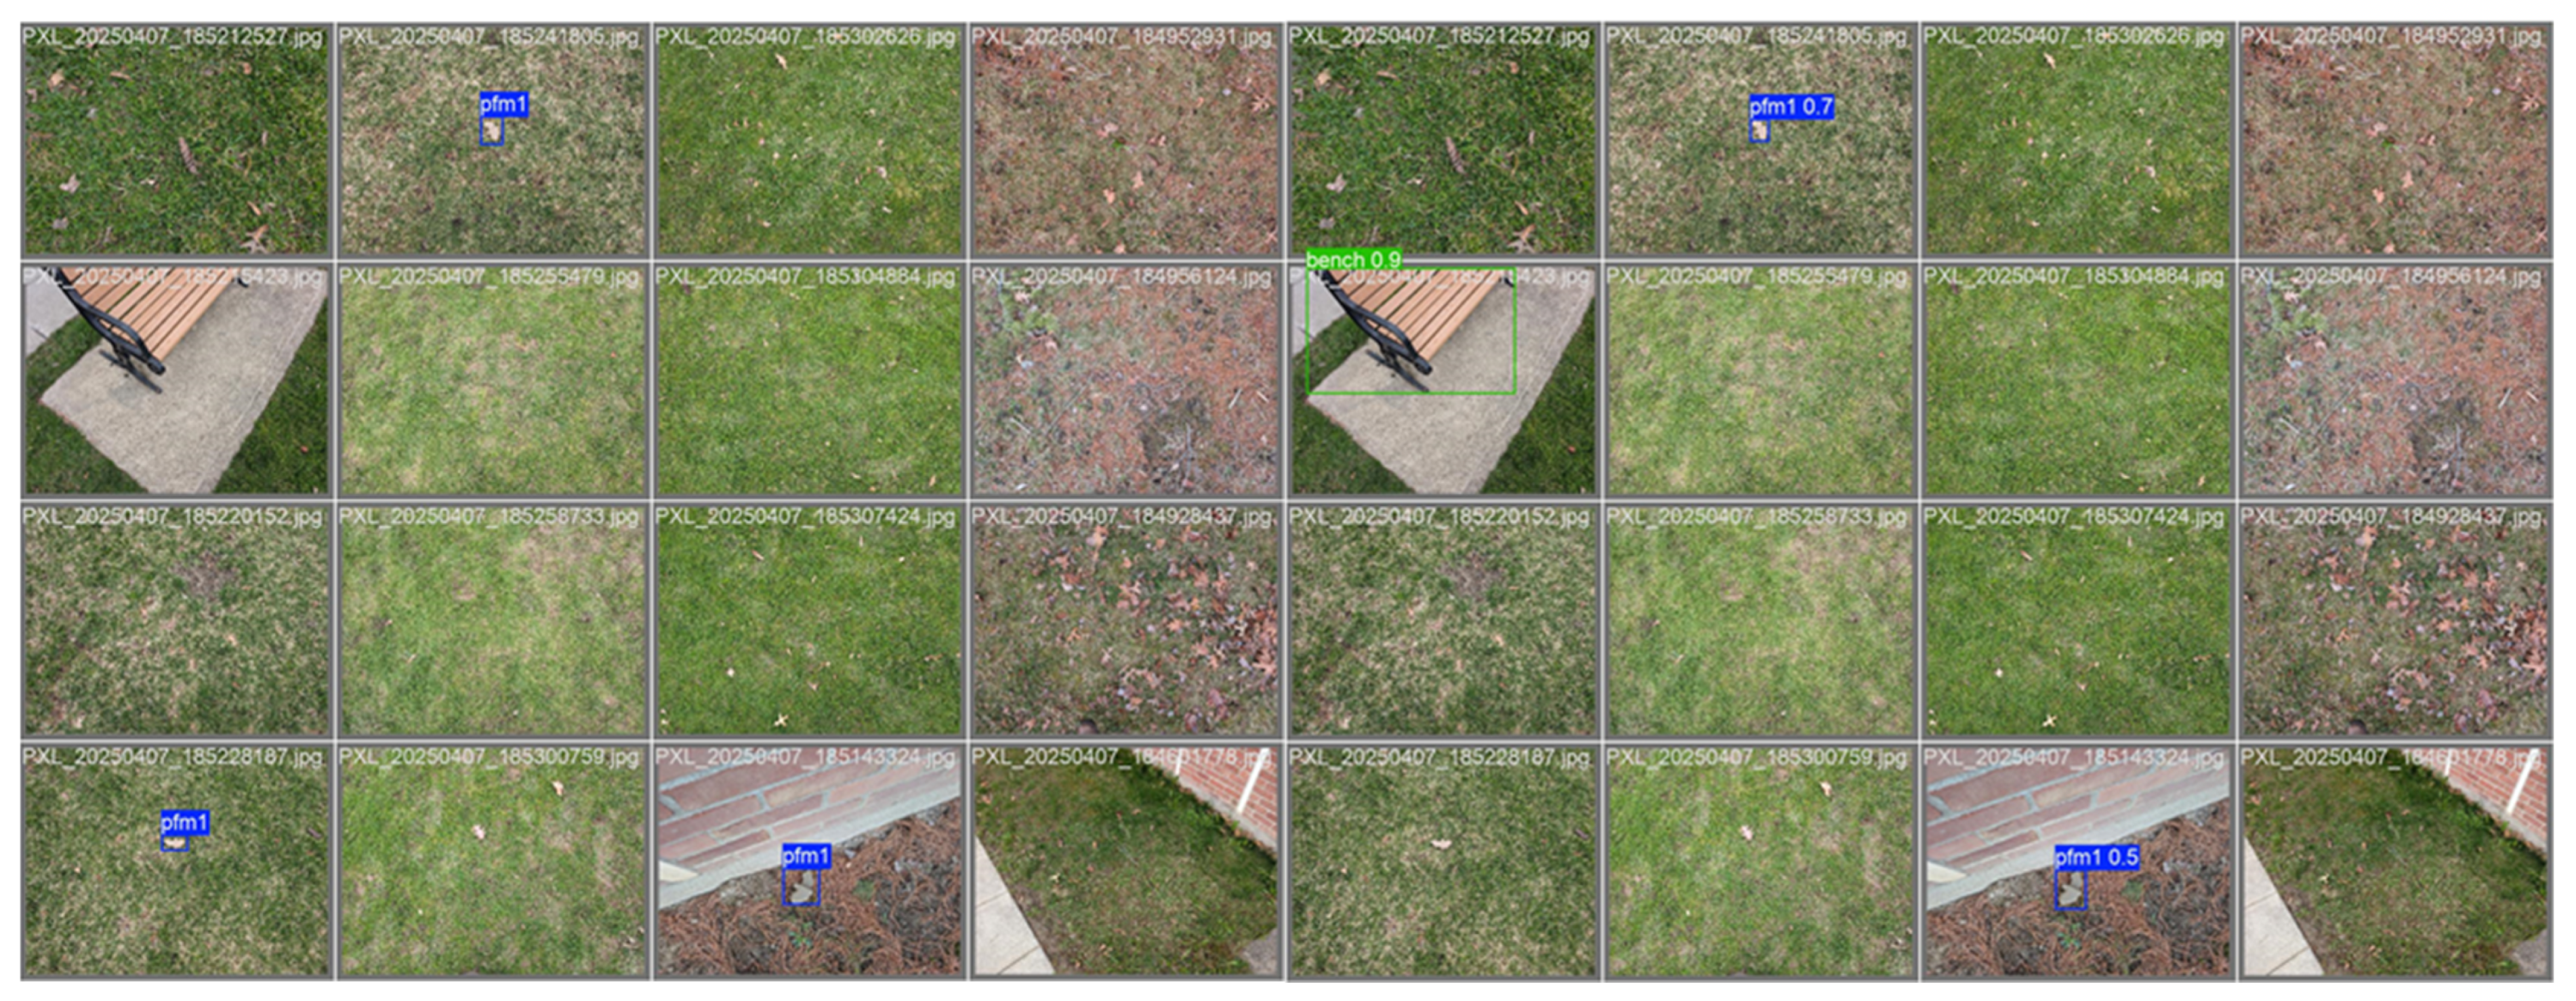
To understand how slight variations in model data can potentially impact its detection capability, a small subset of OOS data was used to determine how the PFM-1 + COCO model detects the inert PFM-1 mine versus the 3D-printed replicas (Figure 8 and Figure 9). For the replicas, a total of 62 images were used—11 images labeled and 51 as background images. The inert PFM-1 mine collection had a total of 68 images—15 labeled and the remaining 53 as background images. Testing was conducted on the Intel® Core™ i9-10980XE processor.
It was not certain that the 3D-printed replicas would be commensurately detectable using models trained on the inert mine, given minor differences in appearance (slight difference in color, texture, and the Cyrillic “Y” marking the inert mine). However, the printed replicas showed slightly better precision, recall, and mAP (75–80%) for detection than the inert mine (60–70%).
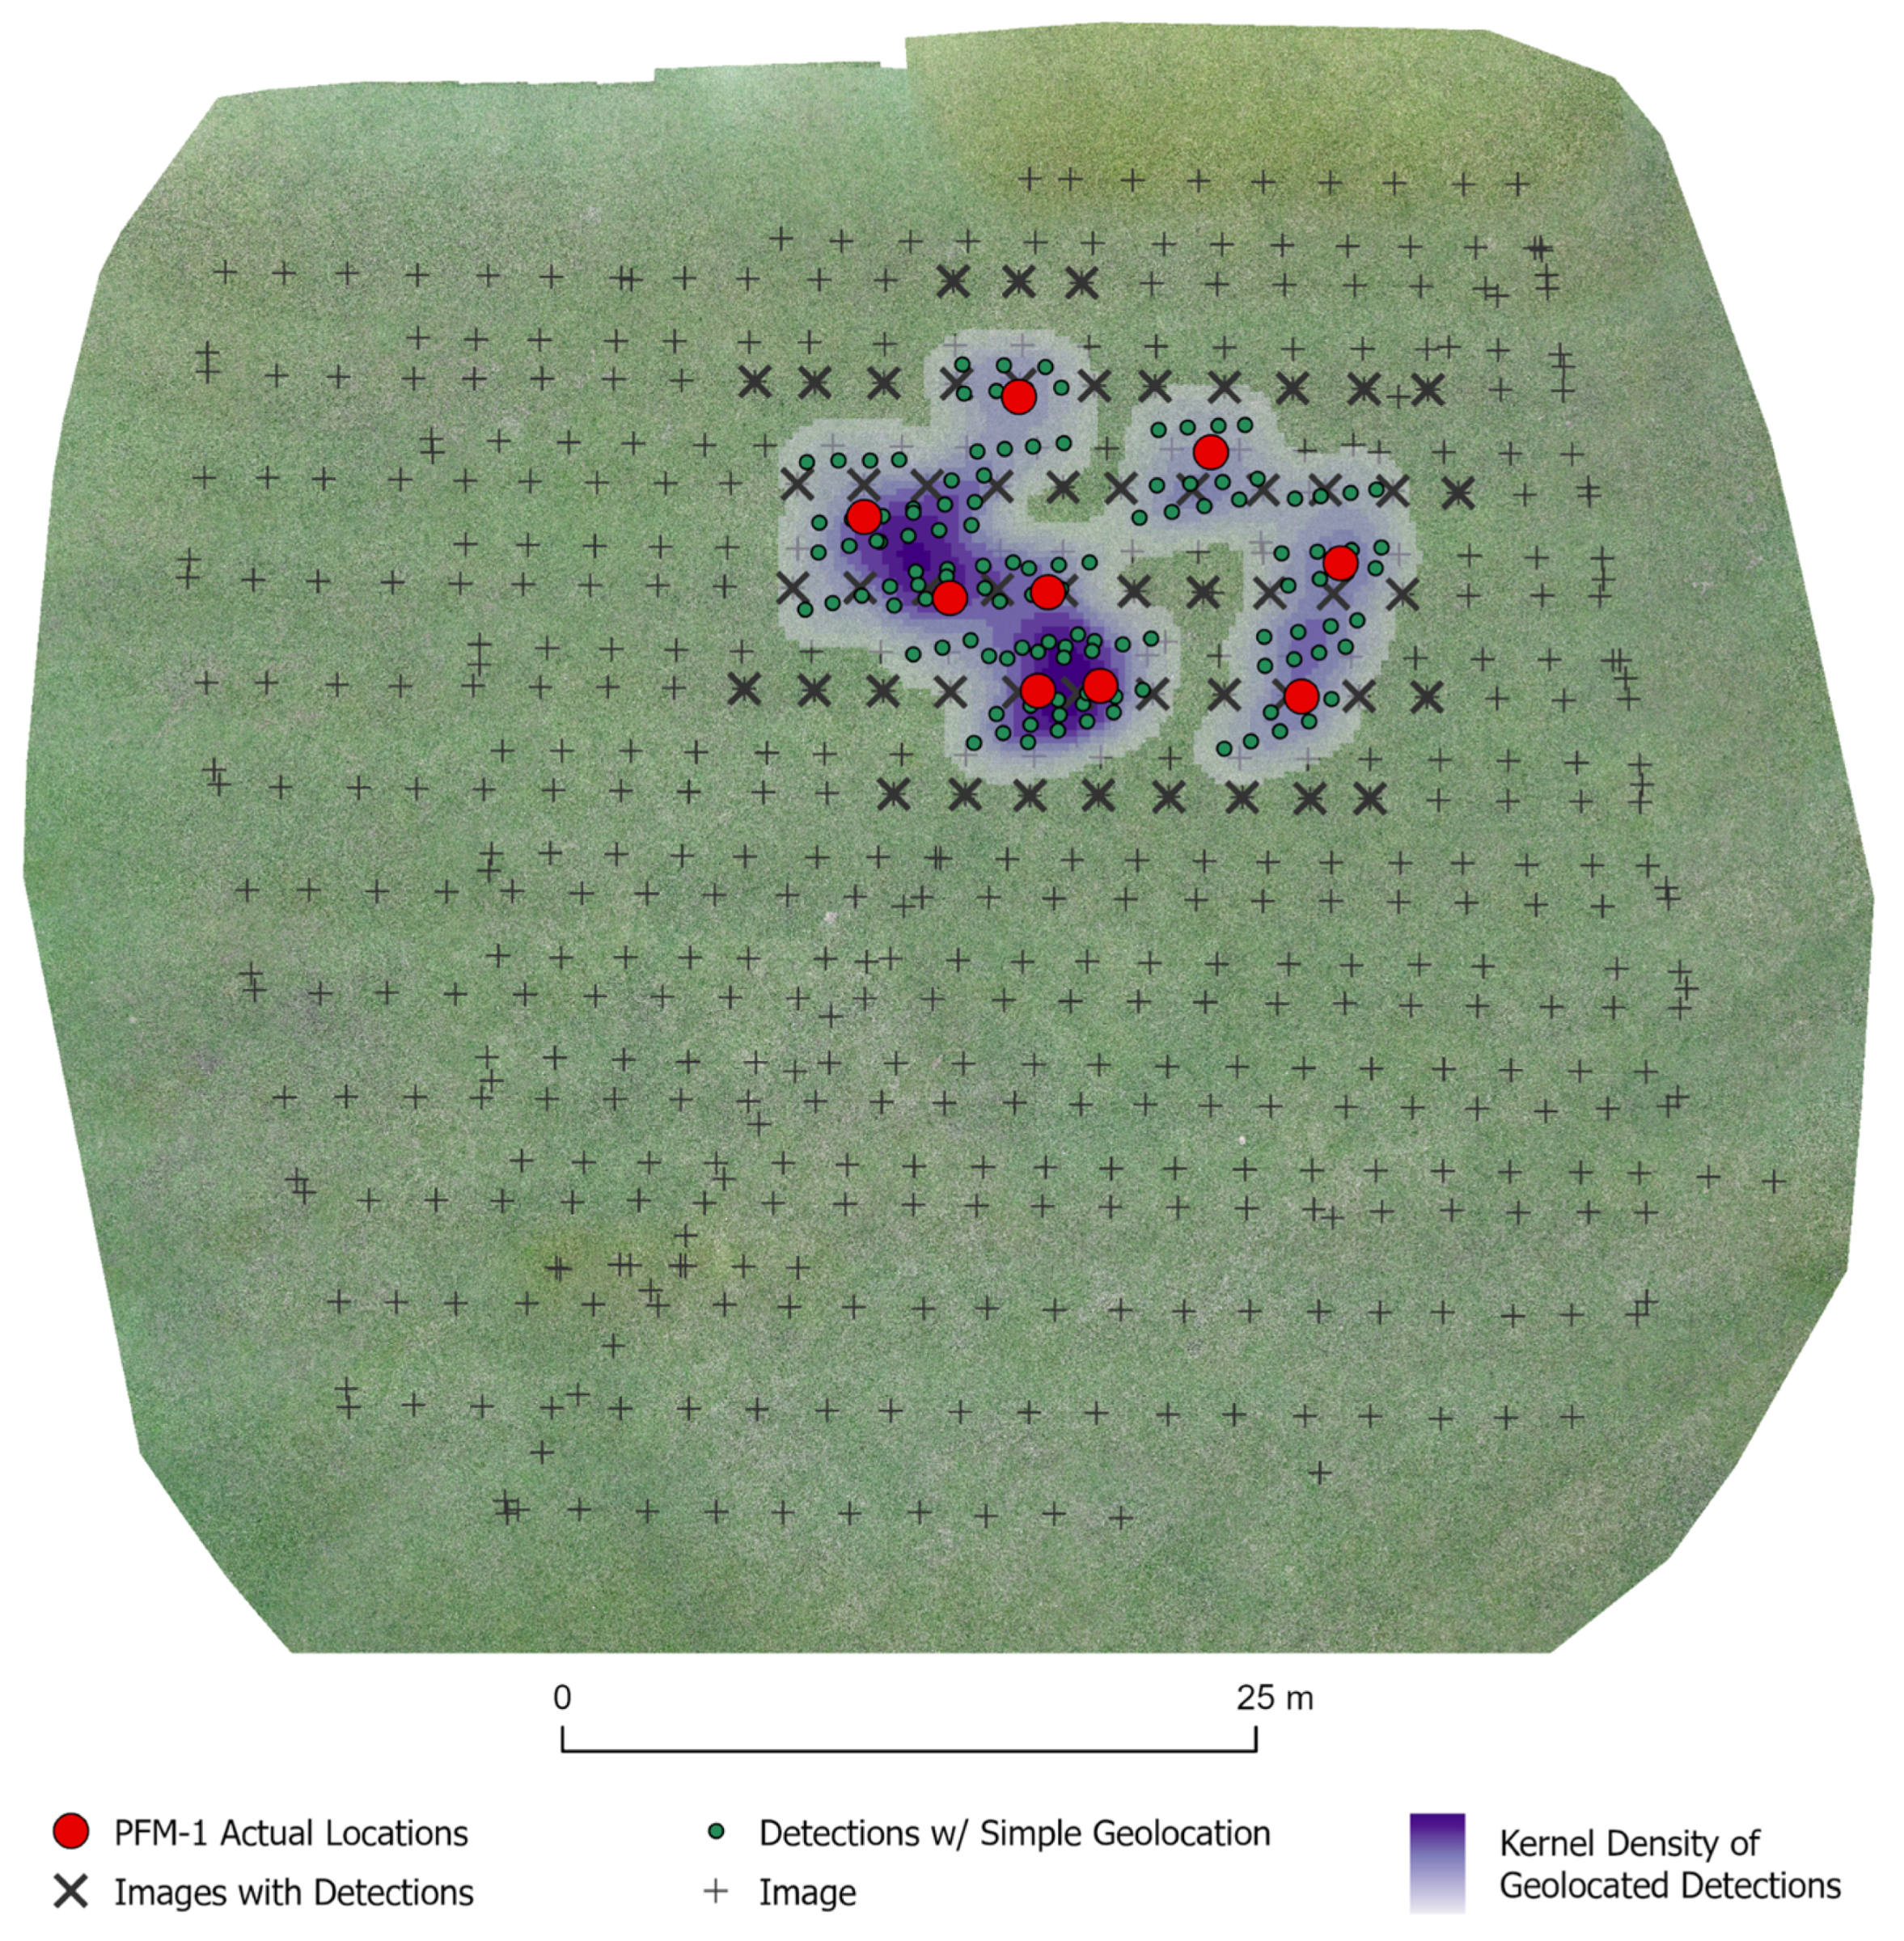
YOLO-based detections on images that are individually geotagged (i.e., including as metadata the 3D coordinates of the camera when the image was taken) can be mapped without the need for full 3D reconstruction. Detections are noted in output JSON files as well as sidecar text files that mark the center of the detection and a bounding box for each image. At a coarse level, the geographic coordinates of every image with a detection can be extracted with simple scripting or with GIS-based tools, such as the GeoTagged Photos to Points tool in ArcGIS Pro version 3.6. This provides the approximate center point of nadir imagery, and displacement of the detection from that center point (i.e., expected error) is directly proportional to the height above ground of the UAV. Further refinement of position estimates can be made using heading/yaw, exact height above ground, and FOV data that are often encoded in each image’s metadata directly or are easily determined. With this ancillary data, one can apply simple trigonometric relationships to map the detections, and kernel density techniques can be used to highlight likely areas, as shown in Figure 10. In our case, a drone altitude of 10 m AGL produced a mean nearest-target error of 2.93 m (SD = 1.60, max = 7.59) for the geolocated image center approach, where error was defined as the distance from each detection to the nearest true target. When the ancillary information (yaw, height, and FOV data) was incorporated into the estimate, the error dropped to a mean of 1.75 m (SD = 0.78, max = 4.00). The maximum error decreased from approximately 8 m to 4 m with the inclusion of ancillary data. All true targets fell within the convex hulls of detections produced by both approaches, indicating complete spatial coverage, though with differing levels of spatial precision. Both approaches provide operationally useful locations for follow-up mine removal. If further metadata (pitch, roll) of the camera were to be used, the error could be modestly improved, but since most UAV camera systems are now gimbal mounted and mechanically compensate for the pitch and roll of the aircraft, error reduction is limited.

4. Discussion

This method used a YOLO CNN to detect PFM-1 landmines in standard RGB imagery collected from various UAVs and smartphones. The more common SfM–orthoimagery approach [9,10,25] was ruled out in favor of applying YOLO to individual images [36], given that they retained more detail that could be used to improve detection.
The YOLO model had two variants: one trained on a custom dataset of RGB imagery of one inert PFM-1 mine captured in a variety of lighting and environmental conditions with a variety of sensors, and another model trained and tested using the same custom RGB dataset in addition to the COCO dataset.
Compared to the findings of Vivoli et al. [36], the results from this study reveal key differences in how model performance should be assessed for real-world application. Vivoli et al. reported strong model performance based on test data drawn from the same Italy dataset used for training. While Vivoli et al. trained and tested their model on imagery from Italy and mentioned testing on OOS from the USA dataset, no formal performance metrics were reported for the USA imagery. As a result, their reported metrics likely benefited from the correlation inherent in their dataset, as sequentially collected images appear visually homogeneous. This leads to inflated performance metrics and poor generalization in operational settings.
This study intentionally assessed model performance on a true OOS dataset of an inert PFM-1 mine and 3D-printed replicas that were not used in training. The results show a critical performance drop when moving from validation/testing to OOS evaluation, particularly in recall. This discrepancy highlights a fundamental limitation in existing mine detection models: rigorous model testing on OOS datasets should be an industry standard. Without true OOS testing, models may appear field-ready, but fail in deployment scenarios characterized by unseen backgrounds, lighting changes, or object variation. This study includes explicit OOS performance variation and underscores the need to adopt OOS testing to establish confidence in the model’s suitability for field deployment. A major operational advantage of this workflow is that YOLO-based detection can be performed in near real time on modern GPUs or suitable edge devices, enabling in-field processing and interpretation without substantial reliance on internet connectivity or cloud-based processing. While precise end-to-end time savings remain difficult to quantify at this proof-of-concept stage, recent operational evidence from Norwegian People’s Aid using SpotlightAI, a pioneering orthomosaic-based AI-assisted drone survey system, demonstrated substantial improvements in non-technical survey efficiency, including faster survey speed, increased confirmed hazardous area identification, and greater item-detection rates [48]. These findings suggest that AI-assisted remote sensing workflows, including the individual image-based approach presented here, have a lot of potential to significantly improve the speed, safety, and area reduction efficiency of future humanitarian surveys.
When tested on 3D-printed replicas of PFM-1 mines, the model’s recall dropped while precision remained high. This may be due to slight variations in paint-matching the 3D prints, such as improperly painting the metallic central cylinder encircled with a white band, as indicated by the inert mine in Figure 5. Another variable could be the presence of the Cyrillic “Y” on the wing of the inert mine. This could introduce a contrast feature that may produce bias in the model’s training, highlighting the importance of assessing texture in training datasets to prevent unintended overfitting to specific features. This can be further tested using additional augmentation to the data and further manipulation with the use of synthetic training data as well as comparative texture analysis of the inert and 3D-printed replica of the PFM-1 [49,50]. This will provide insight into the effects of occlusion as landmines continue to get buried as the environment and landscapes change over time. Additionally, the 3D-printed replicas have a homogenous surface, which may not perfectly mimic the color and texture of the inert PFM-1 mine, which in turn may impact the model’s ability to generalize. These results mirror the limitations noted by [25], who emphasized the need to train on a variety of mine representations to ensure robustness. Using 3D-printed replicas of the inert PFM-1 mine lays the groundwork for safely conducting imagery collections that may not have otherwise been possible due to the inherent risks and restrictions of working with live landmines. This approach enables controlled testing across varied environments and offers a replicable method for future research.
Another notable component was the method of mapping detections, in which the x, y coordinate of the geotagged image was used as an approximation of the object’s location, or the simple projection method, in which the image coordinates of the detection were effectively projected onto the ground using only yaw/heading, FOV, and altitude over ground information from image metadata, or calculated from known sources and track information. These have the advantage of completely obviating the need for 3D reconstruction and facilitate in-the-field post-analysis, achievable with some simple scripting on the collected imagery. Since YOLO-based detection (as opposed to training) is relatively computationally inexpensive, this pipeline of off-the-shelf UAVs and very modest computational requirements means that the detection of landmines such as the PFM-1 could be more easily undertaken and therefore much more widespread. Ultimately, this study demonstrates the feasibility and limitations of low-cost UAV-based detection systems and how RGB-based deep learning workflows can assist demining personnel. This suggests that when cost and accessibility are critical constraints, optical imagery combined with CNN-based object detection may offer the best performance-to-cost ratio—especially in the early stages of survey and area reduction.
However, significant challenges remain. Model performance was tested under relatively ideal conditions, and future work must validate results across more complex terrains (e.g., urban rubble, dense vegetation), varied lighting, and occlusion scenarios. Partial occlusion from vegetation, snow, debris, or soil cover represents a major challenge for UAV-based optical detection systems in operational environments. Recent work by Baur et al. quantitatively demonstrated that vegetation-driven occlusion can substantially reduce recall, as the visible target area decreases, emphasizing the importance of explicitly modeling occlusion in UAV-based landmine detection frameworks [51]. While the present study focused on baseline detection performance and out-of-sample validation under comparatively favorable conditions, future research should systematically incorporate partial occlusion scenarios and vegetation uncertainty modeling to better assess operational readiness. Additionally, expanding to other mine types or plastic debris and exploring ensemble model architectures (such as hybrid CNN-transformers) could further improve our understanding of how AI-assisted mine detection performs across diverse scenarios, and contribute to more efficient clearance operations. This study could benefit from controlled ablation experiments to fine-tune model parameters and understand the contributions of individual components. The authors did include OOS testing, comparing 3D-printed replica detection with inert PFM-1 detection, while expanded investigation of the effect of the Cyrillic “Y” and texture and color analysis would further strengthen this method as a first-pass in non-technical surveys. Furthermore, geolocalization mapping results indicated that using imagery metadata can aid in enhancing minefield resolution. These improvements, alongside expanded field testing, will be essential for translating this approach from research to real-world deployment [52,53]. This study represents an initial proof-of-concept evaluation of UAV-based optical deep learning for scatterable landmine detection and is not intended to function as a standalone technical survey or clearance system under current IMAS performance requirements. Rather, the long-term operational objective is integration into the non-technical survey (NTS) phase of the IMAS land release framework, where such a system could support early-stage reconnaissance, reduce the extent of suspected hazardous areas, and improve the prioritization of follow-up technical survey and clearance resources.

5. Conclusions

This research addressed the critical challenge of the rapid detection of surface-laid PFM-1 mines via a low-cost, scalable operation. Two customized object detection YOLO models, when compared to similar prior work, revealed the limitations of current evaluation practices and the importance of true out-of-sample evaluation, with recall dropping between 60–80% when compared to the testing results from each model run. The pretrained model, with a total of 81 classes, exhibited greater performance metrics across unseen environments by 10% compared to the PFM-1 mine-specific YOLO model. Although no formal statistical analysis was carried out, we proceeded with the assumption that using multiview or single-frame images reduced the computational costs compared to orthomosaics. These findings establish practical performance benchmarks and support a shift towards more realistic evaluation standards within the demining community, as they offer a practical path forward in regions where conventional detection tools are inaccessible. Given the mass deployment of PFM-1 mines, successfully detecting a single mine strongly suggests the potential for identifying other surface-level mines nearby.

Author Contributions

Conceptualization, S.K., T.J.P. and A.N.; methodology, S.K. and T.J.P.; software, S.K. and T.J.P.; validation, S.K. and T.J.P.; formal analysis, S.K. and T.J.P.; investigation, S.K. and T.J.P.; resources, A.N. and T.J.P.; data curation, T.J.P. and S.K.; writing—original draft preparation, S.K., T.J.P. and A.N.; writing—review and editing, S.K., T.J.P. and A.N.; visualization, S.K. and T.J.P.; supervision, T.J.P. and A.N.; project administration, S.K.; funding acquisition, S.K., A.N. and T.J.P. All authors have read and agreed to the published version of the manuscript.

Funding

This research received no external funding.

Data Availability Statement

Files can be downloaded and 3D-printed PFM-1 landmine replicas can be found under the user SharifaK1 in Thingiverse https://www.thingiverse.com/thing:7040404 (accessed on 24 April 2025). GitHub 3.16 repository contains the clone and LabelImg tool https://github.com/HumanSignal/labelImg (accessed on 4 January 2025).

Acknowledgments

We would like to express our thanks to John Swierk, Kelli Mosemand, and Anju Sharma for their assistance at Binghamton University’s ITC. Our gratitude extends to Binghamton University’s Near Earth Imaging Lab for their support in data collection and 3D-printing. Thank you to Gianna Mango for her expertise and advice for 3D renderings.

Conflicts of Interest

The authors declare no conflicts of interest.

Abbreviations

The following abbreviations are used in this manuscript:
CHAConfirmed Hazardous Area
COCOC2PSACommon Objects in Context Cross Stage Partial with Spatial Attention
HMAHumanitarian Mine Action
HSIHyperspectral Imaging
CNNConvolutional Neural Network
EMIElectromagnetic induction
EOExplosive Ordnance
ERWExplosive Remnants of War
ETSEmerging Technology Studio
FOVField Of View
GPRGround Penetrating Radar
IEDImprovised Explosive Device
IMASInternational Mine Action Standards
ITCInnovation Technologies Complex
mAPmean Average Precision
MPMegapixel
NTSNon-Technical Survey
OOSOut Of Sample
SARSynthetic Aperture Radar
SfMStructure from Motion
SHASuspected Hazardous Area
TSTechnical Survey
UAVUncrewed Aerial Vehicle
UXOUnexploded Ordnance
YOLOYou Only Look Once

References

  1. Landmine Monitor Report 2023. Available online: https://www.the-monitor.org/reports/landmine-monitor (accessed on 15 November 2024).
  2. Frost, A.; Boyle, P.; Autier, P.; King, C.; Zwijnenburg, W.; Hewitson, D.; Sullivan, R. The effect of explosive remnants of war on global public health: A systematic mixed-studies review using narrative synthesis. Lancet Public Health 2017, 2, e286–e296. [Google Scholar] [CrossRef] [PubMed]
  3. Lima, D.R.S.; Bezerra, M.L.S.; Neves, E.B.; Moreira, F.R. Impact of ammunition and military explosives on human health and the environment. Rev. Environ. Health 2011, 26, 101–110. [Google Scholar] [CrossRef] [PubMed]
  4. Dathan, J. The Environmental Consequences of Explosive Weapon Use: UXO. Available online: https://aoav.org.uk/2020/the-environmental-consequences-of-explosive-weapon-use-uxo/ (accessed on 11 April 2025).
  5. Landmine Monitor Report 2024. Available online: https://www.the-monitor.org/reports/landmine-monitor-2024 (accessed on 11 April 2025).
  6. Williams, T.; Dawson-Howe, K. Automated Force Sensed Probing for Buried Landmine Detection; Technical Report; Department of Computer Science, Trinity College: Dublin, Ireland, 1997; Available online: http://www.cs.tcd.ie/kdawson/xyrep.ps.gz (accessed on 18 December 2024).
  7. Schoon, A.; Heiman, M.; Bach, H.; Berntsen, T.G.; Fast, C.D. Validation of technical survey dogs in Cambodian mine fields. Appl. Anim. Behav. Sci. 2022, 251, 105638. [Google Scholar] [CrossRef]
  8. Madavha, L.; Laseinde, T.; Daniyan, I.; Mpofu, K. Functional design and performance evaluation of a metal handheld detector for land mines detection. Procedia CIRP 2020, 91, 696–703. [Google Scholar] [CrossRef]
  9. Baur, J.; Steinberg, G.; Nikulin, A.; Chiu, K.; De Smet, T.S. Applying deep learning to automate UAV-based detection of scatterable landmines. Remote Sens. 2020, 12, 859. [Google Scholar] [CrossRef]
  10. Nikulin, A.; De Smet, T.S.; Baur, J.; Frazer, W.D.; Abramowitz, J.C. Detection and identification of remnant PFM-1 “butterfly mines” with a UAV-based thermal-imaging protocol. Remote Sens. 2018, 10, 1672. [Google Scholar] [CrossRef]
  11. Geneva International Centre for Humanitarian Demining. Explosive Ordnance Guide for Ukraine, 2nd ed.; Geneva International Centre for Humanitarian Demining: Geneva, Switzerland, 2022; Available online: https://www.gichd.org/publications-resources/publications/explosive-ordnance-guide-for-ukraine-second-edition/ (accessed on 11 November 2025).
  12. Strada, G. The horror of land mines. Sci. Am. 1996, 274, 40–45. [Google Scholar] [CrossRef]
  13. Lombardi, F.; Griffiths, H.D.; Balleri, A. Landmine internal structure detection from ground penetrating radar images. In Proceedings of the 2018 IEEE Radar Conference (RadarConf18), Oklahoma City, OK, USA, 23–27 April 2018; pp. 1201–1206. [Google Scholar]
  14. Ugarte-Goicuría, I.; Guerrero-Sevilla, D.; Carrasco-Garcia, P.; Carrasco-Garcia, J.; Gonzalez-Aguilera, D. Aerial drone magnetometry for the detection of subsurface unexploded ordnance (UXO) in the San Gregorio Experimental Site (Zaragoza, Spain). Drones 2026, 10, 88. [Google Scholar] [CrossRef]
  15. Filipi, J.; Stojnić, V.; Muštra, M.; Gillanders, R.N.; Jovanović, V.; Gajić, S.; Turnbull, G.A.; Babić, Z.; Kezić, N.; Risojević, V. Honeybee-based biohybrid system for landmine detection. Sci. Total Environ. 2022, 803, 150041. [Google Scholar] [CrossRef] [PubMed]
  16. Rodriguez, J.; Castiblanco, C.; Mondragon, I.; Colorado, J. Low-cost quadrotor applied for visual detection of landmine-like objects. In Proceedings of the International Conference on Unmanned Aircraft Systems (ICUAS), Orlando, FL, USA, 27–30 May 2014; pp. 83–88. [Google Scholar]
  17. Hutsul, T.; Khobzei, M.; Tkach, V.; Krulikovskyi, O.; Moisiuk, O.; Ivashko, V.; Samila, A. Review of approaches to the use of unmanned aerial vehicles, remote sensing and geographic information systems in humanitarian demining: Ukrainian case. Heliyon 2024, 10, e29142. [Google Scholar] [CrossRef]
  18. Başpınar, Ö.O.; Omuz, B.; Öncü, A. Detection of the altitude and on-the-ground objects using 77-GHz FMCW radar onboard small drones. Drones 2023, 7, 86. [Google Scholar] [CrossRef]
  19. Blonski, S.; Glasser, G.; Russell, J.; Ryan, R.; Terrie, G.; Zanoni, V. Synthesis of Multispectral Bands from Hyperspectral Data: Validation Based on Images Acquired by AVIRIS, Hyperion, ALI, and ETM+. Available online: https://aviris.jpl.nasa.gov/proceedings/workshops/02_docs/2002_Blonski_web.pdf (accessed on 8 November 2024).
  20. Khodor, M.; Makki, I.; Younes, R.; Bianchi, T.; Khoder, J.; Francis, C.; Zucchetti, M. Landmine detection in hyperspectral images based on pixel intensity. Remote Sens. Appl. Soc. Environ. 2021, 21, 100468. [Google Scholar] [CrossRef]
  21. Tuohy, M.; Baur, J.; Steinberg, G.; Pirro, J.; Mitchell, T.; Nikulin, A.; Frucci, J.; De Smet, T.S. Utilizing UAV-based hyperspectral imaging to detect surficial explosive ordnance. Lead. Edge 2023, 42, 98–102. [Google Scholar] [CrossRef]
  22. Li, S.; Jiao, J.; Wang, C. Research on the detection algorithm of camouflage scattered landmines in vegetation environment based on polarization spectral fusion. IEEE Geosci. Remote Sens. Lett. 2024, 21, 1–5. [Google Scholar] [CrossRef]
  23. Dreischuh, T.N.; Gurdev, L.L.; Stoyanov, D.V.; Protochristov, C.N.; Vankov, O.I. Application of a lidar-type gamma-ray tomography approach for detection and identification of buried plastic landmines. In Proceedings of the 14th International School on Quantum Electronics: Laser Physics and Applications, Sunny Beach, Bulgaria, 18–22 September 2006; pp. 485–489. [Google Scholar]
  24. Mienye, I.D.; Swart, T.G. A comprehensive review of deep learning: Architectures, recent advances, and applications. Information 2024, 15, 755. [Google Scholar] [CrossRef]
  25. Baur, J.; Steinberg, G.; Nikulin, A.; Chiu, K.; De Smet, T.S. How to implement drones and machine learning to reduce time, costs, and dangers associated with landmine detection. J. Conv. Weapons Destr. 2021, 25, 29. [Google Scholar]
  26. Wei, Q.; Dai, P.; Li, W.; Liu, B.; Wu, X. InfoCom: Kilobyte-Scale Communication-Efficient Collaborative Perception with Information Bottleneck. arXiv 2025. [Google Scholar] [CrossRef]
  27. Retallack, A.; Finlayson, G.; Ostendorf, B.; Lewis, M. Using deep learning to detect an indicator arid shrub in ultra-high-resolution UAV imagery. Ecol. Indic. 2022, 145, 109698. [Google Scholar] [CrossRef]
  28. Carani, S.; Pingel, T.J. Detection of tornado damage in forested regions via convolutional neural networks and uncrewed aerial system photogrammetry. Nat. Hazards 2023, 119, 143–166. [Google Scholar] [CrossRef]
  29. Lemus-Romani, J.; Rueda, E.J.; Becerra-Rozas, M.; Cabrera, C.; Liu, J.; Astorga, G. Optimization of UAV flight parameters for urban photogrammetric surveys: Balancing orthomosaic visual quality and operational efficiency. Drones 2025, 9, 753. [Google Scholar] [CrossRef]
  30. Ezzy, H.; Charter, M.; Bonfante, A.; Brook, A. How small object detection via machine learning and UAS-based remote-sensing imagery can support the achievement of SDG2: A case study of vole burrows. Remote Sens. 2021, 13, 3191. [Google Scholar] [CrossRef]
  31. Zheng, C.; Liu, T.; Abd-Elrahman, A.; Whitaker, V.M.; Wilkinson, B. Object detection from multi-view remote sensing images: A case study of fruit and flower detection and counting on a central Florida strawberry farm. Int. J. Appl. Earth Obs. Geoinf. 2023, 123, 103457. [Google Scholar] [CrossRef]
  32. Jaud, M.; Le Dantec, N.; Parker, K.; Lemon, K.; Lendre, S.; Delacourt, C.; Gomes, R.C. How to include crowd-sourced photogrammetry in a geohazard observatory—Case study of the Giant’s causeway coastal cliffs. Remote Sens. 2022, 14, 3243. [Google Scholar] [CrossRef]
  33. Hartmann, W.; Havlena, M.; Schindler, K. Towards complete, geo-referenced 3D models from crowd-sourced amateur images. ISPRS Ann. Photogramm. Remote Sens. Spat. Inf. Sci. 2016, III-3, 51–58. [Google Scholar] [CrossRef]
  34. Wilson, K.; Snavely, N. Network principles for SfM: Disambiguating repeated structures with local context. In Proceedings of the 2013 IEEE International Conference on Computer Vision, Sydney, Australia, 1–8 December 2013; IEEE: New York, NY, USA, 2013; pp. 513–520. [Google Scholar] [CrossRef]
  35. Redmon, J.; Divvala, S.; Girshick, R.; Farhadi, A. You Only Look Once: Unified, Real-Time Object Detection. arXiv 2015. [Google Scholar] [CrossRef]
  36. Vivoli, E.; Bertini, M.; Capineri, L. Deep learning-based real-time detection of surface landmines using optical imaging. Remote Sens. 2024, 16, 677. [Google Scholar] [CrossRef]
  37. Saprykin, I. Optical deep learning landmine detection based on limited dataset of aerial imagery. Sci.-Based Technol. 2024, 62, 107–115. [Google Scholar] [CrossRef]
  38. Kunichik, O.; Tereshchenko, V. Determining the effectiveness of using three-dimensional printing to train computer vision systems for landmine detection. East.-Eur. J. Enterp. Technol. 2024, 131, 17. [Google Scholar] [CrossRef]
  39. International Mine Action Standards. Occupational Health and Safety—General Requirements. Available online: https://www.mineactionstandards.org/standards/10-10/ (accessed on 9 April 2025).
  40. International Mine Action Standards. Technical Survey. Available online: https://www.mineactionstandards.org/standards/08-20/ (accessed on 20 April 2025).
  41. International Mine Action Standards. Non-Technical Survey. Available online: https://www.mineactionstandards.org/standards/08-10/ (accessed on 13 May 2025).
  42. Jegham, N.; Koh, C.Y.; Abdelatti, M.; Hendawi, A. YOLO Evolution: A Comprehensive Benchmark and Architectural Review of YOLOv12, YOLO11, and Their Previous Versions. arXiv 2025. [Google Scholar] [CrossRef]
  43. Lin, T.T. LabelImg (GitHub Repository). Available online: https://github.com/HumanSignal/labelImg (accessed on 4 January 2025).
  44. PFM-1 Antipersonnel Landmine Model. Available online: https://www.printables.com/model/888145-pfm-1-antipersonnel-landmine (accessed on 22 November 2025).
  45. EinScan-SP Higher Accuracy Desktop 3D Scanner. Available online: https://www.einscan.com/einscan-sp/ (accessed on 7 May 2025).
  46. Thingiverse. PFM-1 Landmine Model by SharifaK1. Available online: https://www.thingiverse.com/thing:7040404 (accessed on 11 April 2025).
  47. Variable Inc. Color Muse 2 Support: FAQs, Tutorials, and Resources. Available online: https://variableinc.com/support/color-muse-2-support/ (accessed on 21 April 2025).
  48. Htut, K.L. Quantifying the Impact of AI-Augmented UAS-Based Item Identification for NTS. In Proceedings of the GICHD Innovation Conference 2025, Luxembourg, 29 October 2025; Norwegian People’s Aid: Oslo, Norway, 2025. [Google Scholar]
  49. Dwibedi, D.; Misra, I.; Hebert, M. Cut, paste and learn: Surprisingly easy synthesis for instance detection. In Proceedings of the IEEE International Conference on Computer Vision (ICCV), Venice, Italy, 22–29 October 2017. [Google Scholar]
  50. Rajotte, J.-F.; Bergen, R.; Buckeridge, D.L.; El Emam, K.; Ng, R.; Strome, E. Synthetic data as an enabler for machine learning applications in medicine. iScience 2022, 25, 105331. [Google Scholar] [CrossRef]
  51. Baur, J.; Dewey, K.; Steinberg, G.; Nitsche, F.O. Modeling the effect of vegetation coverage on unmanned aerial vehicles-based object detection: A study in the minefield environment. Remote Sens. 2024, 16, 2046. [Google Scholar] [CrossRef]
  52. Liang, S.; Wu, H. Edge YOLO: Real-time intelligent object detection system based on edge-cloud cooperation in autonomous vehicles. IEEE Trans. Intell. Transp. Syst. 2022, 23, 25345–25360. [Google Scholar] [CrossRef]
  53. Karwandyar, S. A Dual Approach to Remote PFM-1 Landmine Detection: Spectral Imaging and Deep Learning in the Optical Domain. Master’s Thesis, State University of New York at Binghamton, Binghamton, NY, USA, 2025. Available online: https://www.proquest.com/openview/ba7e372c0502ddb86fe096c9b74db4d9/1?pq-origsite=gscholar&cbl=18750&diss=y (accessed on 11 May 2026).
Figure 1. The PFM-1 mine, commonly known as the butterfly mine, is designed to mimic the descent of a maple seed. Inert PFM-1 mines are used to train demining personnel and are carved with a Cyrillic “Y” in the wing. The general dimensions of a PFM-1 mine are as follows: 4.7 in width, 2.4 in height.
Geomatics 06 00054 g001
Figure 2. Comparison of original photos (a,c) with matched SfM-generated orthophoto equivalents for PFM-1 (b,d) from their respective sensors. Photos were taken at 10 m using a Parrot Sequoia, manufactured by Parrot Sequoia SAS based in Paris, France, (7.6 mm, 16 MP sensor) and Autel EVO II V3, manufactured by Autel Robotics Co., Ltd. in Shenzhen, China,(15.8 mm, 20 MP sensor). Orthoimages show blurriness and doubling (b) and lower resolution (d).
Geomatics 06 00054 g002
Figure 3. 3D X-Ray of inert PFM-1 mine.
Geomatics 06 00054 g003
Figure 4. A sample of images captured on Binghamton University’s campus using a variety of camera sources, including GoPro, iPhone 14, DJI Mavic 3T, and Autel Evo II, and in different environmental conditions.
Geomatics 06 00054 g004
Figure 5. Flowchart for the proposed method. Eliminating the need for generating orthomosaics allows for a variety of data inputs into the model without the computational cost.
Geomatics 06 00054 g005
Figure 6. (a) Comparison of inert PFM-1 mine (above) and 3D-printed replica (below); (b) inert mine in the field; (c) 3D-printed replica in the field.
Geomatics 06 00054 g006
Figure 7. Results of precision–recall curve average (royal blue line) from the model trained only on PFM-1 mines (left), and a model trained on PFM1 + COCO dataset (right).
Geomatics 06 00054 g007
Figure 8. OOS testing was conducted using both the inert mine and 3D-printed mine using the COCO + PFM-1 model. The image on the (left) is the labeled object in each scene and on the (right) is the model’s predicted location of the mine, with confidence intervals displayed in blue.
Geomatics 06 00054 g008
Figure 9. The image on the (left) shows labeled images of printed PFM-1 and the (right) image displays the model’s confidence in detecting the mine in each image using the PFM-1 mine model. Images on the (left) are labeled objects the model is attempting to detect. Blue labels on the images to the (right) indicate the model’s confidence in correctly detecting PFM-1 mines.
Geomatics 06 00054 g009
Figure 10. Map of YOLO-based detections from a single OOS data collection using an Autel EVO II Pro V3. The geotagged locations of individual images with detections (“X”) successfully located the small minefields within an area of collection of ~7.59 m, and the use of additional image metadata (yaw/heading, field of view, altitude over ground), when combined with YOLO, produced points of detection within the images, further enhancing the resolution of the minefield.
Geomatics 06 00054 g010
Table 1. Data collected at Binghamton University’s campus using an inert PFM-1 mine for training YOLO 11x object detection model.
LocationsBare GroundGravelLight SnowShort GrassPlant Matter
Fuller Hollow CreekXX
Lot T1 X XX
College in the WoodsXX X
Nature PreserveX XXX
Table 2. Model output results corresponding to each specific model.
Model PrecisionRecallF1mAP50
PFM-1 + COCOTraining0.720.650.680.70
Validation0.780.760.770.75
Testing0.940.850.890.90
OOS0.800.140.240.17
PFM-1Training0.950.920.930.96
Validation0.910.880.890.58
Testing0.570.930.710.57
OOS0.740.240.340.25
Disclaimer/Publisher’s Note: The statements, opinions and data contained in all publications are solely those of the individual author(s) and contributor(s) and not of MDPI and/or the editor(s). MDPI and/or the editor(s) disclaim responsibility for any injury to people or property resulting from any ideas, methods, instructions or products referred to in the content.